Embed Size (px)
Citation preview


Mission StatementThe goal of the Chemiphar Group is to make a difference in society by
providing pharmaceutical drugs and healthcare-related services to help
people become and remain healthy.
ContentsFY2011 in Review ………………………………2
Financial Highlights ……………………………3
Message from the President …………………4
Financial Focus …………………………………8
Generics Initiatives ………………………… 10
Initiatives for Uralyt ………………………… 12
New Drug Development…………………… 13
“Go Forward”
Medium-Term Management Plan ……… 14
Activities for Stakeholders ………………… 15
Directors, Statutory Auditors
and Corporate Officers ………………… 19
Consolidated Financial Section …………… 21
Consolidated Balance Sheets ………… 22
Consolidated Statements
of Income …………………………… 24
Consolidated Statements
of Comprehensive Income ……… 24
Consolidated Statements
of Changes in Net Assets ………… 25
Consolidated Statements
of Cash Flows ……………………… 26
Notes to Consolidated
Financial Statements ……………… 27
Corporate Date ……………………………… 49
Statements made in this annual report with respect to current plans, estimates, strategies and beliefs, and other statements of Chemiphar are forecasts about the future performance of Chemiphar. These forecasts are based on information currently available to management. Consequently, our forecasts are subject to known and unknown risks and uncertainties and may differ significantly from actual results. Items that may influence our forward-looking statements and forecasts include changes in the economy, business and competitive environment surrounding Chemiphar’s business, and revisions to the Pharmaceutical Affairs Law and other related legislation, etc., as well as other items not limited to the above.
Note about Forward-Looking Statements and Forecasts
Nippon Chemiphar Co., Ltd. | 1

FY2011 in Review
Looking at consolidated financial performance for FY2011, ended March 31, 2012, sales of generics
increased 9.6% YOY, mainly owing to higher sales of new products launched in recent years. In
addition, sales of “original design, manufacture” (ODM) generics was 2.4 times the previous year’s
level, resulting in an overall rise of 10.7% in sales in the generics business. Meanwhile, sales of core
products were down 6.5% YOY, in line with our initial expectations and owing to increasingly stringent
market competition.
As a result, net sales rose 4.2% YOY, to ¥28,514 million.
Substantial Rise in Income, Thanks to Improved Cost of Sales RatioWithin generics, profitability is particularly high on our original products, centered on products
launched in recent years. Owing to an increased percentage of these products, the cost of sales ratio
improved 2.4 percentage points, to 45.1%. The SG&A expense ratio also improved 0.6 percentage
point, to 44.6%. Consequently, income grew substantially: operating income amounted to ¥2,923
million (up 46.2% YOY), and net income came to ¥1,440 million, approximately 2.5 times the previous
year’s level.
Forecast Calls for Higher Net Sales and Income in FY2012In FY2012, we expect sales of generics to increase by more than 20%, resulting in net sales of ¥32,000
million, up 12.2% YOY. As a result, we anticipate operating income of ¥3,500 million (up 19.7% YOY)
and net income of ¥1,800 million (up 25.1% YOY).
Five-Year Financial Data
Net Sales Operating Income Net Income
19,000
21,000
23,000
25,000
27,000
29,000 28,514
27,361
23,982
22,308
20,918
0
3,000
2,000
1,000
1,170
581
767
1,999
2,923
0
1,500
2,500
500
1,500
750
0
390
168
271
573
1,440
1,000
1,250
500
250
Secured Increase in Net Sales, Due to Higher Sales of Generics
( ¥mn) ( ¥mn) ( ¥mn)
2007 2008 2009 2010 2011
(FY)
2007 2008 2009 2010 2011
(FY)
2007 2008 2009 2010 2011
(FY)
2 | Annual Report 2012

Financial Highlights
(¥mn)Fiscal Years 2007 2008 2009 2010 2011
For the year: Net sales 20,918 22,308 23,982 27,361 28,514
Operating income 1,170 581 767 1,999 2,923
Income before income taxes and minority interests 917 498 557 1,416 2,699
Net income 390 168 271 573 1,440
R&D expenses 1,317 1,427 1,722 1,879 1,790
Per share date: Net income (yen) 10.22 4.41 7.10 13.95 34.62
Net assets (yen) 181.99 179.55 185.22 212.92 248.92
Cash dividends (yen) 3 3 3 3 5
At year end: Total assets 21,764 24,697 29,601 30,786 33,791
Net assets 6,943 6,848 7,866 8,964 10,231
Shares outstanding (thousands) 38,522 38,522 38,522 42,614 42,614
Number of employees 591 624 714 711 682
Ratios: Operating income margin (%) 5.6 2.6 3.2 7.3 10.3
ROE (%) 5.7 2.4 3.9 7.2 15.0
Equity ratio (%) 31.9 27.7 23.9 29.1 30.3
R&D Expenses Capital Expenditure Composition of Shareholders(As of March 31, 2012)
1,3171,427
1,7221,879
1,790
1,116
889
681584
1,01419%
42%
5%32%
2%
Individuals and others
Foreign investors
Other Japanese companies
Financial instrument firms
Financial institutions
( ¥mn) ( ¥mn)
2007 2008 2009 2010 2011
(FY)
2007 2008 2009 2010 2011
(FY)
1,500
0
1,000
500
2,000 1,500
0
1,000
500
Nippon Chemiphar Co., Ltd. | 3
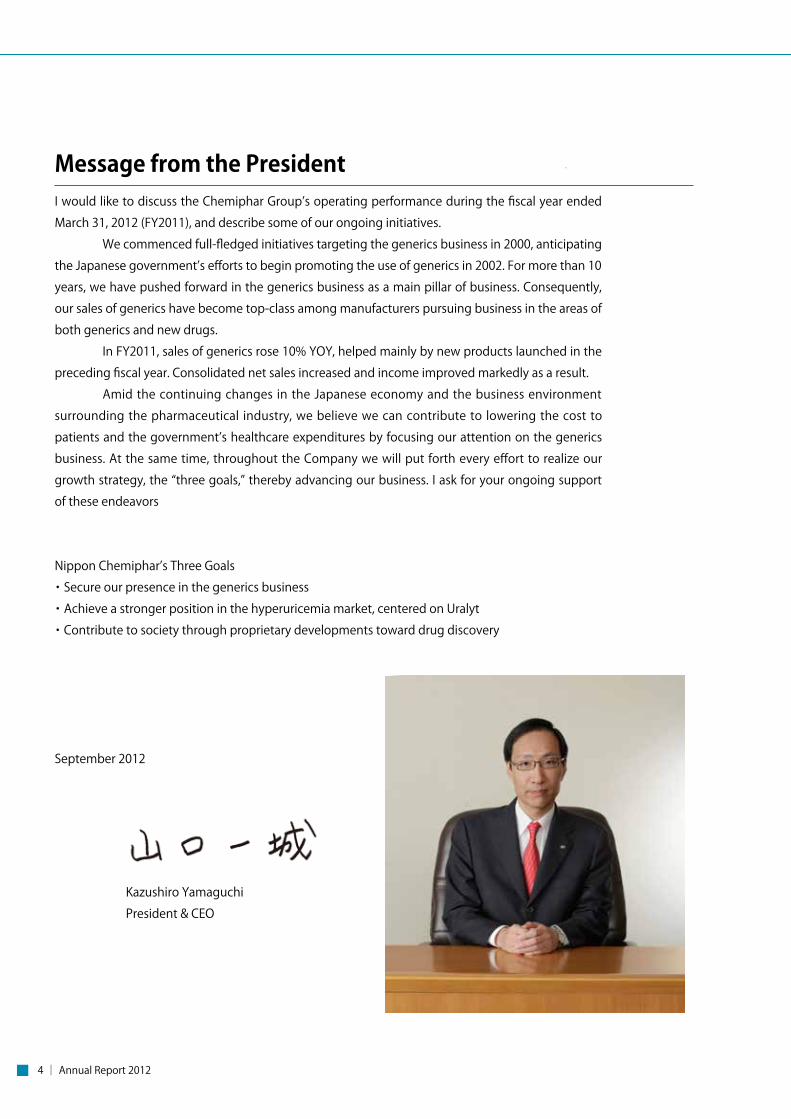
Message from the PresidentI would like to discuss the Chemiphar Group’s operating performance during the fiscal year ended
March 31, 2012 (FY2011), and describe some of our ongoing initiatives.
We commenced full-fledged initiatives targeting the generics business in 2000, anticipating
the Japanese government’s efforts to begin promoting the use of generics in 2002. For more than 10
years, we have pushed forward in the generics business as a main pillar of business. Consequently,
our sales of generics have become top-class among manufacturers pursuing business in the areas of
both generics and new drugs.
In FY2011, sales of generics rose 10% YOY, helped mainly by new products launched in the
preceding fiscal year. Consolidated net sales increased and income improved markedly as a result.
Amid the continuing changes in the Japanese economy and the business environment
surrounding the pharmaceutical industry, we believe we can contribute to lowering the cost to
patients and the government’s healthcare expenditures by focusing our attention on the generics
business. At the same time, throughout the Company we will put forth every effort to realize our
growth strategy, the “three goals,” thereby advancing our business. I ask for your ongoing support
of these endeavors
Nippon Chemiphar’s Three Goals
・Secure our presence in the generics business
・Achieve a stronger position in the hyperuricemia market, centered on Uralyt
・Contribute to society through proprietary developments toward drug discovery
September 2012
Kazushiro Yamaguchi
President & CEO
4 | Annual Report 2012

We began concentrating our management resources on reinforcing generics as a pillar of
business in 2000. As a result, our sales of generics have doubled over the past five years,
making up an increasing percentage of overall pharmaceuticals sales. In FY2012 we expect
this figure to exceed 80%. Compared with new drugs, the cost of sales ratio is high for
generics, and creating a business structure capable of generating profits through combined
sales of new drugs and generics has been one of our topmost management priorities.
We have both original products, which are generally more profitable, and those
purchased from other companies. Also, the percentage of original products within overall
generics sales is increasing. In FY2011, this percentage was approximately 50%; we expect
the ratio to rise to more than 60% within three years, by FY2014, which should boost our
profitability. This increase is the result of our prioritized efforts to reinforce the generics
supply chain, increasing the number of development personnel and concentrated our
Group production functions at a subsidiary. I believe that promoting these initiatives for
building up our own development and manufacturing system have been central to our
success.
Furthermore, three years ago we launched a thorough companywide effort to
promote the efficiency of SG&A expenses.
Going forward, we will continue working to reduce cost of sales and use SG&A
expenses efficiently, thereby improving profitability.
What are your thoughts on shareholder return measures?
Answer:
Question: 2
We endeavor to maximize our shareholder value.
On August 25, 2011, we started to acquire treasury stock with the aim of improving
capital efficiency and enhancing our return to shareholders. By November 25, we had
completed the acquisition of 1 million shares, our upper limit.
We also increased the dividend by ¥2 per share, from ¥3 to ¥5. We plan to raise
this level further in FY2012, to ¥8 per share.
Interview
What are some of your initiatives for securing profits as sales of generics rise?
Answer:
The president, Kazushiro Yamaguchi, explains the current and future business of
Chemiphar.
Question: 1
In generics, we have increased our percentage of original products, which are highly profitable.
Message from the President
Nippon Chemiphar Co., Ltd. | 5

Could you outline some of the measures in the announced medium-term management plan?
Answer:
In the generics business, which is our first priority, we intend to maintain the early-mover advantage
we gained as one of the first new drug manufacturers to enter this market. We will also introduce
competitive new major generics, into the market in a timely fashion, thereby building the
Chemiphar brand image of safety and security.
As for Uralyt and our hyperuricemia treatment, we are working to enhance and expand
therapeutic significance in such domains as lifestyle-related diseases (metabolic syndrome)
and chronic kidney disease. At the same time, we aim to successfully out-license NC-2500, a
hyperuricemic treatment that we developed.
Believing that drug research is an important source of our ability to generate corporate
value over the long term, we aim to find additional candidates for out-licensing next to NC-2500.
To accomplish this, we are striving to raise the efficiency of our research structure and accelerate its
activities. In addition, since growth in the domestic market is expected to slow, Chemiphar plans to
expand its business in Asia, where the pharma market is growing rapidly.
Our numeric goals for FY2014 are to achieve consolidated net sales of ¥40 billion or more,
and we aim for generics to account for ¥30 billion of this amount. We also plan to boost the Group
operating income margin to 15% or more, and to reinforce our earnings and financial base.
Question: 3
This is the first plan as part of our Long-Term Vision to create a unique business model by developing our three goals. We aim to enhance our earning power and financial strength and launch specific strategies for future growth.
In the near future, we plan to maintain a consolidated payout ratio of 20–30%, aiming for
30% or more on a nonconsolidated basis. We plan to continue putting forward shareholder returns
as a key management objective, in our bid to achieve sustained increases in corporate value and
ongoing dividend increases.
Message from the President
What areas of overseas business do you focus on?
Answer:
In the Japanese pharmaceutical industry generics market is expected to expand against the
backdrop of an aging population. Over the long term, however, the domestic market is likely shrink
because of a decreasing number of new large-scale generics and the shrinking Japanese population.
Question: 4
Through the business of exporting pharmaceuticals to China and ASEAN countries, we will accumulate expertise toward future overseas deployment and manufacturing.
6 | Annual Report 2012

Taking these factors into consideration, we are steadily preparing to make inroads
overseas. The Beijing Representative Office, which we opened in 2009, is cooperating with
local partners to support the development and sales of drugs to manufacturers. We expect
to continue expanding the number of products to manufacturers in China and ASEAN
countries to establish a base of business there. We are also considering the optimization
of our production on a global basis, and are looking into the possibility of expanding
consigned manufacturing and production bases there.
In the diagnostics business, in February 2012 we launched DiaPack3000, an allergy
diagnostic instrument for overseas markets. Beginning in Asia, we are rolling out this
product in other overseas markets.
Message from the President
Nippon Chemiphar Co., Ltd. | 7

Balance Sheets (As of March 31, 2012)As of March 31, 2012, total assets were up ¥3,005 million from the
end of the previous term. This was largely due to operating cash
flows and financing in response to the financial risks posed by the
Great East Japan Earthquake, raising cash and deposits ¥1,609
million. In addition, inventories increased ¥1,151 million, owing to a
temporary buildup in response to higher sales and system revisions.
Total liabilities rose ¥1,738 million, due mainly to an increase
in trade notes and accounts payable caused by revenue growth and
fund-raising.
Due to the posting of income, total net assets expanded
¥1,267 million, and our equity ratio exceeded 30%.
FY2010 FY2011 Change
Current assets 17,098 20,561 3,463
Net property, plant and equipment 10,054 10,143 89
Investments and others 3,634 3,087 (547)
Total assets 30,786 33,791 3,005
Current liabilities 12,036 12,871 835Non-current liabilities 9,786 10,689 903
Total liabilities 21,822 23,560 1,738
Capital stock 6,961 7,967 1,006
Accumulated other comprehensive income 1,998 2,257 259Subscription rights to shares 5 7 2
Total net assets 8,964 10,231 1,267
Total liabilities and net assets 30,786 33,791 3,005
( ¥mn)
Financial FocusGenerics Contribute to Sales ExpansionThe Japanese government’s promotion of the use of generics has
caused the market to expand. Accordingly, our sales of generics
continue to rise, making a major contribution to net sales growth.
Sales of Generics
FY2007 FY2008 FY2009 FY2010 FY2011
20,918
22,30823,982
27,36128,513
11,787
19,721
7.4%
21.8%
23.8%
9.6%▲
▲ ▲
▲
▲
21.8% 17,990
9,680
Change in Cost of Sales (Consolidated)Our cost of sales ratio improved 2.4 percentage points YOY, as we
increased the percentage of generics composed of highly profitable
original products.
Consolidated cost of sales ratio
Original product to generic sales ratio
FY2009 FY2010 FY2011
47.7 47.5 45.1
0
10
20
30
40
50
■■
■40.1
44.749.0
( ¥mn)
Consolidated salesGenerics sales (consolidated)
Generics sales (consolidated /YOY%)
14,528
( )
8 | Annual Report 2012

FY2009 FY2010 FY2011 FY2009 FY2010 FY2011 FY2009 FY2010 FY2011
10.00
0.00
20.00
30.00
40.00
7.10
13.95
34.62
15.00
7.2
3.9
15.00
12.00
9.00
6.00
3.00
0.00 0.00
2.00
4.00
6.00
8.00
10.00
2.2
6.0
8.6
Cash FlowsWhile we marked a drastic increase in profit, we boosted
our inventories temporarily. Net cash provided by
operating activities was ¥1,753 million.
Net cash used in investing activities amounted
to ¥227 million, mainly due to purchases of property,
plant and equipment.
As a result, free cash flow for the year was a
positive ¥1,526 million.
Principal Financial Indicators
FY2009 FY2010 FY2011
33,791
30,78629,601
FY2009 FY2010 FY2011 FY2009 FY2010 FY2011
9
10,231
8,964
7,866
23.9
29.1
30.3
Consolidated Forecasts for FY2012In FY2012, we anticipate net sales of ¥32,000 million (up 12.2% YOY), thanks to increased
sales of generics. Although we believe NHI price revisions will hold down income, we
expect gross profit to improve as a result of efforts to reduce our cost of sales ratio by
boosting our percentage of original products, as well as to continue enhancing our cost
management. Consequently, we forecast operating income of ¥3,500 million (up 19.7%
YOY) and net income of ¥1,800 million (up 25.1% YOY).
Financial Focus
( ¥mn) ( ¥mn)
( ¥)
Total Assets (Consolidated)
Net Assets (Consolidated) Equity Ratio
Earnings per Share ROE ROA
Cash Flows (Consolidated)
FY2010 FY2011
2,748
2,108
(640)
1,753
(227)
1,526
Main Cash Flow Items from Operations Amount
Net income before tax 2,698
Depreciation 747
Notes, accounts receivable (724)
Inventory (1,151)
Notes, accounts payable 746
Corporate tax (1,079)
( ¥mn)( ¥mn)
Cash flow from operationsCash flow from investmentsFree cash flow
(1,000)
0
1,000
2,000
3,000
Nippon Chemiphar Co., Ltd. | 9

Generics InitiativesGenerics Performance in FY2011
Although the impact of measures to promote the use of generics began to fade from April 2011,
sales of generics amounted to ¥19,721 million (up 9.6% YOY), pushed up mainly by new products
launched in recent years.
New Product LaunchesIn the fiscal year under review we launched a total of 12 new products, reinforcing our overall
product lineup.
Generic Name Item Therapeutic Category
Edaravone 2 Free oxigen radical scavenger
Mesalazine 1 Agent for ulcerative colitis and Crohn's disease
Sodium Resedronate 1 Agent for osteoporsis
Donepezil HydrochlorideDonepezil Hydrochloride OD*
22 Agent for Alzheimer's disease
LoratadineLoratadine OD
11 Agent for allergic disease
Sulbactam SodiumAmpicillin Sodium 1 Antibiotic and antimicrobial agents
Alendronate Sodium 1 Agent for osteoporosis
Products Launched in FY2011
Sales at Dispensing Pharmacies
Breakdown of Sales
YOY Distrib.
Hospitals +7.5% 40%
Clinics +10.1% 60%
Total +9.1% 100.0%
Sales on Prescription Base
36.9 63.1 100.0
140.4159.7+40.4%
+13.8%
61.2%58.7%
49.7%
FY2009 FY2010 FY2011
Sales of Generics to Hospitals
Non-DPC hospitals
DPC hospitals
YOYYOY
FY2009 sales=100%
Generics to total sales
Sales to DPC hospitalsUp 8.0% YOY
10 | Annual Report 2012

Initiatives Targeting Dispensing Pharmacies
Pharmacy Digest, an informational monthly
Initiatives Targeting Safety and Security
Encourage pharmacy chains to promote Chemiphar drugsEnhance relationships with wholesalers
Use information tools•Provide information on a regular basis through Pharmacy Digest• Website (content targeting pharmacists)
Strengthen customer support function•Respond swiftly to pharmacist inquiries with high-quality information
・Manufacturing Control and Quality Control
In making every effort to ensure manufacturing and quality control are properly carried out, we
create procedure notes of management surveys in accordance with Good Manufacturing Practice
and Good Quality Practice. Raw material procurement and storage, and product storage and
transportation are conducted under ISO rating manual verification procedures, as we strive to
supply quality drugs under proper management.
・Pursuing Convenience
When developing generics, we determine the needs of various medical
personnel and work to design products accordingly. We plan to continue
such initiatives that make medicines easier to use.
Press-Through PackagingIn addition to being an early adopter of universal design fonts, we have
designed press-through packaging sheets using a matte material to
make information easier to see.
Exterior Boxes
We print all information in a concentrated area on the top of product
cartons. This location allows pharmacies to see at a glance all
relevant data—such as product name, lot number and expiry date—
facilitating storage of numerous small packages.
Exterior boxes
Press-through packaging
Nippon Chemiphar Co., Ltd. | 11

Initiatives for Uralyt
New Initiatives to Increase the Market for UralytIn addition to the above-mentioned activities in the hyperuricemia domain, we continued
to promote awareness about the treatment of urinary alkalinization. At the Hyperuricemia
Metabolic Syndrome Research Forum, which we are co-hosting, attention has focused on
the connection between acid urine and lifestyle-related diseases, and in recent years a
significant number of reports on acid urine have been published.
Of these, Chemiphar is concentrating in particular on chronic kidney disease (CKD)
and dysbolism caused by metabolic syndrome, and we are looking into a report suggesting
new urinary alkalinization treatment methods for these diseases.
Partnering with people outside the Company, we are working to broadly
disseminate information on the therapeutic significance of hyperuricemia. Simultaneously,
we are gathering data and promoting awareness of new possibilities for the treatment of
urinary alkalinization in an effort to further expand Uralyt’s potential.
Efforts to Expand the Hyperuricemic MarketRecent years have seen a growing focus on the link between hyperuricemia and
cardiovascular events. Furthermore, in May 2011 another company launched the first
new hyperuricemic treatment in 40 years, generating expectations of growth in the
hyperuricemia market. We have seized this opportunity to promote a better understanding
of clinical conditions and guideline-based diagnosis and treatment.
Website-Based Awareness ActivitiesSince April 2010 we have operated a website providing comprehensive information related
to hyperuricemia and gout. Patients can use the “gout navi” section of the site to gain a
basic understanding of this clinical condition and learn how to treat or prevent the condition
through diet. For medical personnel, “Uralyt.jp” provides information that may prove helpful
for medical examinations, such as treatment guidelines and sample prescriptions by Dr.
Tatsuo Hosoya, Professor at Jikei University and President of the Japanese Society of Gout
and Nucleic Acid Metabolism.
27
Hyperuricemia leads to metabolic syndrome
6-4. Strategies: Uralyt, R&D (2)
Hyperuricemia
12.8 million patients
To prevent complications, control urinary tract conditions
Metabolic Syndrome CKD
NC-2500
■ Expanding Hyperuricemia/Uralyt Markets (Targets)
Each year, in Japan: There are 13.3 mn patients 0.3 mn people need dialysis
control urinary tract conditions
Uralyt recommended Acidosis
Urinary calculosis
Prevent chronic kidney disease by curbing convoluted tubule disorders
metabolic syndrome
Hyperuricemia
12.8 milli
To prevent complications,
Improve dysbolism caused by metabolic syndrome
12 | Annual Report 2012

New Drug DevelopmentChemiphar’s drug research focuses on discovery. To bring discovered compounds to market as
quickly as possible, we employ a venture-type research system that involves out-licensing at an
early stage to highly specialized companies in Japan and overseas.
We currently out-license one product to an overseas company, and we are developing NC-
2500 as a candidate compound for out-licensing. We have high hopes for research into NC-2500 as
a treatment for hyperuricemia, one of Chemiphar’s three goals.
*Phase 1 was started in FY2012.
About NC-2500
This candidate inhibits the enzyme xanthine oxidoreducase and prevents the production of uric acid. It is expected to be used as a medication for hyperuricemia and gout.
NC-2500 NC-2400
Purpose Lowering of uric acid Improving lipid metabolism
Function Xanthine oxidoreducase inhibitor PPAR δ Agonist
Discovery Nippon Chemiphar Nippon Chemiphar
Development Nippon Chemiphar Cerenis (France)
Phase Preclinical test was finished* Phase 1
Country Japan USA
Research and Development
Nippon Chemiphar Co., Ltd. | 13

“Go Forward” Medium-Term Management Plan
setting up an integrated system there to develop, manufacture and
sell pharmaceuticals.
The recently formulated medium-term plan sets the stage
for achieving these goals by further reinforcing the Company’s
earnings capabilities and financial base, as well as by starting on
specific measures toward future growth (Figure 1).
In the generics business, which is our first priority, we intend to
secure a leading position in terms of sales volume and product
lineup by leveraging the early-mover advantage we gained as one
of the first new drug manufacturers to enter this market.
Also, we will endeavor to expand the markets for
hyperuricemia and Uralyt based on the successes of our
clinical research. We aim to succeed in out-licensing NC-2500,
a hyperuricemic treatment that we also developed in parallel
ourselves.
In terms of overseas expansion, we will concentrate our
efforts on high-growth Asian markets, working to establish a
business infrastructure that will enable us to promote business
development in earnest (Figure 2).
Our numeric goals for FY2014 are to achieve consolidated net sales
of ¥40 billion or more, and we aim for generics to account for ¥30
billion of this amount. During the term of the plan, we also plan to
boost the Group operating income margin to 15% or more.
With regard to investment, we plan capital expenditure
amounting to ¥4.0 billion, concentrated on production facilities to
heighten cost competitiveness at Nihon Pharmaceutical Industries,
our subsidiary. We are also planning to invest ¥7.0 billion in R&D,
including generics development and drug research (Figure 3).
We have formulated a new three-year medium-term management plan, “Go Forward,” which commences in FY2012.
An outline of the plan is provided below.
Ahead of this plan, we launched the 10-year “Long-Term Vision,” which commenced in FY2011. The Long-
Term Vision sets forth three goals for the Company’s growth strategy. These include building on the Company’
s successes to date and maintaining the level of trust and performance it has generated in the Japanese generics
market. At the same time, the vision calls for Chemiphar to continue enhancing corporate value into the future and to
construct a unique business model that will enable its hyperuricemia and drug research successes to flourish. At the
same time, recognizing the limits to future growth in the Japanese market, the vision aims for overseas expansion,
(Figure 1) Positioning of Long-Term Vision and Medium-Term Plan
(Figure 2) Management Targets
(Figure 3) Management Targets
21
First (FY2012 - 2014)
* Strengthen finances
* Expand business development Expand business development
Second (FY2015 - 2017)
* Reap benefits
* New investments
Third (FY2018 - 2020)
* Harvest results of business efforts
Long-term Vision (2011–2020)
Chemiphar’s Business Area Business model focuses on growing domestic generics market and Asian markets
Overseas expansion
Special treatment areas
Generic business Chemiphar’s three business goals
4. Management Vision
22
Long-term Vision
5-1. Management Targets
1.Generics market
* Sell big generics * Retain market trust
2. Niche markets
* Strengthen position in original drugs market * Boost status in long-listed drug sales
•
•
3. Overseas presence
* Set up offshore R&D, production and sales bases
First Business Plan
Be top generics, original drug makers
* Strengthen Chemiphar’s image by launching more competitive products
Expand market for Uralyt
* License out NC-2500 * Increase awareness regarding hyperuricemia, and role of Uralyt
Set up overseas businesses
* Get know-how for drug development, production in China, Southeast Asia * Gear overseas enterprise to diagnostics business
23
Numerical targets
Investment plans
(¥bn)
5-2. Numerical Targets
FY2014 consolidated sales seen exceeding ¥40 billion
* Domestic generics sales: over ¥30 bn
* Uralyt sales more than ¥3 bn Consolidated operating ratio: more than 15%
* Total investment:¥4 billion (NPI investment: ¥3 bn, including new building at Tsukuba factory to be started in 2014)
* R&D: ¥7 bn (for generics, new drug development)
28.5 40.0
2.9 6.0 10.3% 15.0%
0%
10%
20%
30%
0
100
200
300
400
500
2011年度 2014年度 売上高 営業利益 営業利益率
FY 2011 FY 2014
Sales Operating Operating income ratio
_ _ _
(%)
14 | Annual Report 2012

Activities for Stakeholders
ComplianceComplying with laws and corporate ethics is a top priority of our
business operations. We formulate programs for compliance with laws
and corporate ethics, and focus these efforts through committees
on risk management, compliance with laws and regulations, and
information security.
To comply with laws and respect social norms, in fiscal
2011 we revised our code of conduct, the Nippon Chemiphar Law
Compliance and Conduct Standards, in line with revisions in the Japan
Pharmaceutical Manufacturers Association Compliance Program
Guidelines. At the same time, we formulated new regulations for
internal reporting to further enhance our internal reporting system.
For Patients and Medical Personnel
Our approximately 230 MRs are deployed nationwide, working to
provide medical personnel with accurate and prompt information
regarding our drugs. Also, we established toll-free Customer Support
to respond to inquiries from medical personnel and patients. The data
accumulated through these activities is centrally managed and can
be fed back to each department to develop new and better products.
・Initiatives to Ensure the Proper Use of Drugs
An MR providing information for a doctor
Compliance System
Chemiphar believes that a company must satisfy its corporate social responsibility in order to be
considered a necessary part of society, and we therefore aim to contribute to human health and
prosperous lifestyles by providing high-quality products and services. Here, we introduce some of
our stakeholder initiatives.
We support research groups for various medical personnel, including
the DPC Management Forum and the Hyperuricemia Metabolic
Syndrome Research Forum.
Through these research groups, we provide medical
personnel with data on diseases and other up-to-date information.
・Supporting Research Groups for Medical Personnel
January 2012 DPC Management Forum
Director for Compliance with Laws & Regulations
Chief Compliance Officer
Board of Directors
SecretariatCompliance Promotion Committee
Nippon Chemiphar Co., Ltd. | 15

We provide information that helps to meet medical institutions’
needs by offering patient-oriented guidance.
We have also set up the “gout navi” information site, which
helps patients to gain a basic understanding of hyperuricemia and
gout and provides them with recipes and other useful information.
・Providing Information to Patients
Safety and Security Initiatives
Guidance for various patients
We make every effort to ensure the product quality of our generics, and have in place extensive
systems for providing information about these drugs. We are also promoting initiatives to ensure
that product information is easily legible and that drugs are easy to use.
These are only a few of a host of initiatives we pursue to ensure the safety and security of
medical professionals and patients alike. We aim to reinforce these measures going forward.
(Please refer to page 11 for further details on our safety and security initiatives.)
Activities for Stakeholders
16 | Annual Report 2012

Social Contributions
Once each month, Chemiphar’s Soka office clears away trash from
the banks of the Nakagawa River. Traffic in this area is high, and trash
tends to accumulate and gather here, so clean-up activities help
to prevent people from being hurt by empty cans and bottles. Our
cleanup area measures roughly 300m north to south and 30m east to
west.
We also conduct regional beautification activities three
times each year around the Tsukuba factory of Nihon Pharmaceutical
Industry Co., Ltd., a Group company.
・Clean-up Activities around Office and Factories
Nakagawa River clean-up campaign
We began conducting corporate blood donations at our Soka office
in FY2010. This year, we held blood drives in September 2011 and
February 2012, with around 30 people giving blood each time.
・Cooperating with Blood Donations
At the Tsukuba factory, we provide a field for the local baseball team
free of charge.
・Providing a Playing Ground Free of Charge at the NPI Tsukuba Factory
Blood donation at the laboratories in Saitama
We have started collecting polyethylene terephthalate (PET) bottle
caps at our headquarters. A collection box is located on each floor,
and collected caps are provided to Eco-Cap Promotional Committee,
an NPO, which offers medical support in developing countries.
Some 8,000 PET bottle caps were collected between the start
of this activity in November 2011 and March 2012. The funds raised
were used to provide vaccines to 10 people in developing countries.
Providing these caps for collection also reduced equivalent CO2
emissions by around 63kg.
・Collecting PET Bottle Caps
We provide a field for a baseball team
Collected PET bottle caps
Activities for Stakeholders
Nippon Chemiphar Co., Ltd. | 17
Environmental Initiatives
NPI’s Tsukuba factory obtained international environmental certification under ISO 14001
in 2002. We set up an Environmental Committee, which is tasked with moving the Group
toward more environmentally friendly management systems.
・ISO 14001
Activities for Stakeholders
To reduce CO2 emissions, we have introduced eight hybrid cars to our
fleet. We aim for our business operations to have a low environmental
impact. We will continue to introduce such measures as is deemed
necessary.
Introducing Hybrid Cars
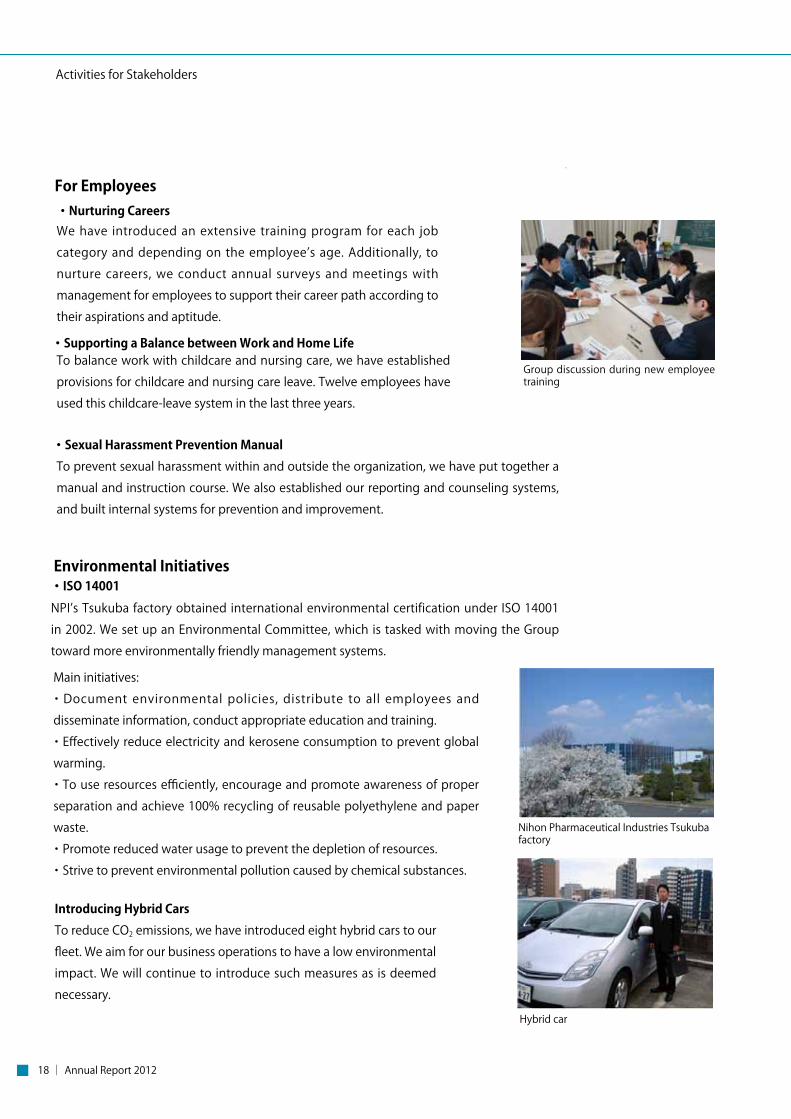
For Employees
We have introduced an extensive training program for each job
category and depending on the employee’s age. Additionally, to
nurture careers, we conduct annual surveys and meetings with
management for employees to support their career path according to
their aspirations and aptitude.
・Nurturing Careers
To prevent sexual harassment within and outside the organization, we have put together a
manual and instruction course. We also established our reporting and counseling systems,
and built internal systems for prevention and improvement.
・Sexual Harassment Prevention Manual
To balance work with childcare and nursing care, we have established
provisions for childcare and nursing care leave. Twelve employees have
used this childcare-leave system in the last three years.
・Supporting a Balance between Work and Home Life
Group discussion during new employee training
Main initiatives:
・Document environmental policies, distribute to all employees and
disseminate information, conduct appropriate education and training.
・Effectively reduce electricity and kerosene consumption to prevent global
warming.
・To use resources efficiently, encourage and promote awareness of proper
separation and achieve 100% recycling of reusable polyethylene and paper
waste.
・Promote reduced water usage to prevent the depletion of resources.
・Strive to prevent environmental pollution caused by chemical substances.
Nihon Pharmaceutical Industries Tsukuba factory
Hybrid car
18 | Annual Report 2012

President and CEO
DIrector and Senior Managing Corporate Officer
Director and Managing Corporate Officer
Director and Corporate Officer
Director and Corporate Officer
Director and Corporate Officer
Director and Corporate Officer
Director
Back to left: Naoshige Shindou, Tsuyoshi Takahashi, Haruki Mori, Yoshiyuki Maki, Yasushi HatakedaFront to left: Masaaki Hatakeyama, Tomio Yamakawa, Masanori Kutsuwada, Hiromichi Yata, Kazushiro Yamaguchi, Yasuo Kishi, Tsuyoshi Koyama, Masahide Yasumoto
Corporate Auditor (full time)
Corporate Auditor
Corporate Auditor
Corporate officer
Corporate officer
Directors, Statutory Auditors and Corporate Officers (As of June 28, 2012)
Kazushiro Yamaguchi
Hiromichi Yata
Yasuo Kishi
Masanori Kutsuwada
Tsuyoshi Koyama
Tomio Yamakawa
Masahide Yasumoto
Masaaki Hatakeyama
Haruki Mori
Tsuyoshi Takahashi
Naoshige Shindou
Yoshiyuki Maki
Yasushi Hatakeda
Nippon Chemiphar Co., Ltd. | 19

20 | Annual Report 2012

Consolidated Financial SectionThis section is a reformatted version of the Japanese financial data. The information was audited in its original
Japanese form.
Nippon Chemiphar Co., Ltd. | 21

Consolidated Balance SheetsNippon Chemiphar Co., Ltd. and Consolidated SubsidiariesMarch 31, 2012 and 2011 Thousands of
U.S. dollars(Note 1)
ASSETS 2012 2011 2012Current assets:
Cash and deposits (Notes 3 and 15) ¥ 6,677 ¥ 5,068 $ 81,298 Notes and accounts receivable–trade (Note 3) 9,068 8,344 110,410Allowance for doubtful accounts (0) (1) (0)Inventories 4,047 2,896 49,276Deferred tax assets (Note 11) 657 686 7,999Other 112 105 1,364
Total current assets 20,561 17,098 250,347
Property, plant and equipment:Land 5,550 5,550 67,576Buildings 11,236 11,137 136,807Machinery, equipment and vehicles 4,073 4,081 49,592Tools, furniture and fixtures 1,658 1,854 20,188Lease assets (Note 10) 632 467 7,695Construction in progress ― 41 ―
23,149 23,130 281,858Accumulated depreciation (13,006) (13,076) (158,359)
Net property, plant and equipment 10,143 10,054 123,499
Investments and other assets:Investment securities (Notes 3 and 4) 938 1,036 11,421Long-term loans receivable 8 7 97Long-term prepaid expenses 15 ― 183Goodwill 519 693 6,319Intangible assets 143 71 1,741Deferred tax assets (Note 11) 311 339 3,787Lease and guarantee deposits 105 121 1,279Long-term deposits (Note 3) 800 1,100 9,741Deferred assets 234 247 2,849Other 14 20 170
Total investments and other assets 3,087 3,634 37,587Total assets ¥33,791 ¥30,786 $411,433
Millions of yen
1 / 5
1 / 1
Thousands ofU.S. dollars
LIABILITIES AND NET ASSETS 2012 2011 2012Current liabilities:
Short-term loans payable (Note 3) ¥ 540 ¥ 992 $ 6,575 Current portion of bonds (Note 6) 370 470 4,505Current portion of long-term loans payable (Note 6) 2,880 2,596 35,066Lease obligations (Note 10) 136 86 1,656Notes and accounts payable–trade (Note 3) 4,982 4,235 60,660Notes payable–facilities 225 176 2,740Accrued expenses 2,174 1,865 26,470Income taxes payable (Note 11) 833 675 10,142Provision for sales promotion expenses 316 317 3,848Other 415 624 5,053
Total current liabilities 12,871 12,036 156,715
Non-current liabilities:Bonds payable (Notes 3 and 6) 735 1,105 8,949Long-term loans payable (Notes 3 and 6) 7,042 5,801 85,742Lease obligations (Note 10) 436 325 5,308Provision for retirement benefits (Note 7) 784 678 9,546Provision for directors’ retirement benefits 290 278 3,531Deferred tax liabilities for land revaluation 1,392 1,589 16,949Other 10 10 122
Total long-term liabilities 10,689 9,786 130,147
Net assets (Note 9):Capital stock:
4,305 4,305 52,417Capital surplus 1,297 1,297 15,792Retained earnings 2,835 1,523 34,519Treasury stock (470) (164) (5,723)
Sub total 7,967 6,961 97,005Accumulated other comprehensive income:Valuation difference on available-for-sale securities 27 (35) 329Revaluation surplus of land 2,230 2,033 27,152
Total accumulated other comprehensive income 2,257 1,998 27,481Subscription rights to shares 7 5 85Minority interests ― 0 ―
Total net assets 10,231 8,964 124,571Total liabilities and net assets ¥33,791 ¥30,786 $411,433
See notes to consolidated financial statements.
Millions of yen
Authorized: 154,000,000 shares Issued: 42,614,205 shares in 2012 and 2011
22 | Annual Report 2012

Consolidated Balance SheetsNippon Chemiphar Co., Ltd. and Consolidated SubsidiariesMarch 31, 2012 and 2011 Thousands of
U.S. dollars(Note 1)
ASSETS 2012 2011 2012Current assets:
Cash and deposits (Notes 3 and 15) ¥ 6,677 ¥ 5,068 $ 81,298 Notes and accounts receivable–trade (Note 3) 9,068 8,344 110,410Allowance for doubtful accounts (0) (1) (0)Inventories 4,047 2,896 49,276Deferred tax assets (Note 11) 657 686 7,999Other 112 105 1,364
Total current assets 20,561 17,098 250,347
Property, plant and equipment:Land 5,550 5,550 67,576Buildings 11,236 11,137 136,807Machinery, equipment and vehicles 4,073 4,081 49,592Tools, furniture and fixtures 1,658 1,854 20,188Lease assets (Note 10) 632 467 7,695Construction in progress ― 41 ―
23,149 23,130 281,858Accumulated depreciation (13,006) (13,076) (158,359)
Net property, plant and equipment 10,143 10,054 123,499
Investments and other assets:Investment securities (Notes 3 and 4) 938 1,036 11,421Long-term loans receivable 8 7 97Long-term prepaid expenses 15 ― 183Goodwill 519 693 6,319Intangible assets 143 71 1,741Deferred tax assets (Note 11) 311 339 3,787Lease and guarantee deposits 105 121 1,279Long-term deposits (Note 3) 800 1,100 9,741Deferred assets 234 247 2,849Other 14 20 170
Total investments and other assets 3,087 3,634 37,587Total assets ¥33,791 ¥30,786 $411,433
Millions of yen
1 / 5
1 / 1
Thousands ofU.S. dollars
LIABILITIES AND NET ASSETS 2012 2011 2012Current liabilities:
Short-term loans payable (Note 3) ¥ 540 ¥ 992 $ 6,575 Current portion of bonds (Note 6) 370 470 4,505Current portion of long-term loans payable (Note 6) 2,880 2,596 35,066Lease obligations (Note 10) 136 86 1,656Notes and accounts payable–trade (Note 3) 4,982 4,235 60,660Notes payable–facilities 225 176 2,740Accrued expenses 2,174 1,865 26,470Income taxes payable (Note 11) 833 675 10,142Provision for sales promotion expenses 316 317 3,848Other 415 624 5,053
Total current liabilities 12,871 12,036 156,715
Non-current liabilities:Bonds payable (Notes 3 and 6) 735 1,105 8,949Long-term loans payable (Notes 3 and 6) 7,042 5,801 85,742Lease obligations (Note 10) 436 325 5,308Provision for retirement benefits (Note 7) 784 678 9,546Provision for directors’ retirement benefits 290 278 3,531Deferred tax liabilities for land revaluation 1,392 1,589 16,949Other 10 10 122
Total long-term liabilities 10,689 9,786 130,147
Net assets (Note 9):Capital stock:
4,305 4,305 52,417Capital surplus 1,297 1,297 15,792Retained earnings 2,835 1,523 34,519Treasury stock (470) (164) (5,723)
Sub total 7,967 6,961 97,005Accumulated other comprehensive income:Valuation difference on available-for-sale securities 27 (35) 329Revaluation surplus of land 2,230 2,033 27,152
Total accumulated other comprehensive income 2,257 1,998 27,481Subscription rights to shares 7 5 85Minority interests ― 0 ―
Total net assets 10,231 8,964 124,571Total liabilities and net assets ¥33,791 ¥30,786 $411,433
See notes to consolidated financial statements.
Millions of yen
Authorized: 154,000,000 shares Issued: 42,614,205 shares in 2012 and 2011
Nippon Chemiphar Co., Ltd. | 23

Consolidated Statements of IncomeNippon Chemiphar Co., Ltd. and Consolidated SubsidiariesYears ended March 31, 2012 and 2011 Thousands of
U.S. dollars(Note 1)
2012 2011 2012Net sales (Note 18) ¥28,514 ¥27,361 $347,181Cost of sales 12,872 12,990 156,727
Gross profit 15,642 14,371 190,454
Selling, general and administrative expenses (Note 12) 12,719 12,372 154,864Operating income 2,923 1,999 35,590
Other income (expenses):Interest and dividends income 29 30 353Interest expenses (220) (229) (2,679)Loss on valuation of investment securities ― (304) ― Loss on disaster (Note 13) (40) (43) (487)Loss on disposal of fixed assets (71) 1 (864)Insurance receipts 64 ― 779Other, net 14 (38) 170
(224) (583) (2,728)
Income before income taxes and minority interests 2,699 1,416 32,862
Income taxes (Note 11)Current 1,234 935 15,025Deferred 25 (172) 304
1,259 763 15,329
Income before minority interests 1,440 653 17,533
Minority interests in income (0) 80 (0)
Net income ¥ 1,440 ¥ 573 $ 17,533
See notes to consolidated financial statements.
Consolidated Statements of Comprehensive IncomeNippon Chemiphar Co., Ltd. and Consolidated SubsidiariesYears ended March 31, 2012 and 2011 Thousands of
U.S. dollars(Note 1)
2012 2011 2012Income before minority interest ¥1,440 ¥653 $17,533
Valuation difference on available-for-sale securities 61 150 743Revaluation surplus of land 197 ― 2,399
Other comprehensive income 258 150 3,141Comprehensive income 1,698 803 20,674
Comprehensive income attributable to: Owners of the parent 1,698 722 20,674 Minority interests 0 81 0
See notes to consolidated financial statements.
Millions of yen
Millions of yen
1 / 1 24 | Annual Report 2012
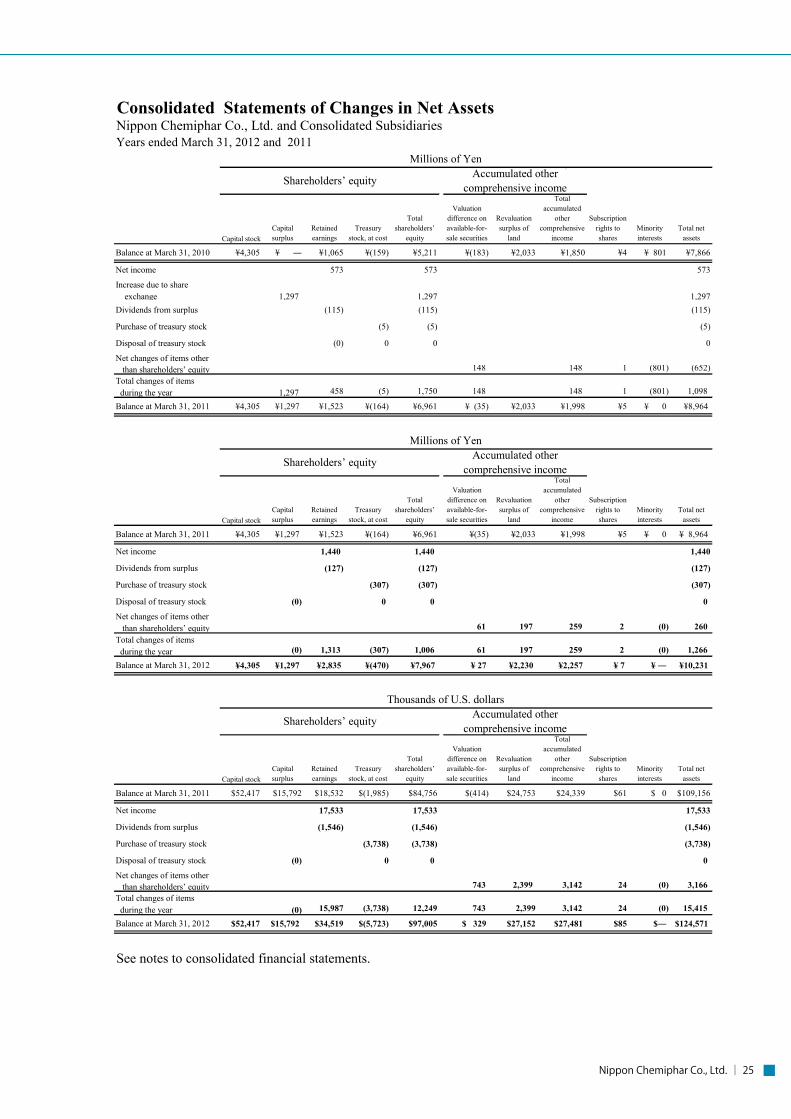
Consolidated Statements of Changes in Net Assets
Capital stock
Balance at March 31, 2010 ¥4,305 ¥ ― ¥1,065 ¥(159) ¥5,211 ¥(183) ¥2,033 ¥1,850 ¥4 ¥ 801 ¥7,866
Net income 573 573 573
Increase due to share exchange 1,297 1,297 1,297Dividends from surplus (115) (115) (115)
Purchase of treasury stock (5) (5) (5)
Disposal of treasury stock (0) 0 0 0
Net changes of items other than shareholders’ equity 148 148 1 (801) (652)Total changes of items during the year 1,297 458 (5) 1,750 148 148 1 (801) 1,098
Balance at March 31, 2011 ¥4,305 ¥1,297 ¥1,523 ¥(164) ¥6,961 ¥ (35) ¥2,033 ¥1,998 ¥5 ¥ 0 ¥8,964
Capital stock
Balance at March 31, 2011 ¥4,305 ¥1,297 ¥1,523 ¥(164) ¥6,961 ¥(35) ¥2,033 ¥1,998 ¥5 ¥ 0 ¥ 8,964
Net income 1,440 1,440 1,440
Dividends from surplus (127) (127) (127)
Purchase of treasury stock (307) (307) (307)
Disposal of treasury stock (0) 0 0 0
Net changes of items other than shareholders’ equity 61 197 259 2 (0) 260Total changes of items during the year (0) 1,313 (307) 1,006 61 197 259 2 (0) 1,266
Balance at March 31, 2012 ¥4,305 ¥1,297 ¥2,835 ¥(470) ¥7,967 ¥ 27 ¥2,230 ¥2,257 ¥ 7 ¥ ― ¥10,231
Capital stock
Balance at March 31, 2011 $52,417 $15,792 $18,532 $(1,985) $84,756 $(414) $24,753 $24,339 $61 $ 0 $109,156
Net income 17,533 17,533 17,533
Dividends from surplus (1,546) (1,546) (1,546)
Purchase of treasury stock (3,738) (3,738) (3,738)
Disposal of treasury stock (0) 0 0 0
Net changes of items other than shareholders’ equity 743 2,399 3,142 24 (0) 3,166Total changes of items during the year (0) 15,987 (3,738) 12,249 743 2,399 3,142 24 (0) 15,415
Balance at March 31, 2012 $52,417 $15,792 $34,519 $(5,723) $97,005 $ 329 $27,152 $27,481 $85 $― $124,571
See notes to consolidated financial statements.
Millions of Yen
Shareholders’ equity Accumulated othercomprehensive income
Totalshareholders’
equity
Valuationdifference onavailable-for-sale securities
Shareholders’ equity
Treasurystock, at cost
Retainedearnings
Capitalsurplus
Total netassets
Totalshareholders’
equity
Nippon Chemiphar Co., Ltd. and Consolidated Subsidiaries
Valuationdifference onavailable-for-sale securities
Millions of Yen
Years ended March 31, 2012 and 2011
Revaluationsurplus of
land
Totalaccumulated
othercomprehensive
income
Subscriptionrights toshares
Minorityinterests
Subscriptionrights toshares
Treasurystock, at cost
Minorityinterests
Subscriptionrights toshares
Accumulated othercomprehensive income
Minorityinterests
Capitalsurplus
Retainedearnings
Capitalsurplus
Thousands of U.S. dollars
Totalaccumulated
othercomprehensive
income
Revaluationsurplus of
landTotal net
assets
Totalshareholders’
equityTreasury
stock, at cost
Accumulated othercomprehensive income
Total netassets
Valuationdifference onavailable-for-sale securities
Shareholders’ equity
Retainedearnings
Revaluationsurplus of
land
Totalaccumulated
othercomprehensive
income
1 / 1 Nippon Chemiphar Co., Ltd. | 25

Consolidated Statements of Cash FlowsNippon Chemiphar Co., Ltd. and Consolidated SubsidiariesYears ended March 31, 2012 and 2011 Thousands of
U.S. dollars(Note 1)
2012 2011 2012Net cash provided by (used in) operating activities:
Income before income taxes and minority interests ¥ 2,699 ¥ 1,416 $ 32,862Depreciation and amortization 754 782 9,181Amortization of goodwill 173 152 2,106Increase in allowance for doubtful accounts 22 2 268(Decrease) increase in provision for sales promotion expenses (1) 18 (12)Increase in provision for retirement benefits 105 57 1,278Increase in provision for directors’ retirement benefits 12 24 146Interest and dividend income (29) (30) (353)Interest expenses 221 229 2,691Loss on retirement of noncurrent assets 87 10 1,059Loss on valuation of investment securities ― 304 ― Increase in notes and accounts receivable–trade (724) (252) (8,815)(Increase) decrease in inventories (1,151) 369 (14,014)Increase in other current assets (0) (1) (0)Increase in notes and accounts payable–trade 746 427 9,083Increase in other current liabilities 175 19 2,131(Decrease) increase in consumption taxes payable (65) 20 (791)(Increase) decrease in long-term prepaid expenses (15) 3 (183)Other, net 11 45 134 Subtotal 3,020 3,594 36,771Interest and dividends income received 31 32 378Interest expenses paid (219) (232) (2,667)Income taxes paid (1,079) (646) (13,138) Net cash provided by operating activities 1,753 2,748 21,344
Net cash provided by (used in) investing activities:Payment into time deposits (80) (51) (974)Proceeds from withdrawal of time deposits 60 48 731Purchases of property, plant and equipment (694) (539) (8,450)Purchases of investment securities (4) (4) (49)Proceeds from sales of investment securities 198 ― 2,411Payment of loans receivable to employees (4) (4) (49)Proceeds from collection of lease and guarantee deposits 20 17 243Proceeds from withdrawal of long-term deposits 500 ― 6,088Payment into time deposits (200) (100) (2,435)Other payments (18) (8) (219)Other, net (5) 1 (61) Net cash used in investing activities (227) (640) (2,764)
Net cash provided by (used in) financing activities:Net decrease in short-term loans payable (452) (117) (5,503)Proceeds from long-term loans payable 4,500 2,000 54,791Repayment of long-term loans payable (2,974) (2,632) (36,211)Proceeds from issuances of bonds ― 500 ― Redemption of bonds (470) (510) (5,723)Purchases of treasury stock (307) (3) (3,738)Cash dividends paid (127) (115) (1,546)Other, net (107) (72) (1,303) Net cash provided by (used in) financing activities 63 (949) 767
Net increase in cash and cash equivalents 1,589 1,159 19,347Cash and cash equivalents, at beginning of year 5,009 3,850 60,989Cash and cash equivalents, at end of year (Note 15) ¥ 6,598 ¥ 5,009 $ 80,336
See notes to consolidated financial statements.
Millions of yen
5 / 5
26 | Annual Report 2012

Notes to Consolidated Financial Statements Nippon Chemiphar Co., Ltd. and Consolidated Subsidiaries Years ended March 31, 2012 and 2011 1. BASIS OF PRESENTING CONSOLIDATED FINANCIAL STATEMENTS The accompanying consolidated financial statements have been prepared in accordance with the provisions set forth in the Financial Instruments and Exchange Law of Japan and its related accounting regulations, and in conformity with accounting principles generally accepted in Japan, which differ in certain aspects of application and disclosure requirements from international financial reporting standards. The consolidated financial statements issued domestically have undergone certain reclassifications and rearrangements in order that they might be presented in a form with which readers outside Japan are more familiar. In addition, certain reclassifications have been made in the 2011 financial statements to conform to the classifications used in 2012. The consolidated financial statements are stated in Japanese yen, the currency of the country in which Nippon Chemiphar Co., Ltd. (the Company) is incorporated and operates. The translations of Japanese yen amounts into U.S. dollar amounts are included solely for the convenience of readers outside Japan and have been made at the rate of ¥82.13 to US$1, the approximate rate of exchange at March 31, 2012. Such translations should not be construed as representation that the Japanese yen amounts could be converted to U.S. dollars at that or any other rate.
As permitted by the Financial Instruments and Exchange Law of Japan, amounts of less than one million yen have been omitted. As a result, the totals shown in the accompanying consolidated financial statements (both in yen and U.S. dollars) do not necessarily agree with the sums of the individual amounts. 2. SUMMARY OF SIGNIFICANT ACCOUNTING POLICIES a. Consolidation
The consolidated financial statements as of March 31, 2012, include the accounts of the Company and its three (three in 2011) subsidiaries (together, the Group). Under the control or influence concept, those companies in the operations of which the Company, directly or indirectly, is able to exercise control are fully consolidated. The companies over which the Group exercises significant influence are accounted for by the equity method.
Investments in one (one in 2011) affiliated company is accounted for by the equity method. All significant intercompany balances and transactions have been eliminated in consolidation.
All material unrealized profits included in assets resulting from transactions within the Group have been eliminated. b. Cash equivalents
Cash equivalents are short-term investments that are readily convertible into cash and that are exposed to insignificant risk of changes in value. Cash equivalents include time deposits, demand deposits and other short-term investments with an original maturity of three months from the date of acquisition.
Nippon Chemiphar Co., Ltd. | 27

c. Inventories
Inventories held for sale in the ordinary course of business are measured at the lower of cost or net selling value, which is defined as the selling price less additional estimated manufacturing costs and estimated direct selling expenses. The replacement cost may be used in place of the net selling value, if appropriate.
Inventories of the Company and its consolidated subsidiaries are stated at cost determined by the first-in, first-out method. d. Investment securities
In accordance with the accounting standard for financial instruments, the securities held by the Group are classified as (1) available-for-sale securities, which are reported at fair value, with unrealized gains and losses, net of applicable taxes, reported in a component of valuation and translation adjustments under net assets; and (2) investments in affiliates not accounted for by the equity method, which are stated at cost. Non-marketable available-for-sale securities are stated at cost determined by the moving-average method. e. Allowance for doubtful accounts
The allowance for doubtful accounts is stated in amounts considered to be appropriate, based on past credit loss experience and an evaluation of potential losses in receivables outstanding. f. Property, plant and equipment
Property, plant and equipment are stated at cost. Depreciation of property, plant and equipment of the Group is computed by the declining-balance method, while the straight-line method is applied to buildings acquired on and after April 1, 1998. g. Intangible assets
Intangible assets are carried at cost less accumulated amortization, which is calculated by the straight-line method. Amortization of goodwill purchased is computed by the straight-line method over 5 years. h. Deferred charges
Bond issuance costs are equally amortized over the years until the maturing dates. i. Land revaluation Under the Law of Land Revaluation, the Company revalued the land owned for its business use on March 31, 2000, based on the enforcement ordinance concerning revaluation of land. The resulting revaluation surplus of land represents unrealized appreciation of land and is stated, net of income taxes, as a component of valuation and translation adjustments under net assets, and its related deferred tax liabilities are recorded under long-term liabilities. The difference between the carrying amount and its fair value at March 31, 2012 and 2011 was ¥1,348 million ($16,413 thousand) and ¥1,304 million, respectively.
28 | Annual Report 2012

c. Inventories
Inventories held for sale in the ordinary course of business are measured at the lower of cost or net selling value, which is defined as the selling price less additional estimated manufacturing costs and estimated direct selling expenses. The replacement cost may be used in place of the net selling value, if appropriate.
Inventories of the Company and its consolidated subsidiaries are stated at cost determined by the first-in, first-out method. d. Investment securities
In accordance with the accounting standard for financial instruments, the securities held by the Group are classified as (1) available-for-sale securities, which are reported at fair value, with unrealized gains and losses, net of applicable taxes, reported in a component of valuation and translation adjustments under net assets; and (2) investments in affiliates not accounted for by the equity method, which are stated at cost. Non-marketable available-for-sale securities are stated at cost determined by the moving-average method. e. Allowance for doubtful accounts
The allowance for doubtful accounts is stated in amounts considered to be appropriate, based on past credit loss experience and an evaluation of potential losses in receivables outstanding. f. Property, plant and equipment
Property, plant and equipment are stated at cost. Depreciation of property, plant and equipment of the Group is computed by the declining-balance method, while the straight-line method is applied to buildings acquired on and after April 1, 1998. g. Intangible assets
Intangible assets are carried at cost less accumulated amortization, which is calculated by the straight-line method. Amortization of goodwill purchased is computed by the straight-line method over 5 years. h. Deferred charges
Bond issuance costs are equally amortized over the years until the maturing dates. i. Land revaluation Under the Law of Land Revaluation, the Company revalued the land owned for its business use on March 31, 2000, based on the enforcement ordinance concerning revaluation of land. The resulting revaluation surplus of land represents unrealized appreciation of land and is stated, net of income taxes, as a component of valuation and translation adjustments under net assets, and its related deferred tax liabilities are recorded under long-term liabilities. The difference between the carrying amount and its fair value at March 31, 2012 and 2011 was ¥1,348 million ($16,413 thousand) and ¥1,304 million, respectively.
j. Loss on impairment of fixed assets
In accordance with the accounting standard for impairment of fixed assets, the Company and its
consolidated subsidiaries periodically review their fixed assets for impairment by grouping them in
income-generating units whenever there is any indication of a significant decline in the fair value against
book value based on an independent appraisal. When the existence of any impairment for the group of the
assets is identified, an impairment loss will be recognized and such amount is directly deducted from the
related assets.
k. Provision for retirement benefits
Pursuant to the Japanese accounting standard for employees’ retirement benefits, the Company and its consolidated subsidiaries recorded the liability for retirement benefits as of March 31, 2012 and 2011, based on projected benefit obligations and the fair value of the pension plan assets at those dates. The actuarial gains or losses are amortized from the year following the year in which the gain or loss is incurred by the straight-line method over the average remaining years of service of the eligible employees (11 years in 2012 and 2011). l. Provision for directors’ retirement benefits
Provision for directors’ retirement benefits is recorded based on the estimated amount calculated in accordance with Company rules. m. Provision for sales promotion expenses
Provision for sales promotion expenses is recorded based on the latest results to provide for future payment of sales promotion expenses in connection with the products and goods sold by the end of the current fiscal year. n. Leases
Leased assets under finance leases commencing after March 31, 2008 are capitalized except for certain immaterial or short-term finance leases, which are accounted for as operating leases. Finance leases which commenced prior to April 1, 2008 and have been accounted for as operating leases, continue to be accounted for as operating leases. o. Income taxes
The provision for income taxes is computed based on the pretax income included in the consolidated statements of income. The asset and liability approach is used to recognize deferred tax assets and liabilities for the expected future tax consequences of temporary differences between the carrying amounts and the tax bases of assets and liabilities. Deferred taxes are measured by applying currently enacted tax laws to the temporary differences.
Nippon Chemiphar Co., Ltd. | 29

p. Consumption tax
Consumption tax imposed on the Company’s and its subsidiaries’ sales to customers is withheld by the Company and its subsidiaries at the time of sale and subsequently paid to the government. This consumption tax is not included in net sales in the accompanying statements of income, but is recorded as a liability, consumption tax payable. Consumption tax that is paid by the Company and its subsidiaries on the purchases of goods and services from outside the Group is also not included in costs or expenses in the accompanying statements of income, but is offset against consumption tax payable. The net balance is reflected as consumption tax payable under other current liabilities in the accompanying consolidated balance sheets at March 31, 2012 and 2011. q. Appropriation of retained earnings
Appropriations of retained earnings are reflected in the financial statements for the following year upon shareholders’ approval. r. Derivatives and hedging activities
The Company has time deposits with options and interest rate swap contracts, but does not enter into derivatives for trading or speculative purposes. The exposure of time deposits with options is limited to the interest amounts to be received, while interest rate swaps are utilized to hedge the interest rate exposure of long-term debt and are accounted for by the hedge accounting method. Because the counterparties to these derivatives are limited to financial institutions with a high credit rating, the Company does not anticipate any losses arising from credit risk. s. Per-share information
Basic net income per share is computed by dividing net income available to common shareholders by the weighted-average number of common shares outstanding for the period. Diluted net income per share is not disclosed since there are no potential shares outstanding.
Effective from the year ended March 31, 2012, the Company and its subsidiaries have applied the “Accounting Standard for Earning Per Share” (Accounting Standards Board of Japan (“ASBJ”) Statement No.2 of June 30, 2010), the “Guidance on Accounting Standard for Earning Per Share” (ASBJ Guidance No.4 of June 30, 2010). To calculate diluted net income per share, the Company and its subsidiaries have changed the method to include potential services offered by the employees in the fair valuation of stock options of payment when exercising the right regarding stock options whose rights are secured after certain period of employment. See Note 14 for the influence of this change. t. Application of accounting standards Accounting Standards for Accounting Changes and Error Corrections The Company and its subsidiaries have applied “Accounting Standard for Accounting Changes and Error Corrections” (Accounting Standards Board of Japan(“ASBJ Statement No. 24, issued on December 4, 2009) and “Guidance on Accounting Standard for Accounting Changes and Error Corrections” (ASBJ Guidance No. 24, issued on December 4, 2009) for accounting changes and corrections of prior period errors which are made from the fiscal year beginning on April 1, 2011.
30 | Annual Report 2012

p. Consumption tax
Consumption tax imposed on the Company’s and its subsidiaries’ sales to customers is withheld by the Company and its subsidiaries at the time of sale and subsequently paid to the government. This consumption tax is not included in net sales in the accompanying statements of income, but is recorded as a liability, consumption tax payable. Consumption tax that is paid by the Company and its subsidiaries on the purchases of goods and services from outside the Group is also not included in costs or expenses in the accompanying statements of income, but is offset against consumption tax payable. The net balance is reflected as consumption tax payable under other current liabilities in the accompanying consolidated balance sheets at March 31, 2012 and 2011. q. Appropriation of retained earnings
Appropriations of retained earnings are reflected in the financial statements for the following year upon shareholders’ approval. r. Derivatives and hedging activities
The Company has time deposits with options and interest rate swap contracts, but does not enter into derivatives for trading or speculative purposes. The exposure of time deposits with options is limited to the interest amounts to be received, while interest rate swaps are utilized to hedge the interest rate exposure of long-term debt and are accounted for by the hedge accounting method. Because the counterparties to these derivatives are limited to financial institutions with a high credit rating, the Company does not anticipate any losses arising from credit risk. s. Per-share information
Basic net income per share is computed by dividing net income available to common shareholders by the weighted-average number of common shares outstanding for the period. Diluted net income per share is not disclosed since there are no potential shares outstanding.
Effective from the year ended March 31, 2012, the Company and its subsidiaries have applied the “Accounting Standard for Earning Per Share” (Accounting Standards Board of Japan (“ASBJ”) Statement No.2 of June 30, 2010), the “Guidance on Accounting Standard for Earning Per Share” (ASBJ Guidance No.4 of June 30, 2010). To calculate diluted net income per share, the Company and its subsidiaries have changed the method to include potential services offered by the employees in the fair valuation of stock options of payment when exercising the right regarding stock options whose rights are secured after certain period of employment. See Note 14 for the influence of this change. t. Application of accounting standards Accounting Standards for Accounting Changes and Error Corrections The Company and its subsidiaries have applied “Accounting Standard for Accounting Changes and Error Corrections” (Accounting Standards Board of Japan(“ASBJ Statement No. 24, issued on December 4, 2009) and “Guidance on Accounting Standard for Accounting Changes and Error Corrections” (ASBJ Guidance No. 24, issued on December 4, 2009) for accounting changes and corrections of prior period errors which are made from the fiscal year beginning on April 1, 2011.
3. FINANCIAL INSTRUMENTS (1) Qualitative information on financial instruments a. Policies for using financial instruments The Company and its subsidiaries limit their investment of temporary surpluses to highly secure financial assets and raise the funds through loans from banks and other institutions and by issuing corporate bonds. Derivatives are employed to hedge against the risks described below; the Company and its subsidiaries do not engage in speculative transactions. b. Policies and systems for risk management Notes and accounts receivable, which are claimable assets, involve credit risks on the part of customers. With regard to claimable assets, the Company and its subsidiaries manage claimable assets by transaction partners according to due date and balance.
Investment securities are subject to market price fluctuation risk. Regarding these risks, the Company and its subsidiaries have in place a system to determine periodically for each company the fair value and the financial condition of the issuer.
Trade notes and accounts payable, which are trade liabilities, generally arise in the course of operating activities, and the majority of these are payable within one year.
Long-term loans payable and bonds payable are principally taken out to fund long-term working capital. Floating-rate loans are subject to interest rate fluctuation risk, but for long-term loans the Company minimizes the risk of fluctuations in interest payments by fixing payment interest rates, employing derivative transactions (interest rate swap transactions) to hedge against such risk.
Trade liabilities and loans are subject to liquidity risk. To manage this risk, the Company and each of its subsidiaries create cash flow plans monthly c. Supplemental information on fair values The fair value of financial instruments is based on their market value. The fair value of financial instruments that have no available market value is determined by using a rational method of calculation. However, as variables are inherent in these value calculations, the resulting values may differ if different assumptions are used. Also, market risk related to derivative financial instruments is not included in the contract amounts of those instruments. d. Concentration of credit risk As of March 31, 2012 and 2011, 49.4% and 52.5% of operating receivables were due from specific major customers, respectively.
Nippon Chemiphar Co., Ltd. | 31

(2) Fair values of financial instruments Carrying values and fair values of the financial instruments on the consolidated balance sheet at March 31, 2012 and 2011, are the following.
Assets Millions of yen Thousands of U.S. dollars
2012 2011 2012 Carrying value
Cash and deposits ¥ 6,677 ¥ 5,068 $ 81,298 Notes and account receivable–trade 9,068 8,344 110,410 Investment securities 866 972 10,544 Long-term deposits 800 1,100 9,741
Total 17,411 15,484 211,993 Fair value
Cash and deposits 6,677 5,068 81,298 Notes and account receivable–trade 9,068 8,344 110,410 Investment securities 866 972 10,544 Long-term deposits 669 948 8,146
Total 17,280 15,332 210,398 Difference
Cash and deposits ― ― ― Notes and account receivable–trade ― ― ― Investment securities ― ― ― Long-term deposits (131) (152) (1,595)
Total ¥ (131) ¥ (152) $ (1,595)
Liabilities Millions of yen Thousands of U.S. dollars
2012 2011 2012 Carrying value
Notes and account payable–trade ¥ 4,982 ¥ 4,235 $ 60,660 Short-term loans payable 540 992 6,575 Bonds payable 1,105 1,575 13,454 Long-term loans payable 9,923 8,396 120,821
Total 16,550 15,198 201,510 Fair value
Notes and account payable–trade 4,982 4,235 60,660 Short-term loans payable 540 992 6,575 Bonds payable 1,114 1,573 13,564 Long-term loans payable 9,705 8,437 118,166
Total 16,341 15,237 198,965 Difference
Notes and account payable–trade ― ― ― Short-term loans payable ― ― ― Bonds payable (9) 2 (110) Long-term loans payable 218 (41) 2,655
Total ¥ 209 ¥ (39) $ 2,545 Method of calculating the fair value of financial instruments and matters related to available-for-sale securities and derivative transactions.
32 | Annual Report 2012

(2) Fair values of financial instruments Carrying values and fair values of the financial instruments on the consolidated balance sheet at March 31, 2012 and 2011, are the following.
Assets Millions of yen Thousands of U.S. dollars
2012 2011 2012 Carrying value
Cash and deposits ¥ 6,677 ¥ 5,068 $ 81,298 Notes and account receivable–trade 9,068 8,344 110,410 Investment securities 866 972 10,544 Long-term deposits 800 1,100 9,741
Total 17,411 15,484 211,993 Fair value
Cash and deposits 6,677 5,068 81,298 Notes and account receivable–trade 9,068 8,344 110,410 Investment securities 866 972 10,544 Long-term deposits 669 948 8,146
Total 17,280 15,332 210,398 Difference
Cash and deposits ― ― ― Notes and account receivable–trade ― ― ― Investment securities ― ― ― Long-term deposits (131) (152) (1,595)
Total ¥ (131) ¥ (152) $ (1,595)
Liabilities Millions of yen Thousands of U.S. dollars
2012 2011 2012 Carrying value
Notes and account payable–trade ¥ 4,982 ¥ 4,235 $ 60,660 Short-term loans payable 540 992 6,575 Bonds payable 1,105 1,575 13,454 Long-term loans payable 9,923 8,396 120,821
Total 16,550 15,198 201,510 Fair value
Notes and account payable–trade 4,982 4,235 60,660 Short-term loans payable 540 992 6,575 Bonds payable 1,114 1,573 13,564 Long-term loans payable 9,705 8,437 118,166
Total 16,341 15,237 198,965 Difference
Notes and account payable–trade ― ― ― Short-term loans payable ― ― ― Bonds payable (9) 2 (110) Long-term loans payable 218 (41) 2,655
Total ¥ 209 ¥ (39) $ 2,545 Method of calculating the fair value of financial instruments and matters related to available-for-sale securities and derivative transactions.
a. Cash and deposits and notes and account receivable–trade As these instruments are settled within a short term and their fair values and book values are similar, their book values are assumed as their fair values. b. Investment securities The fair values of equity securities are determined by their prices on stock exchanges. See Note 4 for the description of securities by classification. c. Long-term deposits These amounts are based on valuations provided by financial institutions. For differences, only the “fair valuation amounts of derivative portions” are indicated in the table. These differences have minimal impact on profits and losses at the time of maturity. d. Notes and account payable–trade and short-term loans payable As these instruments are settled within a short term and their fair values and book values are similar, their book values are assumed as their fair values. e. Bonds payable For the fair values of bonds, the total amount of principal and interest is discounted to present value using the assumed rate of interest on newly issued bonds of the same type. f. Long-term loans payable For the fair values of long-term loans, the total amount of principal and interest is discounted to present value using the assumed rate of interest on new loans of the same type. The fair value of long-term debt is determined by discounting the total amount of principal and interest by the assumed interest rate on new borrowings of the same type. Exceptional accounting is employed on interest rate swaps on long-term debt with floating interest rates. Financial instruments for which fair value is not readily determinable The fair value of unlisted equity securities with a carrying amount of ¥71 million ($864 thousand) and ¥64 million as of March 31, 2012 and 2011, respectively, are not readily determinable. Redemption schedule for receivables with maturity dates as of March 31, 2012, are summarized as follows: Millions of yen
2012
1 year or less
More than 1 year but
less than 5 years
More than 5 years but
less than 10 years
More than 10 years
Cash and deposits ¥ 6,677 ¥ ― ¥ ― ¥ ― Notes and account receivable–trade 9,068 ― ― ― Long-term deposits ― 200 100 500
Total ¥ 15,745 ¥ 200 ¥ 100 ¥ 500
Nippon Chemiphar Co., Ltd. | 33

Thousands of U.S. dollars
2012
1 year or less
More than 1 year but less than 5 years
More than 5 years but
less than 10 years
More than 10 years
Cash and deposits $ 81,298 $ ― $ ― $ ― Notes and account receivable–trade 110,410 ― ― ― Long-term deposits ― 2,435 1,218 6,088
Total $ 191,708 $ 2,435 $ 1,218 $ 6,088 4. INVESTMENT SECURITIES Investment securities at March 31, 2012 and 2011 comprised the following:
Millions of yen Thousands of U.S. dollars
2012 2011 2012 Available-for-sale securities:
Marketable equity securities ¥813 ¥ 916 $ 9,899 Unlisted equity securities 72 64 877 Others 53 56 645
Total ¥938 ¥1,036 $11,421
The carrying amounts and aggregate fair values of investment securities at March 31, 2012 and 2011 were as follows:
Millions of yen
Cost Unrealized
gain Unrealized
loss Fair
value March 31, 2012
Available-for-sale: Value posted in consolidated
balance sheets exceeds acquisition price ¥291 ¥94 ¥ ― ¥385
Acquisition price exceeds value posted in consolidated balance sheets 462 ― 34 428
Other 63 ― 10 53 ¥816 ¥94 ¥ 44 ¥866
34 | Annual Report 2012

Thousands of U.S. dollars
2012
1 year or less
More than 1 year but less than 5 years
More than 5 years but
less than 10 years
More than 10 years
Cash and deposits $ 81,298 $ ― $ ― $ ― Notes and account receivable–trade 110,410 ― ― ― Long-term deposits ― 2,435 1,218 6,088
Total $ 191,708 $ 2,435 $ 1,218 $ 6,088 4. INVESTMENT SECURITIES Investment securities at March 31, 2012 and 2011 comprised the following:
Millions of yen Thousands of U.S. dollars
2012 2011 2012 Available-for-sale securities:
Marketable equity securities ¥813 ¥ 916 $ 9,899 Unlisted equity securities 72 64 877 Others 53 56 645
Total ¥938 ¥1,036 $11,421
The carrying amounts and aggregate fair values of investment securities at March 31, 2012 and 2011 were as follows:
Millions of yen
Cost Unrealized
gain Unrealized
loss Fair
value March 31, 2012
Available-for-sale: Value posted in consolidated
balance sheets exceeds acquisition price ¥291 ¥94 ¥ ― ¥385
Acquisition price exceeds value posted in consolidated balance sheets 462 ― 34 428
Other 63 ― 10 53 ¥816 ¥94 ¥ 44 ¥866
Thousands of U.S. dollars
Cost Unrealized
gain Unrealized
loss Fair
Value March 31, 2012
Available-for-sale: Value posted in consolidated
balance sheets exceeds acquisition price $3,543 $1,145 $ ― $4,688
Acquisition price exceeds value posted in consolidated balance sheets 5,625 ― 414 5,211
Other 767 ― 122 645 $9,935 $1,145 $536 $10,544
Millions of yen
Cost Unrealized
gain Unrealized
loss Fair
value March 31, 2011
Available-for-sale: Value posted in consolidated
balance sheets exceeds acquisition price ¥ 124 ¥51 ¥ ― ¥ 175
Acquisition price exceeds value posted in consolidated balance sheets 825 ― 84 741
Other 67 ― 11 56 ¥1,016 ¥51 ¥95 ¥972
The sales amounts of investment securities sold and amounts of the related gains or losses for the years ended March 31, 2012 and 2011 are as follows:
Millions of yen Thousands of U.S. dollars
2012 2011 2012
Total sales of investment securities sold ¥198 ¥― $2,411
Related gains ― ― ―
Related losses 1 ― 12 There were no impairment losses on investment securities for the year ended March 31, 2012. The impairment loss on investment securities for the year ended March 31, 2011 was ¥304 million.
Nippon Chemiphar Co., Ltd. | 35

5. DERIVATIVE FINANCIAL INSTRUMENTS AND HEDGING TRANSACTIONS
The Company has applied hedge accounting for interest rate swap contracts to hedge risks of changes of floating interest rate on long-term debt. The contract amount is ¥2,977 million ($36,247 thousand) and the amount of the contracts which term is more than one year is ¥1,480 million ($18,020 thousand). Interest rate swap contracts are used as hedge and meet certain hedging criteria, the net amount to be paid or received under the interest rate swap contract is added to or deducted from the interest on the assets or liabilities for which the swap contract was executed. Therefore, the fair value of long-term debt includes the fair value of the interest swap contracts. 6. LONG-TERM DEBTS Long-term debts at March 31, 2012 and 2011, comprised the following:
Millions of yen Thousands of U.S. dollars
2012 2011 2012 Corporate bonds ¥ 1,105 ¥ 1,575 $ 13,454 Long-term loans 9,923 8,396 120,821 Total long-term debts 11,028 9,971 134,275 Less: current portion (3,250) (3,065) (39,571) ¥ 7,778 ¥ 6,906 $ 97,704
Corporate bonds at March 31, 2012 and 2011, comprised the following:
Balance at March 31 Millions of yen
Thousands of U.S. dollars
Interest rate
Issued by Type Issue date 2012 2011 2012 (%) Maturity
Nippon Chemiphar Co., Ltd.
4th unsecured bonds
Dec. 29, 2006 ― 100 ― 1.30 Dec. 29,
2011 5th unsecured
bonds Mar. 31,
2009 200 300 2,435 1.10 Mar. 31, 2014
6th unsecured bonds
Dec. 30, 2009 300 400 3,653 0.71 Dec. 30,
2014 7th unsecured
bonds Sep. 30,
2010 350 450 4,261 0.57 Sep. 30, 2015
Nihon Pharmaceutical Industry Co. Ltd.
3rd unsecured bonds
Oct 31, 2007 255 325 3,105 1.40 Apr. 30,
2015 Total ¥1,105 ¥1,575 $13,454
Note: Balance at March 31, 2012, includes current portion amounting to ¥370 million ($4,505 thousand).
The aggregated annual maturities of bonds are as follows:
Year ending March 31 Millions of yen Thousands of U.S. dollars
2013 ¥370 $4,505 2014 370 4,505 2015 270 3,287 2016 95 1,157 2017 ― ―
36 | Annual Report 2012

5. DERIVATIVE FINANCIAL INSTRUMENTS AND HEDGING TRANSACTIONS
The Company has applied hedge accounting for interest rate swap contracts to hedge risks of changes of floating interest rate on long-term debt. The contract amount is ¥2,977 million ($36,247 thousand) and the amount of the contracts which term is more than one year is ¥1,480 million ($18,020 thousand). Interest rate swap contracts are used as hedge and meet certain hedging criteria, the net amount to be paid or received under the interest rate swap contract is added to or deducted from the interest on the assets or liabilities for which the swap contract was executed. Therefore, the fair value of long-term debt includes the fair value of the interest swap contracts. 6. LONG-TERM DEBTS Long-term debts at March 31, 2012 and 2011, comprised the following:
Millions of yen Thousands of U.S. dollars
2012 2011 2012 Corporate bonds ¥ 1,105 ¥ 1,575 $ 13,454 Long-term loans 9,923 8,396 120,821 Total long-term debts 11,028 9,971 134,275 Less: current portion (3,250) (3,065) (39,571) ¥ 7,778 ¥ 6,906 $ 97,704
Corporate bonds at March 31, 2012 and 2011, comprised the following:
Balance at March 31 Millions of yen
Thousands of U.S. dollars
Interest rate
Issued by Type Issue date 2012 2011 2012 (%) Maturity
Nippon Chemiphar Co., Ltd.
4th unsecured bonds
Dec. 29, 2006 ― 100 ― 1.30 Dec. 29,
2011 5th unsecured
bonds Mar. 31,
2009 200 300 2,435 1.10 Mar. 31, 2014
6th unsecured bonds
Dec. 30, 2009 300 400 3,653 0.71 Dec. 30,
2014 7th unsecured
bonds Sep. 30,
2010 350 450 4,261 0.57 Sep. 30, 2015
Nihon Pharmaceutical Industry Co. Ltd.
3rd unsecured bonds
Oct 31, 2007 255 325 3,105 1.40 Apr. 30,
2015 Total ¥1,105 ¥1,575 $13,454
Note: Balance at March 31, 2012, includes current portion amounting to ¥370 million ($4,505 thousand).
The aggregated annual maturities of bonds are as follows:
Year ending March 31 Millions of yen Thousands of U.S. dollars
2013 ¥370 $4,505 2014 370 4,505 2015 270 3,287 2016 95 1,157 2017 ― ―
Long-term loans at March 31, 2012 and 2011 comprised the following:
Balance at March 31 Millions of yen Thousands of U.S. dollars
Interest rate Repayment
2012 2011 2012 (%) Term Current portion of
long-term loans ¥2,880 ¥2,596 $ 35,066 1.3 ―
Long-term loans 7,042 5,801 85,742 1.4 2014–2018 Total ¥9,923 ¥8,397 $120,808
The aggregated annual maturities of long-term loans are as follows:
Year ending March 31 Millions of
yen Thousands of U.S. dollars
2014 ¥2,444 $29,758 2015 1,653 20,127 2016 1,104 13,442 2017 1,715 20,882 2018 126 1,533
The long-term loans include syndicate loan agreements amounting to ¥2,400 million ($29,222 thousand) and ¥3,600 million at March 31, 2012 and 2011, respectively. The agreement includes the following financial restriction provisions: a. Operating income and ordinary income in the statements of income should not be negative for two
consecutive years. b. The amount of shareholders’ equity in the balance sheets at every year end should be more than 75% of
the level at March 31, 2008. If the Company or the Group fails to comply with the provisions, the Company is required to repay the principal and related interest expenses on all the contractual liabilities. In addition, the Company has entered into commitment agreements with four financial institutions to enable efficient fund-raising activities. The status of the commitments based on the agreements at March 31, 2012, was as follows:
Millions of
yen Thousands of U.S. dollars
Aggregated commitment amounts ¥3,000 $36,527 Used ― ― Unused balance ¥3,000 $36,527
7. PROVISION FOR RETIREMENT BENEFITS The Company and its consolidated subsidiaries have defined benefit pension plans, including a welfare pension fund and a defined benefit corporate pension plan and lump-sum payment plans for retirement benefits. In certain cases, additional severance indemnities may be paid to certain employees. The Company changed its qualified retirement pension system to a defined benefit pension system on October 1, 2009.
Nippon Chemiphar Co., Ltd. | 37

The liability for employees’ retirement benefits at March 31, 2012 and 2011, comprised the following:
Millions of yen Thousands of U.S. dollars
2012 2011 2012 Projected benefit obligation ¥(4,913) ¥(4,958) $(59,820) Fair value of plan assets 3,291 3,367 40,071 Funded status (1,622) (1,591) (19,749) Unrecognized actuarial net loss 1,002 1,094 12,200 Unrecognized prior service cost (163) (181) (1,985) Reserve for employees’ retirement benefits ¥ (783) ¥ (678) $ (9,534)
The components of net periodic retirement benefit costs for the years ended March 31, 2012 and 2011, were as follows:
Millions of yen Thousands of U.S. dollars
2012 2011 2012 Service cost ¥450 ¥388 $5,479 Interest cost 75 105 913 Expected return on plan assets (84) (85) (1,023) Recognized actuarial loss 153 101 1,863 Amortization of prior service cost (17) (17) (207) Net periodic retirement benefit costs ¥577 ¥492 $7,025
Assumptions used for the years ended March 31, 2012 and 2011, were set forth as follows:
2012 2011 Discount rate 1.6% 1.6% Expected rate of return on plan assets 2.5% 2.5% Recognition period of actuarial gain/loss 11 years 11 years Recognition period of prior service cost 11 years 11 years
8. STOCK OPTIONS The stock option-related expense recognized and included in selling, general and administrative expenses for the year ended March 31, 2012 and 2011, are ¥2 million ($24 thousand) and ¥1 million, respectively. Following are details of the stock options the Company has as of March 31, 2012.
Number of grantees 6 directors 8 employees
Number of options Common stock—41,000 shares
Date of grant August 4, 2008
Exercisable period August 5, 2011—August 4, 2014
Exercise price ¥516 ($6.28)
Fair value at grant date ¥146 ($1.78)
38 | Annual Report 2012

The liability for employees’ retirement benefits at March 31, 2012 and 2011, comprised the following:
Millions of yen Thousands of U.S. dollars
2012 2011 2012 Projected benefit obligation ¥(4,913) ¥(4,958) $(59,820) Fair value of plan assets 3,291 3,367 40,071 Funded status (1,622) (1,591) (19,749) Unrecognized actuarial net loss 1,002 1,094 12,200 Unrecognized prior service cost (163) (181) (1,985) Reserve for employees’ retirement benefits ¥ (783) ¥ (678) $ (9,534)
The components of net periodic retirement benefit costs for the years ended March 31, 2012 and 2011, were as follows:
Millions of yen Thousands of U.S. dollars
2012 2011 2012 Service cost ¥450 ¥388 $5,479 Interest cost 75 105 913 Expected return on plan assets (84) (85) (1,023) Recognized actuarial loss 153 101 1,863 Amortization of prior service cost (17) (17) (207) Net periodic retirement benefit costs ¥577 ¥492 $7,025
Assumptions used for the years ended March 31, 2012 and 2011, were set forth as follows:
2012 2011 Discount rate 1.6% 1.6% Expected rate of return on plan assets 2.5% 2.5% Recognition period of actuarial gain/loss 11 years 11 years Recognition period of prior service cost 11 years 11 years
8. STOCK OPTIONS The stock option-related expense recognized and included in selling, general and administrative expenses for the year ended March 31, 2012 and 2011, are ¥2 million ($24 thousand) and ¥1 million, respectively. Following are details of the stock options the Company has as of March 31, 2012.
Number of grantees 6 directors 8 employees
Number of options Common stock—41,000 shares
Date of grant August 4, 2008
Exercisable period August 5, 2011—August 4, 2014
Exercise price ¥516 ($6.28)
Fair value at grant date ¥146 ($1.78)
Number of grantees 6 directors 5 employees
Number of options Common stock—72,000 shares
Date of grant August 2, 2011
Exercisable period August 3, 2014—August 2, 2017
Exercise price ¥332 ($4.04)
Fair value at grant date ¥85 ($1.03)
The assumptions used to measure the fair value of the Stock options of the Company granted for the year ended March 31, 2012. Estimation method: Dividend-modified Black-Scholes model with following assumptions: Volatility of stock price 39.4%
Estimated remaining outstanding period (in years)
4.5 years
Estimated dividend yield ¥3 ($0.04) per share
Risk free interest rate 0.34%
9. NET ASSETS Under Japanese laws and regulations, the entire amount paid for new shares is required to be designated as
common stock. However, a company may, by a resolution of the Board of Directors, designate an amount
not exceeding one-half of the price of the new shares as additional paid-in capital, which is included in
capital surplus.
Under the Japanese Companies Act (the Act), in cases where a dividend distribution of a surplus
is made, the smaller of an amount equal to 10% of the dividend or the excess, if any, of 25% of common
stock over the total of additional paid-in-capital and legal earnings reserve must be set aside as additional
paid-in-capital or legal earnings reserve. Legal earnings reserve is included in retained earnings in the
accompanying consolidated balance sheets.
Under the Act, legal earning reserve and additional paid in capital could be used to eliminate or
reduce a deficit or could be capitalized by resolution of the shareholders’ meeting.
Additional paid-in capital and legal earnings reserve may not be distributed as dividends.
However, all additional paid-in-capital and the entire legal earnings reserve may be transferred to other
capital surplus and retained earnings, respectively, which are potentially available for dividends.
The maximum amount that the Company can distribute as dividends is calculated based on the
non-consolidated financial statements of the Company in accordance with the Act.
Nippon Chemiphar Co., Ltd. | 39

10. LEASE TRANSACTIONS The Group leases certain equipment and other assets. Total lease payments for the years ended March 31, 2012 and 2011, were ¥82 million ($998 thousand) and ¥125 million, respectively. Pro forma information on leased property, such as acquisition cost, accumulated depreciation, obligation under finance leases, depreciation expense of finance leases that do not transfer ownership of the leased property to the lessee on an as-if-capitalized basis for the years ended March 31, 2012 and 2011, was as follows:
Millions of yen Thousands of U.S. dollars
2012 2011 2012 Acquisition cost:
Machinery, equipment and vehicles ¥ 46 ¥130 $ 560 Tools, furniture and fixtures 78 229 950 Other (software, etc.) 4 151 49
Total acquisition cost 128 510 1,559 Accumulated depreciation 106 406 1,291
Net leased property ¥ 22 ¥104 $ 268
The above acquisition cost includes related interest expenses as follows:
Millions of yen Thousands of U.S. dollars
2012 2011 2012 Obligations under finance leases:
Due within one year ¥18 ¥ 82 $219 Due after one year 4 22 49
Total ¥22 ¥104 $268
The above obligations under financed leases included related interest expenses. Lease obligations at March 31, 2012 and 2011 consisted of the following:
Millions of yen Thousands of U.S. dollars
2012 2011 2012 Lease obligations ¥ 572 ¥411 $ 6,964 Less current portion (136) (86) (1,656)
Less obligations, less current portion ¥ 436 ¥325 $ 5,308
The future minimum payments required at March 31, 2012, were as follows:
Years ending March 31 Millions of yen Thousands of U.S. dollars
2014 ¥126 $1,534 2015 104 1,266 2016 93 1,132 2017 61 743
40 | Annual Report 2012

10. LEASE TRANSACTIONS The Group leases certain equipment and other assets. Total lease payments for the years ended March 31, 2012 and 2011, were ¥82 million ($998 thousand) and ¥125 million, respectively. Pro forma information on leased property, such as acquisition cost, accumulated depreciation, obligation under finance leases, depreciation expense of finance leases that do not transfer ownership of the leased property to the lessee on an as-if-capitalized basis for the years ended March 31, 2012 and 2011, was as follows:
Millions of yen Thousands of U.S. dollars
2012 2011 2012 Acquisition cost:
Machinery, equipment and vehicles ¥ 46 ¥130 $ 560 Tools, furniture and fixtures 78 229 950 Other (software, etc.) 4 151 49
Total acquisition cost 128 510 1,559 Accumulated depreciation 106 406 1,291
Net leased property ¥ 22 ¥104 $ 268
The above acquisition cost includes related interest expenses as follows:
Millions of yen Thousands of U.S. dollars
2012 2011 2012 Obligations under finance leases:
Due within one year ¥18 ¥ 82 $219 Due after one year 4 22 49
Total ¥22 ¥104 $268
The above obligations under financed leases included related interest expenses. Lease obligations at March 31, 2012 and 2011 consisted of the following:
Millions of yen Thousands of U.S. dollars
2012 2011 2012 Lease obligations ¥ 572 ¥411 $ 6,964 Less current portion (136) (86) (1,656)
Less obligations, less current portion ¥ 436 ¥325 $ 5,308
The future minimum payments required at March 31, 2012, were as follows:
Years ending March 31 Millions of yen Thousands of U.S. dollars
2014 ¥126 $1,534 2015 104 1,266 2016 93 1,132 2017 61 743
11. INCOME TAXES The Group is subject to Japanese national and local income taxes which, in the aggregate, resulted in a normal effective statutory tax rate of approximately 38.0% and 40.7% for the years ended March 31, 2012 and 2011, respectively. The tax effects of significant temporary differences and tax loss carry forwards which resulted in deferred tax assets and liabilities at March 31, 2012 and 2011, were as follows:
Millions of yen Thousands of U.S. dollars
2012 2011 2012 Deferred tax assets:
Accrued enterprise tax ¥ 66 ¥ 57 $ 804 Accrued bonuses 255 256 3,105 Allowance for doubtful accounts 26 21 316 Provision for sales promotion expenses 120 126 1,461 Provision for retirement benefits 279 276 3,397 Provision for directors’ retirement benefits 104 113 1,266 Unrealized loss on available-for-sale securities ― 21 ― Other 494 554 6,015
Subtotal 1,344 1,424 16,364 Less valuation allowance (365) (399) (4,444)
Total 979 1,025 11,920 Deferred tax liabilities:
Unrealized gain on available-for-sale securities 11 ― 134 Deferred tax liabilities on revaluation of land 1,392 1,589 16,949
Total 1,403 1,589 17,083 Net deferred tax liabilities ¥ (424) ¥ (564) $ (5,163)
The reconciliation between the normal effective statutory tax rates and the actual effective tax rates reflected in the accompanying consolidated statements of income for the years ended March 31, 2012 and 2011, were as follows:
2012 2011 Normal effective statutory tax rate 40.7% 40.7% Expenses not deductible for income tax purposes 4.3 8.4 Per capita inhabitant tax 1.4 3.0 Change in valuation allowance 0.9 8.0 Research and development cost tax credit (4.8) (11.0) Reversal of deferred tax assets due to changes in the corporate income tax rate
2.8 ―
Other–net 1.4 4.8 Actual effective tax rate 46.7 53.9
Effect of changes in the corporate income tax rate Following the promulgation of the “Act for Partial Amendment of the Income Tax Act, etc. for the Purpose of Creating a Taxation System Responding to Changes in Economic and Social Structures” (Act No. 114,
Nippon Chemiphar Co., Ltd. | 41

2011) and the “Act on Special Measures for Securing Financial Resources Necessary to Implement Measures for Reconstruction following the Great East Japan Earthquake” (Act No. 117, 2011) on December 2, 2011, the corporate income tax rate will be lowered and a special restoration surtax will be imposed from fiscal years beginning on or after April 1, 2012.
Accordingly, the statutory tax rate used for the calculation of deferred tax assets and deferred tax liabilities is indicated below, showing dates of reversal owing to temporary differences and other factors. Temporary differences expected to be reversed from April 1, 2012 to March 31, 2015 – 38.0% Temporary differences expected to be reversed after March 31, 2015 – 35.6%
As a result of this change, deferred tax assets and deferred tax liabilities on revaluation of land
decreased by ¥75 million ($913 thousand) and ¥197 million ($2,399 thousand), respectively, and deferred income tax, valuation difference on available-for-sale securities and revaluation surplus of land increased by ¥76 million ($925 thousand), ¥2 million ($24 thousand) and ¥197 million ($2,399 thousand), respectively for the year ended March 31, 2012. 12. SELLING, GENERAL AND ADMINISTRATIVE EXPENSES Major components of selling, general and administrative expenses for the years ended March 31, 2012 and 2011, were as follows:
Millions of yen Thousands of U.S. dollars
2012 2011 2012 Advertising expenses ¥ 260 ¥ 249 $ 3,166 Sales promotion expenses 3,546 3,083 43,175 Traveling expenses 483 476 5,881 Salaries and allowances 3,662 3,725 44,588 Commissions 762 766 9,278 Research and development costs 1,791 1,879 21,807
13. LOSS ON DISASTER The amount of loss on disaster was primarily a result of expenses for repairs to plant and equipment of certain consolidated subsidiaries damaged in the Great East Japan Earthquake. 14. AMOUNTS PER SHARE Net assets per share at March 31, 2012 and 2011, and basic net income per share for the years then ended were as follows:
Yen U.S. dollars 2012 2011 2012
Net assets ¥248.92 ¥212.92 $3.0308 Basic net income 34.62 13.95 0.4215
Diluted net income per share has not been disclosed because the Company does not issue any potentially dilutive common stock equivalents.
42 | Annual Report 2012

The underlying data for the calculation of net income per share for the years ended March 31, 2012 and 2011, is summarized as follows:
Millions of yen Thousands of U.S. dollars
2012 2011 2012 Net income ¥ 1,440 ¥ 573 $17,533 Net income available for distribution to
shareholders of common stock 1,440 573 17,533
Weighted average number of shares of common stock outstanding (thousand shares)
41,585 41,094
15. CASH AND CASH EQUIVALENTS The reconciliation between cash and cash equivalents reported in the consolidated statements of cash flows and cash and time deposits reported in the consolidated balance sheets are as follows:
Millions of yen Thousands of U.S. dollars
2012 2011 2012 Cash and time deposits ¥6,677 ¥5,068 $81,298 Time deposits maturing over three months (79) (59) (962) Cash and cash equivalents ¥6,598 ¥5,009 $80,336
16. COMMITMENTS AND CONTINGENT LIABILITIES The Group had the following commitments and contingent liabilities at March 31, 2011 and 2010:
Millions of yen Thousands of U.S. dollars
2012 2011 2012 Trade notes discounted 907 994 11,043
17. COMPREHENSIVE INCOME “Accounting Standard for Presentation of Comprehensive Income” (ASBJ Statement No. 25, issued June 30, 2010) became effective for consolidated financial statements for the fiscal years ending on or after March 31, 2011.
2011) and the “Act on Special Measures for Securing Financial Resources Necessary to Implement Measures for Reconstruction following the Great East Japan Earthquake” (Act No. 117, 2011) on December 2, 2011, the corporate income tax rate will be lowered and a special restoration surtax will be imposed from fiscal years beginning on or after April 1, 2012.
Accordingly, the statutory tax rate used for the calculation of deferred tax assets and deferred tax liabilities is indicated below, showing dates of reversal owing to temporary differences and other factors. Temporary differences expected to be reversed from April 1, 2012 to March 31, 2015 – 38.0% Temporary differences expected to be reversed after March 31, 2015 – 35.6%
As a result of this change, deferred tax assets and deferred tax liabilities on revaluation of land
decreased by ¥75 million ($913 thousand) and ¥197 million ($2,399 thousand), respectively, and deferred income tax, valuation difference on available-for-sale securities and revaluation surplus of land increased by ¥76 million ($925 thousand), ¥2 million ($24 thousand) and ¥197 million ($2,399 thousand), respectively for the year ended March 31, 2012. 12. SELLING, GENERAL AND ADMINISTRATIVE EXPENSES Major components of selling, general and administrative expenses for the years ended March 31, 2012 and 2011, were as follows:
Millions of yen Thousands of U.S. dollars
2012 2011 2012 Advertising expenses ¥ 260 ¥ 249 $ 3,166 Sales promotion expenses 3,546 3,083 43,175 Traveling expenses 483 476 5,881 Salaries and allowances 3,662 3,725 44,588 Commissions 762 766 9,278 Research and development costs 1,791 1,879 21,807
13. LOSS ON DISASTER The amount of loss on disaster was primarily a result of expenses for repairs to plant and equipment of certain consolidated subsidiaries damaged in the Great East Japan Earthquake. 14. AMOUNTS PER SHARE Net assets per share at March 31, 2012 and 2011, and basic net income per share for the years then ended were as follows:
Yen U.S. dollars 2012 2011 2012
Net assets ¥248.92 ¥212.92 $3.0308 Basic net income 34.62 13.95 0.4215
Diluted net income per share has not been disclosed because the Company does not issue any potentially dilutive common stock equivalents.
Nippon Chemiphar Co., Ltd. | 43

Each component of other comprehensive income for the year ended March 31, 2012 was the following:
Thousands of Millions of yen U.S. dollars 2012 2012 Valuation difference on available-for-sale securities:
Gains arising during the year ¥ 93 $ 1,133 Reclassification adjustments to profit or loss 1 12 Amount before income tax effect 94 1,145 Income tax effect (33) (402)
Total 61 743 Revaluation surplus of land:
Surplus arising during the year ― ― Adjustments arising during the year ― ―
Amount before income tax effect ― ― Income tax effect 197 2,399
Total 197 2,399 Total other comprehensive income ¥ 258 $ 3,141
18. SEGMENT INFORMATION (1) Overview of reporting segments
The Companies’ reporting segments are composed of those individual business units for which separate financial information is available, about with the Board of Directors makes decisions regarding the allocation of management resources and for which operating performance can be evaluated, allowing them to be examined periodically.
The Company locates its operating division at its headquarters, formulates overall strategies for the products handled by the divisions and promotes the expansion of its operations. Accordingly, the Company has established “Pharmaceutical product business”, the operating division comprising its core segment, as its reporting division. The division of “Pharmaceutical product business” is engaged primarily in the manufacture and sale of pharmaceutical products.
(2) Methods of calculating sales, income or losses, assets, liabilities and other items by reporting segment
Methods of accounting for reported business segments are in principal the same as those indicated in Note 2 “Summary of Significant Accounting Policies”. Income or losses of reporting statements are based on ordinary income. Income or losses between segments and transfer amounts are based on market prices.
44 | Annual Report 2012

Each component of other comprehensive income for the year ended March 31, 2012 was the following:
Thousands of Millions of yen U.S. dollars 2012 2012 Valuation difference on available-for-sale securities:
Gains arising during the year ¥ 93 $ 1,133 Reclassification adjustments to profit or loss 1 12 Amount before income tax effect 94 1,145 Income tax effect (33) (402)
Total 61 743 Revaluation surplus of land:
Surplus arising during the year ― ― Adjustments arising during the year ― ―
Amount before income tax effect ― ― Income tax effect 197 2,399
Total 197 2,399 Total other comprehensive income ¥ 258 $ 3,141
18. SEGMENT INFORMATION (1) Overview of reporting segments
The Companies’ reporting segments are composed of those individual business units for which separate financial information is available, about with the Board of Directors makes decisions regarding the allocation of management resources and for which operating performance can be evaluated, allowing them to be examined periodically.
The Company locates its operating division at its headquarters, formulates overall strategies for the products handled by the divisions and promotes the expansion of its operations. Accordingly, the Company has established “Pharmaceutical product business”, the operating division comprising its core segment, as its reporting division. The division of “Pharmaceutical product business” is engaged primarily in the manufacture and sale of pharmaceutical products.
(2) Methods of calculating sales, income or losses, assets, liabilities and other items by reporting segment
Methods of accounting for reported business segments are in principal the same as those indicated in Note 2 “Summary of Significant Accounting Policies”. Income or losses of reporting statements are based on ordinary income. Income or losses between segments and transfer amounts are based on market prices.
(3) Reporting segments information of sales, profit(loss), assets, liabilities and other items for the
Companies as of and for the years ended March 31, 2012 and 2011 is summarized as follows:
Millions of yen 2012
Pharmaceutical
product business Other
business Total Adjustment Consolidated Sales: Sales to customers ¥27,326 ¥1,188 ¥28,514 ¥ ― ¥28,514 Intersegment sales 22 137 159 (159) ― Total sales 27,348 1,325 28,673 (159) 28,514 Segment profit (loss) 2,836 87 2,923 ― 2,923 Segment asset ¥26,065 ¥2,410 ¥28,475 ¥5,316 ¥33,791 Other: Depreciation 685 63 748 ― 748 Amortization of goodwill 173 ― 173 ― 173 Investments in affiliates 26 ― 26 ― 26 Increase in property, plant and equipment and intangible assets 754 261 1,015 ― 1,015
Thousands of U.S. dollars 2012
Pharmaceutical
product business Other
business Total Adjustment Consolidated Sales: Sales to customers $332,716 $14,465 $347,181 $ ― $347,181 Intersegment sales 268 1,668 1,936 (1,936) ― Total sales 332,984 16,133 349,117 (1,936) 347,181 Segment profit (loss) 34,531 1,059 35,590 ― 35,590 Segment assets $317,362 $29,344 $346,706 $ 64,727 $411,433 Other: Depreciation 8,341 767 9,108 ― 9,108 Amortization of goodwill 2,106 ― 2,106 ― 2,106 Investment in affiliates 317 ― 317 ― 317 Increase in property, plant and equipment and intangible assets 9,180 3,178 12,358 ― 12,358
Nippon Chemiphar Co., Ltd. | 45

Millions of yen 2011
Pharmaceutical
product business Other
business Total Adjustment Consolidated Sales: Sales to customers ¥26,205 ¥1,156 ¥27,361 ¥ ― ¥27,361 Intersegment sales 14 164 178 (178) ― Total sales 26,219 1,320 27,539 (178) 27,361 Segment profit (loss) 2,010 (11) 1,999 ― 1,999 Segment assets ¥24,295 ¥2,203 ¥26,498 ¥4,288 ¥30,786 Other: Depreciation 719 57 776 ― 776 Amortization of goodwill 152 ― 152 ― 152 Purchases of subsidiary company 18 ― 18 ― 18 Capital expenditures 549 35 584 ― 584
Additional information (4) Information about products and services
This information is omitted, as the sale of individual categories of products and services to outside customers accounts for more than 90% of net sales in the consolidated statements of income.
(5) Information about geographical areas This information of sales by geographical areas is omitted, as sales to outside Japanese customers account for more than 90% of net sales in the consolidated statements of income. There is no property, plant and equipment outside Japan, so this information is omitted.
(6) Information about major customers
Millions of yen Thousands of
U.S. dollars (Note 1)
Name of customer Related segments 2012 2011 2012
Mediceo corporation Pharmaceutical product business ¥5,765 ¥5,613 $70,194
Alfresa corporation Pharmaceutical product business ¥5,532 ¥5,320 $67,357
Toho Pharmaceutical Co., Ltd. Pharmaceutical product and other business ¥3,319 ¥3,283 $40,412
46 | Annual Report 2012
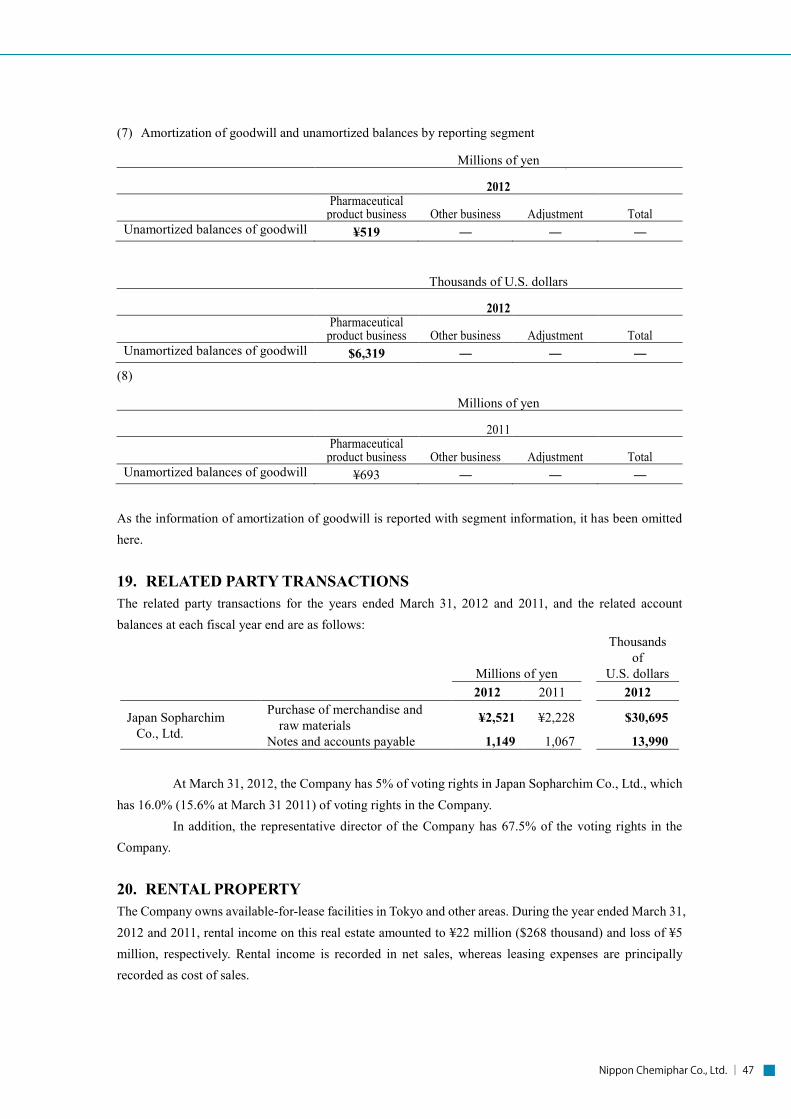
Millions of yen 2011
Pharmaceutical
product business Other
business Total Adjustment Consolidated Sales: Sales to customers ¥26,205 ¥1,156 ¥27,361 ¥ ― ¥27,361 Intersegment sales 14 164 178 (178) ― Total sales 26,219 1,320 27,539 (178) 27,361 Segment profit (loss) 2,010 (11) 1,999 ― 1,999 Segment assets ¥24,295 ¥2,203 ¥26,498 ¥4,288 ¥30,786 Other: Depreciation 719 57 776 ― 776 Amortization of goodwill 152 ― 152 ― 152 Purchases of subsidiary company 18 ― 18 ― 18 Capital expenditures 549 35 584 ― 584
Additional information (4) Information about products and services
This information is omitted, as the sale of individual categories of products and services to outside customers accounts for more than 90% of net sales in the consolidated statements of income.
(5) Information about geographical areas This information of sales by geographical areas is omitted, as sales to outside Japanese customers account for more than 90% of net sales in the consolidated statements of income. There is no property, plant and equipment outside Japan, so this information is omitted.
(6) Information about major customers
Millions of yen Thousands of
U.S. dollars (Note 1)
Name of customer Related segments 2012 2011 2012
Mediceo corporation Pharmaceutical product business ¥5,765 ¥5,613 $70,194
Alfresa corporation Pharmaceutical product business ¥5,532 ¥5,320 $67,357
Toho Pharmaceutical Co., Ltd. Pharmaceutical product and other business ¥3,319 ¥3,283 $40,412
(7) Amortization of goodwill and unamortized balances by reporting segment
Millions of yen
2012
Pharmaceutical
product business Other business Adjustment Total Unamortized balances of goodwill ¥519 ― ― ―
Thousands of U.S. dollars
2012
Pharmaceutical
product business Other business Adjustment Total Unamortized balances of goodwill $6,319 ― ― ―
(8)
Millions of yen
2011
Pharmaceutical
product business Other business Adjustment Total Unamortized balances of goodwill ¥693 ― ― ―
As the information of amortization of goodwill is reported with segment information, it has been omitted here. 19. RELATED PARTY TRANSACTIONS The related party transactions for the years ended March 31, 2012 and 2011, and the related account balances at each fiscal year end are as follows:
Millions of yen
Thousands of
U.S. dollars 2012 2011 2012
Japan Sopharchim Co., Ltd.
Purchase of merchandise and raw materials ¥2,521 ¥2,228 $30,695
Notes and accounts payable 1,149 1,067 13,990
At March 31, 2012, the Company has 5% of voting rights in Japan Sopharchim Co., Ltd., which has 16.0% (15.6% at March 31 2011) of voting rights in the Company. In addition, the representative director of the Company has 67.5% of the voting rights in the Company. 20. RENTAL PROPERTY The Company owns available-for-lease facilities in Tokyo and other areas. During the year ended March 31, 2012 and 2011, rental income on this real estate amounted to ¥22 million ($268 thousand) and loss of ¥5 million, respectively. Rental income is recorded in net sales, whereas leasing expenses are principally recorded as cost of sales.
Nippon Chemiphar Co., Ltd. | 47

Pursuant to the new accounting standard, information about fair value of rental property is disclosed as follows:
Millions of yen Thousands of U.S. dollars
2012 2011 2012 Carrying value at the beginning of year ¥741 ¥750 $ 9,022 Decrease of book value during the year 2 (8) 24 Carrying value at end of year 744 742 9,059 Fair value at end of year 552 573 6,721
(1) The carrying value represents the acquisition cost less accumulated depreciation. (2) Fair values as of March 31, 2012 and 2011, for principal properties are primarily real estate appraisal
values as determined by an outside real estate appraiser. For other properties, fair values are determined by the Company based on appraisal amounts and indices that are judged to reflect market values.
48 | Annual Report 2012

日本ケミファ株式会社 アニュアルレポート 2009
49
Pursuant to the new accounting standard, information about fair value of rental property is disclosed as follows:
Millions of yen Thousands of U.S. dollars
2012 2011 2012 Carrying value at the beginning of year ¥741 ¥750 $ 9,022 Decrease of book value during the year 2 (8) 24 Carrying value at end of year 744 742 9,059 Fair value at end of year 552 573 6,721
(1) The carrying value represents the acquisition cost less accumulated depreciation. (2) Fair values as of March 31, 2012 and 2011, for principal properties are primarily real estate appraisal
values as determined by an outside real estate appraiser. For other properties, fair values are determined by the Company based on appraisal amounts and indices that are judged to reflect market values.
Corporate Data
Head Office:
2-2-3, Iwamoto-cho, Chiyoda-ku, Tokyo 101-0032, Japan
Tel.: +81-3-3863-1211
Fax: +81-3-3864-5940
URL: http://www.chemiphar.co.jp
Other Offices:
Sapporo, Sendai, Tokyo, Yokohama, Kanetsu, Nagoya, Osaka, Hiroshima,
Fukuoka
Established: June 16, 1950
Capitalization:¥4,305 million
Employees: 682 (Consolidated)
Subsidiaries:
Nihon Pharmaceutical Industry Co., Ltd.
Safety Research Institute for Chemical Compounds Co., Ltd.
Affiliated Company:
Japan Sopharchim Co., Ltd.
Securities Exchange: Tokyo Stock Exchange (First Section)
Authorized Number of Shares: 154,000,000
Shares of Common Stock Issued: 42,614,205
Number of Stockholders: 6,568
(As of March 31, 2012)


Head Office: 2-2-3, Iwamoto-cho, Chiyoda-ku, Tokyo 101-0032, JapanTEL : +81-3-3863-1211 FAX : +81-3-3864-5940