Embed Size (px)
Citation preview

Top-performing urban school district in Florida
FY17 Mid-year Instructional ReviewMarch 1, 2017
Dr. Robert Avossa, SuperintendentDr. David Christiansen, Deputy Superintendent, Chief of Schools

Top-performing urban school district in Florida
• Principal Support Model• Data reviews• Principal Dashboard• Site visits
• Elementary School• Academics• Behavior • Climate
Instructional Review Agenda
• Middle School• Academics• Behavior • Climate
• High School• Academics• Behavior• Climate

Top-performing urban school district in Florida
The School District of Palm Beach County envisions a dynamic, collaborative multi-cultural community where education and life-long learning are valued and supported and all learners reach their highest potential to succeed in the global economy.
Our Vision
The School District of Palm Beach County is committed to providing a world-class education with excellence and equity to empower each student to reach his or her highest potential with the most effective staff to foster the knowledge, skills, and ethics required for responsible citizenship and productive careers.
Our Mission
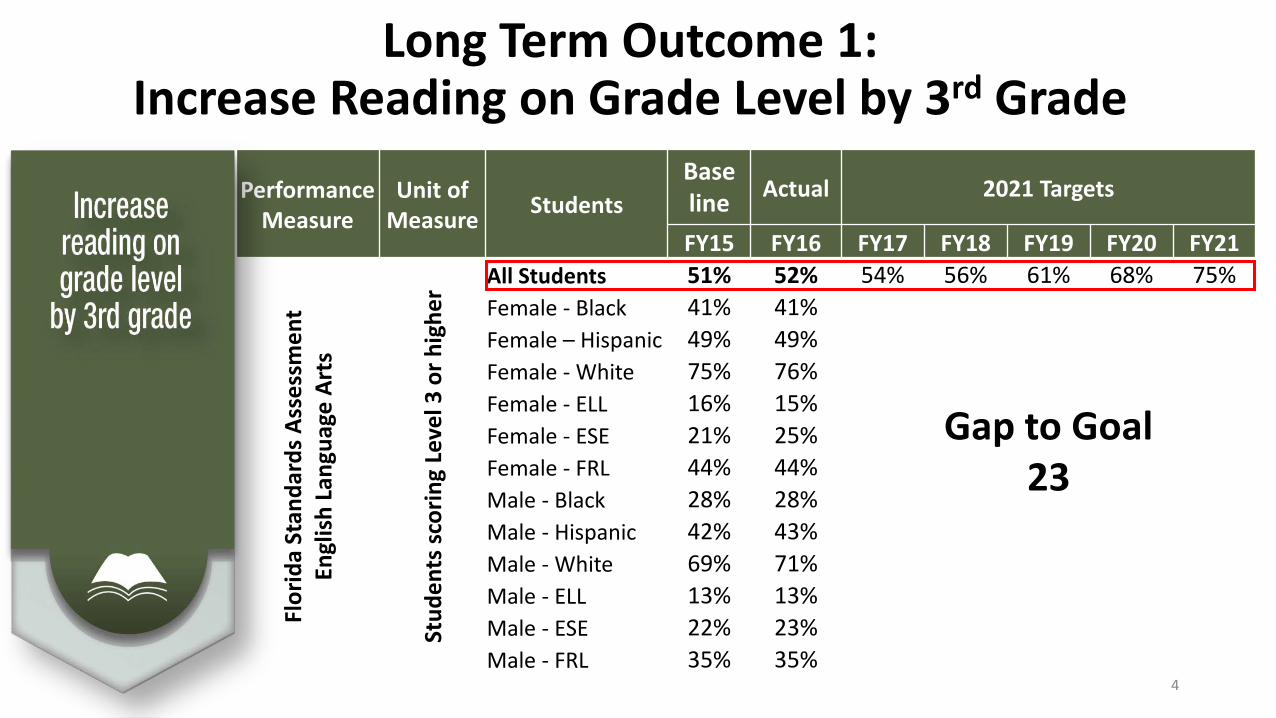
Long Term Outcome 1: Increase Reading on Grade Level by 3rd Grade
Performance Measure
Unit of Measure Students
Baseline Actual 2021 Targets
FY15 FY16 FY17 FY18 FY19 FY20 FY21
Flor
ida
Stan
dard
s As
sess
men
t En
glis
h La
ngua
ge A
rts
Stud
ents
sco
ring
Leve
l 3 o
r hig
her All Students 51% 52% 54% 56% 61% 68% 75%
Female - Black 41% 41%Female – Hispanic 49% 49%Female - White 75% 76%Female - ELL 16% 15%
Gap to Goal23
Female - ESE 21% 25%Female - FRL 44% 44%Male - Black 28% 28%Male - Hispanic 42% 43%Male - White 69% 71%Male - ELL 13% 13%Male - ESE 22% 23%Male - FRL 35% 35%
4

Long Term Outcome 2: Ensure High School Readiness
Performance Measure
Unit of Measure Students
Baseline Actual 2021 Targets
FY15 FY16 FY17 FY18 FY19 FY20 FY21Fl
orid
a St
anda
rds
Asse
ssm
ent
Engl
ish
Lang
uage
Art
s, M
ath,
Al
gebr
a 1,
Atte
ndan
ceSu
spen
sion
s
Stud
ents
sco
ring
Leve
l 3 o
r hig
her
Less
than
11
abse
nces
0 Su
spen
sion
Day
s (O
SS, I
SS)
All Students 54.4% 53.8% 56% 59% 63% 69% 75%Female - Black 43.8% 43.8%
Gap to Goal21
Female - Hispanic 52.8% 53.2%Female - White 72.5% 73.3%Female - ELL 32.2% 31.2%Female - ESE 31.1% 30.8%Female - FRL 45.8% 47.3%Male - Black 35.8% 34.5%Male - Hispanic 48.1% 46.9%Male - White 66.9% 65.8%Male - ELL 27.7% 26.5%Male - ESE 30.7% 30.9%Male - FRL 40.3% 39.2%
5

Long Term Outcome 3: Increase High School Graduation Rate Performance
MeasureUnit of
Measure StudentsBaseline Actual 2021 Targets
FY15 FY16 FY17 FY18 FY19 FY20 FY21
Fede
ral C
ohor
t Gra
duat
ion
Rate
Perc
ent o
f stu
dent
s gr
adua
ting
on
-tim
e w
ith st
anda
rd d
iplo
ma
All Students 85.3% 88.3% 86% 87% 88% 89% 90%Female - Black 79.9% 86.6%Female - Hispanic 86.0% 88.2%Female - White 93.5% 94.9%
Gap to Goal2
Female - ELL 59.7% 67.5%Female - ESE 76.9% 81.2%Female - FRL 81.0% 86.7%Male - Black 73.8% 79.9%Male - Hispanic 79.5% 84.1%Male - White 90.1% 92.4%Male - ELL 54.8% 60.4%Male - ESE 72.0% 78.8%Male - FRL 74.9% 80.4%
6

Long Term Outcome 4: Foster Postgraduate Success
Performance Measure
Unit of Measure Students
Baseline Actual 2021 Targets
FY15 FY16 FY17 FY18 FY19 FY20 FY21
AP/I
B/AI
CE/D
E, In
dust
ry C
ertif
icat
ion
Perc
ent o
f gra
duat
es
succ
essf
ul o
utco
me
All Students 66.6% 66.7% 68% 69% 74% 73% 75%Female - Black 52.6% 55.5%
Gap to Goal8
Female - Hispanic 68.8% 70.0%Female - White 80.8% 82.2%Female - ELL 44.6% 45.1%Female - ESE 31.7% 34.0%Female - FRL 57.2% 61.0%Male - Black 42.3% 44.0%Male - Hispanic 62.0% 58.6%Male - White 76.5% 74.0%Male - ELL 38.1% 33.7%Male - ESE 33.1% 31.7%Male - FRL 51.4% 51.4%
7
Top-performing urban school district in Florida
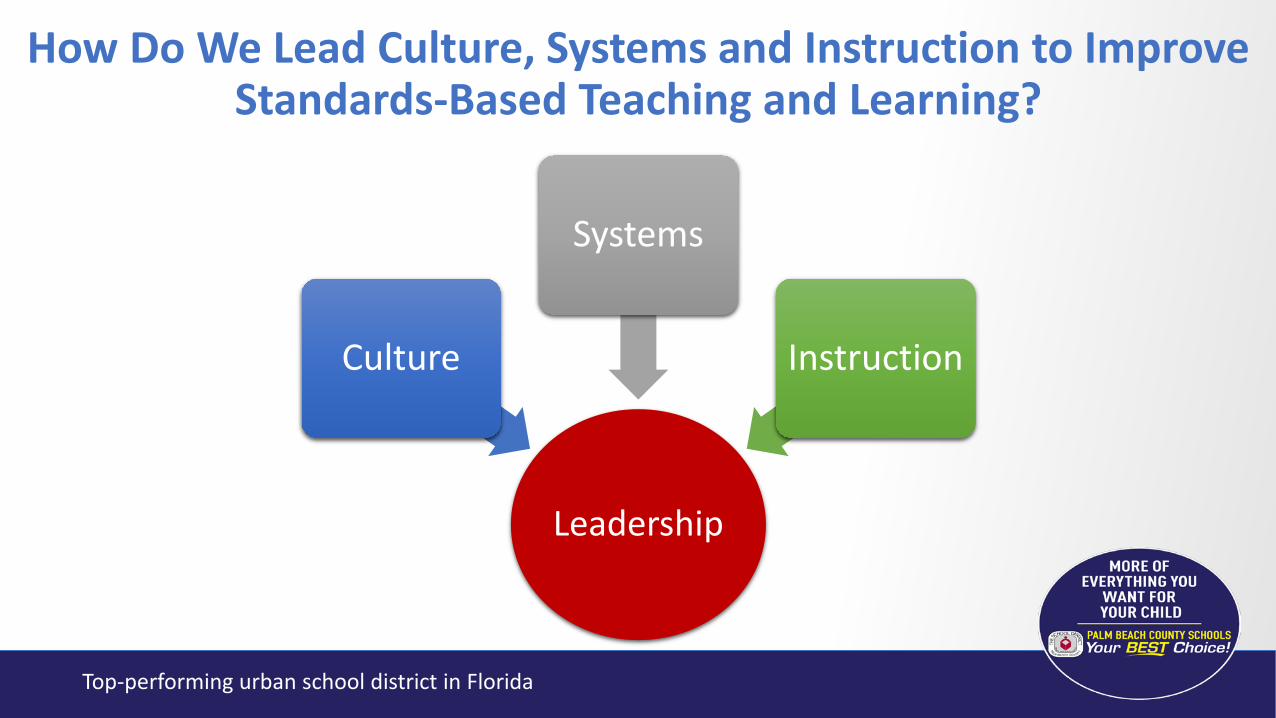
Leadership
Culture
Systems
Instruction
How Do We Lead Culture, Systems and Instruction to ImproveStandards-Based Teaching and Learning?

Culture
Systems
Instruction
Positive and Supportive school climate
High Performance CultureTalent
Development
Effective and Relevant instruction to meet the
needs of all students
#1 Pillars of Instruction
#6 Deliver Effective Instruction
#12 High Quality Candidates
#7 Single School Culture #13 Rigor in Selection
and Hiring Process
#14 Performance Management System
#9 Bullying Prevention
#2 Cultural Competence
High Quality Standards Based
Teaching & Learning
9
Top-performing urban school district in Florida
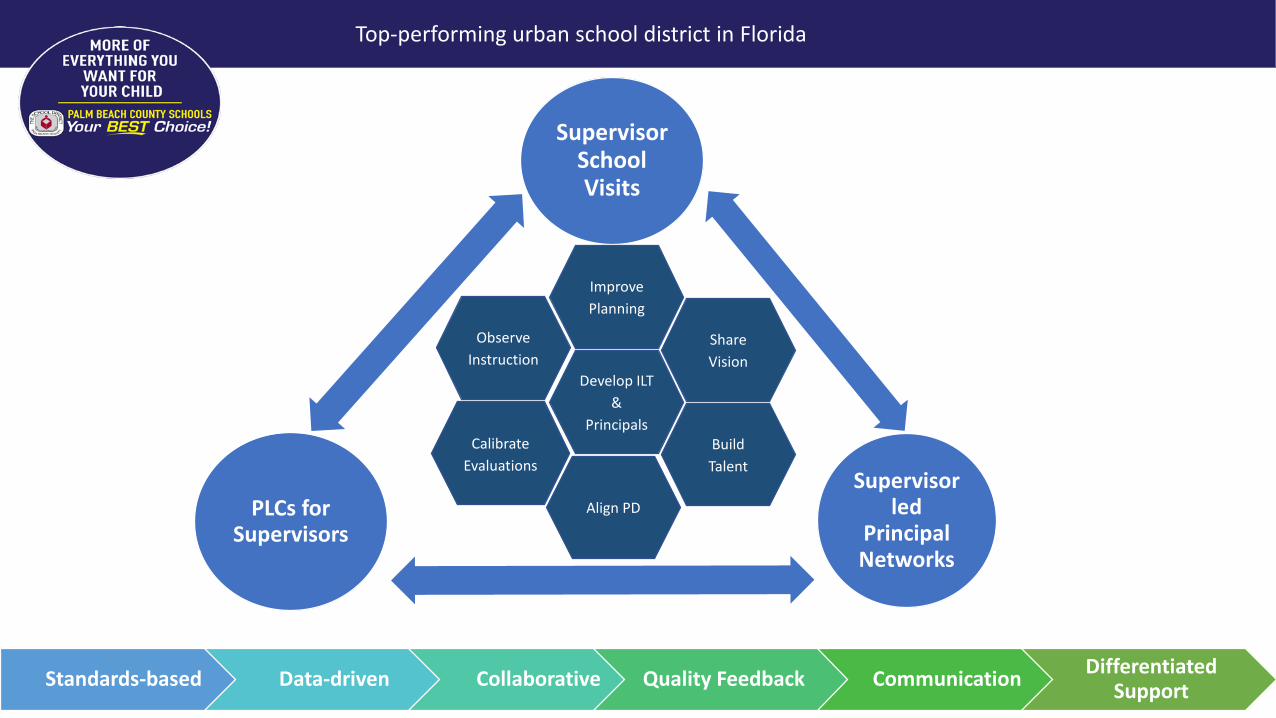
Supervisor School Visits
Supervisor led
Principal Networks
PLCs for Supervisors
Standards-based Data-driven Collaborative Quality Feedback Communication Differentiated Support
Observe Instruction
Develop ILT &
Principals Calibrate
Evaluations
Share Vision
Align PD
Improve Planning
Build Talent
Top-performing urban school district in Florida
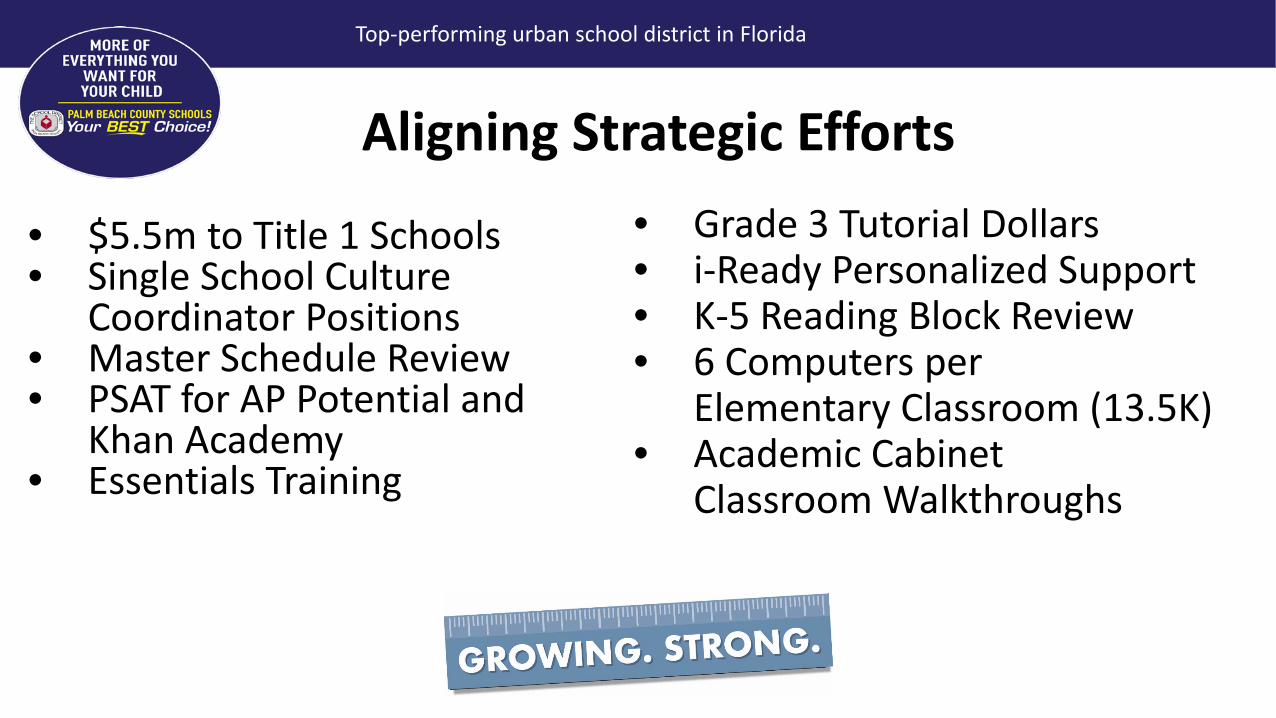
• $5.5m to Title 1 Schools• Single School Culture
Coordinator Positions• Master Schedule Review• PSAT for AP Potential and
Khan Academy• Essentials Training
Aligning Strategic Efforts• Grade 3 Tutorial Dollars• i-Ready Personalized Support• K-5 Reading Block Review• 6 Computers per
Elementary Classroom (13.5K)• Academic Cabinet
Classroom Walkthroughs
Top-performing urban school district in Florida
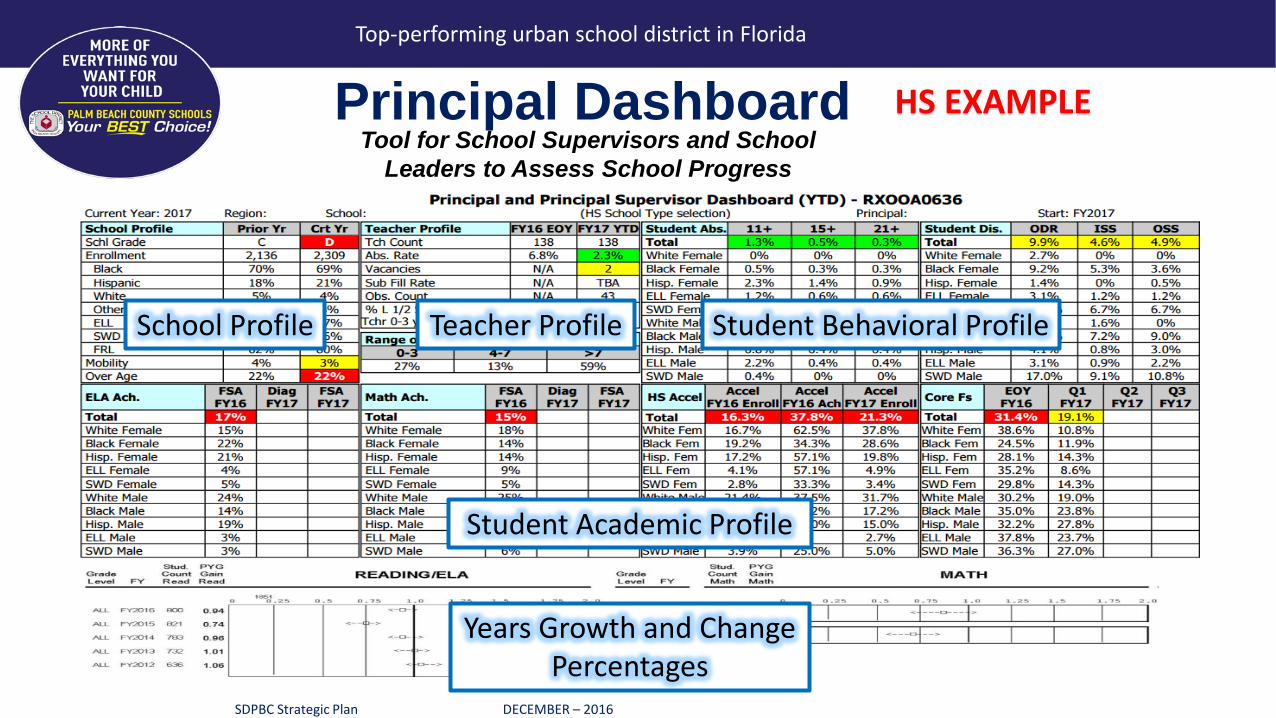
Principal Dashboard
School Profile
Student Academic Profile
Student Behavioral Profile
Years Growth and Change Percentages
Tool for School Supervisors and School Leaders to Assess School Progress
SDPBC Strategic Plan DECEMBER – 2016
HS EXAMPLE
Teacher Profile
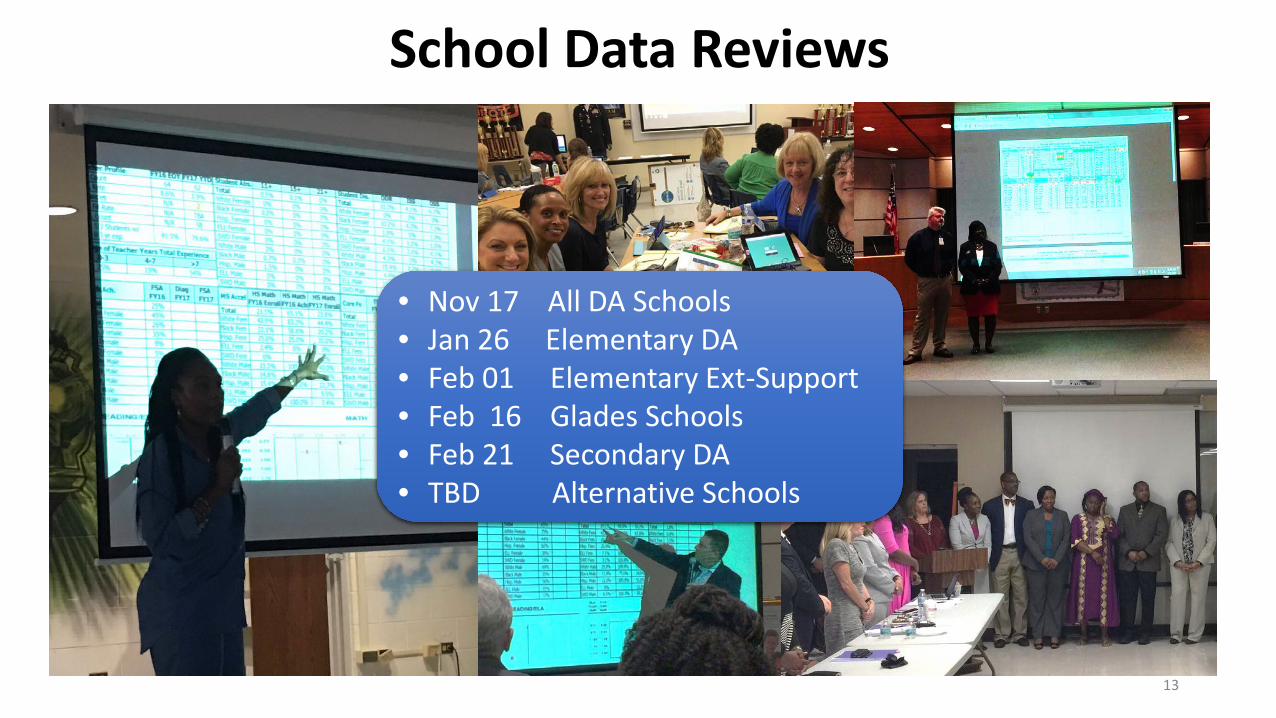
School Data Reviews
• Nov 17 All DA Schools• Jan 26 Elementary DA• Feb 01 Elementary Ext-Support• Feb 16 Glades Schools• Feb 21 Secondary DA• TBD Alternative Schools
13

Academic Cabinet Classroom Walks
• 11-29 Starlight Cove ES• 12-13 Pahokee Elementary• 01-31 Washington/Grove Park• 02-07 Highland Elementary
14

Top-performing urban school district in Florida
AcademicsBehavior Climate
ELEMENTARY SCHOOLS

Top-performing urban school district in Florida
DISTRICT DIAGNOSTIC ASSESSMENT
ACADEMICSELA, MATH, SCIENCE

FY2017 DA Elementary SchoolsSchool Name
FY14 Grade
FY15 Grade
FY16 Grade
PRIORITY - Turnaround Status: Planning Year 1Grove Park Elementary (N) B D FWashington Elementary (N) A D F
FOCUS DDD - Turnaround Status: Planning Year 2Dr. Mary McLeod Bethune Elementary (N) D F DLincoln Elementary (N) D F DWest Riviera Elementary (N) D F D
FOCUS DDGove Elementary (G) C D DOrchard View Elementary (S) C D D
FOCUS DLiberty Park Elementary (C) C C D
FORMER F Hope-Centennial Elementary (C) Former F, year 3 CNorthmore Elementary (N) Former F, year 2 CPioneer Park Elementary (G) Former F, year 2 C 17
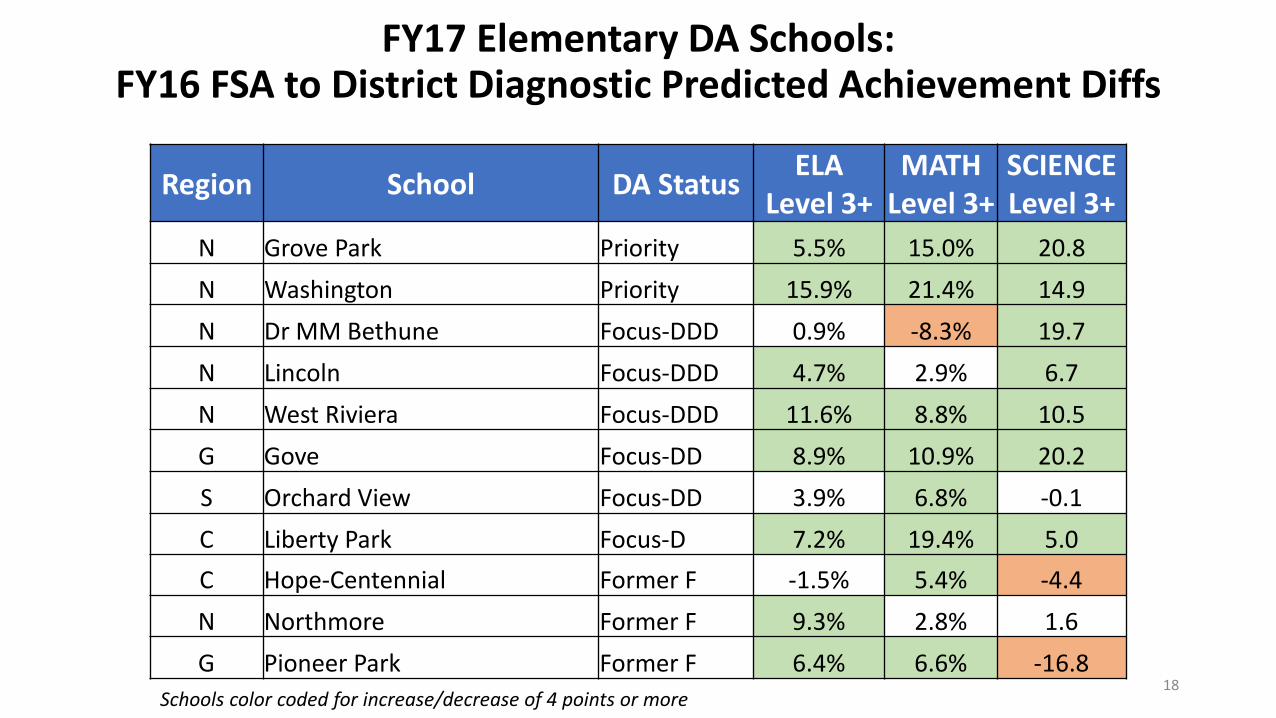
FY17 Elementary DA Schools:FY16 FSA to District Diagnostic Predicted Achievement Diffs
Region School DA Status ELALevel 3+
MATHLevel 3+
SCIENCELevel 3+
N Grove Park Priority 5.5% 15.0% 20.8N Washington Priority 15.9% 21.4% 14.9N Dr MM Bethune Focus-DDD 0.9% -8.3% 19.7N Lincoln Focus-DDD 4.7% 2.9% 6.7N West Riviera Focus-DDD 11.6% 8.8% 10.5G Gove Focus-DD 8.9% 10.9% 20.2S Orchard View Focus-DD 3.9% 6.8% -0.1C Liberty Park Focus-D 7.2% 19.4% 5.0C Hope-Centennial Former F -1.5% 5.4% -4.4N Northmore Former F 9.3% 2.8% 1.6G Pioneer Park Former F 6.4% 6.6% -16.8
Schools color coded for increase/decrease of 4 points or more18

FY17 Elementary Schools:FY16 FSA to District Diagnostic Predicted Achievement Diffs
REG SCHOOLELA L3+
MATH L3+
SCIENCE L3+ REG SCHOOL
ELA L3+
MATH L3+
SCIENCE L3+
N Acreage Pines -3.0% -18.1% 10.4S Addison Mizner -0.3% -1.7% 7.0N Allamanda 0.5% -4.9% -5.0S Banyan Creek -1.4% -0.6% 2.7S Barton 5.1% 3.0% 11.8N Beacon Cove Inter. -2.9% -1.3% -8.7G Belle Glade -1.8% 3.4% -2.5C Belvedere -0.4% -9.3% -5.0C Benoist Farms 1.3% 2.5% -5.6C Berkshire -3.8% -7.6% 13.2C Binks Forest -2.3% -4.8% -7.2S Boca Raton -1.7% 11.0% -17.2S Calusa -1.9% -6.7% -3.3C Cholee Lake 5.0% 0.5% 5.7S Citrus Cove -4.3% -4.1% -13.2C CO Taylor/Kirklane 2.3% -1.1% -5.2S Coral Reef 3.2% -2.2% 4.7S Coral Sunset 2.2% 0.6% 2.3S Crosspointe -2.2% -8.3% 5.7S Crystal Lakes -11.7% -2.6% 0.3
C Cypress Trails -5.7% 0.1% -6.4N DD Eisenhower -6.8% -9.0% 8.0S Del Prado -2.3% 1.3% 3.0S Diamond View 0.0% -11.5% -14.7C Discovery Key -4.0% -9.2% -3.9N Dr MM Bethune 0.9% -8.3% 19.7C Egret Lake -0.1% 7.4% 11.5C Elbridge Gale -2.0% 1.8% -6.3C Equestrian Trails -1.7% 0.8% 6.1C Everglades -1.0% 6.7% 0.0C Forest Hill 0.2% 4.8% -9.9S Forest Park 7.5% 10.2% 2.1S Freedom Shores -1.7% -6.6% -13.1N Frontier -1.4% -2.8% -5.2S Galaxy -0.4% 3.5% -8.6G Glade View 12.5% 1.1% 6.1N Golden Grove 1.4% -2.9% -10.3G Gove 8.9% 10.9% 20.2C Grassy Waters 3.1% 2.2% 14.3C Greenacres -2.9% 2.5% -19.519

FY17 Elementary Schools:FY16 FSA to District Diagnostic Predicted Achievement Diffs
REG SCHOOLELA L3+
MATH L3+
SCIENCE L3+ REG SCHOOL
ELA L3+
MATH L3+
SCIENCE L3+
N Grove Park 5.5% 15.0% 20.8S Hagen Road 1.3% 2.2% 19.6S Hammock Pointe -1.2% 2.4% 3.9C Heritage -3.2% 4.8% -16.4S Hidden Oaks -5.4% -5.5% -4.8C Highland -5.2% 5.6% -4.0C HL Johnson 4.0% -9.8% 12.4C Hope-Centennial -1.5% 5.4% -4.4S Indian Pines 5.9% 6.0% 12.8C Indian Ridge -6.3% -9.0% 35.2S JC Mitchell 3.0% 6.6% -4.8N Jerry Thomas -5.6% -6.4% 1.4N Jupiter 1.6% 0.0% -2.1N Jupiter Farms -2.2% -3.0% -14.4G KEC Canal Point 0.4% -5.2% -5.9N Lake Park 4.6% -7.3% -6.8S Lantana 9.3% -1.7% 15.1C Liberty Park 7.2% 19.4% 5.0N Limestone Creek -2.8% -3.8% -2.7N Lincoln 4.7% 2.9% 6.7
C Loxahatchee Groves 1.3% -5.1% -5.9S Manatee -2.1% -3.3% 0.3N Marsh Pointe -3.2% -2.2% -12.6C Meadow Park 1.4% 6.8% 25.9C Melaleuca -0.9% -8.4% -10.0S Morikami Park -5.1% -1.4% 3.9C New Horizons 0.1% -4.2% -13.9S North Grade 3.6% 7.6% -2.6N Northboro 7.9% -2.9% 3.6N Northmore 9.3% 2.8% 1.6S Orchard View 3.9% 6.8% -0.1G Pahokee 1.9% -0.2% 7.4N Palm Beach Gardens 0.0% -4.2% -8.1C Palm Beach Public 4.6% 2.1% 2.8C Palm Springs 0.1% -3.7% -15.3C Palmetto -3.8% -0.2% -6.6C Panther Run -2.7% -0.4% 20.7N Pierce Hammock -4.6% -9.3% -11.3S Pine Grove -2.2% -12.3% 6.0C Pine Jog -11.7% -10.9% -4.3G Pioneer Park 6.4% 6.6% -16.8
20
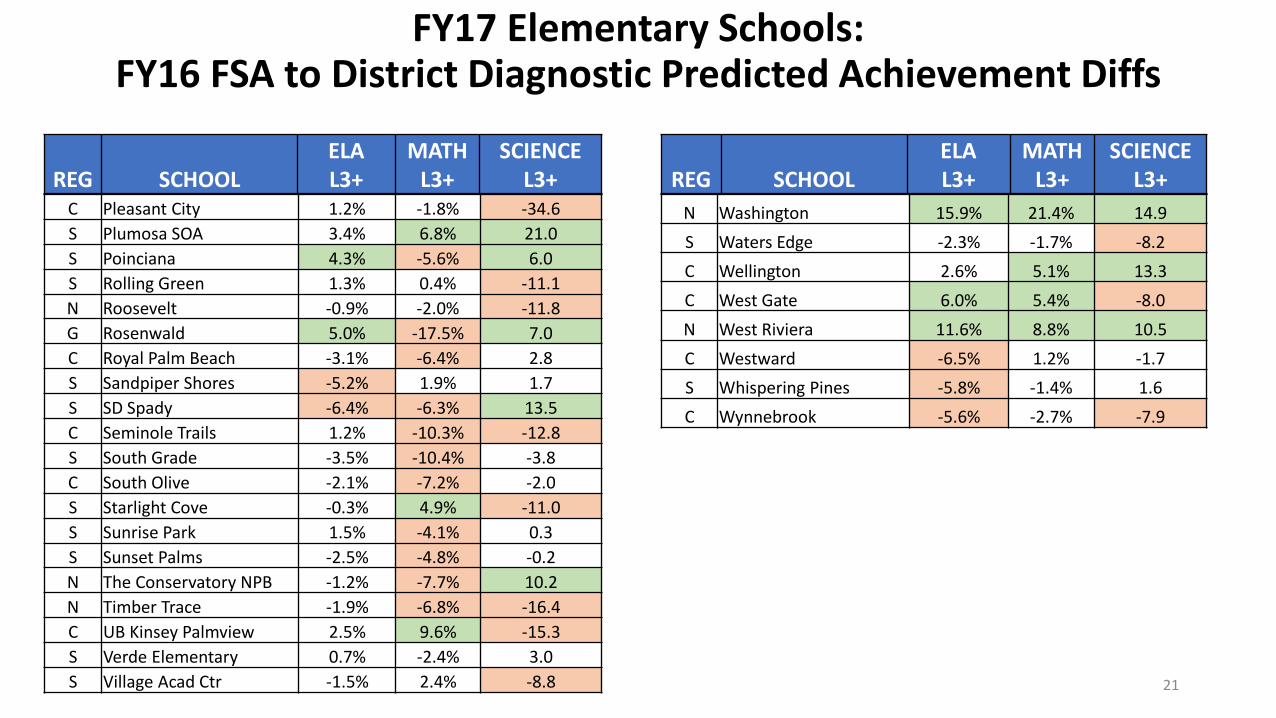
FY17 Elementary Schools:FY16 FSA to District Diagnostic Predicted Achievement Diffs
REG SCHOOLELA L3+
MATH L3+
SCIENCE L3+ REG SCHOOL
ELA L3+
MATH L3+
SCIENCE L3+
C Pleasant City 1.2% -1.8% -34.6S Plumosa SOA 3.4% 6.8% 21.0S Poinciana 4.3% -5.6% 6.0S Rolling Green 1.3% 0.4% -11.1N Roosevelt -0.9% -2.0% -11.8G Rosenwald 5.0% -17.5% 7.0C Royal Palm Beach -3.1% -6.4% 2.8S Sandpiper Shores -5.2% 1.9% 1.7S SD Spady -6.4% -6.3% 13.5C Seminole Trails 1.2% -10.3% -12.8S South Grade -3.5% -10.4% -3.8C South Olive -2.1% -7.2% -2.0S Starlight Cove -0.3% 4.9% -11.0S Sunrise Park 1.5% -4.1% 0.3S Sunset Palms -2.5% -4.8% -0.2N The Conservatory NPB -1.2% -7.7% 10.2N Timber Trace -1.9% -6.8% -16.4C UB Kinsey Palmview 2.5% 9.6% -15.3S Verde Elementary 0.7% -2.4% 3.0S Village Acad Ctr -1.5% 2.4% -8.8
N Washington 15.9% 21.4% 14.9S Waters Edge -2.3% -1.7% -8.2C Wellington 2.6% 5.1% 13.3C West Gate 6.0% 5.4% -8.0N West Riviera 11.6% 8.8% 10.5C Westward -6.5% 1.2% -1.7S Whispering Pines -5.8% -1.4% 1.6C Wynnebrook -5.6% -2.7% -7.9
21

Top-performing urban school district in Florida
OFFICE DISCIPLINE REFERRAL (ODR)IN SCHOOL SUSPENSION (ISS)
OUT OF SCHOOL SUSPENSION (OSS)
BEHAVIORSTUDENT DISCIPLINE

9.5
3.12.3
0.4
2
0.4
7.5
2.1 1.8
0.3
1.8
0.50.90.2 0.3 0.1 0.3 0.1
4.1
3
0.7 0.60
0.50.1
0
1
2
3
4
5
6
7
8
9
10
Male Female Male Female Male Female
Black Hispanic White
FY16 ODR FY17 ODR FY16 ISS FY17 ISS FY16 OSS FY17 OSS
FY16 - FY17 Elementary School Mid-year Discipline:ODR, ISS, OSS by Race/Gender
ODR – Office Discipline Referral, ISS – In School Suspension, OSS – Out of School Suspension
-2.0
-1.1
23

2.0 1.7
0.3 0.20.6 0.4
2.92.3
0.4 0.31.1 0.8
0
1
2
3
4
5
6
7
8
9
10
FY16 ODR FY17 ODR FY16 ISS FY17 ISS FY16 OSS FY17 OSS
ELL Non ELL
FY16 - FY17 Elementary School Mid-year Discipline:ODR, ISS, OSS by ELL/Non ELL
ODR – Office Discipline Referral, ISS – In School Suspension, OSS – Out of School Suspension 24
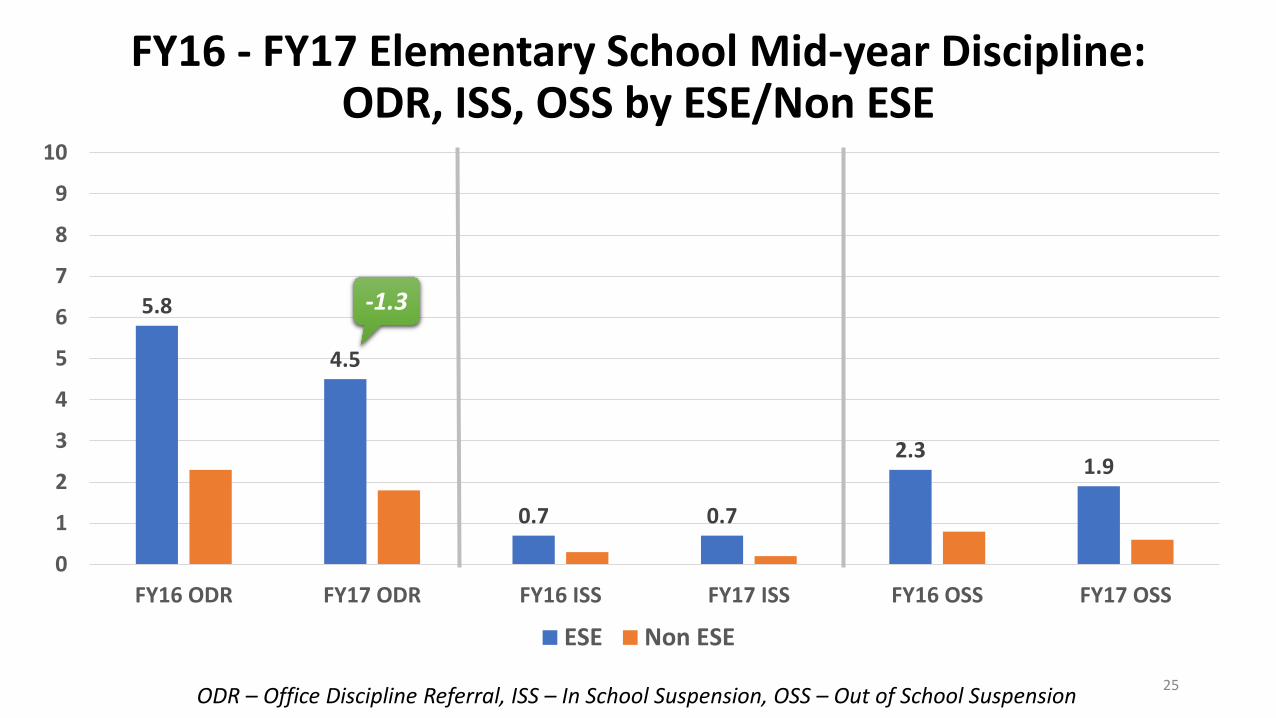
5.8
4.5
0.7 0.7
2.31.9
0
1
2
3
4
5
6
7
8
9
10
FY16 ODR FY17 ODR FY16 ISS FY17 ISS FY16 OSS FY17 OSS
ESE Non ESE
FY16 - FY17 Elementary School Mid-year Discipline:ODR, ISS, OSS by ESE/Non ESE
ODR – Office Discipline Referral, ISS – In School Suspension, OSS – Out of School Suspension
-1.3
25

Top-performing urban school district in Florida
11+ Absences15+ Absences21+ Absences
CLIMATECHRONIC STUDENT ABSENCES

FY16 - FY17 Elementary School Mid-year Chronic Absence:11+, 15+, 21+ Absences by Race/Gender
5.7%
6.9%
8.5% 8.2%
5.4%6.1%
2.2%3.1% 3.3% 3.1%
2.0% 2.0%
0.7%1.1% 1.0% 0.9% 0.5% 0.6%
0%
1%
2%
3%
4%
5%
6%
7%
8%
9%
10%
Female Male Female Male Female Male
Black Black Hispanic Hispanic White White
FY16 (11+) FY17 (11+) FY16 (15+) FY17 (15+) FY16 (21+) FY17 (21+)
+2.2 +1.7
27

5.7%
6.9%
2.2%2.7%
0.7% 0.8%
5.6%
7.1%
2.1% 2.5%
0.6% 0.6%
0%
1%
2%
3%
4%
5%
6%
7%
8%
9%
10%
FY16 (11+) FY17 (11+) FY16 (15+) FY17 (15+) FY16 (21+) FY17 (21+)
Non ELL ELL
FY16 - FY17 Elementary School Mid-year Chronic Absence:11+, 15+, 21+ Absences by Non ELL/ELL
+1.5
28

5.2%
6.4%
1.9% 2.4%
0.6% 0.6%
8.8%
10.3%
4.1%4.8%
1.6% 1.8%
0%
2%
4%
6%
8%
10%
12%
FY16 (11+) FY17 (11+) FY16 (15+) FY17 (15+) FY16 (21+) FY17 (21+)
Non ESE ESE
FY16 - FY17 Elementary School Mid-year Chronic Absence:11+, 15+, 21+ Absences by Non ESE/ESE
+1.5
29
Top-performing urban school district in Florida
AcademicsBehavior Climate
MIDDLE SCHOOLS

Top-performing urban school district in Florida
DISTRICT DIAGNOSTIC ASSESSMENTSACCELERATION
ACADEMICSELA, MATH, SCIENCE, CIVICS

FY2017 SDPBC DA Middle
Schools
School NameFY14
GradeFY15
Grade FY16
GradeFOCUS D
Carver Middle (S) C C DFORMER F
John F. Kennedy MS (N) Former F, year 2 CLake Shore MS (G) Former F, year 2 C
32

FY17 Middle DA Schools:FY16 FSA to District Diagnostic Predicted Achievement Diffs
SchoolELA
Level 3-5MATH
Level 3-5SCIENCELevel 3-5
CIVICSLevel 3-5
CARVER MIDDLE SCHOOL 8.8 10.1 5.6 10.8
JOHN F. KENNEDY MIDDLE 1.1 3.0 -17.0 14.5
LAKE SHORE MIDDLE 0.6 10.4 -11.3 -4.2Schools color coded for increase/decrease of 4 points or more
33

Schools color coded for increase/decrease of 4 points or more
FY17 Middle Non-DA Schools:FY16 FSA to District Diagnostic Predicted Achievement Diffs
Reg SchoolELA Level
3-5MATH
Level 3-5SCIENCE Level 3-5
CIVICS Level 3-5
N BAK MIDDLE SCHOOL OF THE ARTS -1.7 -3.4 0.4 -4.7N BEAR LAKES MIDDLE 8.3 0.5 2.4 9.2S BOCA RATON MIDDLE 0.9 -3.7 3.2 -6.7S CHRISTA MCAULIFFE MIDDLE -0.6 -0.8 3.2 3.9S CONGRESS MIDDLE 2.7 4.2 5.0 -0.2C CONNISTON MIDDLE -2.7 -6.0 2.2 -1.3C CRESTWOOD MIDDLE -2.5 1.1 -1.3 -0.2S DON ESTRIDGE HIGH TECH MIDDLE 2.6 -1.7 1.1 1.7S EAGLES LANDING MIDDLE -4.3 1.5 9.0 2.3C EMERALD COVE MIDDLE SCHOOL -10.5 -7.7 -5.5 -15.3N HOWELL L. WATKINS MIDDLE 0.0 -1.1 -6.3 6.8N INDEPENDENCE MIDDLE -3.0 -1.1 -1.4 -0.8C JEAGA MIDDLE SCHOOL 1.0 2.5 6.5 6.7N JUPITER MIDDLE SCHOOL -0.5 1.9 0.5 0.1C L C SWAIN MIDDLE SCHOOL 6.9 5.5 3.0 -6.2
34

Schools color coded for increase/decrease of 4 points or more
FY17 Middle DA Schools:FY16 FSA to District Diagnostic Predicted Achievement Diffs
Reg SchoolELA Level
3-5MATH
Level 3-5SCIENCE Level 3-5
CIVICS Level 3-5
C LAKE WORTH COMM MIDDLE -1.0 -3.8 -5.7 -2.5S LANTANA MIDDLE -10.7 -8.2 -7.9 13.7S LOGGERS RUN MIDDLE 3.9 1.9 2.2 1.8S ODYSSEY MIDDLE SCHOOL 4.8 -5.3 -15.2 0.2C OKEEHEELEE MIDDLE SCHOOL -4.0 -2.9 -0.3 -4.5S OMNI MIDDLE SCHOOL -5.6 -6.3 2.6 -9.7N OSCEOLA CREEK MIDDLE 2.1 2.3 -7.0 -7.5C PALM SPRINGS MIDDLE SCHOOL -3.8 -9.8 -7.4 -12.5C POLO PARK MIDDLE SCHOOL 0.1 -3.3 2.5 0.0N ROOSEVELT MIDDLE 8.6 11.7 -4.3 -0.3N THE CONSERVATORY SCHOOL - N P 5.2 -4.3 ---- 4.8C TRADEWINDS MIDDLE SCHOOL 6.3 6.6 -0.4 5.8N WATSON B. DUNCAN MIDDLE -1.9 -6.4 2.0 4.2C WELLINGTON LANDINGS MIDDLE -0.7 2.4 5.4 -2.6N WESTERN PINES MIDDLE 0.1 -4.8 0.2 2.2S WOODLANDS MIDDLE 0.0 -2.0 5.3 12.4
35

FY16 – FY17 Acceleration: Grade 8 Enrollment in High School Math Courses (Algebra 1, Geometry, Algebra 2)
FY16 Enrolled Grade 8 Students
FY16 Achievement of
Enrolled
FY17 Enrolled Grade 8 Students
FY16-FY17 DIFF
District 33% 88% 38% 5%White Female 48% 93% 53% 5%Black Female 26% 78% 28% 2%Hispanic Female 31% 87% 35% 4%White Male 42% 91% 48% 6%Black Male 18% 73% 21% 4%Hispanic Male 24% 89% 30% 6%
36

FY16 – FY17 Acceleration: Middle School Industry Certifications:FY14-FY16 Industry Certification Passing Rate
Students Enrolled in Industry Certification Courses*
0
725
2,584
1,844
0
500
1000
1500
2000
2500
3000
7th 8th
FY16 FY17
*Includes course enrollment for: 7th Grade: Fundamentals of Web and Software Development, Exploring IT Careers; 8th Grade: Emerging Tech in Business, Business Leadership Skills
# ICTaken
% ICPassed
FY14 1170 63%FY15 1288 64%FY16 1179 77%
37
Top-performing urban school district in Florida
OFFICE DISCIPLINE REFERRAL (ODR)IN SCHOOL SUSPENSION (ISS)
OUT OF SCHOOL SUSPENSION (OSS)
BEHAVIORSTUDENT DISCIPLINE
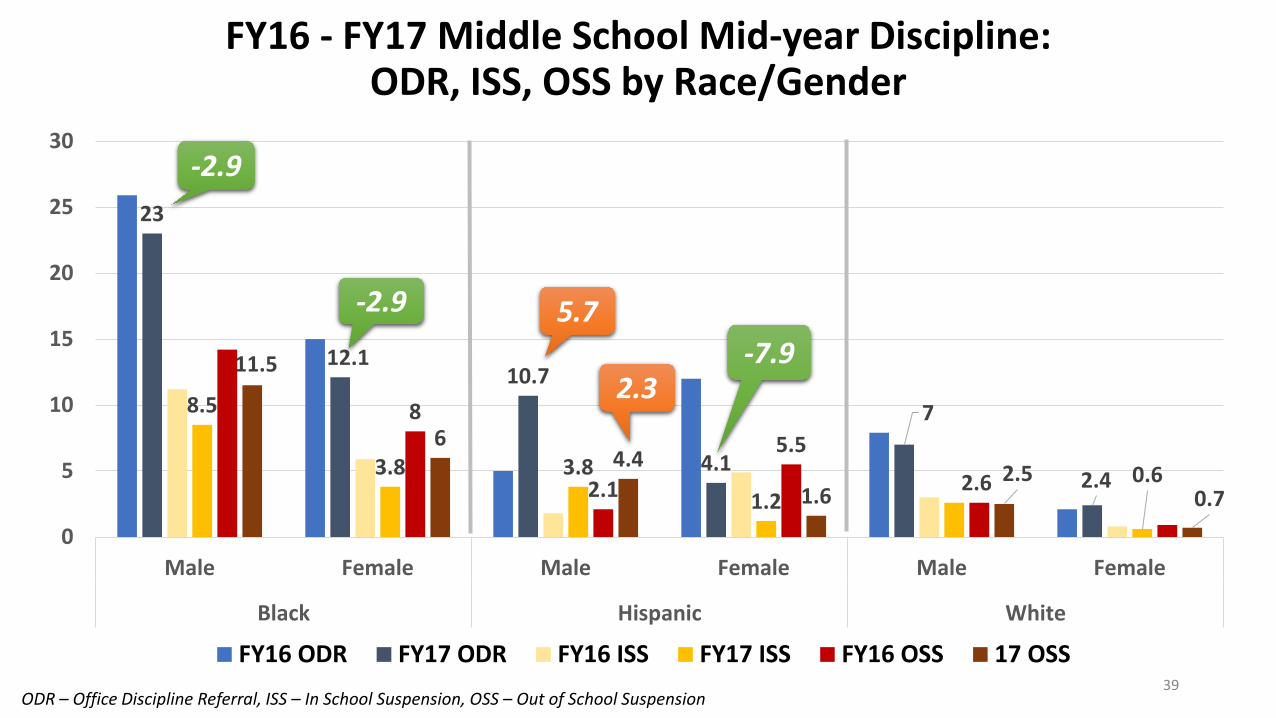
23
12.110.7
4.1
7
2.4
8.5
3.8 3.81.2
0.6
8
2.1
5.5
2.6
11.5
64.4
1.62.5
0.7
0
5
10
15
20
25
30
Male Female Male Female Male Female
Black Hispanic White
FY16 ODR FY17 ODR FY16 ISS FY17 ISS FY16 OSS 17 OSS
FY16 - FY17 Middle School Mid-year Discipline:ODR, ISS, OSS by Race/Gender
ODR – Office Discipline Referral, ISS – In School Suspension, OSS – Out of School Suspension
-2.9
-7.95.7-2.9
2.3
39

9.9 8.9
4.1 3.34.5 4.3
0
5
10
15
20
25
30
FY16 ODR FY17 ODR FY16 ISS FY17 ISS FY16 OSS FY17 OSS
ELL nonELL
FY16 - FY17 Middle School Mid-year Discipline:ODR, ISS, OSS by ELL/Non ELL
ODR – Office Discipline Referral, ISS – In School Suspension, OSS – Out of School Suspension 40

18.9
15.9
85.8
9.88
0
5
10
15
20
25
30
FY16 ODR FY17 ODR FY16 ISS FY17 ISS FY16 OSS FY17 OSS
SWD nonSWD
FY16 - FY17 Middle School Mid-year Discipline:ODR, ISS, OSS by ESE/Non ESE
ODR – Office Discipline Referral, ISS – In School Suspension, OSS – Out of School Suspension
-3.0
-2.2-1.8
41
Top-performing urban school district in Florida
11+ Absences15+ Absences21+ Absences
CLIMATECHRONIC STUDENT ABSENCES
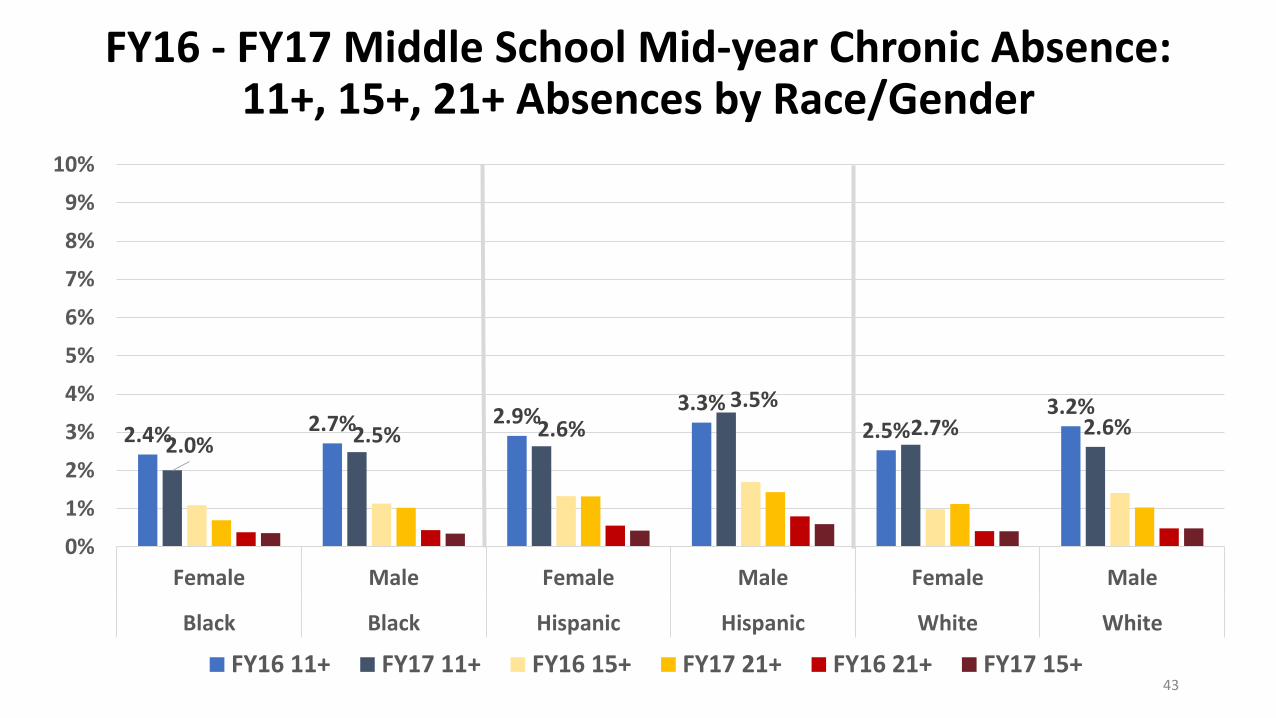
2.4% 2.7% 2.9% 3.3%2.5%
3.2%
2.0% 2.5% 2.6%3.5%
2.7% 2.6%
0%
1%
2%
3%
4%
5%
6%
7%
8%
9%
10%
Female Male Female Male Female Male
Black Black Hispanic Hispanic White White
FY16 11+ FY17 11+ FY16 15+ FY17 21+ FY16 21+ FY17 15+
FY16 - FY17 Middle School Mid-year Chronic Absence:11+, 15+, 21+ Absences by Race/Gender
43
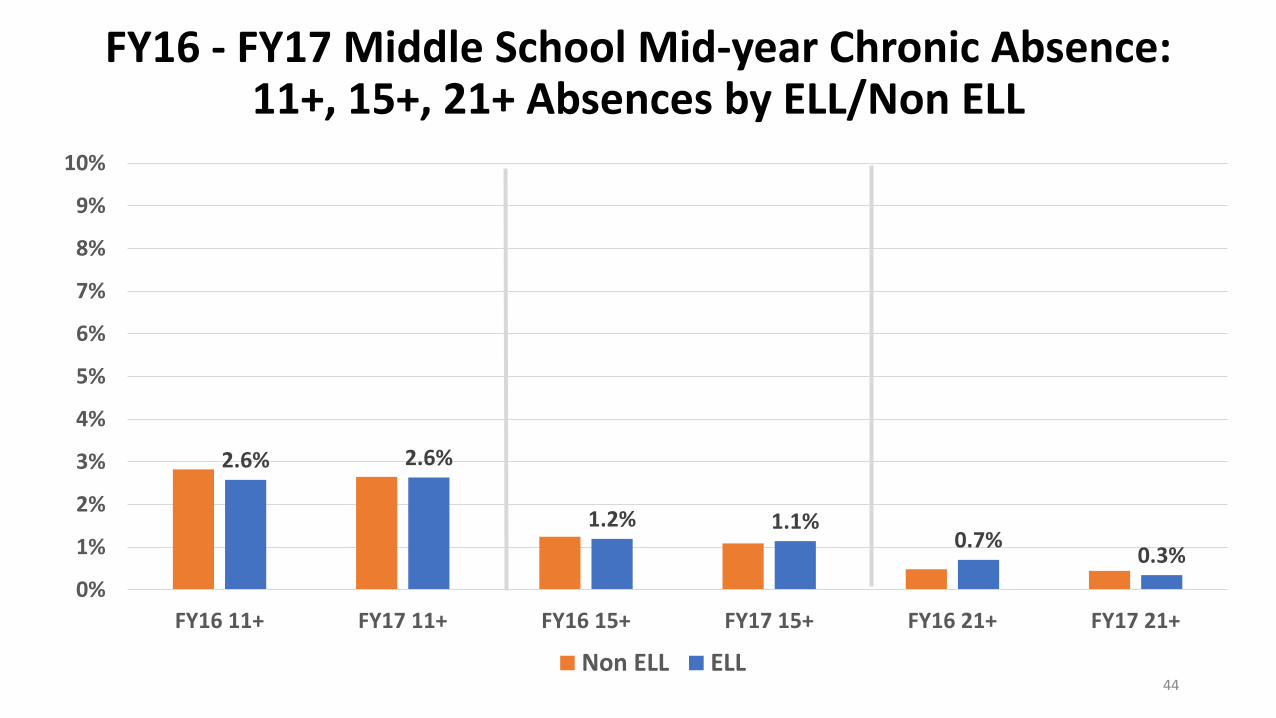
2.6% 2.6%
1.2% 1.1%0.7%
0.3%0%
1%
2%
3%
4%
5%
6%
7%
8%
9%
10%
FY16 11+ FY17 11+ FY16 15+ FY17 15+ FY16 21+ FY17 21+
Non ELL ELL
FY16 - FY17 Middle School Mid-year Chronic Absence:11+, 15+, 21+ Absences by ELL/Non ELL
44

4.7% 4.8%
2.2% 2.1%
0.9% 1.0%
0%
1%
2%
3%
4%
5%
6%
7%
8%
9%
10%
FY16 11+ FY17 11+ FY16 15+ FY17 15+ FY16 21+ FY17 21+
Non ESE ESE
FY16 - FY17 Middle School Mid-year Chronic Absence:11+, 15+, 21+ Absences by ESE/Non ESE
45

Top-performing urban school district in Florida
AcademicsBehavior Climate
HIGH SCHOOLS

Top-performing urban school district in Florida
LONG TERM OUTCOMEDISTRICT DIAGNOSTIC ASSESSMENTS
ACADEMICSELA, MATH, SCIENCE, US HISTORY

FY2017 SDPBC DA
High Schools
School NameFY14
GradeFY15
Grade FY16
GradeFOCUS D
Boynton Beach High (S) B C DPalm Beach Lakes High (N) C C D
48

Schools color coded for increase/decrease of 4 points or more
FY17 High Schools DA:FY16 FSA/EOC to District Predicted Achievement Diffs
School ELA% Level 3+
Algebra 1 % Level 3+
Geometry % Level 3+
Algebra 2 % Level 3+
Biology 1 % Level 3+
Boynton Beach High 6.4 4.4% 26.2% 0.6% -0.3%
Palm Beach Lakes High 10.2 2.0% 1.7% -6.2% 8.2%
49

FY17 High School Non DA:FY16 FSA to District Predicted Achievement Diffs
Reg School Algebra 1 Geometry Algebra 2 Biology 1% Level 3+ % Level 3+ % Level 3+ % Level 3+
S Atlantic High 2.3% -15.5% 5.0% -19.0%C AW Dreyfoos School of Arts 7.9% 1.8% -15.8% 3.3%S Boca Raton High -2.0% -1.4% 6.3% 4.0%C Forest Hill High -0.3% -7.8% -1.9% -6.0%G Glades Central High 16.5% 3.1% -2.2% -1.9%C John I Leonard High 9.7% -7.1% 7.7% 14.2%N Jupiter High -20.1% 7.1% 9.3% -1.3%C Lake Worth High 7.1% 6.0% -1.0% 7.7%S Olympic Heights High -3.3% 2.2% 6.8% -7.1%G Pahokee Middle/Senior High -21.5% -3.4% -2.6% -47.9%C Palm Beach Central High 4.2% 6.8% -0.8% -1.7%N Palm Beach Gardens High 3.5% 12.4% -4.0% 5.5%S Park Vista Comm High 0.2% -5.7% -4.0% -1.7%C Royal Palm Beach High 13.1% -16.0% 4.6% 2.7%S Santaluces High 4.9% 0.1% -12.8% 0.1%N Seminole Ridge Comm High 13.2% 4.3% -3.8% 2.9%S Spanish River High 1.1% -4.6% -9.1% 4.7%N Suncoast High 9.3% 3.1% -15.4%S Village Acad Ctr -23.7% 18.6% 5.9% 16.4%C Wellington High 0.8% -1.3% -10.2% -5.9%S West Boca Raton Comm High 9.3% -5.5% -5.6% -9.3%N W T Dwyer High -2.7% 3.9% -6.1% 1.4%
50

Top-performing urban school district in Florida
OFFICE DISCIPLINE REFERRAL (ODR)IN SCHOOL SUSPENSION (ISS)
OUT OF SCHOOL SUSPENSION (OSS)
BEHAVIORSTUDENT DISCIPLINE

21.5
13.510.8
6.59
4.9
18.7
11.49.9
5
9
4.3
0
5
10
15
20
25
30
Male Female Male Female Male Female
Black Black Hispanic Hispanic White White
FY16 ODR FY17 ODF FY16 ISS FY17 ISS FY16 OSS FY17 OSS
FY16 - FY17 High School Mid-year Discipline:ODR, ISS, OSS by Race/Gender
ODR – Office Discipline Referral, ISS – In School Suspension, OSS – Out of School Suspension
-2.8
-2.1
52

8 7.5
2.1 1.8 2.1 2.4
0
5
10
15
20
25
30
FY16 ODR FY17 ODR FY16 ISS FY17 ISS FY16 OSS FY17 OSS
ELL Non ELL
FY16 - FY17 High School Mid-year Discipline:ODR, ISS, OSS by ELL/Non ELL
ODR – Office Discipline Referral, ISS – In School Suspension, OSS – Out of School Suspension53

15 14.8
5.8 4.96.1 5.9
0
5
10
15
20
25
30
FY16 ODR FY17 ODR FY16 ISS FY17 ISS FY16 OSS FY17 OSS
ESE Non ESE
FY16 - FY17 High School Mid-year Discipline:ODR, ISS, OSS by ESE/Non ESE
ODR – Office Discipline Referral, ISS – In School Suspension, OSS – Out of School Suspension 54

Top-performing urban school district in Florida
11+ Absences15+ Absences21+ Absences
ACCELERATION & OPPORTUNITY
CLIMATECHRONIC STUDENT ABSENCES

3.1% 3.4% 3.3% 3.6%
2.3% 2.5%2.4% 2.9% 3.2% 3.4%
2.5%2.7%
0%
1%
2%
3%
4%
5%
6%
7%
8%
9%
10%
Female Male Female Male Female Male
Black Black Hispanic Hispanic White White
FY16 11+ FY17 11+ FY16 15+ FY17 15+ FY16 21+ FY17 21+
FY16 - FY17 High School Mid-year Chronic Absence:11+, 15+, 21+ Absences by Race/Gender
56
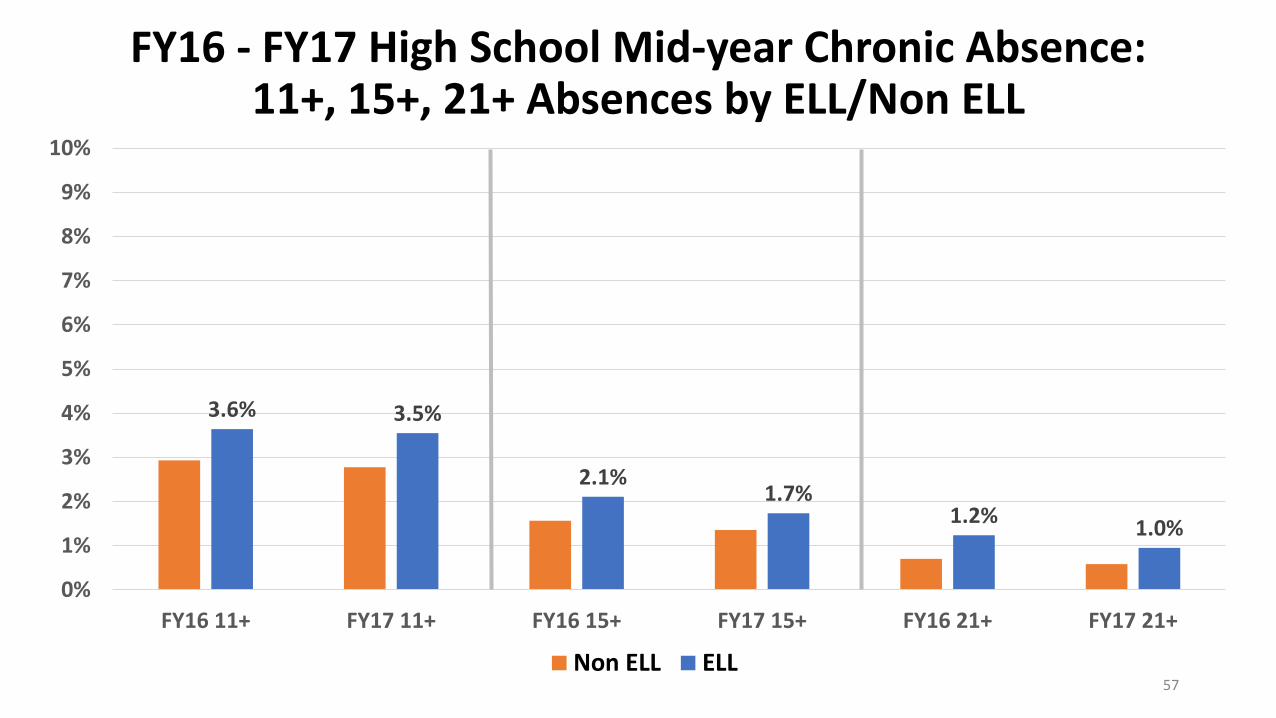
3.6% 3.5%
2.1%1.7%
1.2% 1.0%
0%
1%
2%
3%
4%
5%
6%
7%
8%
9%
10%
FY16 11+ FY17 11+ FY16 15+ FY17 15+ FY16 21+ FY17 21+
Non ELL ELL
FY16 - FY17 High School Mid-year Chronic Absence:11+, 15+, 21+ Absences by ELL/Non ELL
57

5.7%4.9%
3.3%2.6%
1.4% 1.2%
0%
1%
2%
3%
4%
5%
6%
7%
8%
9%
10%
FY16 11+ FY17 11+ FY16 15+ FY17 15+ FY16 21+ FY17 21+
Non ESE ESE
FY16 - FY17 High School Mid-year Chronic Absence:11+, 15+, 21+ Absences by ESE/Non ESE
58

FY10 – FY16 SDPBC Industry Certification (IC) Tests:Number of Tests Taken & Passed
*FY15 State board rule: 20 days between testing, only 3 attempts in a school year
7201
8916
6430 72
34
1104
9
1169
6 1425
9
3288 45
84
4923 56
50
8869
7625
1054
3
46%
51%
77% 78% 80%65%
74%
0%
10%
20%
30%
40%
50%
60%
70%
80%
90%
100%
0
2,000
4,000
6,000
8,000
10,000
12,000
14,000
16,000
FY10 FY11 FY12 FY13 FY14 FY15 FY16
# IC Taken # IC Passed Pass Rate
*
59

FY16-FY17 Grade 9-12 Accelerated Course Enrollment:Students Enrolled in 1 or More Accelerated Courses
28.5%
17.2%
39.9%
28.4%
57.0%
42.8%
33.7%
21.7%
47.4%
35.2%
61.7%
47.7%
0%
10%
20%
30%
40%
50%
60%
70%
80%
90%
100%
Black - Female Black - Male Hispanic - Female Hispanic - Male White - Female White - Male
FY16 FY17
+5.2
+4.5
+7.5
+6.8
+4.7
+4.9
60

FY16-FY17 Grade 11-12 Accelerated Course Enrollment:AP Potential Opportunity Gaps
20% 16%
26% 23%
38% 35%
19%14%
24%20%
38%34%
59%
47%
72%
58%
77%
66%64%
51%
77%
64%
82%74%
0%
10%
20%
30%
40%
50%
60%
70%
80%
90%
100%
Black Female Black Male Hispanic Female Hispanic Male White Female White Male
Potential % FY16 Potential % FY17 AP/IB/AICE/DE % FY16 AP/IB/AICE/DE % FY17
+5+4
+5+6
+5+6
% Students w/ Potential for Success
% Studentsw/ Potential
Enrolled
61

Top-performing urban school district in Florida
QUESTIONS/DISCUSSION


![FY17 2nd Quarter Financial Results [IFRS] · 2. FY17 2nd Quarter Financial Results [IFRS] 1. FY17 Q1-Q2 (Highlights) 4. Reference. 3. FY17 Outlook . 2.Status of Progress on the Mid-Term](https://img.dokumen.tips/doc/110x75/5f1e629b38af5e5e6a417bd6/fy17-2nd-quarter-financial-results-ifrs-2-fy17-2nd-quarter-financial-results.jpg)