Embed Size (px)
Citation preview
Western Oregon University
Wheaton College (MA)
Whitworth University
Widener University
Wilkes University
Williams College
Worcester Polytechnic Institute
Worcester State College
Wright State University
Xavier University
Yeshiva University
Youngstown State University
FY14 Customer Satisfaction SurveyNova Southeastern University
Customer Satisfaction Survey
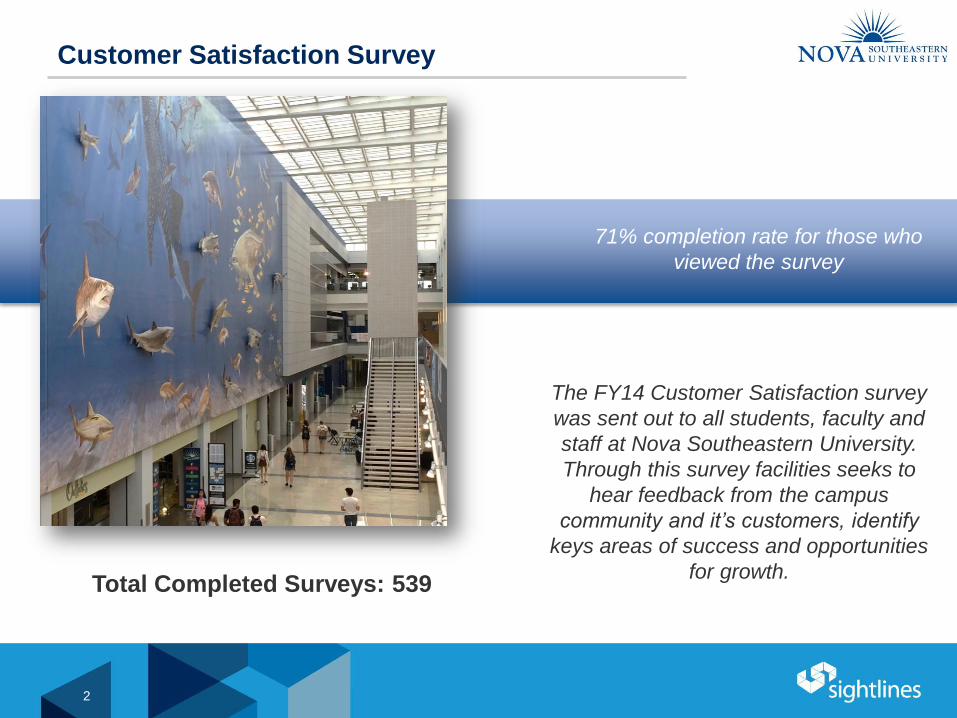
Total Completed Surveys: 539
The FY14 Customer Satisfaction survey
was sent out to all students, faculty and
staff at Nova Southeastern University.
Through this survey facilities seeks to
hear feedback from the campus
community and it’s customers, identify
keys areas of success and opportunities
for growth.
71% completion rate for those who
viewed the survey
2

Survey Demographics
40%46%
20%17%
39% 35%
0%
10%
20%
30%
40%
50%
60%
70%
80%
90%
100%
2012 2014
Type of User
Staff Faculty Student Other
0-557%6-10
21%
11-1510%
16-206% 20+
6%
Number of Years on campus
NSU sees a strong distribution of respondents of type of users
from campus community. However, majority of responses,
77% are driven by main campus.
Most recent survey attracted more staff at 46%.
Majority of respondents have spent 0-5 years at NSU.
Main77%
East4%
NMB5%
Ocean2%
Other12%
Campus Response
3

Top 10 Main Campus Buildings Where
Respondents Spend the Most Time
66
46 45
38
3028
1917 17 17
0
10
20
30
40
50
60
70
# R
es
po
nd
en
ts
4

Top 10 East, NMB and Ocean Campus Buildings
Where Respondents Spend the Most Time
25
23
9
4 42 2 1 1 1
0
5
10
15
20
25
30
# R
es
po
nd
en
ts
5

Campus Condition

Building Condition & Cleanliness
4.1
4.3 4.3 4.4 4.3
4.1
1
2
3
4
5
A B C D E F
Ave
rag
e V
alu
e o
f R
es
po
ns
es
A = General appearance of the exterior of buildings
B = General repair of the building interior (i.e. wall, floors, ceiling)
C = General repair of the furnishings of interior space
D = Cleanliness of interior spaces
E = Cleanliness of restrooms
F = Availability of consumable resources in restrooms (paper products, soap, etc.)
General Repair Cleanliness
Very Poor
Poor
Fair
Good
Excellent
7
Note: these questions were not asked in the FY12 survey
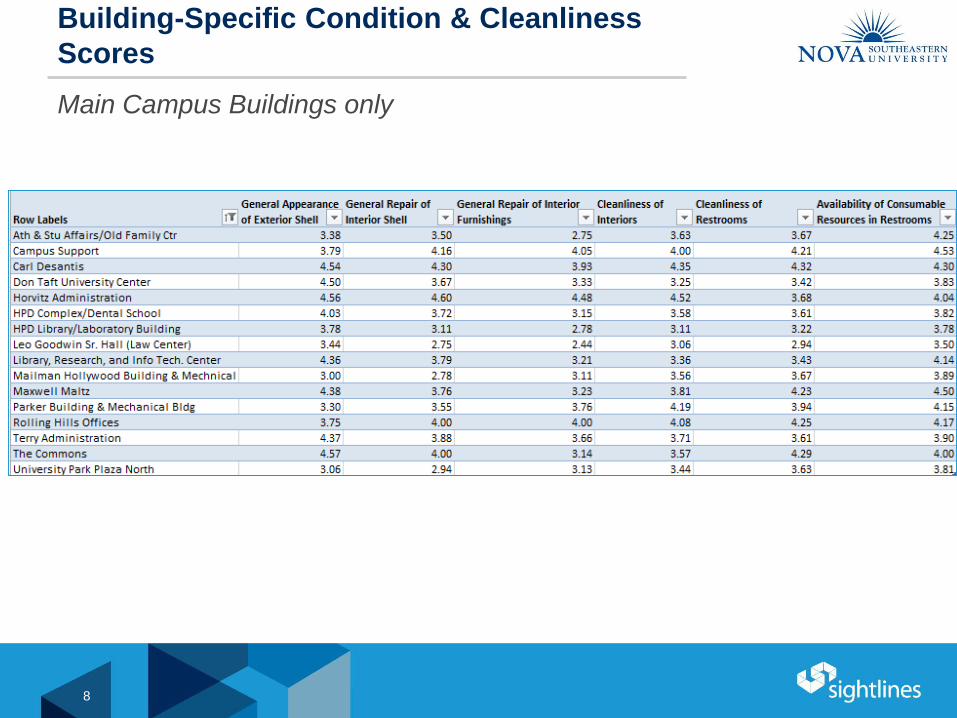
Building-Specific Condition & Cleanliness
Scores
Main Campus Buildings only
8

Building Comfort
3.33.5 3.6
3.4 3.4
1
2
3
4
5
A B C D E
Ave
rag
e V
alu
e o
f R
es
po
ns
es
A =Temperature is frequently at a reasonable level
B=The air quality in my building is good
C=My building is free of undesirable odors
D=My building is free of distracting noises
E=Water fountains in my buildings are of good quality
Very Poor
Poor
Fair
Good
Excellent
9
Note: these questions were not asked in the FY12 survey

Building-Specific Comfort Scores
Main Campus Buildings only
10
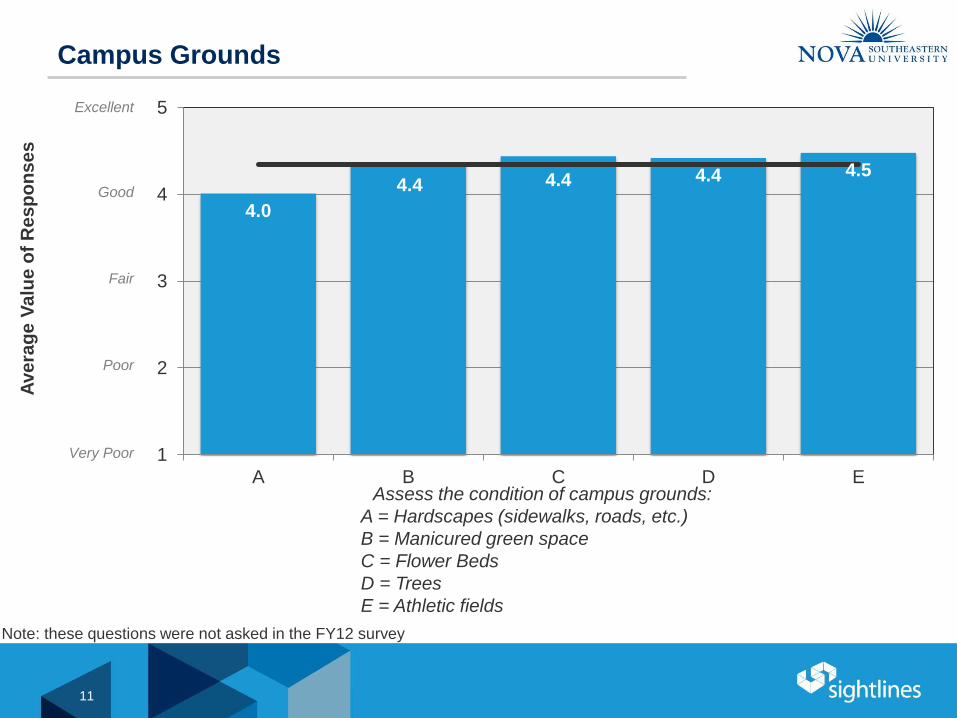
Campus Grounds
4.0
4.4 4.4 4.4 4.5
1
2
3
4
5
A B C D E
Ave
rag
e V
alu
e o
f R
es
po
ns
es
Assess the condition of campus grounds:
A = Hardscapes (sidewalks, roads, etc.)
B = Manicured green space
C = Flower Beds
D = Trees
E = Athletic fields
Very Poor
Poor
Fair
Good
Excellent
11
Note: these questions were not asked in the FY12 survey

Comparing Scores
1
2
3
4
5
General Repair Cleanliness Grounds
Campus Appearance
Sightlines Inspection Peers Inspection Customer Satisfaction Results
When compared to Sightlines
inspection scores, user
perception of campus is
lower, with the exception of
cleanliness.
Given the overall score and
relatively score to peers, it is
likely that user response is
not driven by campus
condition but rather by
expectations for service
levels.
12

Facilities Management: Design
and Construction
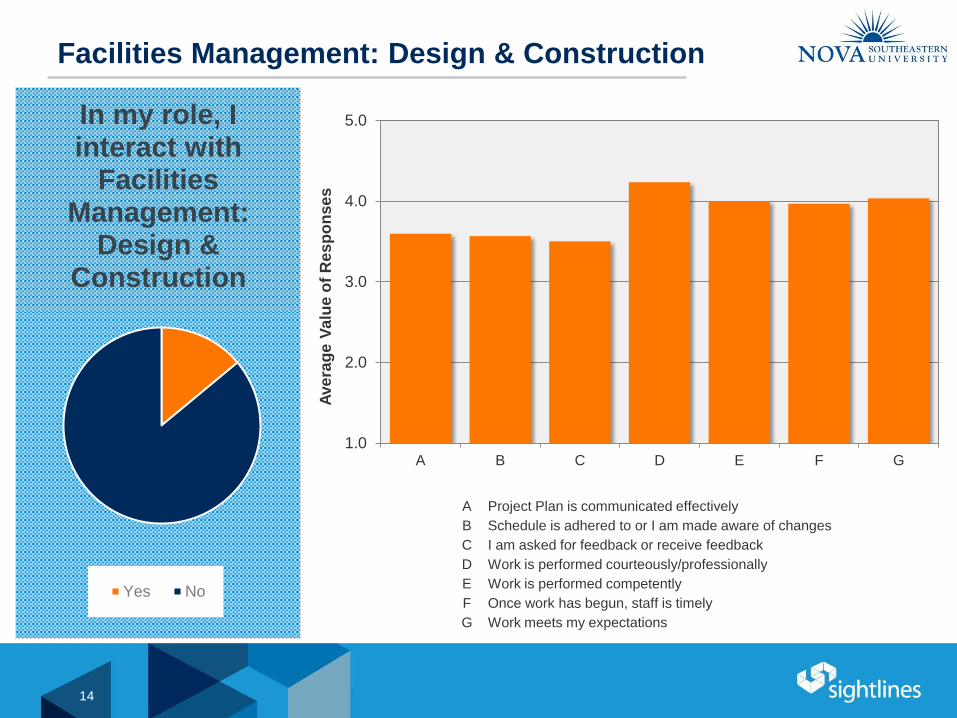
Facilities Management: Design & Construction
1.0
2.0
3.0
4.0
5.0
A B C D E F G
Ave
rag
e V
alu
e o
f R
es
po
nse
s
A Project Plan is communicated effectively
B Schedule is adhered to or I am made aware of changes
C I am asked for feedback or receive feedback
D Work is performed courteously/professionally
E Work is performed competently
F Once work has begun, staff is timely
G Work meets my expectations
In my role, I interact with
Facilities Management:
Design & Construction
Yes No
14

Service Request Process &
Physical Plant Performance

213
59
103
39
22
6255
0
50
100
150
200
250
Never 1 time/year 2-5 times/year 6-10 times/year 11-20 times/year Over 20 times /year N/A
# o
f R
eq
ue
sts
Frequency of Work Order Requests By Users
2014
Respondents that chose “Never,” “1 time/yr,” or “N/A” did not respond to the work performance
questions. The rest of the analysis comes from people who request at least twice a year.
Frequency of Use of Respondents
Focus for work order service process
questions
16

Requesting Service at Nova Southeastern
University
7%13%
6%12%
35%32%
41%36%
38%36% 31% 30%
8% 9%9% 10%
11% 9%13% 12%
0%
10%
20%
30%
40%
50%
60%
70%
80%
90%
100%
2012- Frequent 2012 - Effective Column2 2014 - Frequent 2014 - Effective
% o
f To
tal R
es
po
ns
es
Requesting Service: Frequency vs. Effectiveness
Phone Web Email In Person Other
The most frequent
method of submitting
surveys is via the web.
Responses show a
strong correlation
between the web’s
frequency of use and its
effectiveness of use.
Since 2012, a 6%
increase in the
percentage of users
utilizing the web
interface to submit
requests indicates
stronger user adoption
over time.
17

Examining the Service Request Process
4.01
4.48 4.41
3.67
4.174.07
1
2
3
4
5
The work request processmeets my needs
I utilize the proper procedurefor submitting work requests
I understand the procedure forsubmitting work requests
Ave
rag
e V
alu
e o
f R
es
po
ns
es
2012 2014
18

Work Order Request Process
Since 2012, 18% increase in desire to be notified of status from campus users
14%
29%
15%
5%
10%
27%
The Most Important Component of the Work Request Process is:
The process to requisition work requests is effective
Notification of work request status (i.e. pending, in progress, complete)
Clear communication of work request schedule
Work requests are performed courteously and professionally
Work requests are performed completely
Work requests are performed in a timely manner
13%
11%
10%
11%17%
37%
2012 2014
19
Work Performance

Requested Maintenance Services
3.813.69
4.00
3.02
4.364.21 4.15
4.02
3.45 3.51
3.94
3.01
4.45
4.21 4.234.07
1
2
3
4
5
A B C D E F G H
Ave
rag
e V
alu
e o
f R
es
po
ns
es
FY2012 FY14
A. Work request schedule is communicated effectively.
B. Schedule is adhered to or I am made aware of changes.
C. The work schedule is generally acceptable
D. I am asked for or receive feedback.
E. Work is performed courteously/professionally.
F. Work is performed competently.
G. Once work is begun, staff is timely.
H. Work meets my expectations
21

Requested Custodial Services
3.47 3.44
4.01
2.70
4.40
4.094.23
4.00
1
2
3
4
5
A B C D E F G H
Ave
rag
e V
alu
e o
f R
es
po
ns
es
FY14
A. Work request schedule is communicated effectively.
B. Schedule is adhered to or I am made aware of changes.
C. The work schedule is generally acceptable
D. I am asked for or receive feedback.
E. Work is performed courteously/professionally.
F. Work is performed competently.
G. Once work is begun, staff is timely.
H. Work meets my expectations.
22
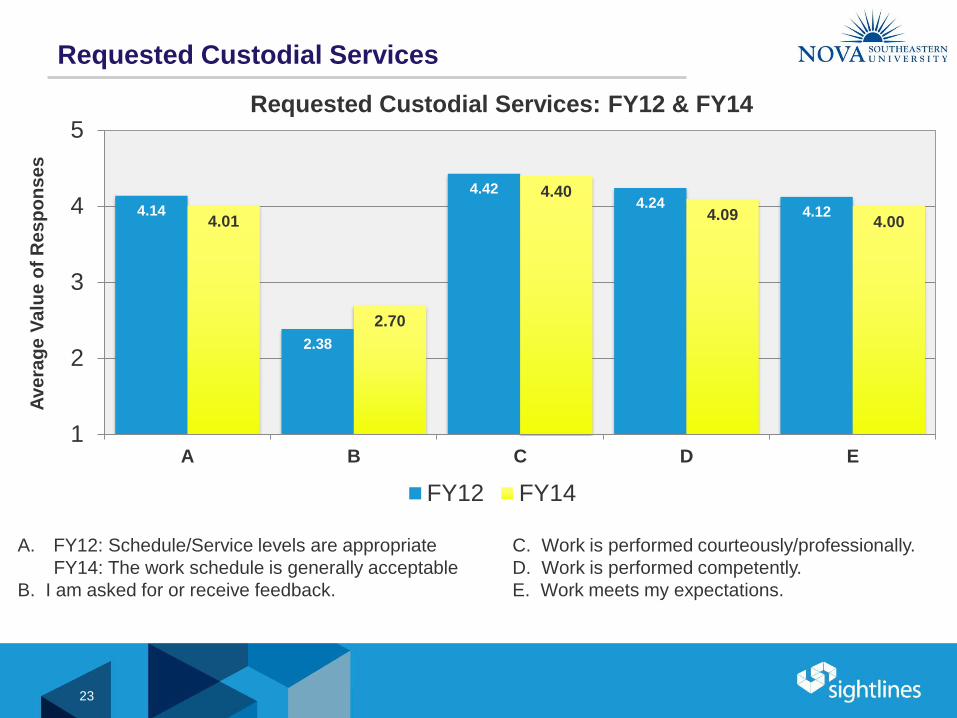
Requested Custodial Services
4.14
2.38
4.424.24
4.124.01
2.70
4.40
4.09 4.00
1
2
3
4
5
A B C D E
Ave
rag
e V
alu
e o
f R
es
po
ns
es
Requested Custodial Services: FY12 & FY14
FY12 FY14
A. FY12: Schedule/Service levels are appropriate
FY14: The work schedule is generally acceptable
B. I am asked for or receive feedback.
C. Work is performed courteously/professionally.
D. Work is performed competently.
E. Work meets my expectations.
23

Requested Grounds Services
3.513.33
4.10
2.93
4.32 4.23 4.24 4.19
1
2
3
4
5
A B C D E F G H
Ave
rag
e V
alu
e o
f R
es
po
ns
es
FY14
A. Work request schedule is communicated effectively.
B. Schedule is adhered to or I am made aware of changes.
C. The work schedule is generally acceptable
D. I am asked for or receive feedback.
E. Work is performed courteously/professionally.
F. Work is performed competently.
G. Once work is begun, staff is timely.
H. Work meets my expectations.
24

Requested Grounds Services
4.22
2.28
4.38 4.394.29
4.10
2.93
4.32 4.23 4.19
1
2
3
4
5
A B C D E
Ave
rag
e V
alu
e o
f R
es
po
ns
es
Requested Grounds Services: FY12 & FY14
FY12 FY14
A. The work schedule is generally acceptable
B. I am asked for or receive feedback.
C. Work is performed courteously/professionally.
D. Work is performed competently.
E. Work meets my expectations.
25

Summary Results
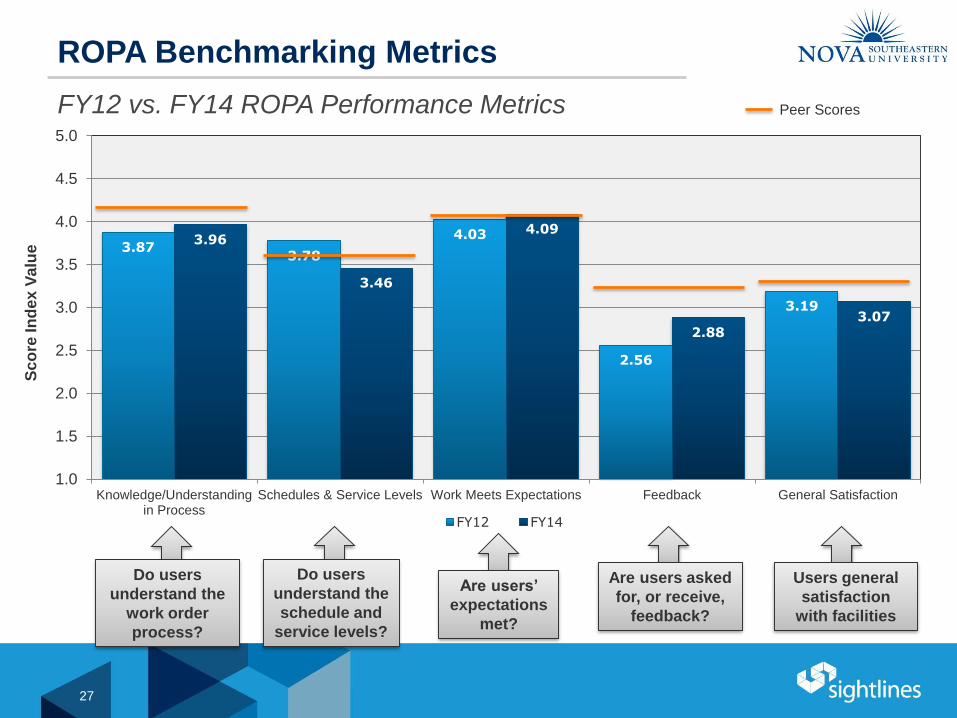
ROPA Benchmarking Metrics
FY12 vs. FY14 ROPA Performance Metrics
3.873.78
4.03
2.56
3.19
3.96
3.46
4.09
2.883.07
1.0
1.5
2.0
2.5
3.0
3.5
4.0
4.5
5.0
Knowledge/Understandingin Process
Schedules & Service Levels Work Meets Expectations Feedback General Satisfaction
FY12 FY14
Sc
ore
In
de
x V
alu
e
Do users
understand the
work order
process?
Do users
understand the
schedule and
service levels?
Are users’
expectations
met?
Are users asked
for, or receive,
feedback?
Users general
satisfaction
with facilities
Peer Scores
27

Scheduling and Communication
28
What and When vs. Who and How
Service Desk Should…
• Have Strong knowledge of the work
management system • All work orders, regardless of how
requested (phone, person, web, or done
on the fly), are entered into the system.
• Assign the priority of all requests and
communicate this priority to the shop• Emergency requests should be
immediately assigned and scheduled
• Establish time estimates for work order
requests to communicate between
customer and shops.
• Communicate the schedule and changes
to the schedule to customer.
Shop Lead or Supervisors Should…
• Assign work order to tradesperson• Work is assigned based on the
schedule from service desk (which
was communicated to customer)
• Adjust schedule based on work, and
communicate changes back to service
desk.• e.g. Issue has been looked at, waiting
on part ordered. Adjust schedule
accordingly.
Communication
Improving the communication to the customer regarding scheduling and completed work will also have a
positive effect on the feedback analysis of the Customer Satisfaction Survey.
Sustainability ResultsCommuting Habits
Recycling Program
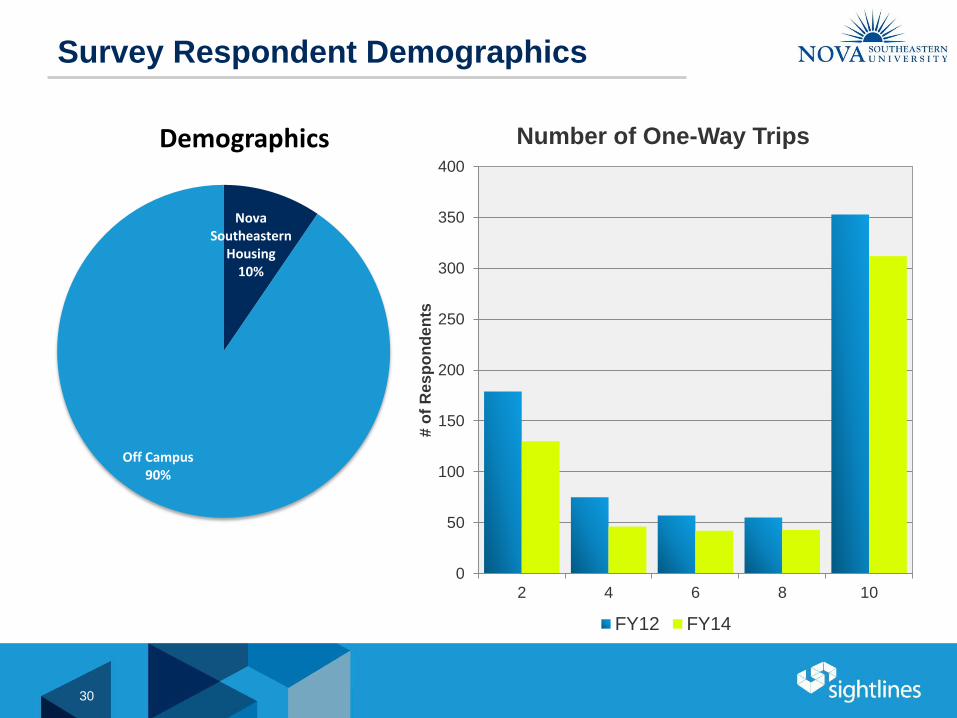
Survey Respondent Demographics
Nova Southeastern
Housing10%
Off Campus90%
Demographics
0
50
100
150
200
250
300
350
400
2 4 6 8 10
# o
f R
es
po
nd
en
ts
Number of One-Way Trips
FY12 FY14
30
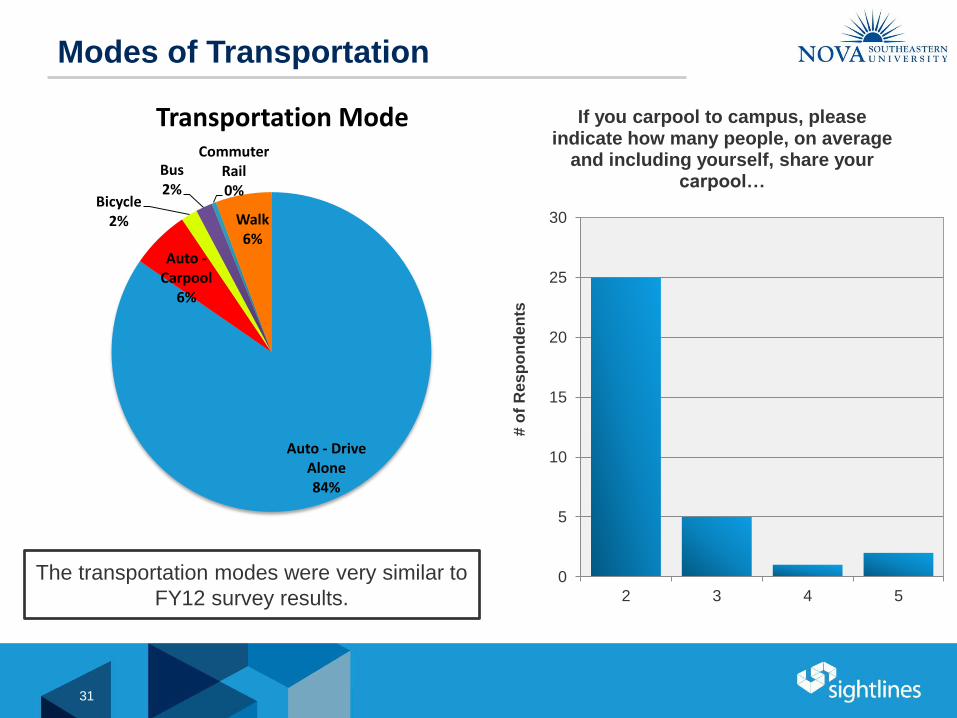
Modes of Transportation
0
5
10
15
20
25
30
2 3 4 5
# o
f R
es
po
nd
en
ts
If you carpool to campus, please indicate how many people, on average
and including yourself, share your carpool…
Auto - Drive Alone84%
Auto -Carpool
6%
Bicycle2%
Bus2%
Commuter Rail0%
Walk6%
Transportation Mode
The transportation modes were very similar to
FY12 survey results.
31

Methods of Lowering Commuting Emissions
1.00
2.00
3.00
4.00
Reservedparking forcarpoolers
Guaranteedride homeprogram
Electroniccarpool/ride
matching
Subsidizedmass transit
passes
Increasedmass transit
service
Shelteredbicycleparking
Bicyclelanes on
local streets
Classscheduling
FY12 FY14
If you drive alone, which commuting programs would be most effective in
switching your primary commuting mode to a more sustainable option?
Very
Effective
Effective
Ineffective
Very
ineffective
32

Select Sustainability Comments
Our dining hall wastes a lot of
styrofoam plates and plasticwear
I would really like to see a bike
program be installed on
campus. That could help both
residents and commuters.
I noticed that you did not mention encouraging the use of hybrid, alternative fuel and
electric vehicles. If we are truly serious about sustainability scrap the luxury cars that
the university buys for its administrators and buy hybrids and hybrid electric. Also
solar powered recharging stations would be a good feature.
Increase shuttle service to surrounding apts and
neighborhoods on Nova Drive and Abe
Fishler/30th st. Biking is ok but Florida weather
is unpredictable. Increase golf cart usage for
getting around on campus for staff
Need to teach people to turn off lights,
turn off computers, turn off printers,
etc. when they leave. Also, RAISE
THE TEMPERTURE! Air Conditioning
is TOOOOOO COLD in our office
(Museum Plaza).
I believe that the University is sincere
and committed to sustainability.
Better parking at HPD!!! The parking garage
is poorly organized and take forever to get in
and out of. Parking is basically full by
8:30am. There us no where to do short term
(30 min) parking to run in and run out
33

Methods of Increasing Campus Sustainability
1
2
3
4
5
Availability of recyclingcontainers
Servicing of recyclingcontainers
Satisfaction with the campusrecycling program
FY12 FY14
Incre
asin
g O
pin
ion
On a scale of 1 to 5 (1 being low and 5 being high), please select the response
that best describes your opinion of our recycling efforts.
34
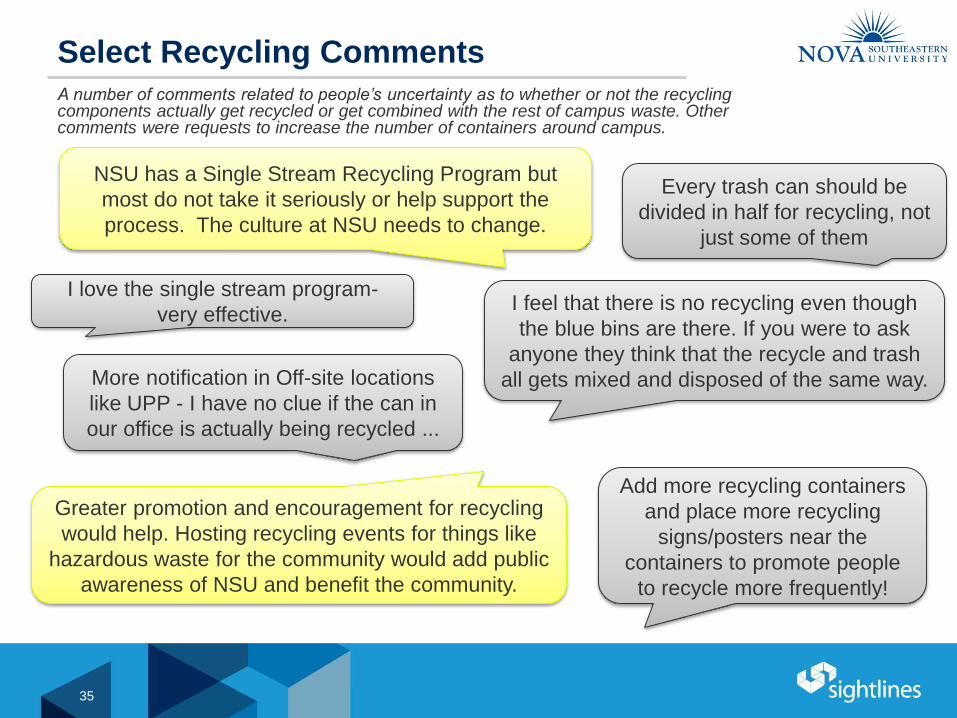
Select Recycling CommentsA number of comments related to people’s uncertainty as to whether or not the recycling components actually get recycled or get combined with the rest of campus waste. Other comments were requests to increase the number of containers around campus.
I feel that there is no recycling even though
the blue bins are there. If you were to ask
anyone they think that the recycle and trash
all gets mixed and disposed of the same way.
Greater promotion and encouragement for recycling
would help. Hosting recycling events for things like
hazardous waste for the community would add public
awareness of NSU and benefit the community.
Every trash can should be
divided in half for recycling, not
just some of them
More notification in Off-site locations
like UPP - I have no clue if the can in
our office is actually being recycled ...
I love the single stream program-
very effective.
Add more recycling containers
and place more recycling
signs/posters near the
containers to promote people
to recycle more frequently!
NSU has a Single Stream Recycling Program but
most do not take it seriously or help support the
process. The culture at NSU needs to change.
35