Embed Size (px)
Citation preview


PAGE LEFT INTENTIONALLY BLANK

OverviewThe San Diego Unified Port District’s (District) budget document establishes a one-year financial plan to fulfill the District's statutory mission, support the District's role as trustee of State tidelands, and achieve the strategic goals of the District. The budget is also a disclosure document intended to provide transparency on District operations.
The District’s budget is divided into sections as presented below:
Section 1 – Introduction
This section identifies the Board of Port Commissioners, Executive Leadership Group, Vision, Mission, and Core Values, Map of Tidelands, District Overview, and Branding.
This section also contains the Message from the Chief Financial Officer/Treasurer (CFO) and Budget in Brief. The CFO Message discusses the current state and future plans of the District, which will be included in the final Adopted Budget. The CFO Message also highlights the major provisions that have been included in the FY 2021 Budget and discusses changes from the prior year’s budget and budget assumptions used to prepare the budget.
Section 2 – Reader’s Guide
This section is designed to help familiarize the reader with the District and its budget by providing an overview of the District organization, the District’s fund and budget document structure, budget process, the budget timetable, and general information.
Section 3 – Highlights
This section provides an overview of staffing, revenue and expenses, debt management, equipment outlay and other capital projects, Capital Improvement Program (CIP), Major Maintenance Program (MM), Technology Management Program (TMP), and other fund highlights.
Section 4 – Departments/Cost Centers
This section organizes departments and cost centers alphabetically. Departments include the department operating plan followed by a detailed list of positions, summary of departmental expense, equipment outlay and other capital projects, and expense budget breakdown. The cost centers include a summary of departmental expenses and expense budget breakdown. Section 5 – Appendix
This section contains a variety of other budget-related information including a glossary of terms used in the budget, and Board of Port Commissioners (Board) policies affecting the budget.
PAGE LEFT INTENTIONALLY BLANK

SECTION 1 – INTRODUCTION Section - Page
Board of Port CommissionersExecutive Leadership GroupVision, Mission, and Core ValuesMap of TidelandsDistrict OverviewBrandingMessage from the Chief Financial Officer / TreasurerBudget in Brief
SECTION 2 – READER’S GUIDEOrganizationOrganization ChartBudget Timetable
SECTION 3 – HIGHLIGHTSRevenue HighlightsStaffing OverviewExpense HighlightsDebt Management HighlightsEquipment Outlay and Other Capital ProjectsSeaport Village HighlightsPublic Art Fund HighlightsEnvironmental Fund HighlightsMaritime Industrial Impact Fund HighlightsCapital Improvement Program HighlightsMajor Maintenance Program HighlightsTechnology Management ProgramSponsorships & Grants
1-31-41-51-61-71-81-91-13
2-32-52-6
3-33-153-173-233-253-273-293-313-333-353-373-393-41

PAGE LEFT INTENTIONALLY BLANK

PageBoard of Port CommissionersExecutive Leadership GroupVision, Mission, and Core ValuesMap of TidelandsDistrict OverviewBrandingMessage from the Chief Financial Officer / TreasurerBudget in Brief
3456789
13

Final Budget FY 2021 Section 1 - Introduction San Diego Unified Port DistrictJune 23, 2020 Page 2
PAGE LEFT INTENTIONALLY BLANK

Board of Port Commissioners
Final Budget FY 2021 Section 1 - Introduction San Diego Unified Port DistrictJune 23, 2020 Page 3
CHAIRAnn Y. Moore
City of Chula Vista
VICE CHAIRMichael ZucchetCity of San Diego
SECRETARY Dan Malcolm
City of Imperial Beach
COMMISSIONERS
Garry J. BonelliCity of Coronado
Rafael CastellanosCity of San Diego
Marshall MerrifieldCity of San Diego
Robert “Dukie” ValderramaCity of National City

Executive Leadership Group
Final Budget FY 2021 Section 1 - Introduction San Diego Unified Port DistrictJune 23, 2020 Page 4
PRESIDENT/CEO GENERAL COUNSEL Randa J. Coniglio Thomas A. Russell
ACTING PORT AUDITOR ASSISTANT GENERAL COUNSEL Mark Yeilding Ellen F. Gross
EXECUTIVE VICE PRESIDENT SENIOR DEPUTY GENERAL COUNSEL Vacant Rebecca Harrington
CHIEF ADMINISTRATIVE OFFICER PUBLIC SAFETY/CHIEF OF HARBOR POLICE VICE PRESIDENT VICE PRESIDENT Karen G. Porteous Mark Stainbrook
CHIEF FINANCIAL OFFICER/TREASURER REAL ESTATE, ENGINEERING VICE PRESIDENT AND FACILITIES Robert DeAngelis VICE PRESIDENT Shaun D. Sumner PLANNING, ENVIRONMENT MARKETING AND COMMUNICATIONS AND GOVERNMENT RELATIONS VICE PRESIDENT VICE PRESIDENT Michael Brown Jason H. Giffen
MARITIME ASSISTANT VICE PRESIDENT VICE PRESIDENT Cid Tesoro Michael LaFleur
CHIEF POLICY STRATEGIST CHIEF TECHNOLOGY OFFICER Job Nelson Keith Coffey

Vision, Mission, and Core Values
Final Budget FY 2021 Section 1 - Introduction San Diego Unified Port DistrictJune 23, 2020 Page 5
VISION
21st Century Port - We are an innovative, global seaport courageously supporting commerce, community, and the environment.
MISSION
The Port of San Diego will protect the Tidelands Trust resources by providing economic vitality and community benefit through a balanced approach to maritime industry, tourism, water and land recreation, environmental stewardship, and public safety.
CORE VALUES

Map of Tidelands
Final Budget FY 2021 Section 1 - Introduction San Diego Unified Port DistrictJune 23, 2020 Page 6

District Overview
Final Budget FY 2021 Section 1 - Introduction San Diego Unified Port DistrictJune 23, 2020 Page 7
THE SAN DIEGO UNIFIED PORT DISTRICT
The San Diego Unified Port District (District) is a regional public agency established in 1962 by an act of the California State Legislature to consolidate management responsibilities for the San Diego Bay. This consolidation provides ongoing efficiencies and centralized planning for the tidelands along the San Diego Bay.
The District is an economic engine, creating jobs and dollars for the regional economy through the promotion of maritime trade, tourism, and other commercial activities.
The District is an environmental steward, preserving and enhancing the natural resources of the San Diego Bay and surrounding tidelands.
The District is a provider of community services, providing public access, public safety, recreation, and community activities along the waterfront for visitors and residents of the region.
A seven-member Board of Port Commissioners governs the District. Board members are appointed to four-year terms by the city councils of Chula Vista, Coronado, Imperial Beach, National City, and San Diego. The San Diego City Council appoints three commissioners and each of the other member city councils appoints one commissioner. Port Commissioners establish policies that the District staff, under the direction of the President/Chief Executive Officer (President/CEO), uses to conduct daily operations.
The District’s maritime, real estate, and parking generate billions of dollars for the region’s economy and allow the District to operate without the benefit of tax dollars. The District has the authority to levy a tax, but has not done so since 1970.
PUBLIC TRUST DOCTRINE
The District is also a trustee of state lands subject to the Public Trust Doctrine, which mandates how California’s sovereign lands should be managed. Also known as public trust lands, they include areas that used to be or are still under the bay and other waters. These lands cannot be bought and sold because they are held in the public trust and belong to the people of the State of California. As the trustee of these lands, the District is responsible for carrying out the principles of the Public Trust Doctrine. This includes protecting the environment, promoting the public’s enjoyment of these lands, and enhancing economic development for the public’s benefit.

Branding
Final Budget FY 2021 Section 1 - Introduction San Diego Unified Port DistrictJune 23, 2020 Page 8
Brand Promise
Enrich the relationship people and businesses have with the dynamic waterfront of San Diego Bay, providing prosperity and a more remarkable way of life.
Brand Foundation
The District, commonly known as the Port of San Diego (Port), is where San Diego greets the world. On behalf of the State of California, the Port is an innovative champion for the 34 miles of San Diego Bay waterfront along Chula Vista, Coronado, Imperial Beach, National City, and San Diego.
The Port is a protector of the environment and our communities, an innovator for businesses and a host to visitors and residents. Self-funded, the Port reinvests the revenues from hundreds of businesses on our dynamic waterfront, creating prosperity and a remarkable way of life for all.

Message from the Chief Financial Officer / Treasurer
Final Budget FY 2021 Section 1 - Introduction San Diego Unified Port DistrictJune 23, 2020 Page 9
Uncharted WatersAs a global seaport, Uncharted Waters couldn’t be a more appropriate term for the situation the San Diego Unified Port District, along with the rest of the world, finds itself in. First detected in Wuhan City, Hubei Province, China at the end of 2019, a novel coronavirus quickly spread and was declared a pandemic in early 2020. The virus, named “SARS-CoV-2” and the disease it causes, “coronavirus disease 2019” (abbreviated COVID-19), became not only a global health crisis, but a global economic crisis as well, impacting travel, tourism, and trade - and as a result, District revenues.
Prioritizing public health and safety, the District acted quickly to the health crisis by closing public spaces and activities, including parks, beaches, piers, boat launch ramps and the District’s Administration Building, to help lessen the spread of and exposure to COVID-19, per public health orders enacted by the State of California and the County of San Diego. Those health orders also forced the closure of many businesses around San Diego Bay - including hotels, restaurants, museums and other travel and tourism-related businesses. Additionally, cruise lines cancelled their remaining sailings for the 2019-2020 season. These closures and cancellations resulted in an immediate impact on Port revenues - $31 million estimated for the end of Fiscal Year 2020 - and as presented in more detail in the report to follow, will have significant impacts on Fiscal Year 2021 (FY 2021).
The District’s immediate focus looking to FY 2021 is on essential services such as public safety - Port of San Diego Harbor Police will continue to operate 24 hours a day, seven days a week; maritime operations - cargo tenants and the Working Waterfront will continue to be critical links in the local, regional and global supply chains; and maintenance of public infrastructure, facilities and spaces. Two additional primary objectives include keeping as much staff as possible, and keeping projects moving forward.
At the direction of the Board of Port Commissioners, District staff began developing the FY 2021 budget by looking at different budget scenarios, estimating where we thought the District would be by quarter, and preparing a list of expense reductions. We then made some across-the-board percentage cuts in non-personnel expenses, major maintenance, capital improvements, technology management, and a variety of other programs.
While preparing this information, many District tenants requested rent relief. In response, District staff prepared an overall recommendation for rent deferral with a zero-interest repayment plan.
Next, staff prepared budget scenarios for Worse Case, Base Case, and Better Case and presented those scenarios to an Ad Hoc Committee. The Committee strongly agreed with finding ways to keep as many employees as possible, supported the tenant relief program recommendation, and concurred with using reserves - specifically, $17.6 million to complete FY 2020 and up to $15.7 million to fund the FY 2021 budget based on the Base Case scenario. The full Board then unanimously approved the recommendations.
To reduce personnel expenses, the District suspended hiring for all positions except dispatcher positions, released all temporary employees and interns, reduced as much of the overtime as possible, and instituted a two percent salary reduction for unrepresented employees who make more than $75,000 per year.
This FY 2021 Preliminary Budget book will have a very different look and feel and will not include all the narratives, or the department by department breakdowns. This budget book still includes a line item breakdown of expenses at the District level, which is still far more than we are legally required to produce. This will give us the flexibility to adjust more readily as we monitor our actual performance versus budget and the flexibility we will need in light of all of the uncertainty so we can allocate resources where they are most critical.
With an FY 2021 budget, and plans in place to meet the District’s primary objectives, we look now to project goals for the year, which include:
• Port Master Plan Update: The Port Master Plan is a water and land use plan that designates specific areas of San Diego Bay for a balance of maritime, fishing, visitor-serving commercial, recreational, conservation and institutional uses. Continuing more than seven years of robust public outreach, staff will seek public and stakeholder feedback on a Revised Draft of the Port Master Plan Update, and then complete the environmental review process.

Message from the Chief Financial Officer / Treasurer
Final Budget FY 2021 Section 1 - Introduction San Diego Unified Port DistrictJune 23, 2020 Page 10
• Chula Vista Bayfront: In partnership with the City of Chula Vista and RIDA Chula Vista LLC, the District anticipates finalizing financing for the Gaylord Pacific resort hotel and convention center project, which includes public infrastructure, parks and other amenities. Next steps include obtaining building and grading permits, close of escrow, and delivery of an executed lease by RIDA to the Port. After that, construction can begin, starting with public infrastructure improvements including utilities, roadways, parks, etc. Additionally, the Costa Vista RV Resort and Sweetwater Bicycle and Promenade are anticipated to open.
• Portside Pier: The transformation of one of Southern California’s iconic, flagship waterfront restaurant sites will be complete. The Brigantine Inc.’s Portside Pier - a two story restaurant development over the water on the North Embarcadero of San Diego Bay - will include four dining concepts and public access features including a second level perimeter walkway along the water’s edge, public viewing deck with panoramic views, and an expanded dock and dine facility.
• San Diego Symphony: The Symphony’s permanent outdoor performance and event venue in Embarcadero Marina Park South is scheduled to open in summer 2020. It will replace their temporary performance and event venue with permanent facilities on the same site. The Symphony is investing $45 million in improvements in The Shell, formerly known as Bayside Performance Park, and public amenities, creating a new attraction on San Diego Bay.
• Seaport Village: Renovations and preparations continue for four future tenants at this waterfront retail center - Hess Brewing, Spill the Beans, Mr. Moto Pizza, and a yet-to-be named Sam the Cooking Guy concept by Grain & Grit Collective - and an expansion of the San Pasqual Wine Tasting Room. All are anticipated to be open in FY 2021. The District welcomed three new tenants in FY 2020 and continued site enhancements and operational improvements thanks to proactive marketing, placemaking and management.
• National City Balanced Plan: In partnership with the City of National City, Pasha Automotive Services, and GB Capital Holdings, as well as community stakeholders and businesses, District staff anticipates finalizing and requesting Board review and approval of the Final Environmental Impact Report (Final EIR) for the National City Balanced Plan - a water and land use plan balancing three priorities - maritime, commercial recreation and public access. Next steps would include seeking Board approval of the Final EIR and Port Master Plan Amendment, an important step toward project entitlement and future implementation.
• Clean Air: The District initiated a Climate Action Plan Study in FY 2020 that will continue into FY 2021 to align the District’s post-2020 Greenhouse Gas emission reduction goals to State targets. The solar-powered microgrid at the Tenth Avenue Marine Terminal, funded by a California Energy Commission grant, will begin installation during FY 2021. Additionally, the District continues to install electric vehicle charging stations around the bay to support the regional transition toward electric vehicles. These initiatives support our Climate Action Plan.
It is appropriate to reflect on the past year as we budget for the year ahead. The below accomplishments in Fiscal Year 20 (FY 2020) represent significant milestones, and work on many of them continues in FY 2021:
• Airport Redevelopment Plan: As part of ongoing collaboration related to the San Diego International Airport’s Terminal 1 redevelopment plan, the District joined the San Diego County Regional Airport Authority, the City of San Diego, and the San Diego Association of Governments (SANDAG) in a Memorandum of Understanding (MOU) that addresses transit and mobility impacts related to the project, including a potential outbound roadway if and when needed to relieve traffic along the northern San Diego Bay waterfront; a framework for obtaining FAA approval of future funding for transit to the Airport; and future collaboration among the agencies. The District also submitted feedback on the Airport’s revised Environmental Impact Report for the project to ensure alignment of the terminal redevelopment with the District’s future vision for Tidelands.
• Tenth Avenue Marine Terminal Modernization: The District is nearing completion of the first phase of the Tenth Avenue Marine Terminal Redevelopment Plan. Phase I involved the demolition of two transit sheds, site enhancements, rail improvements, and relocating District staff offices on the terminal. Supported by a $10 million TIGER grant from the U.S. Department of Transportation, the project commenced in FY 2018. The first phase of the entire 20-year, market driven Redevelopment Plan supports our specialty cargo advantage by providing laydown space and flexibility for the District’s cargo types.

Message from the Chief Financial Officer / Treasurer
Final Budget FY 2021 Section 1 - Introduction San Diego Unified Port DistrictJune 23, 2020 Page 11
• Blue Economy Incubator: The District approved two additional Blue Economy Incubator pilot projects. For the seventh project, the District will work with ECOncrete, Inc. to test a new design of tide pools made from environmentally sensitive, low carbon concrete that could serve as a replacement for traditional riprap to provide ecological armoring and shoreline stabilization while also creating well-defined local ecosystems that mimic natural rock tidepools. For the eighth project, the District will work with ecoSPEARS Inc., a startup cleantech solutions company working to develop a cost-effective and eco-friendly cleanup solution to extract and destroy toxic contaminants from sediment, soil and groundwater. Additionally, the District extended its agreement with Sunken Seaweed, a local startup conducting a pilot project to demonstrate the feasibility and co-benefits of seaweed aquaculture in San Diego Bay.
• Tijuana River Pollution: In collaboration with our local, regional and state partners, the District continued to urge the federal government to take action to eliminate the ongoing discharge of sewage and other waste from the International Boundary and Water Commission - United States Section’s facilities into the Tijuana River, which flows to the Pacific Ocean and impairs the Port’s public trust resources in Imperial Beach. The District joined the State Lands Commission, the San Diego Regional Water Quality Control Board, the County of San Diego, the cities of Chula Vista, Coronado, Imperial Beach, National City, San Diego, and Surfrider San Diego, in adopting a joint resolution identifying the most urgent needs that regional leaders request from the federal level to address the underlying causes of the sewage, sediment and trash that have contaminated San Diego land and waterways for decades.
• Bridge Lighting Project: The California Coastal Commission authorized a Coastal Development Permit for the District to temporarily install and test LED lights on select mid-span piers of the San Diego-Coronado Bridge. The Bridge Lighting Mock-up Test, to be conducted over one week during a time period designated by the Coastal Commission, will help the District and its project consultants answer questions and prepare the documents required to continue moving forward on the project. In FY 2021, the District anticipates completing the testing, which is part of project Phase 2: Feasibility Study, as well as developing agreements for project Phase 3: Design Development.
• Business Negotiated Events (BNEs) - The District negotiated agreements with event producers that facilitate the production of large, complex, and high-impact events to generate direct revenue and promotional benefits to the District. Big Bay Boom, Holiday Bowl Parade, Wonderspaces, Lululemon 10k marathon, and Wonderfront Music Festival resulted in substantial financial, promotional, and community impacts. As of the time of this writing, Big Bay Boom and the Wonderfront Music Festival have been canceled in the first half of FY 2021. The status for the remaining BNEs is yet to be determined for FY 2021.
• Procurement: For the eleventh straight year, the District received the prestigious National Procurement Institute’s (NPI) Achievement of Excellence (AEP) in Procurement Award. The AEP is earned by organizations that demonstrate excellence by obtaining a high score based on standardized criteria designed to measure innovation, professionalism, productivity, e-procurement and leadership attributes of the procurement organization. The District is one of 46 agencies in California and one of only 39 special districts in the United States and Canada to be recognized with the AEP award last year.
• Financial Reporting Award: For the fifth consecutive year, the District received a Certificate of Achievement for Excellence in Financial Reporting from the Government Finance Officers Association for the United States and Canada (GFOA) for its June 30, 2018 Comprehensive Annual Financial Report . The award is considered to be one of the most highly regarded recognitions in the area of governmental accounting and financial reporting and represents a major achievement for the Port.
• IT Infrastructure: The District executed on multiple network security architecture projects, including improvements to network redundancy and segmentation, threat monitoring, and equipment refresh. The District’s workforce is empowered with laptops and mobile capabilities. We have fully engaged our collaboration and productivity platform for COVID-19, quickly pivoting to secure remote work and emergency operations coordination. Public interactions have been improved through automating park reservations and permitting, as well as online reporting of infrastructure issues within the Tidelands.
• Cruise: The District celebrated the return of Carnival Cruise Line to San Diego, with a sold-out inaugural cruise of the Carnival Miracle. Last seen in San Diego in 2012, Carnival scheduled 13 cruises with itineraries to the Mexican Riviera, Baja, Hawaii and the Panama Canal.

Message from the Chief Financial Officer / Treasurer
Final Budget FY 2021 Section 1 - Introduction San Diego Unified Port DistrictJune 23, 2020 Page 12
For the long term, thanks to a long history of prudent financial decisions, the District is very well positioned to weather this storm - both due to our operating reserve policy and our accumulation of unrestricted resources recent years. This fact and positive outlook have been validated by Fitch Ratings, who reviewed the credit ratings for all ports in light of the COVID-19 crisis.
Despite the Uncharted Waters of facing a global health crisis and a global economic crisis at the same time - the District and our tenant partners have navigated rough waters before, and we’ll do so again. We are positioned to continue to serve our region as a vital economic engine all the way through this crisis.
Robert DeAngelis, CFO/Treasurer

Budget in Brief
Final Budget FY 2021 Section 1 - Introduction San Diego Unified Port DistrictJune 23, 2020 Page 13
OVERVIEW OF REVENUES, EXPENSES, CAPITAL REQUIREMENTS & FUND ACTIVITIES
ACTUAL ADJUSTED CHANGERESULTS BUDGET BUDGET FY 2021-2020 %FY 2019 FY 2020 FY 2021 BUDGET CHANGE
Operating RevenueReal Estate $107,234,118 $116,274,700 $ 87,970,600 $ (28,304,100) (24.3)%Port as a Service - Parking 17,058,125 16,279,700 11,649,800 (4,629,900) (28.4)%Maritime 38,649,728 40,175,700 33,415,200 (6,760,500) (16.8)%Harbor Police Department 17,068,801 16,619,600 16,659,600 40,000 0.2 %Aquaculture & Blue Technology 332 — — — N/AMiscellaneous (G&A for HPD services toSDCRAA, Cost Recovery, etc.) 3,820,203 3,430,800 3,208,300 (222,500) (6.5)%
Total Operating Revenue $183,831,307 $192,780,500 $152,903,500 $ (39,877,000) (20.7)%
Non-Operating RevenueGrants - Capital Project Reimbursement $ 8,715,645 $ 15,084,195 $ 6,047,500 $ (9,036,695) (59.9)%Grant Revenue - Other 1,052,387 1,213,300 1,102,000 (111,300) (9.2)%Investment Revenue 3,693,094 1,700,000 800,000 (900,000) (52.9)%Other (Legal Settlements, Car Rental Fees,Donated Revenue, etc.) 7,903,756 4,200,000 4,811,000 611,000 14.5 %
Total Non-Operating Revenue $ 21,364,882 $ 22,197,495 $ 12,760,500 $ (9,436,995) (42.5)%Total Revenue $205,196,189 $214,977,995 $165,664,000 $ (49,313,995) (22.9)%
ExpensesPersonnel $ 94,036,183 $103,381,100 $101,681,100 $ (1,700,000) (1.6)%Non-Personnel Expense (NPE) 59,350,449 63,280,326 45,652,200 (17,628,126) (27.9)%Municipal Service Agreements (MSA) withMember Cities 7,995,558 8,143,400 8,329,800 186,400 2.3 %Major Maintenance - Expense 221,283 650,000 510,000 (140,000) (21.5)%Non-Operating NPE 3,056,001 3,770,565 3,315,800 (454,765) (12.1)%Capitalized Labor (3,579,661) (3,989,500) (2,350,000) 1,639,500 (41.1)%
Total Expenses $161,079,813 $175,235,891 $157,138,900 $ (18,096,991) (10.3)%
Earnings Before Depreciation and GASB 68,73, and 75 Accounting Adjustments $ 44,116,376 $ 39,742,104 $ 8,525,100 $ (31,217,004) (78.5)%
Sources & Uses of Funds and Reserves $ (31,717,791) $ (37,707,104) $ (8,525,100) $ 29,182,004 (77.4)%(see detail on following page)
Unrestricted Sources Over Uses of Funds $ 12,398,585 $ 2,035,000 $ — $ (2,035,000) (100.0)%Note:See Section 3, Page 3 for Revenue Highlights explanations and Section 3, Page 17 for Expense Highlights explanations.
Budget in Brief
Final Budget FY 2021 Section 1 - Introduction San Diego Unified Port DistrictJune 23, 2020 Page 14
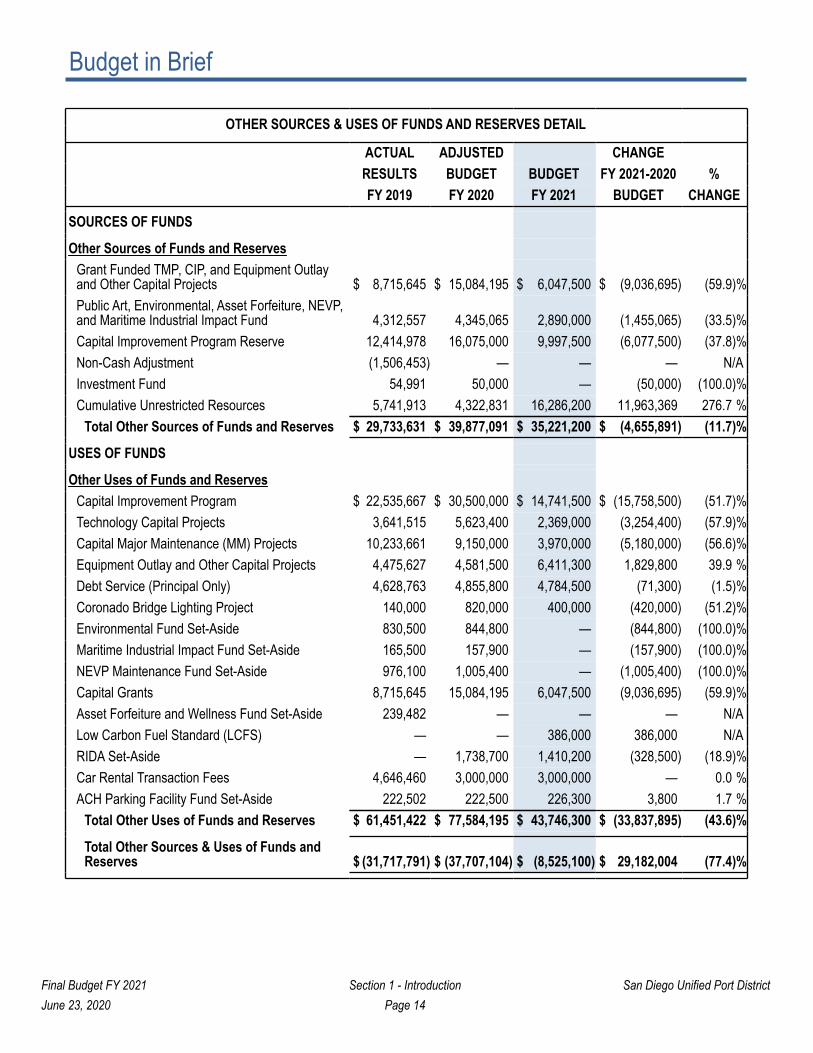
OTHER SOURCES & USES OF FUNDS AND RESERVES DETAIL
ACTUAL ADJUSTED CHANGERESULTS BUDGET BUDGET FY 2021-2020 %FY 2019 FY 2020 FY 2021 BUDGET CHANGE
SOURCES OF FUNDS
Other Sources of Funds and ReservesGrant Funded TMP, CIP, and Equipment Outlayand Other Capital Projects $ 8,715,645 $ 15,084,195 $ 6,047,500 $ (9,036,695) (59.9)%Public Art, Environmental, Asset Forfeiture, NEVP,and Maritime Industrial Impact Fund 4,312,557 4,345,065 2,890,000 (1,455,065) (33.5)%Capital Improvement Program Reserve 12,414,978 16,075,000 9,997,500 (6,077,500) (37.8)%Non-Cash Adjustment (1,506,453) — — — N/AInvestment Fund 54,991 50,000 — (50,000) (100.0)%Cumulative Unrestricted Resources 5,741,913 4,322,831 16,286,200 11,963,369 276.7 %
Total Other Sources of Funds and Reserves $ 29,733,631 $ 39,877,091 $ 35,221,200 $ (4,655,891) (11.7)%
USES OF FUNDS
Other Uses of Funds and ReservesCapital Improvement Program $ 22,535,667 $ 30,500,000 $ 14,741,500 $ (15,758,500) (51.7)%Technology Capital Projects 3,641,515 5,623,400 2,369,000 (3,254,400) (57.9)%Capital Major Maintenance (MM) Projects 10,233,661 9,150,000 3,970,000 (5,180,000) (56.6)%Equipment Outlay and Other Capital Projects 4,475,627 4,581,500 6,411,300 1,829,800 39.9 %Debt Service (Principal Only) 4,628,763 4,855,800 4,784,500 (71,300) (1.5)%Coronado Bridge Lighting Project 140,000 820,000 400,000 (420,000) (51.2)%Environmental Fund Set-Aside 830,500 844,800 — (844,800) (100.0)%Maritime Industrial Impact Fund Set-Aside 165,500 157,900 — (157,900) (100.0)%NEVP Maintenance Fund Set-Aside 976,100 1,005,400 — (1,005,400) (100.0)%Capital Grants 8,715,645 15,084,195 6,047,500 (9,036,695) (59.9)%Asset Forfeiture and Wellness Fund Set-Aside 239,482 — — — N/ALow Carbon Fuel Standard (LCFS) — — 386,000 386,000 N/ARIDA Set-Aside — 1,738,700 1,410,200 (328,500) (18.9)%Car Rental Transaction Fees 4,646,460 3,000,000 3,000,000 — 0.0 %ACH Parking Facility Fund Set-Aside 222,502 222,500 226,300 3,800 1.7 %
Total Other Uses of Funds and Reserves $ 61,451,422 $ 77,584,195 $ 43,746,300 $ (33,837,895) (43.6)%
Total Other Sources & Uses of Funds andReserves $ (31,717,791) $ (37,707,104) $ (8,525,100) $ 29,182,004 (77.4)%

PageOrganizationOrganization ChartBudget Timetable
356

Final Budget FY 2021 Section 2 - Reader's Guide San Diego Unified Port DistrictJune 23, 2020 Page 2
PAGE LEFT INTENTIONALLY BLANK

Organization
Final Budget FY 2021 Section 2 - Reader's Guide San Diego Unified Port DistrictJune 23, 2020 Page 3
The Board establishes policy to realize the District’s mission, vision, brand promise, and goals. Three positions reporting directly to the Board are responsible for execution of policy directives: the President/Chief Executive Officer (President/CEO), General Counsel, and Port Auditor. A Personnel Advisory Board also reports directly to the Board.
HARBOR POLICE
Led by the Vice President of Public Safety/Chief of Harbor Police, the Harbor Police Department is responsible for initiatives and programs that provide safety, protection, and law enforcement. The Department also provides police and fire protection to San Diego Bay, as well as police services to San Diego International Airport. Under direction of the Chief of Harbor Police, homeland security, facility security, and law enforcement combine to protect and serve those who work, play, and visit the Port of San Diego.
MARKETING
Led by the Vice President of Marketing and Communications, this Division raises awareness of the District, its business lines, activities, and regional value through accurate and transparent communications while building and maintaining partnerships with external stakeholders and other government agencies. This Division also issues over 1,100 permits annually, safeguarding and promoting public access to 22 District parks and facilities, establishing strategic event partnerships to provide additional revenue sources for the District, and programming a wide variety of community events to create a vibrant waterfront experience for residents and visitors to the region.
Departments in the Marketing Division include:• Marketing & Communications• Waterfront Arts & Activation
ADMINISTRATION
Led by the Chief Administrative Officer/Vice President, this Division manages, directs, and integrates the functions, programs, and activities of District-wide Human Resources, People & Organizational Development, Office of the District Clerk, Information Technology, and the Project Management Office. The Chief Administrative Officer/Vice President is the District’s lead negotiator for labor negotiations and provides strategic leadership in the delivery of centralized corporate, administrative, technology implementation, and support services.
Departments in the Administration Division include:• Human Resources• Information Technology• Office of the District Clerk • People & Organizational Development• Project Management Office
OPERATIONS
Led by the Vice President of Real Estate, Engineering, and Facilities, this Division's responsibilities include: commercial leasing and management of over 600 tenancies, the progress of over $3.5 billion of projects in the pipeline, development and management of parking assets, design and construction engineering, capital improvement and major maintenance programs, facilities maintenance and services for several roadways, 22 parks, and several administrative buildings. The growth of revenue, both through core lines of business and new revenue streams, is a key responsibility for the Operations Division.

Organization
Final Budget FY 2021 Section 2 - Reader's Guide San Diego Unified Port DistrictJune 23, 2020 Page 4
Departments and teams in the Operations Division include:• Engineering - Construction• General Services• Real Estate• Port as a Service - Parking
FINANCIAL SERVICES
Led by the Chief Financial Officer/Treasurer Vice President, this Division oversees the District’s Financial Services and Procurement Services. The CFO/Treasurer provides professional assistance and support to the President/CEO on the District’s financial planning, accounting, investing, and procurement services. Financial Services includes financial planning and reporting, budgeting, treasury services, risk management, accounting, and payroll services.
Departments in the Financial Services Division include:• Financial Services • Procurement Services
MARITIME
Led by the Vice President of Maritime, this Division is responsible for the import and export business of automobiles, produce, and bulk maritime cargo at two cargo terminals, and an international cruise business at two cruise terminals. The District is the primary port of entry for Honda, Fiat, Audi, and Volkswagen among others. Pasha Automotive Services at the National City Marine Terminal also receives finished vehicles by rail and trucking including Toyota Trucks from Mexico.
PLANNING, ENVIRONMENT AND GOVERNMENT RELATIONS
Led by the Vice President of Planning, Environment and Governmental Relations, this Division is responsible for the District’s land use planning functions, including the creation of a Port Master Plan, issuance and application for permits for the 34 miles of waterfront around San Diego Bay; development and regulatory enforcement of air, land, and water quality improvement, protection, and conservation; development of an incubator business line focused on aquaculture and bluetech investments; compliance oversight of California Environmental Quality Act (CEQA) and California Coastal Act practices within the District’s jurisdiction; communications and relationships with federal, state, and local elective and administrative bodies.
Departments in the Planning, Environmental Services Protection, Conservation, and Government Relations Division include: • Aquaculture & Blue Technology (team)• Development Services• Energy (team)• Environmental Conservation• Environmental Protection• Government & Civic Relations• Planning

Organization Chart
Final Budget FY 2021 Section 2 - Reader's Guide San Diego Unified Port DistrictJune 23, 2020 Page 5
Budget Timetable
Final Budget FY 2021 Section 2 - Reader's Guide San Diego Unified Port DistrictJune 23, 2020 Page 6
The budget development process is integrated closely with strategic and project planning, where the entire management team conducts the review and the individual departments are given the control and accountability.
The Financial Analyst Team works with the Strategic Planning Team, all department Directors and the Executive Leadership Group to ensure that budget proposals support the District’s Strategic Plan and that appropriate funding is available.
As a direct consequence of COVID-19, the hospitality and tourism industries and maritime trade economic activity that generate the revenues necessary for the District’s mission-critical work have been significantly and negatively impacted. At the March 10, 2020 Board meeting, a 2020 Budget Impact Ad Hoc Committee (Ad Hoc) was created to proactively address the financial impacts of the COVID-19 pandemic. Since the Ad Hoc was established, it has met on three occasions. The first meeting was held on March 20, 2020, and the focus of the discussion was the COVID-19 related impacts to FY 2020. The second meeting was held on April 3, 2020, and the focus of the discussion was on budget scenario planning for FY 2021. The third meeting was held on April 7, 2020, and the focus of the discussion was on the rent deferral program and the reintegration and reopening of the admin building. Staff has developed and worked with the Ad Hoc on three detailed scenarios for FY2021, entitled Worse Case, Base Case, and Better Case. Each case is based on carefully developed revenue projections that differ in the time it will take a variety of impacted business sectors to recover. Once the revenue projections were formulated, staff worked to address expense reductions to match the worse, base, and better revenue projections and identified in general what work will be impacted, and what work can be accomplished for each case.
Special budget meeting. Due to the negative impacts on the District's budget caused by the unforeseen COVID-19 pandemic, a special Board meeting was held on April 8, 2020. Staff presented the three scenarios and received direction from the Board to use the Base Case scenario. The direction given at the April 8, 2020 special meeting assisted staff in creating the preliminary budget.
Preliminary budget adoption starts the public comment period. Adoption of the preliminary budget occurs at the May Board meeting. Under the provisions of the Port Act, the preliminary budget must be adopted by June 15th each year which begins the public comment period. Not less than 30 days later, the Board considers the final budget for adoption.
Final budget adoption follows the public comment period. At its first meeting following the comment period, but no later than August 1st, the Board adopts the final budget, along with amendments to the Salary Ordinance for personnel changes included in the final budget. Ideally, this happens in June, prior to the start of the new fiscal year.
Once the budget is adopted, it is input into the SAP Funds Management Accounting System (SAP-FM) and the funds availability control, which tracks expenses against the budget, is activated.
An appropriating ordinance may be required. If no final budget is adopted by July 1st, a special ordinance is required to appropriate funds for continuing operations.
The budget is based on estimates made by departments prior to the end of the current fiscal year, and 16 to 17 months prior to the end of the budget year. Many events could occur after adoption that would make the actual results significantly different from the budget estimates.
Once adopted, the budget is not fixed. The budget can be amended at any time during the fiscal year by Board ordinance. Staff monitors budget results and programs throughout the fiscal year. Changes in plans, fluctuations in estimates, new programs for which no estimate was available, and other unexpected events may require a budget amendment.
Board of Port Commissioners (BPC) Policy No. 090 shall govern transfers between appropriated budget items.

PageRevenue HighlightsStaffing OverviewExpense HighlightsDebt Management HighlightsEquipment Outlay and Other Capital ProjectsSeaport Village HighlightsPublic Art Fund HighlightsEnvironmental Fund HighlightsMaritime Industrial Impact Fund HighlightsCapital Improvement Program HighlightsMajor Maintenance Program HighlightsTechnology Management ProgramSponsorship & Grants
3151723252729313335373941

Final Budget FY 2021 Section 3 - Highlights San Diego Unified Port DistrictJune 23, 2020 Page 2
PAGE LEFT INTENTIONALLY BLANK
Revenue Highlights
Final Budget FY 2021 Section 3 - Highlights San Diego Unified Port DistrictJune 23, 2020 Page 3
Total operating and non-operating revenues for the District are budgeted at $165.7M, a decrease of $48.9M, or 22.8%, from the prior fiscal year.
Trends affecting revenue are described below by profit center.
Revenue by Profit Center
In previous years the budget has generally been developed on the belief that the national and local economy will continue to grow at a moderate pace. Revenues were projected by benchmarking major tenants, conducting tenant interviews, and using industry analysis to predict trends in revenue. Assumptions concerning prospective revenues from new and renegotiated leases were included. Revenues for leases scheduled to terminate are reduced by the probability that they will not be renewed. For leases with an option to expand facilities, revenues are reduced by the probability that the option will not be exercised.
Since concession revenue varies with economic conditions, the Real Estate revenue team performed a detailed analysis using recent data from multiple sources, published hotel industry forecasts, cruise ship activity projections, and convention bookings for 2020 and 2021. Actual year-to-date revenue, published hotel industry forecasts, cruise ship activity projections, and convention bookings were all reviewed and considered in developing the FY 2021 forecast.
Now, as this budget is prepared in Spring 2020, and as a direct consequence of the COVID-19 pandemic, the hospitality and tourism industries and maritime trade economic activity that generate the revenues necessary for the District’s mission-critical work, have been significantly and negatively impacted. The decreased revenue projections are based in part on industry information, information provided by our tenants and partners, and the number of current District tenants that have temporarily closed.
Real Estate
Real Estate is budgeted at $88.0M, a decrease of $28.3M, or 24.3%. Differences from the FY 2020 revenue budget are projected in the following areas:
• Concession Revenue is budgeted at $64.0M, a decrease of $26.1M, or 29.0%. This decrease is mainly attributable to revenue projection reductions due to the anticipated adverse effects on the hotel and tourism industries as a result of the COVID-19 pandemic. Hotel percentage rent is close to three-fourths of all concession rent, followed by retail centers, marinas, and restaurants.
• Parking is budgeted at $1.4M, a decrease of $539k, or 27.6%. Parking revenue in the Real Estate department is limited to the Seaport Village retail center, and this decrease is primarily due to the anticipated adverse effects on the tourism industry, of which Seaport Village relies heavily, as a result of the COVID-19 pandemic.
• Seaport Village Common Area Maintenance is budgeted at $1.4M, a decrease of $1.6M, or 53.6%, primarily due to an expected reduction in common area expense reimbursements, which is partially related to tenant vacancies as the budgeted reimbursement rate is based on full occupancy, with no revenue received for vacant spaces.
• Seaport Village Marketing Fee is budgeted at $375k, a decrease of $358k, or 48.8%, primarily due to an expected reduction in marketing expense reimbursements, which is partially related to tenant vacancies as the budgeted reimbursement rate is based on full occupancy, with no revenue received for vacant spaces.
• Fixed Rent is budgeted at $20.1M, an increase of $407k, or 2.1%, primarily due to an increase in car rental lease revenue.

Revenue Highlights
Final Budget FY 2021 Section 3 - Highlights San Diego Unified Port DistrictJune 23, 2020 Page 4
Port as a Service – Parking
Port as a Service - Parking is budgeted at $11.6M, a decrease of $4.6M, or 28.4%. Differences from the FY 2020 revenue budget are projected in the following areas:
• Parking is budgeted at $7.4M, a decrease of $2.8M, or 27.8%, mainly due to the anticipated adverse effects on visitation to Convention Center and Bayfront events as a result of the COVID-19 pandemic.
• Parking Meters is budgeted at $2.6M, a decrease of $1.1M, or 30.0%, mainly due to an anticipated reduction in demand at Tidelands parking meters as a result of the COVID-19 pandemic.
• Parking-Concession is budgeted at $782k, a decrease of $444k, or 36.2%, primarily due to anticipated decline in demand for long-term airport parking as a result of the COVID-19 pandemic.
Maritime
Maritime is budgeted at $33.8M, a decrease of $6.4M, or 15.9%. Differences from the FY 2020 revenue budget are projected in the following areas:
• Wharfage is budgeted at $8.5M, a decrease of $3.3M, or 27.6%, primarily due to a lower projection in automobile units. The global COVID-19 pandemic has led to automobile manufacturing plant closures in Asia and Europe in the first quarter of 2020, as well as local dealership closures and lower market demand.
• Storage Space Rental is budgeted at $1.5M, a decrease of $989k, or 40.5%, primarily due to a lower projection in automobile storage at the National City Marine Terminal as a result of anticipated decline in automobile import.
• Concession Revenue is budgeted at $1.8M, a decrease of $612k, or 25.9%, due to lower projections in concession sales from harbor excursions and the marina in National City. These reductions, caused by the COVID-19 pandemic, are currently projected to slowly recover.
• Dockage is budgeted at $1.8M, a decrease of $552k, or 23.9%, due to lower projections in cruise and automobile vessels.
• Cruise Ship Passenger Fees is budgeted at $1.9M, a decrease of $443k, or 19.0%, due to lower projections in cruise vessel calls and cruise passengers as a result of the COVID-19 pandemic. Cruise activities are projected to recover in the second quarter of FY 2021.
• Fixed Rent is budgeted at $16.1M, a decrease of $439k, or 2.7%, due to an anticipated new lease at the National Distribution Center, budgeted in FY 2020, that did not materialize; as a result, reduced the FY 2021 budget accordingly.

Revenue Highlights
Final Budget FY 2021 Section 3 - Highlights San Diego Unified Port DistrictJune 23, 2020 Page 5
Harbor Police
Harbor Police is budgeted at $18.4M, an increase of $627k, or 3.5%. The increase is primarily due to a reimbursement of expenses for lease space rental from the Department of Justice in relation to "Organized Crime Drug Enforcement Task Force."
The Harbor Police Department, in addition to serving the District tidelands, is the primary law enforcement agency at the San Diego County Regional Airport Authority (SDCRAA). The cost reimbursement for the police services provided to the SDCRAA is $16.3M while the General and Administrative cost (G&A) reimbursement reported under the Miscellaneous profit center below is $2.6M, bringing the total reimbursement to $18.9M, same as prior year budget. The FY 2021 Public Services Provided revenue budget includes labor and burden based on actual individual officer’s rate per pay period and department overhead.
Additionally, federal, state, and local grant reimbursements are budgeted at $1.1M, a decrease of $58k, or 5.0%, mainly due to the Department of Homeland Security funding for Operation Stone Garden, partially offset by a slight increase in the emergency management program.
Miscellaneous
Projected other changes in revenue will occur primarily in the following areas:
• Grants – Capital Projects Reimbursement is budgeted at $6.0M, a decrease of $9.0M, or 59.9%. The decrease is primarily due to the completion of two grant-funded projects in FY 2020 - demolition and site improvement at Tenth Avenue Marine Terminal (TAMT) and the Chula Vista bike path. FY 2021 reimbursement consists primarily of a grant for the TAMT Microgrid Infrastructure project from the California Energy Commission to demonstrate the business case for microgrids in support of California's advancement of energy resiliency and greenhouse gas reduction program.
• Interest - Investments is budgeted at $800k, a decrease of $900k, or 52.9%. Investment earnings are expected to be lower than prior year budget due to the anticipated adverse impact in interest rates and capital markets from the COVID-19 pandemic.
• Partnership/Cost Sharing Reimbursement is budgeted at $484k, a decrease of $220k, or 31.2% mainly due to the schedule of cost sharing in the Regional Harbor Monitoring Program The program provides $1.0M every five years, which was received in FY 2019.
• Public Services Provided, which represents reimbursements for G&A costs associated with the SDCRAA agreement for Harbor Police services, is budgeted at $2.6M, same as prior year budget.
• Donated Revenue, is budgeted at $420k, a decrease of $420k, or 50.0%. The decrease is primarily due to pausing work related to the Coronado Bridge Lighting project for FY 2021. This revenue primarily represents commercial and private donations, as well as tenant percent for art donations. The Tenant Percent for Art Program was established in BPC Policy No. 608 and requires tenants undertaking improvements to their leaseholds to provide a tenant percent for art allocation no less than 1% of the tenant improvement's total project cost. The revenue generated here primarily funds art projects, the largest of which is the Coronado Bridge Lighting Project.
• Car Rental Transaction Fee is budgeted at $3.0M, same as prior year budget, due to the implementation of the fee at the end of FY 2018. This fee, while being recognized as revenue, represents funds that will be set aside for the purpose of constructing a parking structure that will be part of the Chula Vista Bayfront project.

Revenue by Operating Center
Final Budget FY 2021 Section 3 - Highlights San Diego Unified Port DistrictJune 23, 2020 Page 6
ACTUAL ADJUSTED CHANGERESULTS BUDGET BUDGET FY 2021-2020 %FY 2019 FY 2020 FY 2021 BUDGET CHANGE
REAL ESTATEFixed Rent $ 20,230,477 $ 19,648,200 $ 20,055,000 $ 406,800 2.1 %Concession Revenue 82,972,799 90,070,100 63,994,200 (26,075,900) (29.0)%ACH Parking Facility Funding 222,502 222,500 226,300 3,800 1.7 %Other Rental Revenue 114,000 — — — N/A
Rents $ 103,539,778 $ 109,940,800 $ 84,275,500 $ (25,665,300) (23.3)%
Advertising $ 234,167 $ 170,000 $ 90,000 $ (80,000) (47.1)%Parking 1,317,252 1,950,300 1,411,700 (538,600) (27.6)%Park Usage Fees 1,053,245 1,043,400 691,000 (352,400) (33.8)%Miscellaneous Other Operating Revenue 28,036 — — — N/AReimbursed Cost/Cost Recovery 154,467 120,000 120,000 — 0.0 %Seaport Village Common Area Maintenance 1,261,872 3,000,900 1,392,800 (1,608,100) (53.6)%Seaport Village Marketing Fee 388,100 732,200 374,600 (357,600) (48.8)%Waived Fees (19,952) — — — N/AWaived Fees-Tidelands Activation Program (722,846) (682,900) (385,000) 297,900 (43.6)%
Fees & Service Charges $ 3,694,340 $ 6,333,900 $ 3,695,100 $ (2,638,800) (41.7)%
Damages Recovered $ 11,100 $ — $ — $ — N/ADonated Revenue 18,940 — — — N/AMisc Other Non-Operating Revenue 19,273,851 — — — N/A
Non-Operating Revenue $ 19,303,891 $ — $ — $ — N/A
TOTAL REAL ESTATE $ 126,538,009 $ 116,274,700 $ 87,970,600 $ (28,304,100) (24.3)%
PORT AS A SERVICE - PARKINGFixed Rent $ 454,656 $ 457,200 $ 356,400 $ (100,800) (22.0)%
Rents $ 454,656 $ 457,200 $ 356,400 $ (100,800) (22.0)%
Citations 849,368 851,700 636,200 (215,500) (25.3)%Parking 10,665,403 10,209,500 7,367,400 (2,842,100) (27.8)%Parking Meters 3,643,834 3,693,900 2,586,300 (1,107,600) (30.0)%Parking-Concession 1,508,391 1,225,900 782,400 (443,500) (36.2)%Reimbursed Cost/Cost Recovery 1,308 — — — N/AWaived Fees (7,950) — — — N/AWaived Fees-Tidelands Activation Program (56,885) (158,500) (78,900) 79,600 (50.2)%
Fees & Service Charges $ 16,603,469 $ 15,822,500 $ 11,293,400 $ (4,529,100) (28.6)%
TOTAL PORT AS A SERVICE - PARKING $ 17,058,125 $ 16,279,700 $ 11,649,800 $ (4,629,900) (28.4)%

Revenue by Operating Center
Final Budget FY 2021 Section 3 - Highlights San Diego Unified Port DistrictJune 23, 2020 Page 7
ACTUAL ADJUSTED CHANGERESULTS BUDGET BUDGET FY 2021-2020 %FY 2019 FY 2020 FY 2021 BUDGET CHANGE
MARITIMEFixed Rent $ 15,684,221 $ 16,564,800 $ 16,125,600 $ (439,200) (2.7)%Concession Revenue 2,257,540 2,364,600 1,752,200 (612,400) (25.9)%Storage Space Rental 2,796,489 2,442,500 1,453,800 (988,700) (40.5)%Other Rental Revenue 800,884 856,100 554,300 (301,800) (35.3)%
Rents $ 21,539,134 $ 22,228,000 $ 19,885,900 $ (2,342,100) (10.5)%
Bunkering $ 46,787 $ 39,300 $ 22,800 $ (16,500) (42.0)%Cruise Ship Passenger Fees 2,204,574 2,330,200 1,887,500 (442,700) (19.0)%Cruise Ship Passenger Security Charges 1,151,145 1,281,800 1,049,800 (232,000) (18.1)%Dockage 2,659,685 2,305,600 1,753,900 (551,700) (23.9)%Environmental Surcharge 12,267 9,700 21,600 11,900 122.7 %Permit & License Fees 1,482 1,000 1,000 — 0.0 %Parking 31,974 28,000 20,200 (7,800) (27.9)%Wharfage 10,930,116 11,809,700 8,547,100 (3,262,600) (27.6)%Miscellaneous Other Operating Revenue 83,962 270,000 145,800 (124,200) (46.0)%Maritime Incentive Credit (22,000) — — — N/AWaived Fees (7,000) (22,000) (15,900) 6,100 (27.7)%Waived Fees-Tidelands Activation Program (117,911) (252,500) (70,900) 181,600 (71.9)%
Fees & Service Charges $ 16,975,081 $ 17,800,800 $ 13,362,900 $ (4,437,900) (24.9)%
Utilities Furnished $ 101,560 $ 88,900 $ 107,200 $ 18,300 20.6 %Reimbursed Cost/Cost Recovery 33,953 58,000 59,200 1,200 2.1 %
Services $ 135,513 $ 146,900 $ 166,400 $ 19,500 13.3 %
Grant Revenue-Other 13,200 10,000 10,000 — 0.0 %Low Carbon Fuel Standard (LCFS) Revenue — — 386,000 386,000 N/A
Non-Operating Revenue $ 13,200 $ 10,000 $ 396,000 $ 386,000 3,860.0 %
TOTAL MARITIME $ 38,662,929 $ 40,185,700 $ 33,811,200 $ (6,374,500) (15.9)%
HARBOR POLICEFixed Rent $ 7,656 $ 7,600 $ 7,600 $ — 0.0 %
Rents $ 7,656 $ 7,600 $ 7,600 $ — 0.0 %
Citations $ 141,264 $ 115,000 $ 130,000 $ 15,000 13.0 %Piers & Floats 225,442 200,000 210,000 10,000 5.0 %Miscellaneous Other Operating Revenue 33,203 20,000 20,000 — 0.0 %
Fees & Service Charges $ 399,909 $ 335,000 $ 360,000 $ 25,000 7.5 %
Public Services Provided $ 16,514,850 $ 16,262,000 $ 16,262,000 $ — 0.0 %

Revenue by Operating Center
Final Budget FY 2021 Section 3 - Highlights San Diego Unified Port DistrictJune 23, 2020 Page 8
ACTUAL ADJUSTED CHANGERESULTS BUDGET BUDGET FY 2021-2020 %FY 2019 FY 2020 FY 2021 BUDGET CHANGE
Reimbursed Cost/Cost Recovery 146,386 15,000 30,000 15,000 100.0 %Services $ 16,661,236 $ 16,277,000 $ 16,292,000 $ 15,000 0.1 %
Damages Recovered $ 4,990 $ — $ — $ — N/AGrant Revenue-Other 670,894 1,149,600 1,092,000 (57,600) (5.0)%Misc Other Non-Operating Revenue (6) — 645,000 645,000 N/AAsset Forfeiture Proceeds-Harbor Police 239,482 — — — N/A
Non-Operating Revenue $ 915,360 $ 1,149,600 $ 1,737,000 $ 587,400 51.1 %
TOTAL HARBOR POLICE $ 17,984,161 $ 17,769,200 $ 18,396,600 $ 627,400 3.5 %
AQUACULTURE & BLUE TECHNOLOGYConcession Revenue $ 332 $ — $ — $ — N/A
Rents $ 332 $ — $ — $ — N/A
TOTAL AQUACULTURE & BLUETECHNOLOGY $ 332 $ — $ — $ — N/A
MISCELLANEOUSCitations $ 1,800 $ — $ — $ — N/AMiscellaneous Other Operating Revenue 98,526 — — — N/A
Miscellaneous Other Operating Revenue $ 100,326 $ — $ — $ — N/A
Public Services Provided $ 2,523,192 $ 2,624,300 $ 2,624,300 $ — 0.0 %Reimbursed Cost/Cost Recovery 23,556 103,000 100,000 (3,000) (2.9)%
Services $ 2,546,748 $ 2,727,300 $ 2,724,300 $ (3,000) (0.1)%
Partnership/Cost Sharing Reimbursement $ 1,170,213 $ 703,500 $ 484,000 $ (219,500) (31.2)%Partnership/Cost Sharing Reimbursement $ 1,170,213 $ 703,500 $ 484,000 $ (219,500) (31.2)%
Damages Recovered $ 241,222 $ — $ — $ — N/AGrants - Capital Project Reimbursement 8,715,645 15,084,195 6,047,500 (9,036,695) (59.9)%Grant Revenue-Other 368,293 53,700 — (53,700) (100.0)%Donated Revenue 160,000 840,000 420,000 (420,000) (50.0)%Reimbursed Legal Fees 654,041 — — — N/ALegal Settlements 601,583 — — — N/AMisc Other Non-Operating Revenue 1,245,364 300,000 300,000 — 0.0 %Car Rental Transaction Fees 4,646,460 3,000,000 3,000,000 — 0.0 %Sale of Surplus Items - Proceeds 80,579 60,000 60,000 — 0.0 %
Non-Operating Revenue $ 16,713,188 $ 19,337,895 $ 9,827,500 $ (9,510,395) (49.2)%
Interest - Investments $ 2,511,720 $ 1,700,000 $ 800,000 $ (900,000) (52.9)%Interest - Unamortized Bond Premium 56,548 — — — N/A

Revenue by Operating Center
Final Budget FY 2021 Section 3 - Highlights San Diego Unified Port DistrictJune 23, 2020 Page 9
ACTUAL ADJUSTED CHANGERESULTS BUDGET BUDGET FY 2021-2020 %FY 2019 FY 2020 FY 2021 BUDGET CHANGE
Unrealized Gain/Loss On Inv. (GASB 31) 761,277 — — — N/AInterest - Miscellaneous 363,548 — — — N/A
Investment Revenue $ 3,693,094 $ 1,700,000 $ 800,000 $ (900,000) (52.9)%
Discounts Earned $ 2,916 $ — $ — $ — N/AOther Revenue $ 2,916 $ — $ — $ — N/A
TOTAL MISCELLANEOUS $ 24,226,485 $ 24,468,695 $ 13,835,800 $ (10,632,895) (43.5)%
TOTAL REVENUE $ 224,470,041 $ 214,977,995 $ 165,664,000 $ (49,313,995) (22.9)%

Revenue by Operating Center
Final Budget FY 2021 Section 3 - Highlights San Diego Unified Port DistrictJune 23, 2020 Page 10
TOTAL REVENUE $ 165,664,000

Revenue by Account
Final Budget FY 2021 Section 3 - Highlights San Diego Unified Port DistrictJune 23, 2020 Page 11
ACTUAL ADJUSTED CHANGERESULTS BUDGET BUDGET FY 2021-2020 %FY 2019 FY 2020 FY 2021 BUDGET CHANGE
Fixed Rent $ 36,377,010 $ 36,677,800 $ 36,544,600 $ (133,200) (0.4)%Concession Revenue 85,230,671 92,434,700 65,746,400 (26,688,300) (28.9)%Storage Space Rental 2,796,489 2,442,500 1,453,800 (988,700) (40.5)%ACH Parking Facility Funding 222,502 222,500 226,300 3,800 1.7 %Other Rental Revenue 914,884 856,100 554,300 (301,800) (35.3)%RE Revenue from Rent Reduction 1 — — — N/AWaived Fees (34,902) (22,000) (15,900) 6,100 (27.7)%Waived Fees-Tidelands Activation Program (897,642) (1,093,900) (534,800) 559,100 (51.1)%
RENTS $ 124,609,014 $ 131,517,700 $ 103,974,700 $ (27,543,000) (20.9)%
Bunkering $ 46,787 $ 39,300 $ 22,800 $ (16,500) (42.0)%Advertising 234,167 170,000 90,000 (80,000) (47.1)%Citations 992,432 966,700 766,200 (200,500) (20.7)%Cruise Ship Passenger Fees 2,204,574 2,330,200 1,887,500 (442,700) (19.0)%Cruise Ship Passenger Security Charges 1,151,145 1,281,800 1,049,800 (232,000) (18.1)%Dockage 2,659,685 2,305,600 1,753,900 (551,700) (23.9)%Environmental Surcharge 12,267 9,700 21,600 11,900 122.7 %Permit & License Fees 1,482 1,000 1,000 — 0.0 %Parking 12,014,630 12,187,800 8,799,300 (3,388,500) (27.8)%Parking Meters 3,643,834 3,693,900 2,586,300 (1,107,600) (30.0)%Parking-Concession 1,508,391 1,225,900 782,400 (443,500) (36.2)%Park Usage Fees 1,053,245 1,043,400 691,000 (352,400) (33.8)%Piers & Floats 225,442 200,000 210,000 10,000 5.0 %Seaport Village Common Area Maintenance 1,261,872 3,000,900 1,392,800 (1,608,100) (53.6)%Seaport Village Marketing Fee 388,100 732,200 374,600 (357,600) (48.8)%Wharfage 10,930,116 11,809,700 8,547,100 (3,262,600) (27.6)%Miscellaneous Other Operating Revenue 243,727 290,000 165,800 (124,200) (42.8)%
FEES & SERVICE CHARGES $ 38,571,894 $ 41,288,100 $ 29,142,100 $ (12,146,000) (29.4)%
Public Services Provided $ 19,038,042 $ 18,886,300 $ 18,886,300 $ — 0.0 %Utilities Furnished 101,560 88,900 107,200 18,300 20.6 %Maritime Incentive Credit (22,000) — — — N/AReimbursed Cost/Cost Recovery 359,669 296,000 309,200 13,200 4.5 %
SERVICES $ 19,477,271 $ 19,271,200 $ 19,302,700 $ 31,500 0.2 %
Partnership/Cost Sharing Reimbursement $ 1,170,213 $ 703,500 $ 484,000 $ (219,500) (31.2)%OTHER $ 1,170,213 $ 703,500 $ 484,000 $ (219,500) (31.2)%
Damages Recovered $ 257,312 $ — $ — $ — N/AGrants - Capital Project Reimbursement 8,715,645 15,084,195 6,047,500 (9,036,695) (59.9)%
Revenue by Account
Final Budget FY 2021 Section 3 - Highlights San Diego Unified Port DistrictJune 23, 2020 Page 12
ACTUAL ADJUSTED CHANGERESULTS BUDGET BUDGET FY 2021-2020 %FY 2019 FY 2020 FY 2021 BUDGET CHANGE
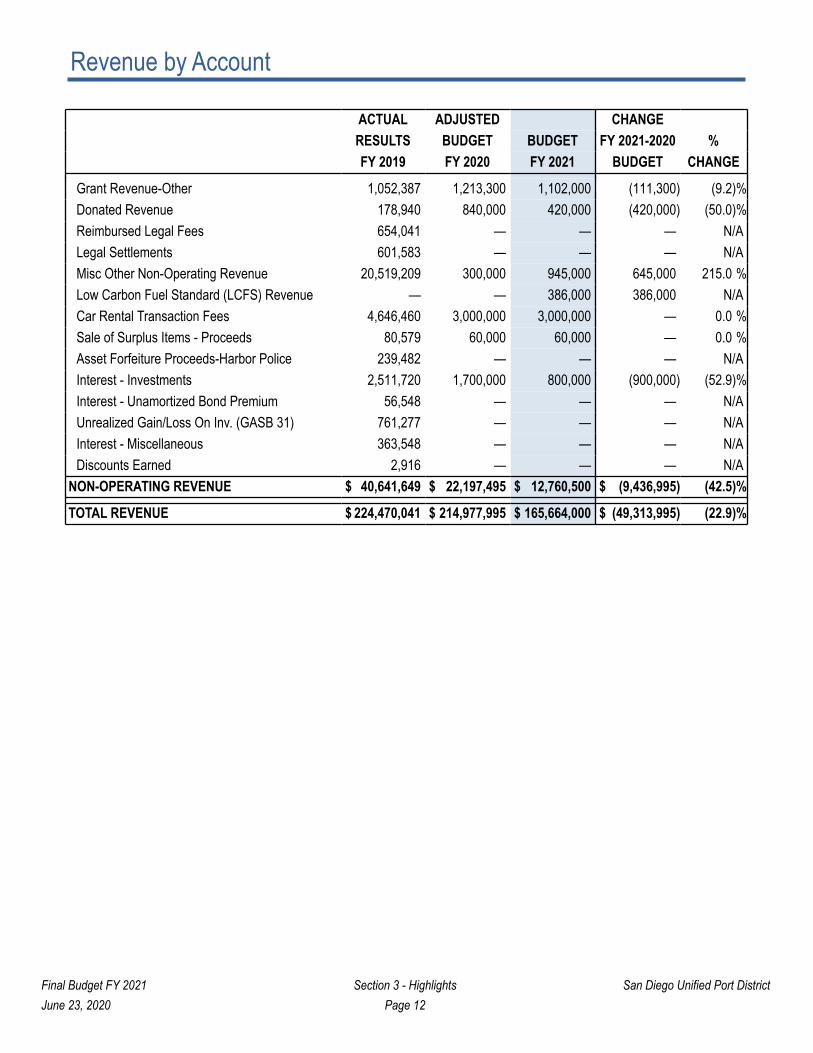
Grant Revenue-Other 1,052,387 1,213,300 1,102,000 (111,300) (9.2)%Donated Revenue 178,940 840,000 420,000 (420,000) (50.0)%Reimbursed Legal Fees 654,041 — — — N/ALegal Settlements 601,583 — — — N/AMisc Other Non-Operating Revenue 20,519,209 300,000 945,000 645,000 215.0 %Low Carbon Fuel Standard (LCFS) Revenue — — 386,000 386,000 N/ACar Rental Transaction Fees 4,646,460 3,000,000 3,000,000 — 0.0 %Sale of Surplus Items - Proceeds 80,579 60,000 60,000 — 0.0 %Asset Forfeiture Proceeds-Harbor Police 239,482 — — — N/AInterest - Investments 2,511,720 1,700,000 800,000 (900,000) (52.9)%Interest - Unamortized Bond Premium 56,548 — — — N/AUnrealized Gain/Loss On Inv. (GASB 31) 761,277 — — — N/AInterest - Miscellaneous 363,548 — — — N/ADiscounts Earned 2,916 — — — N/A
NON-OPERATING REVENUE $ 40,641,649 $ 22,197,495 $ 12,760,500 $ (9,436,995) (42.5)%
TOTAL REVENUE $ 224,470,041 $ 214,977,995 $ 165,664,000 $ (49,313,995) (22.9)%

Revenue by Account
Final Budget FY 2021 Section 3 - Highlights San Diego Unified Port DistrictJune 23, 2020 Page 13
TOTAL REVENUE $ 165,664,000

Final Budget FY 2021 Section 3 - Highlights San Diego Unified Port DistrictJune 23, 2020 Page 14
PAGE LEFT INTENTIONALLY BLANK

Staffing Overview
Final Budget FY 2021 Section 3 - Highlights San Diego Unified Port DistrictJune 23, 2020 Page 15
The District personnel expenses consist of limited along with regular employees. The District continues to manage the increasing demands for resources along with executing the strategic goals presented herein by relying more on the flexibility of having variable staff. Services of limited may be reduced at any time as the nature of the services are limited in duration. For instance, by Personnel Rule 14, in the event of an economic downturn in finances, reductions would first occur in this variable subset of staffing that is budgeted in the Variable Staffing cost center. The variable personnel expense will still be included as part of the Total Personnel Expense Appropriation, consistent with prior year's budget.
The following cost-saving measures are being implemented:
• Released all Interns and Temporary Staff• Stopped hiring for all vacant positions except Dispatcher positions and reduced overtime• 2% pay-cut for all Unrepresented employees with annual salaries greater than $75k• Unfunded 28 vacant regular positions of the 585 budgeted
As we continue to monitor finances throughout the year, some additional strategies and measures may be implemented as needed.
Final Budget FY 2021 Section 3 - Highlights San Diego Unified Port DistrictJune 23, 2020 Page 16
PAGE LEFT INTENTIONALLY BLANK

Expense Highlights
Final Budget FY 2021 Section 3 - Highlights San Diego Unified Port DistrictJune 23, 2020 Page 17
Total operating and non-operating expenses for the District are budgeted at $157.1M, a decrease of $18.1M, or 10.3%, from the prior fiscal year. As a direct consequence of the COVID-19 pandemic, the hospitality and maritime trade economic activity that generates the revenues necessary for our mission-critical work has dropped into dramatic decline. Unlike many public agencies, the District receives no tax funds to help stabilize revenues in the midst of this crisis. Once the revenue projections were calculated, staff turned to expenses to try to match as closely as possible the revenue projections in a managed approach to budgeting for expenses.
The expenses continue to include mission-critical and strategic projects which fulfill the District’s mission and trust obligations. Significant budget-to-budget variances are projected in the following areas due to reductions of FY 2021 budgets to primarily focus on the cost of minimum work and regulatory requirements required to remain in compliance, and to advance our top priority projects during the COVID-19 pandemic:
Personnel Expense
Fiscal Year 2021 Personnel Expense is budgeted at $101.7M, a $1.7M decrease or 1.6% from the previous year’s adjusted budget. The following cost-saving measures are being implemented: Released all interns and temporary staff, stopped all hiring for vacant positions except dispatcher positions, reduced overtime, a 2% pay-cut for all unrepresented employees with annual salaries of $75k and above, and unfunded 28 vacant regular positions of the 585 budgeted.
Budgeted Personnel Expense consists of Salaries & Wages, Overtime, and Burden.
• Salaries & Wages (not including Overtime) is budgeted at $57.6M, a decrease of $2.2M, or 3.7%.
• Burden is budgeted at $41.3M, an increase of $1.4M, or 3.4% from the prior fiscal year. This includes District-responsible payroll taxes and employee health benefits, as well as $19.7M Actuarial Determined Contribution to the District's pension plan.
Non-Personnel Expense
Overall, Non-Personnel Expense (NPE) is budgeted at $57.8M, a decrease of $18.0M, or 23.8%, from the prior fiscal year. Significant budget-to-budget variances for certain NPE accounts are due to reductions in FY 2021 budgets to primarily focus on the cost of minimum work and regulatory requirements required to remain in compliance, and to advance our top priority projects during the COVID-19 pandemic:
• Services - Professional & Other is budgeted at $6.8M, a decrease of $4.7M, or 41.1%.
• Services - Security is budgeted at $2.0M, a decrease of $225k, or 10.0%.
• Space Rental is budgeted at $1.1M, an increase of $216k, or 25.8%.
• Common Area Maintenance is budgeted at $2.0M, a decrease of $1.2M, or 37.2%.
• Major Maintenance Expense is budgeted at $510k, a decrease of $140k, or 21.5%.
• Tenant Improvements are budgeted at $575k, a decrease of $1.0M, or 62.6%.
• Joint Programs/Studies Assistance is budgeted at $673k, a decrease of $600k, or 47.1%.
Capitalized Labor
Capitalized labor is budgeted at $2.4M, a decrease of $1.6M, or 41.1%, from the prior fiscal year. Capitalized labor is internal labor costs (personnel and overhead) that are directly incurred in the development and construction of approved capital projects.
Expense Highlights
Final Budget FY 2021 Section 3 - Highlights San Diego Unified Port DistrictJune 23, 2020 Page 18
Generally Accepted Accounting Principles (GAAP) requires capitalization of these costs and since these costs are already included in the Salaries & Wages and the associated NPE for overhead, capital labor is considered a reduction in expense when capitalized. Capitalized labor for FY 2021 is included in the CIP, MM, Other Capital Projects, and TMP project budgets.

Expense by Account
Final Budget FY 2021 Section 3 - Highlights San Diego Unified Port DistrictJune 23, 2020 Page 19
ACTUAL ADJUSTED CHANGERESULTS BUDGET BUDGET FY 2021-2020 %
LINE ITEM FY 2019 FY 2020 FY 2021 BUDGET CHANGE
Salaries & Wages $ 54,085,689 $ 59,844,300 $ 57,636,000 $ (2,208,300) (3.7)%Overtime 3,248,928 3,276,700 2,775,400 (501,300) (15.3)%Temporary Personnel 107,250 342,300 — (342,300) (100.0)%
SALARIES & WAGES $ 57,441,867 $ 63,463,300 $ 60,411,400 $ (3,051,900) (4.8)%
Burden Expense $ 36,594,316 $ 39,917,800 $ 41,269,700 $ 1,351,900 3.4 %SUBTOTAL PERSONNEL $ 94,036,183 $ 103,381,100 $ 101,681,100 $ (1,700,000) (1.6)%
Awards - Service $ 1,140 $ 5,200 $ 700 $ (4,500) (86.5)%Books & Periodicals 82,285 66,400 40,900 (25,500) (38.4)%Employee Recognition 36,895 46,700 8,100 (38,600) (82.7)%Memberships & Dues 331,798 309,300 157,400 (151,900) (49.1)%Health & Wellness 5,196 1,500 200 (1,300) (86.7)%Recruiting 213,925 36,000 12,200 (23,800) (66.1)%Seminars & Training 463,252 742,100 249,600 (492,500) (66.4)%Tuition Reimbursement Program 48,335 55,000 31,600 (23,400) (42.5)%
STAFF DEVELOPMENT $ 1,182,826 $ 1,262,200 $ 500,700 $ (761,500) (60.3)%
Mileage Reimbursement $ 214,992 $ 227,800 $ 177,200 $ (50,600) (22.2)%Travel 638,417 666,900 216,800 (450,100) (67.5)%
TRAVEL $ 853,409 $ 894,700 $ 394,000 $ (500,700) (56.0)%
Services - Professional & Other $ 14,969,975 $ 11,474,381 $ 6,754,500 $ (4,719,881) (41.1)%Services - Legal - Port Attorney 2,269,811 2,931,400 1,524,500 (1,406,900) (48.0)%Services - Security 1,914,302 2,252,200 2,026,800 (225,400) (10.0)%Services - Operator Retention 2,821,477 2,780,500 1,970,400 (810,100) (29.1)%Aquaculture & Blue Technology 137,000 450,000 195,000 (255,000) (56.7)%
CONTRACTUAL SERVICES $ 22,112,565 $ 19,888,481 $ 12,471,200 $ (7,417,281) (37.3)%
Breakage & Obsolescence $ 1,039 $ — $ — $ — N/AEquipment & Systems 2,869,584 2,342,700 2,006,000 (336,700) (14.4)%Equipment Rental/Leasing 224,670 337,900 250,500 (87,400) (25.9)%Office & Operating Supplies 326,787 319,400 232,600 (86,800) (27.2)%Postage & Shipping 48,665 37,600 37,600 — 0.0 %Safety Equipment & Supplies 280,375 438,500 316,400 (122,100) (27.8)%Small Tools 71,630 34,000 20,900 (13,100) (38.5)%Fuel & Lubricants 674,155 638,500 668,900 30,400 4.8 %Parking Meter Supplies 1,831 12,000 12,000 — 0.0 %Blueprints 64 500 — (500) (100.0)%Uniforms 295,385 307,700 291,600 (16,100) (5.2)%

Expense by Account
Final Budget FY 2021 Section 3 - Highlights San Diego Unified Port DistrictJune 23, 2020 Page 20
ACTUAL ADJUSTED CHANGERESULTS BUDGET BUDGET FY 2021-2020 %
LINE ITEM FY 2019 FY 2020 FY 2021 BUDGET CHANGE
SUPPLIES & EQUIPMENT $ 4,794,187 $ 4,468,800 $ 3,836,500 $ (632,300) (14.1)%
Space Rental $ 426,331 $ 836,000 $ 1,051,700 $ 215,700 25.8 %Telephone & Communications 1,153,573 1,254,400 1,322,300 67,900 5.4 %Utilities - Gas & Electric 1,820,257 1,696,300 1,690,000 (6,300) (0.4)%Utilities - Water 1,284,725 1,427,800 1,500,000 72,200 5.1 %Facility Management Services 5,463,865 3,054,200 2,578,600 (475,600) (15.6)%
FACILITIES EXPENSE $ 10,148,751 $ 8,268,700 $ 8,142,600 $ (126,100) (1.5)%
Common Area Maintenance $ — $ 3,187,500 $ 2,000,300 $ (1,187,200) (37.2)%Facilities Maintenance - Supplies 1,009,125 807,000 610,800 (196,200) (24.3)%Facilities Maintenance - Outside Services 3,045,610 3,748,800 2,753,300 (995,500) (26.6)%Major Maintenance Expense 221,283 650,000 510,000 (140,000) (21.5)%Equipment Maintenance - Supplies 296,001 279,500 279,200 (300) (0.1)%Equipment Maintenance - Outside Services 1,784,375 2,113,200 1,472,000 (641,200) (30.3)%As - Needed Maintenance 1,061,657 970,600 601,400 (369,200) (38.0)%Software Maintenance 903,101 992,400 864,200 (128,200) (12.9)%Tenant Improvements — 1,537,200 575,000 (962,200) (62.6)%
MAINTENANCE & REPAIRS $ 8,321,152 $ 14,286,200 $ 9,666,200 $ (4,620,000) (32.3)%
Advertising $ 32,272 $ 55,300 $ 45,400 $ (9,900) (17.9)%Marketing Fees — 788,600 580,400 (208,200) (26.4)%Marketing/Outreach 2,200,236 2,579,500 923,000 (1,656,500) (64.2)%Promotional Services 464,626 467,600 122,500 (345,100) (73.8)%Promotional Materials 167,849 172,000 66,900 (105,100) (61.1)%Svcs - Fire, Police, Rescue, Emergency 7,995,558 8,143,400 8,329,800 186,400 2.3 %Eligible Environmental Fund Expenditures 2,107,574 1,321,800 900,000 (421,800) (31.9)%Grant Funded Expenditures 443,122 500,545 536,400 35,855 7.2 %Public Art Fund Expenditures 314,746.27 820,000 400,000 (420,000) (51.2)%Remediation 74,007 50,000 300,000 250,000 500.0 %Refuse & Hazardous Waste Disposal 195,700 159,000 159,000 — 0.0 %Joint Programs/Studies Assistance 738,425 1,272,400 672,600 (599,800) (47.1)%Public Art Program 54,105 175,000 55,400 (119,600) (68.3)%
COMMUNITY & ENVIRONMENTAL SUPPORT $ 14,788,222 $ 16,505,145 $ 13,091,400 $ (3,413,745) (20.7)%
Bank & Credit Card Fees $ 358,418 $ 382,900 $ 268,100 $ (114,800) (30.0)%Insurance 1,259,977 1,401,500 1,998,100 596,600 42.6 %Insurance Claims — 5,000 800 (4,200) (84.0)%Permits/Certificates/License 30,319 62,100 56,400 (5,700) (9.2)%Legal Settlements 148,808 — — — N/A

Expense by Account
Final Budget FY 2021 Section 3 - Highlights San Diego Unified Port DistrictJune 23, 2020 Page 21
ACTUAL ADJUSTED CHANGERESULTS BUDGET BUDGET FY 2021-2020 %
LINE ITEM FY 2019 FY 2020 FY 2021 BUDGET CHANGE
Retiree Health Benefits (Paid) 3,616,196 3,322,300 3,642,000 319,700 9.6 %Preservation of Benefits Plan (POB) 243,000 265,000 265,000 — 0.0 %Other Miscellaneous Operating Expenses (299,183) 1,060,700 159,000 (901,700) (85.0)%
RISK MGMT, RETIREE HEALTH & OTHER $ 5,357,535 $ 6,499,500 $ 6,389,400 $ (110,100) (1.7)%
SUBTOTAL NON-PERSONNEL $ 67,558,647 $ 72,073,726 $ 54,492,000 $ (17,581,726) (24.4)%
Capitalized Labor $ (3,579,661) $ (3,989,500) $ (2,350,000) $ 1,639,500 (41.1)%
SUBTOTAL OPERATING $ 158,015,168 $ 171,465,326 $ 153,823,100 $ (17,642,226) (10.3)%
Financial Assistance/Grants/Contributions $ 50,086 $ 1,078,165 $ 865,000 $ (213,165) (19.8)%FINANCIAL ASSISTANCE $ 50,086 $ 1,078,165 $ 865,000 $ (213,165) (19.8)%
Interest-SDCRAA, NEVP, & Other Misc $ 1,850,349 $ 1,718,700 $ 1,560,700 $ (158,000) (9.2)%Interest Expense - Series A 2004 Bonds 76,608 9,800 — (9,800) (100.0)%Interest Expense - Series A 2013 Bonds 984,329 963,900 890,100 (73,800) (7.7)%
MISCELLANEOUS INTEREST $ 2,911,285 $ 2,692,400 $ 2,450,800 $ (241,600) (9.0)%
Seized Asset/Forfeitures-Harbor Police $ 88,272 $ — $ — $ — N/AOther Misc Non-Operating Expense 6,357 — — — N/A
OTHER MISCELLANEOUS $ 94,629 $ — $ — $ — N/A
SUBTOTAL NON-OPERATING $ 3,056,000 $ 3,770,565 $ 3,315,800 $ (454,765) (12.1)%
TOTAL $ 161,071,169 $ 175,235,891 $ 157,138,900 $ (18,096,991) (10.3)%

Expense by Account
Final Budget FY 2021 Section 3 - Highlights San Diego Unified Port DistrictJune 23, 2020 Page 22
EXPENSE $ 159,488,900
CAPITALIZED LABOR (2,350,000)
TOTAL EXPENSE $ 157,138,900

Debt Management Highlights
Final Budget FY 2021 Section 3 - Highlights San Diego Unified Port DistrictJune 23, 2020 Page 23
Promissory Note to the SDCRAA. As part of the January 2003 transfer of the airport, the District issued a $50.0M promissory note to SDCRAA. In accordance with the May 20, 2004 settlement agreement, the note is being amortized over 25 years beginning in January 2006 at a fixed interest rate of 5.5% per annum.
Revenue Bonds. The District issued revenue bonds on October 28, 2004. The debt issuance consisted of $23.0M Series A and $26.5M Series B bonds for a total of $49.5M. The 2004 series A bonds were fully paid in August 2019. The bonds were issued to reimburse the District for previously incurred expenditures on Capital Improvement Program (CIP) projects approved by the Board of Port Commissioners.
On November 20, 2013, the District refunded its $26.5M Series B 2004 Bonds which resulted in the issuance of $25.5M Series A 2013 Revenue Bonds for a term of 16 years with interest rates ranging from 2.0% to 5.0% with maturity dates ranging from September 1, 2014 to September 1, 2029.
Civic San Diego (formerly, Center City Development Corporation). In April 2007, the City of San Diego and the Redevelopment Agency of the City of San Diego, acting through Civic San Diego, executed a Joint Exercise of Power Agreement (JPA) to design and implement the NEVP Phase I project.
The first amendment to the JPA was executed on February 28, 2011. Project costs for the first phase are shared equally between the District and Civic San Diego at $14.3M each. Project costs have subsequently increased to $15.6M. The District commenced repaying Civic San Diego $850k annually on July 1, 2013 at a fixed interest rate of 4.77% per annum. After applying certain credits for previous work on Broadway Pier, principal payments, and offsets for future maintenance and security credits of $7.9M, the loan balance as of June 30, 2019 is $1.4M. The Civic San Diego loan will be fully paid in FY 2021.
Debt Service Payments FY 2021. Payments are estimated at $7.5M (see table below).
Debt Limits. According to section 28 of the Port Act, the District may not incur general obligation bonded debt that exceeds 15.0% of the assessed value of its real and personal property. There are also statutory debt limits that further constrain the District borrowing. At this time, the District does not have any general obligation bonds outstanding. The District has never failed to pay its principal and interest payments when due.
DEBT SERVICE PAYMENTSBUDGET
PRINCIPAL INTEREST FY 2021 SDCRAA Promissory Note $ 2,123,800 $ 1,560,700 $ 3,684,500 2013 Revenue Bonds (Series A) 1,995,000 1,153,800 3,148,800 Civic San Diego 665,700 — 665,700 TOTAL $ 4,784,500 $ 2,714,500 $ 7,499,000

Final Budget FY 2021 Section 3 - Highlights San Diego Unified Port DistrictJune 23, 2020 Page 24
PAGE LEFT INTENTIONALLY BLANK
Equipment Outlay and Other Capital Projects
Final Budget FY 2021 Section 3 - Highlights San Diego Unified Port DistrictJune 23, 2020 Page 25
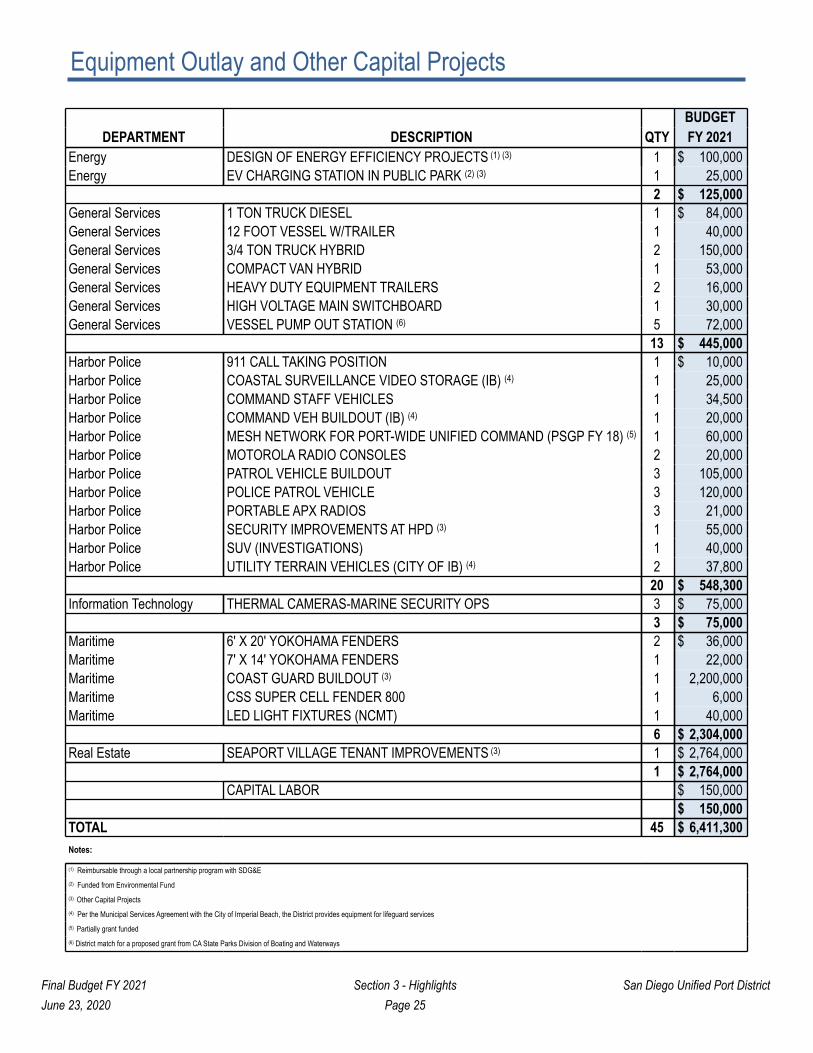
BUDGETDEPARTMENT DESCRIPTION QTY FY 2021
Energy DESIGN OF ENERGY EFFICIENCY PROJECTS (1) (3) 1 $ 100,000Energy EV CHARGING STATION IN PUBLIC PARK (2) (3) 1 25,000
2 $ 125,000General Services 1 TON TRUCK DIESEL 1 $ 84,000General Services 12 FOOT VESSEL W/TRAILER 1 40,000General Services 3/4 TON TRUCK HYBRID 2 150,000General Services COMPACT VAN HYBRID 1 53,000General Services HEAVY DUTY EQUIPMENT TRAILERS 2 16,000General Services HIGH VOLTAGE MAIN SWITCHBOARD 1 30,000General Services VESSEL PUMP OUT STATION (6) 5 72,000
13 $ 445,000Harbor Police 911 CALL TAKING POSITION 1 $ 10,000Harbor Police COASTAL SURVEILLANCE VIDEO STORAGE (IB) (4) 1 25,000Harbor Police COMMAND STAFF VEHICLES 1 34,500Harbor Police COMMAND VEH BUILDOUT (IB) (4) 1 20,000Harbor Police MESH NETWORK FOR PORT-WIDE UNIFIED COMMAND (PSGP FY 18) (5) 1 60,000Harbor Police MOTOROLA RADIO CONSOLES 2 20,000Harbor Police PATROL VEHICLE BUILDOUT 3 105,000Harbor Police POLICE PATROL VEHICLE 3 120,000Harbor Police PORTABLE APX RADIOS 3 21,000Harbor Police SECURITY IMPROVEMENTS AT HPD (3) 1 55,000Harbor Police SUV (INVESTIGATIONS) 1 40,000Harbor Police UTILITY TERRAIN VEHICLES (CITY OF IB) (4) 2 37,800
20 $ 548,300Information Technology THERMAL CAMERAS-MARINE SECURITY OPS 3 $ 75,000
3 $ 75,000Maritime 6' X 20' YOKOHAMA FENDERS 2 $ 36,000Maritime 7' X 14' YOKOHAMA FENDERS 1 22,000Maritime COAST GUARD BUILDOUT (3) 1 2,200,000Maritime CSS SUPER CELL FENDER 800 1 6,000Maritime LED LIGHT FIXTURES (NCMT) 1 40,000
6 $ 2,304,000Real Estate SEAPORT VILLAGE TENANT IMPROVEMENTS (3) 1 $ 2,764,000
1 $ 2,764,000CAPITAL LABOR $ 150,000
$ 150,000TOTAL 45 $ 6,411,300Notes:
(1) Reimbursable through a local partnership program with SDG&E(2) Funded from Environmental Fund(3) Other Capital Projects(4) Per the Municipal Services Agreement with the City of Imperial Beach, the District provides equipment for lifeguard services(5) Partially grant funded(6) District match for a proposed grant from CA State Parks Division of Boating and Waterways

Final Budget FY 2021 Section 3 - Highlights San Diego Unified Port DistrictJune 23, 2020 Page 26
PAGE LEFT INTENTIONALLY BLANK

Seaport Village Highlights
Final Budget FY 2021 Section 3 - Highlights San Diego Unified Port DistrictJune 23, 2020 Page 27
Seaport Village is a tourist-oriented specialty retail shopping center consisting of approximately 90,000 square feet of specialty retailers, restaurants, outdoor entertainment, and parking on an approximately 14-acre Bayfront site located at 849 West Harbor Drive in San Diego, California. Seaport Village was managed and operated by Terramar Retail Centers, LLC (Terramar) on behalf of Seaport Village Operating Company, LLC under a long-term ground lease which expired on September 30, 2018. The District assumed ownership of the Seaport Village assets on October 1, 2018, which consist of 32 buildings and one over-water structure. The property has 57 tenants and is currently managed and operated by a property management company on the District’s behalf.
For FY 2021, the District is budgeting approximately $7.3M in revenue for Seaport Village, which consists of four categories: base rent generated from tenant leases (fixed and concession revenue), common area maintenance (CAM) fee recovery income, marketing fee recovery income, and parking revenue. The District is budgeting approximately $2.8M in operating expenses for Seaport Village, based on the following three categories: projected leasing commissions to the District's commercial broker for leasing vacant spaces; management's operating budget for the day-to-day management, operation, and maintenance of Seaport Village; and marketing expenditures to spread the word about this unique waterfront venue. The District is also budgeting $3.3Min investment spending for tenant improvements and activation and site enhancements. By investing in these expenditures, the District will be taking a proactive approach in order to ensure that Seaport Village operates efficiently and continues to serve as a vibrant and prosperous waterfront destination for residents, visitors and the businesses that operate it until the redevelopment of the Central Embarcadero commences.
SUMMARY OF SEAPORT VILLAGE REVENUE AND EXPENDITURES BUDGETFY 2021
Revenue Sources: (1)
Fixed Rent $ 28,000Concession Revenue 4,092,600Common Area Maintenance 1,392,800Marketing Fee 374,600Parking Revenue 1,411,700
Total Revenue Sources $ 7,299,700Operating Expenses: (2)
Broker Services $ 200,000Common Area Maintenance (3) 2,000,300Marketing Fee 580,400
Total Operating Expenses $ 2,780,700Operating Income $ 4,519,000Investment Spending:Tenant Improvements (4) $ 2,764,000Activation and Site Enhancements (2) 575,000
Total Investment Spending $ 3,339,000Total Income After Investment Spending $ 1,180,000
Notes:(1) Revenue sources for Seaport Village are budgeted in the Real Estate profit center (see Section 3, Page 6)
(2) Operating expenses and Activation and Site Enhancements are budgeted in Real Estate
(3) Management's operating budget is included in Common Area Maintenance expense
(4) Tenant Improvements are budgeted in Equipment Outlay and Other Capital Projects (see Section 3, Page 25)

Final Budget FY 2021 Section 3 - Highlights San Diego Unified Port DistrictJune 23, 2020 Page 28
PAGE LEFT INTENTIONALLY BLANK

Public Art Fund Highlights
Final Budget FY 2021 Section 3 - Highlights San Diego Unified Port DistrictJune 23, 2020 Page 29
In 1982, the Public Art Fund was established in BPC Policy No. 609: Public Art Programs, for the purpose of accumulating funds for the inclusion of public artworks within the tidelands of the District's five member cities to help create a vibrant waterfront destination. Since then, most of the 70 permanent public artworks now in the District’s “Tidelands Collection,” plus numerous temporary artwork exhibitions, have been funded from the Public Art Fund. Though originally funded by an annual budget set-aside equivalent to a fraction of one-percent of the District’s projected annual gross revenues, plus accrued interest, the Public Art Fund has since become, as well, a depository for funds received from other sources, such as: tenant percent for art in-lieu of contributions; aggregated percent for art contributions from Capital Improvement Program projects; art-related grants, donations or bequests from outside sources; and any future income that may accrue from the potential sale, loan or licensing of artworks. Monies in the Public Art Fund are reserved for expenditures for special art acquisitions or exhibitions of exceptional merit, quality, and significance for the tidelands and the greater San Diego region.
The District’s vision for the waterfront includes investing in the community through creative placemaking with innovative artworks, cultural programming, and activation opportunities that enhance the visual excitement and cultural richness of District tidelands. Waterfront Arts & Activation staff provides leadership, advocacy, and support for arts and culture programming that contributes to the creative economy and economic vitality of the region. The 13-member Arts, Culture & Design Committee serves as an advisory panel to staff and the Board of Port Commissioners and supports the development of arts and cultural programs within the District’s jurisdiction.
Coronado Bridge Lighting Project
In FY 2021, the District will continue progressing through Phase 2 of the bridge lighting project, which commenced during the third quarter of FY 2018 and is projected to continue through mid-FY 2023. During Phase 2, the design team consisting of the artist, architectural lighting specialists, and consulting engineers, will continue developing and updating the bridge lighting concept design and documenting its full project description in a project report. Concurrently during FY 2021, work will advance on the project’s Phase 3 design development with a goal of achieving 60% design submittal within the fiscal year.
The Phase 2 project report will be subject to engineering review and approval by the California Department of Transportation (Caltrans) and will serve as the basis for environmental studies and reviews, including preparation and certification of the environmental document in accordance with the California Environmental Quality Act (CEQA). The goal of the project is to illuminate the San Diego-Coronado Bridge with an artistic and dynamic colored light-emitting diode (LED) lighting installation that is computer programmable and powered by sustainable energy sources. The project is being funded through charitable donations from businesses and the public, plus in-lieu percent-for-art contributions from District tenants.

Public Art Fund Highlights
Final Budget FY 2021 Section 3 - Highlights San Diego Unified Port DistrictJune 23, 2020 Page 30
SUMMARY OF PUBLIC ART FUND
ACTUAL ADJUSTEDRESULTS BUDGET BUDGETFY 2019 FY 2020 FY 2021
Beginning Balance $ 1,073,715 $ 920,800 $ 837,300
Income SourcesInterest Income (1) $ 21,844 $ 26,500 $ 6,300Donation (2) — 820,000 400,000Tenant Percent for Art in-lieu of Contributions 140,000 — —
Total Income $ 161,844 $ 846,500 $ 406,300
ExpendituresPublic Art (3) $ 300,091 $ 820,000 $ 400,000Capital Projects (4) 14,655 110,000 —
Total Expenditures $ 314,746 $ 930,000 $ 400,000
Ending Balance $ 920,813 $ 837,300 $ 843,600
Notes:(1) Monies placed in the Fund shall be accounted for separately from other District funds and any earnings thereon shall accrue to the Fund(2) Donation includes donations from fundraising efforts towards the Coronado Bridge Lighting project as well as a Tenant percent for art in-lieu of contributions(3) Public Art expenses are primarily for the Coronado Bridge Lighting project, and funds will not be expended if donations are not received(4) FY 2020 Budget is for art works

Environmental Fund Highlights
Final Budget FY 2021 Section 3 - Highlights San Diego Unified Port DistrictJune 23, 2020 Page 31
In 2006, the Environmental Fund was established by BPC Policy 730: the Port Environmental Advisory Committee Policy, for the purpose of reviewing and providing input and recommendations on District environmental programs and initiatives, and commenting on funding projects aimed at improving the condition of the Bay and surrounding District tidelands. In approving the policy, the Board of Port Commissioners created both the Environmental Advisory Committee (Committee) and the Environmental Fund (Fund). The key component of the Committee and Fund is to support projects that ensure the Districts’s compliance with environmental laws and regulations, as well as, advising the Board on actions that can be taken for the protection and improvement of the environmental conditions of the Bay and surrounding tidelands. Additionally, the Committee and Fund meet the District’s goal of “A Port with a healthy and sustainable bay and its environment.” To date, the Fund has supported more than 82 projects worth over $15 million with the projects bringing in over $11 million in matching funds. The Fund specifically supports projects that address air, water and sediment quality; sustainability and climate action planning; natural resources and endangered species management; habitat creation, restoration or protection; reclaiming natural shoreline conditions; environmental education; research and monitoring; and/or other issues in the Bay and/or the tidelands. The 18 member Committee is an advisory committee to staff and the Board and consists of stakeholder representatives from environmental advocacy groups, the US Navy, regulatory agencies, resource agencies, member cities, academia, local business, and labor.
The Environmental Fund is funded in accordance with BPC Policy No. 730, which sets aside one-half of one percent (1/2 of 1%) of the District’s projected gross revenues for that year. The gross revenue shall not include anticipated grants from any source or any other restricted revenue source.
INITIATIVES DESCRIPTION OF EXPENDITURESBUDGETFY 2021
AIR QUALITY MARITIME CLEAN AIR PROJECTS $ 50,000ENDANGERED SPECIES CLAPPER RAIL PROPAGATION PROGRAM 20,000ENVIRONMENTAL EDUCATION ENVIRONMENTAL EDU SCHOOL PARTNERSHIP 171,600MITIGATION/RESTORATION ON-CALL PLANNING - MITIGATION BANKING 29,700MITIGATION/RESTORATION MITIGATION BANKING 285,000MITIGATION/RESTORATION SHORELINE EROSION STUDY-OYSTER REEF 20,000RESEARCH & MONITORING BAYWIDE ECOLOGICAL ANALYSES 145,000RESEARCH & MONITORING BAYWIDE COLLABORATION 107,000RESEARCH & MONITORING COASTAL AND BAY CLEAN-UPS 15,200RESEARCH & MONITORING CV BAYFRONT SETTLEMENT AGREEMENT 30,000RESEARCH & MONITORING EELGRASS SURVEYS 16,000SUSTAINABILITY GREEN MARINE PARTICIPATION 10,500
TOTAL NON-CAPITAL PROJECT COSTS $ 900,000
SUSTAINABILITY EV CHARGING STATION IN PUBLIC PARK 25,000TOTAL CAPITAL PROJECT COSTS $ 25,000
TOTAL EXPENDITURES $ 925,000

Environmental Fund Highlights
Final Budget FY 2021 Section 3 - Highlights San Diego Unified Port DistrictJune 23, 2020 Page 32
SUMMARY OF ENVIRONMENTAL FUND
ACTUAL ADJUSTEDRESULTS BUDGET BUDGETFY 2019 FY 2020 FY 2021
Beginning Balance $ 3,514,452 $ 1,237,000 $ 961,900
Income SourcesPort Revenues for Environmental Fund (1) $ 166,104,200 $ 167,526,670 $ 127,585,720Set-Aside Percentage 0.5% 0.5% 0.5%Total Set-Aside $ 830,500 $ 837,600 $ 637,900Total Set-Aside Not Funded (2) — — (637,900)Interest Income (3) 62,935 16,100 8,400
Total Income $ 893,435 $ 853,700 $ 8,400
ExpendituresNon-Capital Project Costs $ 2,107,574 $ 1,321,800 $ 900,000Capital Project Costs 1,063,316 — 25,000Estimated Costs Not Expended in Fiscal Year — (193,000) —
Total Expenditures $ 3,170,890 $ 1,128,800 $ 925,000
Ending Balance $ 1,236,997 $ 961,900 $ 45,300
Notes:(1) According to BPC Policy No. 730, for the purpose of the Environmental Fund gross revenue calculation, gross revenue shall be based upon projected revenues and
shall not include anticipated grants from any source or any other restricted revenue source(2) FY 2021 Total Set-Aside will not be funded due to the negative financial impact of the COVID-19 pandemic.(3) Monies placed in the Fund shall be accounted for separately from other District funds and any earnings thereon shall accrue to the Fund
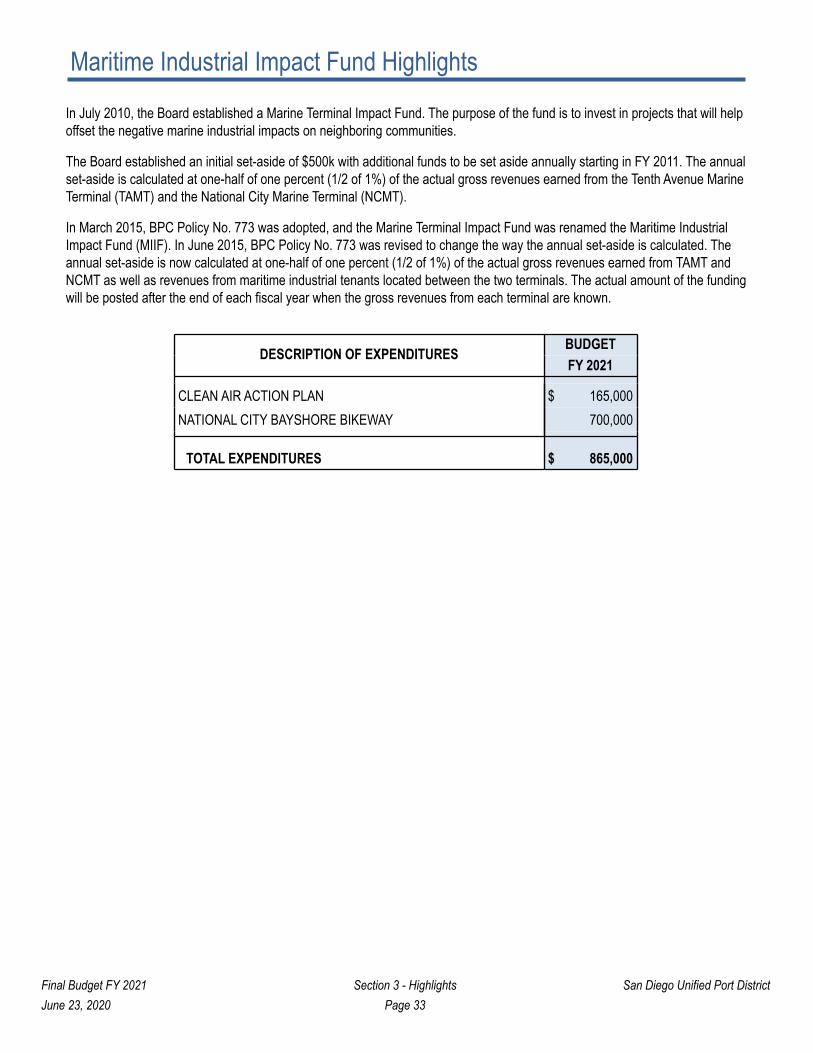
Maritime Industrial Impact Fund Highlights
Final Budget FY 2021 Section 3 - Highlights San Diego Unified Port DistrictJune 23, 2020 Page 33
In July 2010, the Board established a Marine Terminal Impact Fund. The purpose of the fund is to invest in projects that will help offset the negative marine industrial impacts on neighboring communities.
The Board established an initial set-aside of $500k with additional funds to be set aside annually starting in FY 2011. The annual set-aside is calculated at one-half of one percent (1/2 of 1%) of the actual gross revenues earned from the Tenth Avenue Marine Terminal (TAMT) and the National City Marine Terminal (NCMT).
In March 2015, BPC Policy No. 773 was adopted, and the Marine Terminal Impact Fund was renamed the Maritime Industrial Impact Fund (MIIF). In June 2015, BPC Policy No. 773 was revised to change the way the annual set-aside is calculated. The annual set-aside is now calculated at one-half of one percent (1/2 of 1%) of the actual gross revenues earned from TAMT and NCMT as well as revenues from maritime industrial tenants located between the two terminals. The actual amount of the funding will be posted after the end of each fiscal year when the gross revenues from each terminal are known.
DESCRIPTION OF EXPENDITURES BUDGETFY 2021
CLEAN AIR ACTION PLAN $ 165,000NATIONAL CITY BAYSHORE BIKEWAY 700,000
TOTAL EXPENDITURES $ 865,000

Maritime Industrial Impact Fund Highlights
Final Budget FY 2021 Section 3 - Highlights San Diego Unified Port DistrictJune 23, 2020 Page 34
ACTUAL ADJUSTEDRESULTS BUDGET BUDGETFY 2019 FY 2020 FY 2021
Beginning Balance $ 1,720,903 $ 1,882,000 $ 1,149,900
Income SourcesRevenues (1) $ 33,100,000 $ 31,580,000 $ 26,925,000Set-Aside Percentage 0.5% 0.5% 0.5%Total Set-Aside $ 165,500 $ 157,900 $ 134,600
Total Set-Aside Not Funded (2) $ — $ — $ (134,600)Set-Aside True-Up (3) (4,281) — —
Total Income $ 161,219 $ 157,900 $ —
ExpendituresProject Costs (4) $ — $ 890,000 $ 865,000
Total Expenditures $ — $ 890,000 $ 865,000
Ending Balance $ 1,882,122 $ 1,149,900 $ 284,900
Notes:
(1) According to BPC Policy No. 773 for the purpose of the MIIF Set-Aside calculation, revenues are gross revenues from TAMT, NCMT and maritime industrial tenants between the two terminals.
(2) FY 2021 Total Set-aside will not be funded due to the negative impact of the COVID-19 pandemic.(3) FY 2018 Set-aside true-up of actual revenues from TAMT, NCMT, and maritime industrial tenants were recorded in FY 2019.(4) FY 2020 project costs included Air Filters Installation at Perkins Elementary School, Sustainable Freight Demonstration, and Working Waterfront Noise Study (estimated to be completed in June 2020). Clean Air Action Plan and National City Bayshore Bikeway projects are re-budgeted in FY 2021 (see previous page).
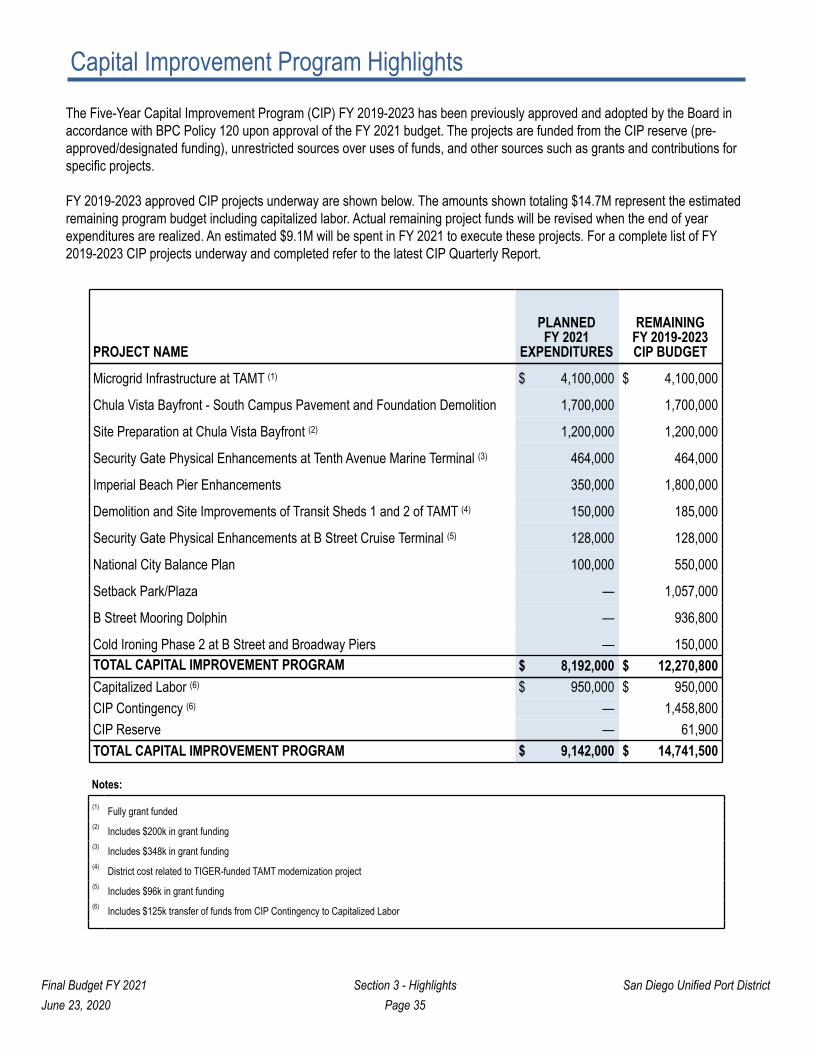
Capital Improvement Program Highlights
Final Budget FY 2021 Section 3 - Highlights San Diego Unified Port DistrictJune 23, 2020 Page 35
The Five-Year Capital Improvement Program (CIP) FY 2019-2023 has been previously approved and adopted by the Board in accordance with BPC Policy 120 upon approval of the FY 2021 budget. The projects are funded from the CIP reserve (pre-approved/designated funding), unrestricted sources over uses of funds, and other sources such as grants and contributions for specific projects.
FY 2019-2023 approved CIP projects underway are shown below. The amounts shown totaling $14.7M represent the estimated remaining program budget including capitalized labor. Actual remaining project funds will be revised when the end of year expenditures are realized. An estimated $9.1M will be spent in FY 2021 to execute these projects. For a complete list of FY 2019-2023 CIP projects underway and completed refer to the latest CIP Quarterly Report.
PROJECT NAME
PLANNEDFY 2021
EXPENDITURES
REMAININGFY 2019-2023CIP BUDGET
Microgrid Infrastructure at TAMT (1) $ 4,100,000 $ 4,100,000
Chula Vista Bayfront - South Campus Pavement and Foundation Demolition 1,700,000 1,700,000
Site Preparation at Chula Vista Bayfront (2) 1,200,000 1,200,000
Security Gate Physical Enhancements at Tenth Avenue Marine Terminal (3) 464,000 464,000
Imperial Beach Pier Enhancements 350,000 1,800,000
Demolition and Site Improvements of Transit Sheds 1 and 2 of TAMT (4) 150,000 185,000
Security Gate Physical Enhancements at B Street Cruise Terminal (5) 128,000 128,000
National City Balance Plan 100,000 550,000
Setback Park/Plaza — 1,057,000
B Street Mooring Dolphin — 936,800
Cold Ironing Phase 2 at B Street and Broadway Piers — 150,000TOTAL CAPITAL IMPROVEMENT PROGRAM $ 8,192,000 $ 12,270,800Capitalized Labor (6) $ 950,000 $ 950,000CIP Contingency (6) — 1,458,800CIP Reserve — 61,900TOTAL CAPITAL IMPROVEMENT PROGRAM $ 9,142,000 $ 14,741,500
Notes:(1) Fully grant funded(2) Includes $200k in grant funding(3) Includes $348k in grant funding(4) District cost related to TIGER-funded TAMT modernization project(5) Includes $96k in grant funding(6) Includes $125k transfer of funds from CIP Contingency to Capitalized Labor

Final Budget FY 2021 Section 3 - Highlights San Diego Unified Port DistrictJune 23, 2020 Page 36
PAGE LEFT INTENTIONALLY BLANK

Major Maintenance Program Highlights
Final Budget FY 2021 Section 3 - Highlights San Diego Unified Port DistrictJune 23, 2020 Page 37
The following list of Major Maintenance projects for FY 2021 will be implemented in accordance with BPC Policy No. 130. This list represents a 3-year outlook of projects that were initially generated through the Asset Management Program (AMP) which uses a scientifically based methodology to determine repairs or replacements of high risk assets before they fail. The Major Maintenance Program is part of the District's strategic initiative, and many of the projects span multiple years. The next two years are forecasted values for information only and subject to change prior to the next fiscal year's budget. The amount budgeted for FY 2021 is an estimate of the anticipated work to be completed, but may continue to subsequent fiscal years.
The budget year is being impacted by the ongoing COVID-19 pandemic. This will have an impact on the program in two ways. During FY 2020, the Board supported a recommendation to reduce funding and defer a few existing projects which had a $1.2M impact on project execution (see note 2 accompanying the table below). For FY 2021, the recommended budget is reduced $4.7M below the prior FY 2020 forecast. These reductions do not eliminate the need to address maintenance and these projects will be included in a future FY budget.
PROJECT NAMETOTAL
PROJECT BUDGET FORECAST FORECASTBUDGET (1) FY 2021 FY 2022 FY 2023
Major Maintenance Capital Projects
Concrete Repairs at San Diego Hilton Bayfront Garage Deck 7 $ 875,000 $ 785,000 $ — $ —Electrical Improvements at TAMT Phase 3 2,000,000 450,000 — —Roof Replacement at Harbor Police Headquarters 300,000 300,000 — —Structural Pile Repairs to Navy Pier 7,000,000 250,000 350,000 —Curtain Wall Repairs and Backfilling at B Street Pier 7,500,000 245,000 2,500,000 4,305,000Retaining Wall at Centennial Park 275,000 210,000 — —Structural Repairs at NCMT Berth 24-3 11,300,000 200,000 350,000 2,300,000HVAC Replacement at Harbor Police Headquarters 300,000 50,000 250,000 —Roof Replacement at NCMT Warehouse 24-B 2,800,000 50,000 2,750,000 —Structural Repairs at NCMT Berth 24-11 11,000,000 — 350,000 900,000Timber Fender System Replacement at Broadway Pier 8,215,000 — — —18 & 22 Inch Pile Repairs at B Street Pier 7,425,000 — 150,000 —Structural Repairs at NCMT Berth 24-1, 24-2, and 24-4 6,400,000 — — 250,000Dock 2 Replacement & Dock 3 Repairs at Tuna Harbor (2) 1,400,000 — — —Pavement Improvements at National City 1,200,000 — — —Deferred Maintenance - Seaport Village (2) 1,125,000 — 100,000 —Pavement Improvements at Shelter Island Parking Lots (2) 1,050,000 — 950,000 —Wave Attenuation Panel Replacement at Crosby Street Pier 800,000 — 350,000 375,000Railroad Tie Repairs at TAMT 700,000 — — —Utility Piping Repairs at Imperial Beach 365,000 — 35,000 —Substation Electrical Improvements at TAMT 300,000 — 150,000 150,000Elevator Car Improvements at San Diego Hilton BayfrontParking Garage 260,000 — — —Switchboard and Transformer Replacement at National CityMarine Terminal 250,000 — — —

Major Maintenance Program Highlights
Final Budget FY 2021 Section 3 - Highlights San Diego Unified Port DistrictJune 23, 2020 Page 38
PROJECT NAMETOTAL
PROJECT BUDGET FORECAST FORECASTBUDGET (1) FY 2021 FY 2022 FY 2023
Major Maintenance Capital Projects
Pedestrian Safety Improvements at Shelter Island Drive & Anchorage way (2) 115,000 — — —Pedestrian Safety Improvements at Belt Street and SampsonStreet 115,000 — — —Major Maintenance Capital Contingency 1,000,000 250,000 500,000 500,000Capitalized Labor 3,550,000 750,000 1,200,000 1,200,000SUB-TOTAL MAJOR MAINTENANCE CAPITAL $ 77,620,000 $ 3,540,000 $ 9,985,000 $ 9,980,000
MAJOR MAINTENANCE CAPITAL CARRYOVER - FY 2020 — 430,000 — —
TOTAL MAJOR MAINTENANCE CAPITAL $ 77,620,000 $ 3,970,000 $ 9,985,000 $ 9,980,000
PROJECT NAMETOTAL
PROJECT BUDGET FORECAST FORECASTBUDGET (1) FY 2021 FY 2022 FY 2023
Major Maintenance Expense Projects
Waterline Replacement TAMT Warehouse C $ 140,000 $ 140,000 $ — $ —Sand Replenishment at Kellogg Beach (2) 950,000 — 250,000 250,000Electrical Upgrades to NCMT Berths 24-10 & 24-11 550,000 — 200,000 350,000Carpet Replacement at Port Administration Building 550,000 — — —Pavement Maintenance at Chula Vista Boat Launch 450,000 — — —Pavement Maintenance at National City 225,000 — — —SUB-TOTAL MAJOR MAINTENANCE EXPENSE $ 2,865,000 $ 140,000 $ 450,000 $ 600,000
MAJOR MAINTENANCE EXPENSE CARRYOVER - FY 2020 — 370,000 — —
TOTAL MAJOR MAINTENANCE EXPENSE $ 2,865,000 $ 510,000 $ 450,000 $ 600,000
TOTAL MAJOR MAINTENANCE PROGRAM $ 80,485,000 $ 4,480,000 $ 10,435,000 $ 10,580,000
Notes:
(1) Total Project Budget may include prior year actual expenses incurred or forecasted expenditures beyond FY 2023.
(2) FY 2020 Budget's project funding was reduced by a total of $1.2M. These funds will be included in a future budget when possible. The amount reduced by project is shown below:
(a) Dock 2 Replacement and Dock 3 Repair at Tuna Harbor $100k(b) Pavement Improvements at Shelter Island Parking Lots $900k(c) Deferred Maintenance - Seaport Village $100k(d) Doors & Windows Replacement at National City Rail Car Plaza $20k(e) Pedestrian Safety Improvements at Shelter Island Drive & Anchorage Way $30k(f) Sand Replenishment at Kellogg Beach $50k

Technology Management Program
Final Budget FY 2021 Section 3 - Highlights San Diego Unified Port DistrictJune 23, 2020 Page 39
The Technology Management Program is a strategic, operationally responsive, and fiscally responsible approach to manage District technologies. It allows the District to standardize systems and leverage cost saving opportunities through economies of scale. Additionally, it facilitates coordinated implementation schedules of planned technology refresh strategies that will keep the District up-to-date. It uses a cost-benefit analysis method and governance model to make technology investment decisions, ensuring the highest likelihood of a return on investment.
BUDGETDESCRIPTION FY 2021
Services - Professional & Other $ 1,060,800Equipment & Systems 1,694,200Telephone & Communications 855,100Equipment Maintenance - Outside Services 699,600Software Maintenance 790,800
NON-PERSONNEL EXPENSE $ 5,100,500
PSGP FY19 Thermal Find & Follow (1) $ 400,000UASI Mesh Data Communications (2) 364,000PSGP FY18 HPD Maritime Domain Awareness II, CommandBridge (1) 250,000Cisco UCS Upgrade 205,000PSGP FY17 Multi Factor Authentication (1) 192,000Document Management System Replacement 150,000GASB87 Compliance 150,000PSGP FY17 Emergency Operations Center (PUC & EOC) (1) 138,000PSGP FY17 Cyber Threat Intelligence (1) 100,000Cisco Data Center 5k Switch Upgrade 50,000HPD HQ Data Center HVAC Replacement 30,000UPS HVAC Installation Admin 4 20,000Physical Data Center Improvements 20,000Capitalized Labor 300,000
TECHNOLOGY CAPITAL PROJECTS $ 2,369,000
TOTAL TECHNOLOGY MANAGEMENT PROGRAM $ 7,469,500
Notes:(1) Partially Port Security Grant Program (PSGP) funded projects(2) Fully grant funded project

Final Budget FY 2021 Section 3 - Highlights San Diego Unified Port DistrictJune 23, 2020 Page 40
PAGE LEFT INTENTIONALLY BLANK

Sponsorships & Grants
Final Budget FY 2021 Section 3 - Highlights San Diego Unified Port DistrictJune 23, 2020 Page 41
Waterfront Arts & Activation
Waterfront Arts & Activation (WA&A) is expected to generate $984k in gross revenue from fees collected on the use of District parks and facilities for special events for which the department issues permits.
Approximately $535k of this amount is waived for sponsored events through the Tidelands Activation Program (TAP), resulting in a budgeted $449k in net direct revenue generated by WA&A. This amount does not include the indirect revenue accruing to the District as a result of special events that WA&A permits, which includes concession-rent revenue from hotels, restaurants, retail facilities, and parking in tenant- or operator-managed facilities generated by special event attendees.
In Real Estate, Park Usage Fees for special event permits are budgeted at $569k in gross revenue, of which $385k is expected to be waived through sponsorships, resulting in net revenue of $184k.
In Maritime, special event permit fees for Broadway and B Street Piers are budgeted at $336k, of which $71k is expected to be waived through TAP-sponsored events, resulting in net revenue of $265k.
In Port as a Service-Parking, Parking Fees in District-managed areas, in conjunction with special events permits, are budgeted to generate $79k in revenue, of which $79k will be waived through TAP-sponsored events.
Sponsorships from the Tidelands Activation Program
Each year, under the Tidelands Activation Program (TAP), the District sponsors Community and Signature events that support the District’s mission of providing community benefit and economic vitality through maritime, tourism, water and land recreation, environmental stewardship, and public safety. These events drive visitors to the waterfront and provide an opportunity for the District to educate the public on its purpose and mission.
The TAP is approved on an annual basis by the Board of Port Commissioners. This activation program includes direct funding and/or waiver of District service fees for park permitting, facility rentals, and parking. For FY 2021, the Waterfront Arts & Activation department plans to provide up to $535k in waived District service fees to event organizers and suspend direct sponsorship funding due to the COVID-19 pandemic.
Revenue-generating Business Negotiated Events
The Business Negotiated Event (BNE) program consists of strategic partnerships that produce high-profile national/international activations on the waterfront. They are complex in nature and involve collaborations among businesses and agencies - including regional tourism agencies - to bring large-scale, revenue-producing events to San Diego Bay.
For these partnerships, WA&A negotiates direct revenue streams from a percentage of sales from ticket sales, concessions, merchandise, and/or total net profit. Incremental revenue to the District and its tenants is also derived from additional room nights booked by event attendees, and by event-generated parking.
Previous BNEs have included events such as the Red Bull Air Races, Comic-Con, Big Bay Boom, Holiday Bowl Parade, Wonderspaces, Lululemon 10k, and Wonderfront Music & Arts Festival.

Sponsorships & Grants
Final Budget FY 2021 Section 3 - Highlights San Diego Unified Port DistrictJune 23, 2020 Page 42
Grants from Other Agencies to the District
Grant Revenue is included in the revenue budget. The District may pursue grants from other agencies where the District may be qualified and the grant would provide for a strategic service. The budget excludes grants that have not been officially awarded.
BUDGETANTICIPATED GRANTS FY 2021
Capital Grants – Maritime $ 4,594,000Capital Grants – Recreational 200,000Capital Grants – Information Technology 1,208,500Capital Grants – Harbor Police 45,000Grants Revenue - Other – Harbor Police 1,092,000Grants Revenue - Other – Maritime 10,000TOTAL $ 7,149,500
Grants that are expected to be received in FY 2021 include the following:
Grants for Maritime. The District will continue to receive grant funds from California Energy Commission for the demonstration of business case for advance microgrids in support of California's energy and greenhouse gas policies program for the TAMT Microgrid Infrastructure project, from the Department of Homeland Security for physical security enhancements, and from the Department of Fish and Game for the Harbor Safety Committee Secretariat program.
Grants for Recreational Projects. The District will continue to receive grant funds from the State of California Natural Resources Agency for the Sweetwater Bicycle Path and Promenade project in City of Chula Vista Bayfront.
Grants for Information Technology Projects. The District will continue to receive grant funds from the Department of Homeland Security for Maritime Sensor Program, Cyber Threat Intelligence, Multi Factor Authentication Program, Thermal Find and Follow Protection, and San Diego Bay Regional Fiber Optic Infrastructure project.
Grants for Harbor Police. The District will continue to receive grants from the following sources: 1) High Intensity Drug Trafficking reimbursement for overtime, 2) Transportation Safety Administration K-9 grant, 3) Marine Task Force Officer reimbursement, 4) Joint Terrorism Task Force grant, 5) Cross-Border Violence Task Force, 6) San Diego County Operation Stonegarden program, 7) Urban Area Security Initiative, and 8) Department of Homeland Security for Patrol Vessel Maintenance and Area Maritime Security Committee (AMSC) Emergency Operations Center.

Sponsorships & Grants
Final Budget FY 2021 Section 3 - Highlights San Diego Unified Port DistrictJune 23, 2020 Page 43
Partnership/Cost Sharing Reimbursement for Environmental Projects. The District will continue to receive reimbursements from SDG&E for Efficiency Partnership Program to enhance the District’s capacity to incorporate energy efficiency throughout the District and Regional Harbor Monitoring Program for a coordinated monitoring program among the San Diego region.
PARTNERSHIP/COST SHARING REIMBURSEMENTBUDGETFY 2021
SDG&E Energy Efficiency Partnership $ 435,000Regional Harbor Monitoring Program 49,000TOTAL $ 484,000

Final Budget FY 2021 Section 3 - Highlights San Diego Unified Port DistrictJune 23, 2020 Page 44
PAGE LEFT INTENTIONALLY BLANK