Embed Size (px)
Citation preview

DOE/ID-11383Revision 11
FY 2020 Idaho National LaboratorySite Sustainability Plan
December 2019

ii
INTENTIONALLY BLANK

iii
DOE/ID-11383Revision 11
FY 2020 Idaho National LaboratorySite Sustainability Plan
December 2019
Prepared for theU.S. Department of Energy
DOE Idaho Operations Office

iv
INTENTIONALLY BLANK
v
FY 2020 Idaho National Laboratory Site Sustainability Plan
DOE/ID-11383Revision 11
December 2019
Approved by:
Approved by:
Approved by:

vi
INTENTIONALLY BLANK
vii
EXECUTIVE SUMMARY
The mission of the Energy Department is to ensure America’s security and prosperity by addressing its energy, environmental, and nuclear challenges through transformative science and technology solutions. This FY 2020 Idaho National Laboratory Site Sustainability Plan (SSP) was developed to enable and sustain Idaho National Laboratory’s (INL’s) mission to discover, demonstrate, and secure innovative nuclear solutions, other clean energy options, and critical infrastructure.
On May 17, 2018, Executive Order (EO) 13834, “Efficient Federal Operations,” was issued, which directs agencies to focus priorities on statutory sustainability requirements. Further EO guidance was issued by the Council of Environmental Quality in April 2019. The evolving priorities for sustainability are being incorporated into planning for fiscal year (FY) 2020 and beyond as noted in this SSP. INL remains responsible for existing directives, instructions, and requirements. From energy reduction to ensuring a reliable power supply, all sustainable activities support energy resiliency and by default, make INL a more resilient institution.
DOE Order 436.1, “Departmental Sustainability,” provides requirements and assigns responsibilities for managing sustainability within DOE to ensure that DOE missions are carried out in a sustainable manner, to institute wholesale cultural change to factor sustainability into all DOE decisions, and to ensure DOE achieves sustainability goals. DOE Order 436.1 also requires that DOE sites commit appropriate personnel resources, establish a financing plan that prioritizes the use of life-cyclecost-effective private-sector financing, optimize the application of appropriations and budgeted funds, and establish specific performance measures and deliverables designed to achieve the listed requirements.
The SSP was developed according to the narrative requirements from the “FY 2020 DOE Site Sustainability Plan Guidance” document issued on September 17, 2019. The SSP contains strategies and activities that will lead to continual energy, water, and waste reductions that move INL toward meeting DOE sustainability goals and requirements. The SSP summarizes energy and available fuel use reporting requirements and references criteria for instituting sustainable design. SSP requirements are integrated into each INL contractor’s Integrated Safety Management System and Environmental Management System (EMS). Finally, the Sustainability Program directives, based on this SSP, are integrated into theINL Annual Laboratory Plan Fiscal Year 2019 (INL/EXT-19-53533), and operations and acquisition systems.
For the purposes of this document, INL includes the Research and Education Campus located in Idaho Falls, and the research and industrial complexes (INL Site) located 50 miles west of Idaho Falls.INL consists of those facilities operated by Battelle Energy Alliance, LLC (BEA), Fluor Idaho, LLC, and the DOE Idaho Operations Office (DOE-ID).
This document serves as the overall SSP for INL. It is supplemented by individual contractor plans and strategies as needed. Updates to the SSP are anticipated annually with added specificity as projects are developed and requirements change. This SSP encompasses all contractors and activities at INL under the control of DOE-ID. The operations and activities of the Naval Reactors Facility, also located on the INL Site, are specifically excluded from this SSP.
The DOE Office of Environmental Management (EM) assumptions for this SSP include the successful completion of the Idaho Cleanup Project (ICP) Core mission and that Advanced Mixed Waste Treatment Project (AMWTP) capabilities continue to be maintained and operated until designatedtransuranic waste at the INL Site is treated and shipped for disposal.
The intent of this SSP is to provide the overall sustainability strategy for INL during FY 2020 and provide a status of FY 2019 performance to the DOE goals. The FY 2019 performance status is derived from data input to the DOE Sustainability Dashboard (Dashboard). Due to ongoing Dashboard data entry issues and a change in the completion date for fleet fuel data, Sitewide emissions data, and fleet fuel usage data were not finalized by the SSP and Dashboard submission deadlines.

viii
The INL contractors’ EMS provides the framework and process for evaluating and monitoring emissions and related reduction activities. On an annual basis, appropriate sustainability targets are developed and monitored through the EMS to support the overall reduction in emissions. As DOE Office of Environmental Management (EM) programs complete projects, resource and space management optimization results in reductions in energy and water consumption. Fugitive emission reduction is managed through ongoing waste and resource reductions.
INL spent over $15.2M in FY 2019 for facility, process, and equipment energy. Of this total, $12.8Mwas spent for building energy, $2.1M was spent for process energy, and $366k was spent on equipment fuel. Total utility and fuel costs in FY 2019 were $200k lower than in FY 2018. INL used 869 billion Btu for building energy, 134 billion Btu for process energy, 834 kgal of vehicle fuel, 120 kgal of equipment fuel, and 799 million gal of water.
Total energy intensity through FY 2019 decreased 0.2% as compared to FY 2015, but it is shown to have been reduced by 15.6% when compared to the FY 2003 statute goal, primarily due to new energy efficient buildings and construction of numerous efficiency upgrade projects. Water consumption was 22.7% lower in FY 2019 as compared to the FY 2007 baseline.
Transportation fuel sustainability continued to exceed the goals with a 38% decrease in petroleum-based fuels along with a 232% increase in the overall use of alternative fuel, both compared to FY 2005.
Table ES-1 summarizes the FY 2019 performance status. A complete discussion of the FY 2019status and planned FY 2020 actions toward meeting the goals and requirements are found in the body of this SSP.
Note that Executive Order 13834 and Office of Management and Budget guidance may significantly change the sustainability goals. Therefore, any 2-, 5-, and 10-year projections will be modified accordingly as guidance is promulgated.

ix
Table ES-1. Executive Summary table of DOE sustainability goals.
DOE GoalCurrent
Performance Status
2 YearPerformance and
Plans
5 YearPerformance and
Plans
10 Year Performance and
Plans
Energy Management
30% energy intensity (Btu per gross square foot) reduction in goal-subject buildings by FY 2015 from a FY 2003 baseline and 1.0% Year over Year (YOY)thereafter.
INL energy-use intensity (EUI) is 154,016 Btu/ft², a decrease of 0.2%from FY 2015 and 15.8% fromFY 2003.
Six light emitting diode (LED)lighting and heating, ventilating, and air conditioning(HVAC) upgradeswere completed in FY 2019,providing $33.8k(629 MWh) in energy savings at a total cost of $329.3k.
Nine additional LED lighting upgrade projects are planned for FY 2020, providing $36.2k(632 MWh) in energy savings at a total cost of $265.5k.
Collect and utilize building and facility energy-use data to identify buildings with the highest EUIfor a focus onbuilding energy-use improvements and performance.
Ensure that monthly performance data is entered into the Environmental Protection Agency (EPA) ENERGY STAR Portfolio Manager database.
Redesign interior space to reduce energy use through daylighting andspace optimization, along with sensors and control systems.
Identify opportunities to transition testbed technologies to achieve energy-reduction goals.
Implement 100% of energy conservation measures (ECMs)as documented in the Dashboardprojects pipeline.
Energy Independence and Security Act(EISA) Section 432 continuous (4-year cycle) energy and water evaluations.
INL completed energy and water evaluations in 59 buildings in FY 2019.
For the second 4-year audit cycle (June 1, 2016,through May 31, 2020), 129 audits have been completed.
Complete energy audits in 100%+ of INL covered buildings (those that constitute 75% energy use) for the second 4-year audit cycle.
BEA plans to audit 30 buildings in FY 2020 and Fluor Idaho will audit anadditional eightbuildings inFY 2020.
Complete energy and water evaluations on at least 25% of the covered facilitiesannually to ensure 100% compliance by the end of the third 4-year reporting cycle (third cycle ends May 31, 2024).
Complete energy and water evaluations on at least 25% of the covered facilities annually to ensure 100% compliance by the end of the fourth 4-year reporting cycle (fourth cycle ends May 31, 2028).
Table ES-1. (continued).
x
DOE GoalCurrent
Performance Status
2 YearPerformance and
Plans
5 YearPerformance and
Plans
10 Year Performance and
Plans
Energy Management cont.
Meter all individual buildings for electricity, natural gas, steam, and water where costeffective and appropriate.
INL meters 100% of its natural gas and 62.2% of its electric usage at the building level.
Two additional buildings were constructed in Idaho Falls during FY 2019. Both have advanced metering. One of the buildings (new data center) has submetering.
Two additional new BEA buildings will be complete in FY 2020 and will have advanced metering.
Fluor Idaho is planning on completing the Idaho Nuclear Technology and Engineering Center(INTEC) campus breaker systemsmodification to allow metering of INTEC buildings powered through substations and load centers by the end of January 2021.
Install additionalelectric and water meters on facilities targeted for Guiding Principle compliance through FY 2025 and beyond.
Benchmark 100% of appropriate coveredbuildings where advanced meters may be installed.
Installation cost for each meter is estimated at $23k.
Install additionalelectric and water meters annually as cost effective and appropriate toward a goal of 100% of covered buildings metered.
Water Management
20% potable water intensity (Gal per gross square foot) reduction by FY 2015 from a FY 2007 baseline and 0.5% YOY thereafter.
INL water intensity is 134.5 gal/ft², adecrease of 22.7%from FY 2007.
Both new buildings constructed in Idaho Falls have water metering.
Prepare and implement a water balance evaluation to identify high water use intensity processes and buildings.
Develop and implement programs to educate employees and visitors about methods to minimize water use.
Implement audit-identified, low and moderate cost water conservation measures at covered facilities, including high-efficiency water technologies.
Assess the interconnections and dependencies of energy and water on INL operations, particularly resiliency’s effects on water, which may impact energy use.
Non-potable freshwater consumption (gal) reduction of industrial, landscaping, and agricultural (ILA). YOY reduction; no set target.
Current Performance:N/A All water obtained by INL is obtained from the Snake River Plain Aquifer and is considered potable.
ILA water is not applicable to INL.
ILA water is not applicable to INL.
ILA water is not applicable to INL.

Table ES-1. (continued).
xi
Waste Management
Reduce at least 50% of non-hazardous solid waste, excluding construction and demolition debris, sent to treatment and disposal facilities.
INL generated 3,037,088.6 lb(1,377.6 MT) of non-hazardous municipal solid waste in FY 2019. In FY 2018, INL generated 2,793,918.9 lb(1,267.3 MT), resulting in an increase of Municipal Solid Waste (MSW)generated of 8.7% YOY. INL diverted 58.2% of its non-hazardous solid waste in FY 2019 by recycling 1,766,344 lb(801.2 MT) of materials.
Continue to educate personnel emphasizing the priority of waste reduction to reduce total waste generated from the previous year. Continue to evaluate potential outlets and expansion of recyclable waste streams. Explore glass recycle partnership with the City of Idaho Falls.
Investigate and develop regional composting facility based on West Yellowstone pilot project. Establish memorandum of agreement with regional entities.
Secure $2.0Mfunding for a regional composting center.
Reduce construction and demolition materials and debris sent to treatment and disposal facilities. YOY reduction; no set target.
INL generated 18,192.4 MT of construction and demolition (C&D)waste in FY 2019, compared to 30,104.7 MT in FY 2018, resulting in a reduction of 39.6% of C&D waste generated YOY. INLdiverted 69.6% (27,915,818 lb or 12,662.4 MT) of its construction and demolition (C&D) waste in FY 2019.
Continue employee education, contract language inclusionand incorporate additional materials into current C&Dwaste diversion processes.
Work with regional industrial recycleentities and develop strategy to recycle two construction wastes streams (e.g., concrete and gypsum).
Establish regional recycle agreements with private material contributors and vendors who will accept construction debris for recycle.
Fleet Management

Table ES-1. (continued).
xii
20% reduction in annual petroleum consumption by FY 2015 relative to a FY 2005 baseline and 2% YOY thereafter.
INL used 581,331 GGE of petroleum-based fuels in FY 2019, a 38% reduction from FY 2005.
Significant progress was made through the use of renewable diesel rather than petroleum diesel in the INL bus fleet.
Efforts will continue to build and install no-idle HVAC systems on additional buses.
Continue the installation of no-idle HVAC systems on additional light-duty vehicles as funding allows.
Expand the rollout of renewable diesel (R99) by working to implement usage in other vehicles and equipment that run on diesel.
Continue to pilot the use of electric vehicles in the fleet and the installation of supporting charging stations.
Optimize and right-size fleetcomposition, by reducing vehiclesize, eliminating underutilizedvehicles, and acquiring andlocating vehicles to match local fuel infrastructure.
Issue INL policy and a plan to install appropriate charging or refueling infrastructure for zero emission or plug-in hybrid vehicles.
Increase acquisitions of zero emission and plug-in hybrid vehicles.
Achieve 50% petroleum consumption reduction relative to the FY 2005 baseline.
10% increase in annual alternative fuel consumption by FY 2015 relative to a FY 2005 baseline; maintain 10% increase thereafter.
INL used 253,848 GGE of alternative fuels in FY 2019, a 232% increase from FY 2005.
This progress was maintained through an increase of 666% in the use of E85 in light-duty vehicles and the use of renewable diesel in the INL bus fleet.
Expanded the use of renewable diesel (R99) in other BEA vehicles and equipment that currently run on regular diesel.
Determine less costly sources of R99.
Achieve 25% alternative fuel consumption increase relative to the FY 2005 baseline.
Achieve 50% alternative fuel consumption increase relative to the FY 2005 baseline.
75% of light-duty vehicle acquisitions must consist of alternative fuel vehicles (AFV).
INL acquired 57 new light-duty vehicles in FY 2019, 44 of which were AFV or LGHGs, resulting in 77% of the vehicle acquisitions as AFVsor LGHGs.
Identify the next gasoline vehicles for replacement with AFVs, which will increase the total AFV percentage in the light-duty fleet.
Achieve 80% or greater AFV light-duty acquisitions.
Achieve 100% AFV light-duty vehicle acquisitions.Maintain 95% or greater AFV light-duty composition in the fleet.
Clean and Renewable Energy

Table ES-1. (continued).
xiii
“Renewable Electric Energy” requires that renewable electric energy account for not less than 30.5% of a total agency electric consumption by FY 2025 and each year thereafter.
INL procured 18,685 MWh of RECs from Idaho Falls Power at a total cost of $31,764.
This purchase of new renewable energy RECs, in addition to the 35.5 MWh of onsite generation (solar walls, micro-grid, and small photovoltaic systems) totals 18,721 MWh (8.4%) of renewable energy for FY 2019.
Incremental increases of purchased RECsalong with onsite generation to meet a 10% goal in FY 2020 and 15% in FY 2021.
Evaluate potential projects to cost effectively contribute to the annual renewable energy goal through onsite generation of at least 7.5% of the total INL electricity consumption.
Incremental increases of purchased RECsalong with onsite generation to meet a goal of:
20% in FY 2022
25% in FY 2023
30% in FY 2024
30.5 in FY 2025.
Implement a project that will contribute up to 7.5% of the renewable energy goal through onsite generation.
Continue to meet or exceed this goal through purchasing RECs and generation of renewable energy from research projects onsite.
Continue to increase non-electric thermal usage. YOY increase; no set target but an indicator in the Office of Management and Budget scorecard.
INL has three buildings with solar transpired walls to provide make-up air preheating.
Investigate theadditional use ofsolar water heating, make-up air preheating, or ground source heat pumps inselect locations.
Evaluate or commission the underground heat exchanger for the WCB HVAC system and optimize the efficiency and controls.
Work with INL’sEnergy EfficiencyScience and Technology organization todevelop and implement one thermal storage project.
Green Buildings
At least 15% (by count) of owned existing buildings to be compliant with the revised Guiding Principles for High Performance Sustainable Buildings by FY 2020, with annual progress thereafter.
At the end of FY 2019, 20 DOE-owned buildings were compliant with the Guiding Principles, which represents 20.4% of INL buildings greater than 10,000 GSF meeting the Guiding Principles.
Document Guiding Principle compliance on three additional new construction buildings in FY 2020and two additional new construction buildings along with one existing building in FY 2021.
Document Guiding Principle compliance on one additional new constructionbuilding in FY 2024.
Implement additional audit-identified, lowand moderate cost ECMs at INL covered facilities that are targeted to document the Guiding Principles.
Incorporate 100%of relevant Green Building specifications into all new construction, modernization, and major renovation projects to meet the requirementsSignificant funding may be needed to implement the efficiency upgrades needed.
Green Buildings cont.

Table ES-1. (continued).
xiv
Increase regional and local planning coordination and involvement.
INL maintains excellent relationships with local community planning groups and government entities.Interactions include transportation infrastructure and maintenance, facility planning locations, traffic patterns, and future infrastructure needs.
Maintain relationships with local community planning groups and government entities. Participate in regional events promoting
alternative transportation.
Advocate for and improve access
to alternative commuting options (public transportation, bike paths, improved commuter access) through regional
and local organizations.
Use an integrated community approach during the refurbishment and planning of future facilities and infrastructure, which is consistent with the INL Annual Laboratory Plan Fiscal Year 2019.
Acquisition and Procurement
Promote sustainable acquisition and procurement to the maximum extent practicable, ensuring BioPreferred®and biobased provisions and clauses are included in all applicable contracts.
INL reports indicate 94.3% of the contracts in FY 2019contained applicable clauses.
Achieve 100% compliance. Continue to incorporate improvements to the Sustainable Acquisition Program, including procedures, policies, and enhanced work processes that increase visibility, availability, and use of sustainable products.
Maintain 100% compliance.Continue to incorporate improvements to the Sustainable Acquisition Program, including procedures, policies, and enhanced work processes that increase visibility, availability, and use of sustainable products.
Maintain 100% compliance.Continue to incorporate improvements to the Sustainable Acquisition Program, including procedures, policies, and enhanced work processes that increase visibility, availability, and use of sustainable products.
Measures, Funding, and Training
Table ES-1. (continued).
xv
Annual targets for sustainability investment with appropriated funds and/or financed contracts to be implemented in FY 2019 and annually thereafter.
No additional ESPCprojects were developed in FY 2019.
Develop a comprehensive project for cost effective ECMsidentified by the completed energy and water audits and determine appropriate funding sources.
Continue to evaluate cost effectiveness of the ENABLE ESPCprogram or the utility-based Utility Energy Services Contract (UESC) program.
Continue to evaluate cost effectiveness of the ENABLE ESPCprogram or the utility based UESCprogram.
Implement oneESPC ENABLE or UESC project.
Electronic Stewardship
Purchases – 95% of eligible acquisitions each year are Electronic Product Environmental Assessment Tool (EPEAT)-registered products.
INL achieved 96.6% of eligible electronics acquisitions meeting EPEAT standards in FY 2019.
Maintain 95% compliance or better through education, primarily of the procurement staff and employee purchasers. Establish process to evaluate electronics acquisition requests to ensure that non-standard electronics are EPEAT-registered whenever possible.
Improve tracking and reporting systems for electronics stewardship requirements through life-cycle acquisition and procurement, operations and maintenance, and end-of-life management.
Maintain 95% of eligible acquisitions each year are EPEAT-registered products
Electronic Stewardship cont.

Table ES-1. (continued).
xvi
Power Management – 100% of eligible PCs, laptops, and monitors arepower-management-enabled.
Power management controls are in place on all eligible computer systems. At INL, 100% of eligible PCs, laptops, and monitors arepower management controls.
Maintain 100% compliance. Continue to focus efforts that are cost effective and the least disruptive to performers and will continue work with Information Management (IM) to improve power management.
100% of eligible electronics, will have power management features enabled and will be continuously measured.
100% of eligible electronics, will have power management features enabled and will be continuously measured.
Automatic Duplexing – 100% of eligible computers and imaging equipment have automatic duplexing enabled.
At the end of FY 2019, 100% of managed INLequipment hadduplex printing enabled, where possible.
100% of eligible printers are compliant. Continue to encourage and enable duplex printing on all printers, copiers, and multifunction devices.
100% of eligible printers are compliant. Continue to encourage and enable duplex printing on all eligible printers, copiers, and multifunction devices.
100% of eligible printers are compliant. Continue to encourage and enable duplex printing on all eligible printers, copiers, and multifunction devices.
End of Life – 100% of used electronics are reused or recycled using environmentally sound disposition options each year.
In FY 2019, INLrecorded that 100% of electronic devices were reused or recycled.
100% of electronics are reused or recycled, unlessfederal requirements dictate otherwise. Continue to partner with IM and Property Disposal Services to improve electronic end-of-lifedisposition.
100% of electronics are reused or recycled, unlessfederal requirements dictate otherwise. Continue to partner with IM and Property Disposal Services to improve electronic end-of-life disposition.
100% of electronics are reused or recycled, unless federal requirements dictate otherwise. Continue to partner with IM and Property Disposal Services to improve electronic end-of-life disposition.
Electronic Stewardship cont.

Table ES-1. (continued).
xvii
Data Center Efficiency: Establish a power usage effectiveness target for new and existing data centers; discuss efforts to meet targets.
The Engineering Research Office Building (EROB) High-PerformanceComputing (HPC) Data Centerincorporated six emergingtechnologies that improved efficiency in FY 2019.
Finish consolidatingthree existing data centers into the HPC.
Build out of the new Consolidated Computing Center (C3) with a power utilization effectiveness (PUE)goal of 1.4 or lower.
Install and monitor advanced energy meters in all data centers and accurately quantify PUE.
Consolidate twodata centers.
Resilience
Discuss overall integration of resilience in emergency response, workforce, and operations procedures and protocols.
INL emergency plans and emergency plan implementing procedures (EPIs) were reviewed and revised, as necessary. Operating policies and procedures were evaluated to determine whether they should be modified to consider organizational risks.
Continue to consider the impacts of emerging science to build resilience into DOE-ID-managed facilities, programs, and procedures. Emergency response, workplace safety and health, and the most updated scientific knowledge will beincorporated into all facets of organizational resilience, including procedures and protocols.
Prioritize energy requirements to critical mission operations (in partnership with NE mission priorities). Pursue life-cycle cost-effective energy resilience solutions that provide the most reliable energy to critical mission operations. Review energy solutions beyond typical backup or standby generators.
Continue to conduct progressively more detailed vulnerability assessments to identify projects that increase resilience.
Greenhouse Gases in Multiple Categories

Table ES-1. (continued).
xviii
YOY Scope 1 and2 greenhouse gas (GHG) emissions reduction from a FY 2008 baseline.
Refine targeted list of high value, low-costECMs with a focus on biggest GHGemission reduction. Pursue funding options for implementation.
Implement projects that reduce total emissions by 5% by the end of FY 2024.
Reduce or minimize the quantity of toxic and hazardous chemicals acquired, used, or disposed of, particularly where such reduction will assist INL in pursuing agency greenhouse gas reduction targets.
Implement 75% of ECMs as documented in the Dashboard.
YOY Scope 3 GHG emissions reduction from a FY 2008 baseline.
Continue to encourage teleworking, video conferencing, and carpooling as effective ways to reduce the amount of air and ground travel, including employee commuting.
Achieve a YOY 2% annual reduction for 5 years for a total 10% reduction.
Achieve a total 50% reduction from baseline.

CONTENTS
EXECUTIVE SUMMARY.............................................................................................................................. vii
ACRONYMS...................................................................................................................................................xxii
MISSION CHANGE........................................................................................................................................... 1
1. ENERGY MANAGEMENT....................................................................................................................3
1.1 Energy Usage and Intensity...........................................................................................................3
1.1.1 Performance Status...........................................................................................................3
1.1.2 Plans and Projected Performance.................................................................................... 6
1.2 EISA Section 432 Benchmarking and Evaluations..................................................................... 7
1.2.1 Performance Status...........................................................................................................8
1.2.2 Plans and Projected Performance.................................................................................... 8
1.3 Facility Metering............................................................................................................................9
1.3.1 Performance Status...........................................................................................................9
1.3.2 Plans and Projected Performance..................................................................................10
1.4 Non-Fleet Vehicle and Equipment Energy Use.........................................................................11
1.4.1 Performance Status.........................................................................................................11
1.4.2 Plans and Projected Performance..................................................................................11
2. WATER MANAGEMENT....................................................................................................................13
2.1 Performance Status...................................................................................................................... 13
2.2 Plans and Projected Performance................................................................................................15
3. WASTE MANAGEMENT.................................................................................................................... 17
3.1 Municipal Solid Waste Recycling and Waste Diversion.......................................................... 17
3.1.1 Performance Status.........................................................................................................17
3.1.2 Plans and Projected Performance..................................................................................19
3.2 Construction and Demolition Recycling and Waste Diversion................................................ 19
3.2.1 Performance Status.........................................................................................................19
3.2.2 Plans and Projected Performance..................................................................................20
4. FLEET MANAGEMENT...................................................................................................................... 21
4.1 Fleet Petroleum Consumption.....................................................................................................21
4.1.1 Performance Status.........................................................................................................21
4.1.2 Plans and Projected Performance..................................................................................22
4.2 Fleet Alternative Fuels Consumption......................................................................................... 22
4.2.1 Performance Status.........................................................................................................22
4.2.2 Plans and Projected Performance..................................................................................23
4.3 Light-Duty Vehicle Acquisition................................................................................................. 23
4.3.1 Performance Status.........................................................................................................23
4.3.1 Plans and Projected Performance..................................................................................24

xx
5. RENEWABLE ENERGY...................................................................................................................... 25
5.1 Performance Status...................................................................................................................... 25
5.2 Plans and Projected Performance................................................................................................26
6. SUSTAINABLE BUILDINGS..............................................................................................................27
6.1 Guiding Principles....................................................................................................................... 27
6.1.1 Performance Status.........................................................................................................27
6.1.2 Plans and Projected Performance..................................................................................28
6.2 New Building Design.................................................................................................................. 28
6.2.1 Performance Status.........................................................................................................29
6.2.2 Plans and Projected Performance..................................................................................29
7. ACQUISITION AND PROCUREMENT.............................................................................................31
7.1 Performance Status...................................................................................................................... 31
7.2 Plans and Projected Performance................................................................................................32
8. MEASURES, FUNDING, AND TRAINING...................................................................................... 33
8.1 Performance Status...................................................................................................................... 33
8.1.1 Efficiency and Conservation Measures........................................................................ 33
8.1.2 Performance Contracts...................................................................................................33
8.1.3 Appropriations/Direct Obligations................................................................................34
8.1.4 Training and Education..................................................................................................34
8.2 Plans and Projected Performance................................................................................................35
9. TRAVEL AND COMMUTE.................................................................................................................37
9.1 Air Travel, Ground Travel, and Commute Data........................................................................ 37
9.1.1 Performance Status.........................................................................................................37
9.1.2 Plans and Projected Performance..................................................................................37
9.2 Regional and Local Planning...................................................................................................... 38
9.2.1 Performance Status.........................................................................................................38
9.2.2 Plans and Projected Performance..................................................................................38
10. FUGITIVES AND REFRIGERANTS.................................................................................................. 39
10.1 Performance Status...................................................................................................................... 39
10.2 Plans and Projected Performance................................................................................................39
11. ELECTRONIC STEWARDSHIP..........................................................................................................41
11.1 Purchase of EPEAT-Registered Products.................................................................................. 41
11.1.1 Performance Status.........................................................................................................41
11.1.2 Plans and Projected Performance..................................................................................41
11.2 Power Management..................................................................................................................... 41
11.2.1 Performance Status.........................................................................................................41
11.2.2 Plans and Projected Performance..................................................................................42
11.3 Automatic Duplexing.................................................................................................................. 42

xxi
11.3.1 Performance Status.........................................................................................................42
11.3.2 Plans and Projected Performance..................................................................................42
11.4 Electronics End of Life................................................................................................................42
11.4.1 Performance Status.........................................................................................................42
11.4.2 Plans and Projected Performance..................................................................................43
11.5 Data Center Efficiency................................................................................................................ 43
11.5.1 Performance Status.........................................................................................................43
11.5.2 Plans and Projected Performance..................................................................................43
12. RESILIENCE..........................................................................................................................................45
12.1 Performance Status...................................................................................................................... 45
12.2 Plans and Projected Performance................................................................................................46
Appendix A Excluded Buildings Self-Certification.......................................................................................47
Appendix B Idaho National Laboratory Metering Plan................................................................................. 53
Appendix C DOE Sustainability Dashboard Summary Report.....................................................................61
FIGURESFigure 1. INL map............................................................................................................................................... 1
Figure 2. INL electricity usage history and forecast......................................................................................... 4
Figure 3. Goal-subject energy use and EUI history and forecast..................................................................... 5
Figure 4. Building EUI relative to goal..............................................................................................................6
Figure 5. INL water usage history and forecast...............................................................................................14
Figure 6. INL renewable energy credit purchase history and forecast.......................................................... 26
Figure B-1. INTEC Utility Control System project upgrade summary......................................................... 59
TABLES
Table ES-1. Executive Summary table of DOE sustainability goals.............................................................. ix
Table 1. BEA energy audit results evaluation summary...................................................................................8
Table 2. INL electrical metering summary...................................................................................................... 10
Table 3. Renewable energy consumption for FY 2019.................................................................................. 26
Table 4. Buildings meeting the Guiding Principles (DOE-owned)................................................................27
Table 5. Guiding Principles achievement........................................................................................................ 28
Table 6. Existing buildings targeted to meet the Guiding Principles (FY 2020–FY 2024)......................... 28
Table 7. New buildings - construction completed in FY 2019.......................................................................29
Table 8. FY 2019 sustainable acquisition progress.........................................................................................31
Table 9. FY 2019 and FY 2020 sustainability projects summary.................................................................. 33
Table B-1. INL electric metering summary.....................................................................................................56
Table B-2. Minimum ft² thresholds for metering............................................................................................ 57

xxii
INTENTIONALLY BLANK

xxiii
ACRONYMS
AFV alternative fuel vehicle
AMWTP Advanced Mixed Waste Treatment Project
ASHRAE American Society of Heating, Refrigeration, and Air Conditioning Engineers
ATR Advanced Test Reactor
B20 biodiesel
BEA Battelle Energy Alliance, LLC
Btu British thermal unit
C&D construction and demolition
CAS condition assessment survey
CERCLA Comprehensive Environmental Response, Compensation, and Liability Act
CFA Central Facilities Area
CPP Chemical Processing Plant
D&D decontamination and dismantlement
DOE Department of Energy
DOE-ID Department of Energy Idaho Operations Office
E85 ethanol 85
EB existing building
EBR-I Experimental Breeder Reactor I
ECM energy conservation measure
EISA Energy Independence and Security Act
EM Office of Environmental Management
EMS Environmental Management System
EO Executive Order
EPA Environmental Protection Agency
EPEAT Electronic Product Environmental Assessment Tool
EPI emergency plan implementing procedure
EROB Engineering Research Office Building
ESL Energy Systems Laboratory
ESPC Energy Savings Performance Contract
EUI energy-use intensity
FEMP Federal Energy Management Program
FIMS Facilities Information Management System
FMCS Facilities Management Control Systems
FY fiscal year
GGE gasoline-gallon equivalent
GHG greenhouse gas
GSA General Services Administration
gsf gross square feet
HPC high-performance computing
HVAC heating, ventilating, and air conditioning
ICP Idaho Cleanup Project
ILA industrial, landscaping, and agricultural
IM Information Management
INL Idaho National Laboratory
INTEC Idaho Nuclear Technology and Engineering Center
IRC INL Research Center
IWTU Integrated Waste Treatment Unit
LED light emitting diode
LGHG low greenhouse gas
MCI Motor Coach Industries
MFC Materials and Fuels Complex
MT metric tons
NC new construction

xxiv
PC personal computer
PUE power utilization effectiveness
R&D research and development
RCRA Resource Conservation and Recovery Act
REC Renewable Energy Credit
RWMC Radioactive Waste Management Complex
SA sustainable acquisition
SMC Specific Manufacturing Capability
SRIP Sustainability Report and
Implementation Plan
SSP Site Sustainability Plan
STD standard
TAN Test Area North
UESC Utility Energy Service Contract
VDI virtual desktop infrastructure
WMF Waste Management Facility
YOY year over year

i
MISSION CHANGE
Idaho National Laboratory (INL) is considered to be all operating contractors along with the Department of Energy (DOE) Idaho Operations Office (DOE-ID), and includes the Idaho Falls campus and the research and industrial complexes (INL Site) located 50 miles west of Idaho Falls (Figure 1). INL consists of those facilities operated by Battelle Energy Alliance, LLC (BEA) or by Fluor Idaho, LLC.BEA and Fluor Idaho include all facilities under their individual responsibility.
The DOE Office of Environmental Management (DOE-EM) assumptions for this SSP include the successful completion of the Idaho Cleanup Project (ICP) Core mission. In particular, the Advanced Mixed Waste Treatment Project (AMWTP) is planned to enter closure in fiscal year (FY) 2020. Storage facilities will remain operational while existing inventory is shipped for disposal.
AMWTP, Idaho Nuclear Technology and Engineering Center (INTEC), and Radioactive Waste Management Complex (RWMC) non-enduring buildings will transition to a cold, dark, and dry status as the cleanup mission progresses over the next 5 to 10 years, reducing energy use. Decontamination and decommissioning (D&D) will follow as funding allows.
Work scope planned to be performed by Fluor Idaho in the next 5to 10 years includes treating sodium-bearing waste, closing the INTEC Tank Farm, preparing and packaging of calcined waste, closing Accelerated Retrieval Project facilities at RWMCwith placement of a final engineered barrier on the Subsurface Disposal Area, and completing treatment and shipment of mixed transuranic wastes. The trend is for reducing energy use after waste treatment, specifically sodium-bearing waste and transuranic waste treatment completion.
BEA is planning for moderate growth to further its missions with additional research laboratories and office buildings at the major INL Site locations and additional office and laboratory buildings in Idaho Falls.
Figure 1. INL map.

ii
Idaho National Laboratory (INL) is considered to be all operating contractors along with the Department of Energy (DOE) Idaho Operations Office (DOE-ID), and includes the Idaho Falls campus and the research and industrial complexes (INL Site) located 50 miles west of Idaho Falls (Figure 1). INL consists of those facilities operated by Battelle Energy Alliance, LLC (BEA) or by Fluor Idaho, LLC. BEA and Fluor Idaho include all facilities under their individual responsibility.
The DOE Office of Environmental Management (DOE-EM) assumptions for this SSP include the successful completion of the Idaho Cleanup Project (ICP) Core mission. In particular, the Advanced Mixed Waste Treatment Project (AMWTP) is planned to enter closure in fiscal year (FY) 2020. Storage facilities will remain operational while existing inventory is shipped for disposal.
AMWTP, Idaho Nuclear Technology and Engineering Center (INTEC), and Radioactive Waste Management Complex (RWMC) non-enduring buildings will transition to a cold, dark, and dry status as the cleanup mission progresses over the next 5 to 10 years, reducing energy use. Decontamination and decommissioning (D&D) will follow as funding allows.
Work scope planned to be performed by Fluor Idaho in the next 5 to 10 years includes treatingsodium-bearing waste, closing the INTEC Tank Farm, preparing and packaging of calcined waste, closingAccelerated Retrieval Project facilities at RWMC with placement of a final engineered barrier on the Subsurface Disposal Area, and completing treatment and shipment of mixed transuranic wastes. The trend is for reducing energy use after waste treatment, specifically sodium-bearing waste and transuranic waste treatment completion.
BEA is planning for moderate growth to further its missions with additional research laboratories and office buildings at the major INL Site locations and additional office and laboratory buildings in Idaho Falls. The INL Annual Laboratory Plan Fiscal Year 2019 provides an overview and details of conceptual laboratory growth. These growth areas include research programs related to nuclear reactor sustainment and expanded deployment, integrated fuel cycle solutions, advanced materials and manufacturing for extreme environments, integrated energy systems, and secure and resilient cyber-physical systems. Accordingly, INL facilities are expected to increase electric energy demand based on numerous new buildings being designed and constructed for both Idaho Falls and INL Site locations.
The Naval Reactors Facility commenced operation of the Spent Fuel Handling RecapitalizationProject in FY 2015, with significant construction between 2019 and 2025. This large project will not impact INL directly but will impact the electric distribution system that BEA manages.
Laboratory growth is likely to increase INL energy use but will be balanced to some extent with decommissioning and renovation of older buildings and processes.
Figure 1. INL map.

iii
INTENTIONALLY BLANK

iv
ENERGY MANAGEMENT1.
Energy Usage and Intensity1.1
Energy sources at Idaho National Laboratory (INL) affected by this goal include electricity, natural gas, fuel oil, liquefied natural gas, and propane. Methods to reduce energy usage include capital project upgrades, alternative financing projects, operational modifications, and workforce behavior changes.
Many factors influence INL’s energy use, including numerous energy-intensive processes and inefficient buildings built before the current standards for energy efficiency and high-performance design. Due to the nature of the various INL missions, many operations can be cyclical and result in a year over year (YOY) variance in energy consumption. As buildings are removed or processes are modified, INL energy usage intensity can vary seemingly unrelated to actual overall reduction efforts.
INL typically uses energy audits and retro-commissioning to evaluate existing buildings for energy-reduction opportunities. These opportunities are developed into projects with the most cost-effective projects or projects that improve operating conditions being pursued for funding and implementation.
Energy data are routinely input into the EPA Portfolio Manager for 88 metered buildings to analyze and identify energy-use trends and anomalies. These trends and anomalies are discussed with facility managers and often result in the identification of low or no-cost modifications that reduce energy usage.
Since energy-intensive loads that are mission specific are excluded from the goal according to the Guidelines Establishing Criteria for Excluded Buildings published by Federal Energy Management Program (FEMP) on January 27, 2006, the Advanced Test Reactor (ATR) and its support buildings, the Engineering Research Office Building (EROB) High-Performance Computing (HPC) Data Center, and two processes at the Energy Systems Laboratory (ESL) are currently excluded from the reporting goal but are not excluded from the responsibility to reduce energy use and greenhouse gases (GHGs) where practicable. These buildings are shown in Facilities Information Management System (FIMS) as excluded facilities and/or processes. The square footage of these buildings appears on the excluded facilities list in Appendix A.
Inexpensive electric rates impact the cost effectiveness of energy-saving projects. While INL strives to implement energy-reduction projects, especially to meet Guiding Principles requirements, this goal continues to be a significant challenge.
Performance Status1.1.1
As demonstrated through data calculated by the Dashboard, INL’s energy-use intensity (EUI) for FY 2019 was 154,016 Btu/ft². When compared to the FY 2015 baseline of 154,358 Btu/ft², a small decrease of 0.2% was observed. However, using the current statute baseline for FY 2003 of 182,979 Btu/ft², a reduction of 15.8% has been achieved.
During FY 2019, BEA worked with the DOE Sustainability Performance Office (SPO) to correct historical energy-use data in the Dashboard due to Dashboard calculation modifications. This effort resulted in the FY 2015 baseline changing from 152,096 Btu/ft² to 154,358 Btu/ft². Similarly, the FY 2003 baseline changed from 182,492 Btu/ft² to 182,979 Btu/ft².
In FY 2019, BEA completed energy efficient light emitting diode (LED) lighting upgrades in five buildings at a cost of $90k. Energy savings of over 117.3 MWh was achieved with annual cost savings totaling $6.3k.
Replacing aging roofs with new cool roofs reduces repair needs and deferred maintenance and assists with reducing both heat loss in winter months and heat gain in summer months. Cool roofs were installed during FY 2019 for 23,319 ft² of roof replacements on:
MFC-768, five sections totaling 9,279 ft2
TAN-677, one section totaling 14,040 ft2

v
One of the four original chillers in Waste Management Facility (WMF)-676 was replaced with a newer, more efficient unit. The old York unit contained R-22—an ozone-depleting refrigerant. The new Carrier unit uses R-410a, which is not ozone-depleting. The new chiller uses less energy to operate under both partial and fully loaded conditions, is 17% more energy efficient and has a simple payback of 11.6 years. This chiller replacement received an Idaho Power incentive of $13.6k. This project provided significant deferred maintenance reductions while providing associated energy and energy cost savings.
Three inefficient and failing electric resistance heating, ventilation, and air conditioning (HVAC)units were replaced with new low-ambient temperature air-source heat pumps in the Sawtelle Street Facility in FY 2019. This project resulted in annual cost savings of $21k.
Figure 2 illustrates historic and projected electric consumption for INL’s major Site areas. Electricity is expected to increase over the next 2 years as new building construction projects are completed. However, total energy consumption should have a decreasing trend after FY 2021 as AMWTP processes shut down and buildings begin D&D.
FY 03 FY 15 FY 16 FY 17 FY 18 FY 19 FY 20 FY 21 FY 22 FY 23 FY 24 FY 250
50,000
100,000
150,000
200,000
250,000
Elec
tric
Co
nsu
mp
tio
n in
MW
h)
INL Electricity Usage History and Forecast
Figure 2. INL electricity usage history and forecast.
As illustrated on the graph, INL’s total electricity usage is projected to decrease in FY 2021, FY 2022, and FY 2023 due to the shutdown and D&D of AMWTP/RWMC. There is a projected increase use of electricity in FY 2024 and FY 2025 due to continued expansion of the new data center in Idaho Falls, which, along with the ATR, is a high-energy mission specific facility (HEMSF) excluded from the goal-subject energy-use reporting requirements.
vi
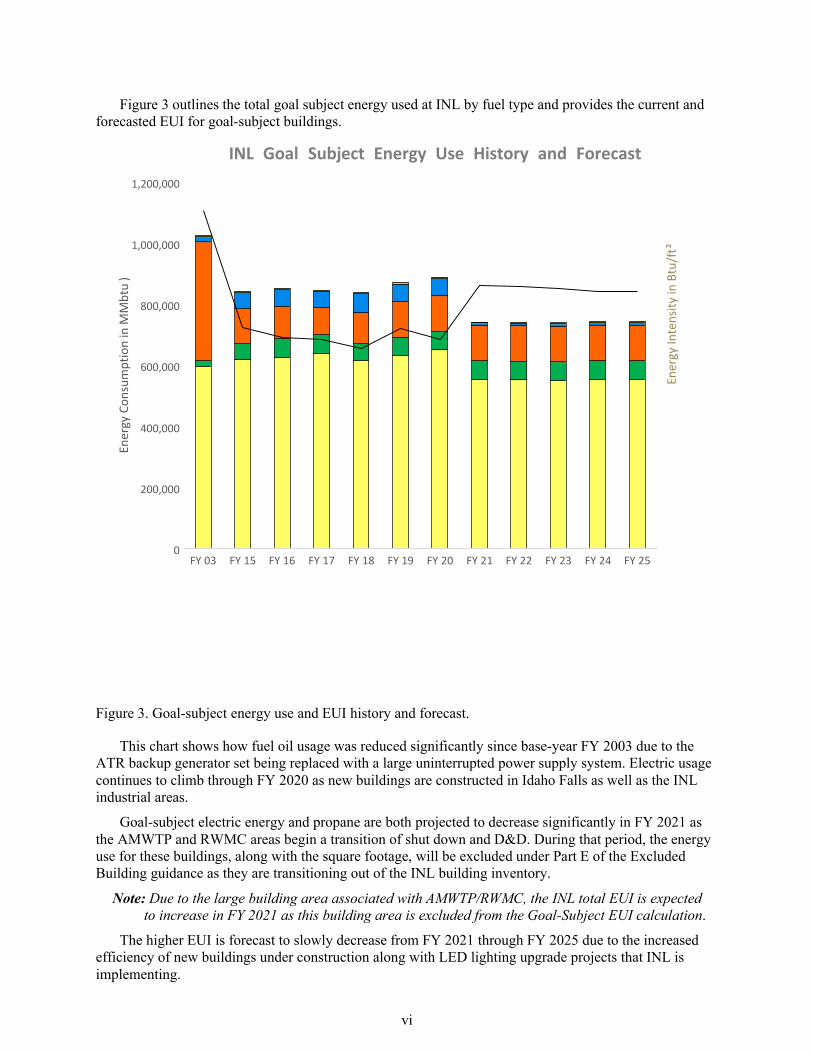
Figure 3 outlines the total goal subject energy used at INL by fuel type and provides the current and forecasted EUI for goal-subject buildings.
FY 03 FY 15 FY 16 FY 17 FY 18 FY 19 FY 20 FY 21 FY 22 FY 23 FY 24 FY 250
200,000
400,000
600,000
800,000
1,000,000
1,200,000
Ener
gy C
on
sum
pti
on
in M
Mb
tu)
INL Goal Subject Energy Use History and Forecast
Ener
gy In
ten
sity
in B
tu/f
t²
Figure 3. Goal-subject energy use and EUI history and forecast.
This chart shows how fuel oil usage was reduced significantly since base-year FY 2003 due to the ATR backup generator set being replaced with a large uninterrupted power supply system. Electric usage continues to climb through FY 2020 as new buildings are constructed in Idaho Falls as well as the INL industrial areas.
Goal-subject electric energy and propane are both projected to decrease significantly in FY 2021 as the AMWTP and RWMC areas begin a transition of shut down and D&D. During that period, the energy use for these buildings, along with the square footage, will be excluded under Part E of the ExcludedBuilding guidance as they are transitioning out of the INL building inventory.
Note: Due to the large building area associated with AMWTP/RWMC, the INL total EUI is expected to increase in FY 2021 as this building area is excluded from the Goal-Subject EUI calculation.
The higher EUI is forecast to slowly decrease from FY 2021 through FY 2025 due to the increasedefficiency of new buildings under construction along with LED lighting upgrade projects that INL is implementing.

vii
EUI by building type for 69 of the metered INL buildings with respect to the target reduction goal is show in Figure 4. Buildings that are higher than goal EUI are mainly in the categories of laboratory and technology/science. To help increase the improvement in EUI, INL plans to identify buildings with high EUI as candidates for energy retrofit upgrades and commissioning.
Figure 4. Building EUI relative to goal.
Plans and Projected Performance1.1.2
INL is planning for moderate growth to further its missions with seven additional support, laboratory,and office buildings at the major INL Site locations through FY 2024. The INL Annual Laboratory Planprovides an overview and details of conceptual laboratory growth.
All new BEA construction projects are guided by the INL Engineering Standards (STD-139), and by the INL High Performance and Sustainable Building Strategy. These two documents reference a requirement for implementation of the Guiding Principles for High-Performance Sustainable Buildings, which requires an energy design of 30% better than the current American Society of Heating, Refrigeration, and Air Conditioning Engineers (ASHRAE) Standard 90.1, “Energy Standard for Buildings except Low-rise Residential Buildings.”
INL energy-related capital project upgrades are strategically funded primarily through the following funding sources:
Direct and indirect funding and reinvesting cost savings from sustainable actions
Special funding requests (third-party, DOE-based funding, line-item)
Utility incentive programs
Integration of sustainability into new infrastructure, major renovations, and maintenance
activities.
INL will maximize the use of available utility incentive programs along with its energy savings reinvestment program to help fund additional projects and/or reduce the cost to implement alternatively funded projects.
BEA has nine projects underway for completion in FY 2020 with a focus on LED lighting to reduce energy usage while significantly improving the indoor work environment. These projects will cost $266kand will reduce annual electric use by an estimated 632.3 MWh and provide savings of $36.1k. In addition, as funding becomes available during FY 2020, BEA will continue to focus on projects that

viii
directly influence the efficiency of buildings being targeted to document the Guiding Principles and to generally reduce energy-use intensity across INL. No cool roof installations are planned for FY 2020. Further energy intensity reductions will continue to be pursued though multiple strategies:
Perform energy auditing on all covered buildings and implement cost-effective recommendations
from these audits.
Evaluate high EUI buildings and determine best candidates for more thorough energy auditing
and/or retro-commissioning and implement cost-effective retrofit projects.
Satisfy sustainable acquisition requirements to purchase ENERGY STAR and FEMP-
recommended devices.
Meet green building goals for new and existing buildings (Guiding Principles for new
construction and existing buildings).
Continue educational campaigns to change employee behaviors (turn off lights and computers
when leaving at the end of shifts, utilize power management when available, and avoid using space heaters, personal fridges, etc.).
Completed construction of the Integrated Waste Treatment Unit (IWTU) in FY 2011 to allow
treatment of the remaining wastes at the INTEC Tank Farm facility. Systems testing has resulted in various facility modifications since construction completion. As such, multiple test runs with surrogate wastes in FY 2015, 2016, 2017, 2018, and 2019 have been conducted. Mixed waste treatment operations are anticipated to begin in FY 2020 or FY 2021, and it is anticipated that the IWTU will require 5 to 7 years of operations to treat the remaining wastes at the INTEC Tank Farm facility. An increase in INTEC energy use is expected to occur during the treatment process. After the IWTU processing is complete, the Calcine Disposition Project may use a portion of the IWTUfacility. The Calcine Disposition Project is also expected to be an energy-intensive treatment process.
Fluor Idaho’s planned actions for energy reduction include discontinuing processes as the cleanup
mission and continuing D&D scope are completed. For selected enduring buildings, LED upgrade projects will continue as funds become available during FY 2020. The recent INTEC energy audit for CPP-603 suggested several building modifications, which are under evaluation by INTEC engineering. While significant portions of the cleanup mission are complete, EM operations will continue limited cleanup mission activities, processing wastes, and inactivating buildings and processes that are no longer needed.
EISA Section 432 Benchmarking and Evaluations1.2
The INL goal for Energy Independence and Security Act (EISA) Section 432 energy and water evaluations is to assess approximately 25% of covered buildings each year to meet the requirement. Covered buildings are defined as those buildings that constitute at least 75% of facility energy use at each agency (42 U.S.C. 8253 (f)(2)(B). The list of BEA and Fluor Idaho covered buildings is updated annually in the Dashboard.
BEA will complete Walkthrough, Class 1, or Class 2 energy audits as follows:
Walkthrough Audit: This audit involves less rigor than an ASHRAE Level 1 audit, also
sometimes called a “walkthrough audit.” It is a basic building audit to validate the previously completed audit report, document changes to the operation, function, and condition of the building since the prior report, and determine if a more detailed Class 1 or 2 audit is warranted for the next audit cycle. Walkthrough audits are recommended for low energy-use buildings such as warehouses, buildings with very simple configurations, and buildings that are in standby mode.
Class 1 Audit: This is the standard energy audit that is recommended for most of INL’s covered
buildings. The Class 1 audit is a walkthrough audit as defined by ASHRAE, but it also includes a portion of the rigor for an ASHRAE Level 2 audit. It is intended to validate the previously completed

ix
audit report, evaluate changes in annual energy usage, identify changes in building operation or condition over the past 4 years, and to recommend new no cost and low-cost EEMs based on the identified changes and/or new technologies. Additionally, the audit will focus on energy and water-reduction measures to meet the Guiding Principles. The BEA Class 1 audit will also perform a detailed survey to verify/identify actual equipment counts, locations, specifications, sizes, and conditions. The results of the Class 1 audit may recommend the performance of a more detailed Class 2 audit for the next audit cycle to further evaluate and model capital intensive improvements.
Class 2 Audit: This audit is a detailed audit based on the ASHRAE Level 2 audit definition, but
it also includes a portion of the rigor for an ASHRAE Level 3 audit and is desired for the buildings BEA is targeting for the Guiding Principles. The Class 2 audit builds on the Class 1 audit and provides detailed EEMs using energy simulation modeling to account for interactions of each recommended upgrade on building systems. Additionally, the audit provides recommendations to meet the energy and water-related Guiding Principles goals.
Performance Status1.2.1
INL has 88 buildings that have monthly energy data entered into Portfolio Manager for benchmarking purposes. Benchmarking data in Portfolio Manager is used for evaluating Guiding Principles’ progress in building energy and water consumption reductions as well as tracking overall trends. For the FY 2019 reporting period, 87 INL buildings are expected to have sufficient monthly energy data available for the annual Compliance Tracking System upload.
INL completed 59 energy audits in FY 2019. INL has 160 covered buildings that require energy audits. In FY 2019, BEA performed 32 energy audits as planned, while Fluor Idaho performed 27 energy audits.
A cumulative total of 129 energy audits have been completed through the end of FY 2019 for the second reporting year cycle for energy auditing (June 1, 2016, through May 31, 2020).
In FY 2019, BEA continued with a subcontract through Nelson Engineering, Inc., to perform energy and water evaluations in conjunction with condition assessment survey (CAS) inspections. The energy and water evaluations for Fluor Idaho EM-covered buildings were performed through a subcontract with KW Engineering.
BEA evaluated and prioritized 797 energy conservation measures (ECMs) identified by energy and water audits completed from FY 2014 through FY 2019 and consolidated the ECM candidates into a proposed project of 190 ECMs at a total cost of $4.9M. As shown on Table 1, this project is currently calculated to provide a 16-year simple payback and will be further evaluated in FY 2020 to improve the financials and to determine a funding source for completion.
Table 1. BEA energy audit results evaluation summary.
ECM Category
Electric
Savings, kWh
Natural
Gas
Savings,
therms
Fuel Oil
Savings,
Gallons
Total Cost
Savings, $
Utility
Incentives
Nelson Cost
Estimate
Escalated for
INL Cost
Estimate
Pay
Back
Controls 472,354 1,716 1,508 $26,619 $0 $211,066 $316,599 11.9
HVAC 1,184,737 0 0 $59,386 $0 $311,260 $466,890 7.9
Motors 153,910 0 0 $7,302 $0 $120,332 $180,498 24.7
Interior Lighting 799,588 0 0 $111,716 $145,192 $1,564,198 $2,346,297 19.7
High Bay Lighting 330,195 0 0 $34,449 $49,571 $485,844 $728,766 19.7
Exterior Lighting 447,981 0 0 $51,982 $29,104 $558,152 $837,228 15.5
Envelope 18,023 181 0 $1,024 $0 $9,515 $14,273 13.9
TOTAL 3,406,788 1,897 1,508 $292,478 $223,867 $3,260,367 $4,890,551 16.0
Plans and Projected Performance1.2.2
BEA will complete the FY 2020 energy and water evaluations in conjunction with CAS inspections by a common subcontractor to reduce the individual costs of both tasks. The order of buildings to be

x
evaluated will consider the date of past audits and the schedule of needed CAS inspections with the intent that all covered BEA buildings are evaluated over a 4-year period. Fluor Idaho plans to complete the walkthrough and ASHRAE Level 1 energy and water audits by working with a qualified subcontractor.
The energy conservation measures (ECMs) identified by these evaluations are prioritized by payback period, potential to meet the Guiding Principles, and by the urgency or need of upgrades. As funding is available, these ECMs will be selected for implementation by a combination of priority and overall cost.
INL will exceed the energy audit goal of 160 audits (160 covered buildings) for the second reporting year cycle (June 1, 2016, through May 31, 2020) by performing 37 energy and water evaluations in FY 2020 for a total of 166 completed audits. BEA plans to perform evaluations on 30 buildings in FY 2020: two walkthrough audits, 26 Class 1 audits, and two Class 2 audits. BEA will prepare project implementation plans for the ECMs identified, with a priority on those projects that support reducing the overall INL energy-use intensity along with achieving an acceptable energy and water reduction inbuildings targeted to meet the Guiding Principles. Fluor Idaho plans to perform energy and water evaluations on seven buildings in FY 2020. ECMs that are identified and proposed by the building energy audit subcontractor will be further evaluated by relevant Fluor Idaho engineering staff for feasibility and prioritizing. Fluor Idaho is continuing to modify the INTEC campus breaker systems to allow metering of all INTEC buildings powered through substations and load centers with planned completion by the end of September 2021.
Portfolio Manager will continue to be used as the energy and water consumption data warehouse and benchmarking tool to assist with overall consumption tracking and Guiding Principles evaluation. As new meters are installed on buildings across INL, these buildings and the metered data will be entered into Portfolio Manager for benchmarking.
Facility Metering1.3
The INL Metering Plan is in Appendix B. The metering plan outlines appropriate metering opportunities, including all covered buildings, significant excluded buildings, and select smaller buildings and utility buildings or systems where metering would be helpful for facility management and system trouble shooting. Along with the metering plan, BEA uses several metering tool spreadsheets originally designed by FEMP to determine cost-effective metering opportunities. These files continue to be updated and used to evaluate building opportunities for metering cost effectiveness and priority planning.
In addition to providing a means of trending and validating energy savings, metering also provides proactive space management opportunities. Building energy and water usage information assists with benchmarking facility performance in Portfolio Manager, maintenance scheduling, enhanced resource utilization, and accurate space charge-back to building tenants. Advanced metering provides a method to encourage and validate employee behavior change and provides a dependable tool for facility managers to tune building systems and controls.
Performance Status1.3.1
All INL Idaho Falls buildings have utility metering installed for electricity and natural gas. Except fora few small buildings, all Idaho Falls buildings have water meters. Most buildings at the INL Site do not have building-specific utility meters. However, meter installations have progressed with new construction projects and will be prioritized for existing buildings by the potential of each building to meet the Guiding Principles and the cost effectiveness of installation. Through FY 2019, 62.2% of INL electrical energy is metered.
Sustainable INL and BEA Facilities Management Control Systems (FMCS) are progressing on a transition to SkyFoundry’s SkySpark software system for building operations and troubleshooting and electric meter reporting.
Fluor Idaho continues to monitor the advanced electrical meters that were installed in FY 2015 at CPP-652, CPP-663, CPP-1604, CPP-1606, and CPP-1650 and the standard electrical and steam meters at

xi
CPP-1696.
Most of the AMWTP buildings do not have utility meters installed. WMF-676 and WMF-635 have standard electricity and propane meters, and monthly consumption data is recorded into Portfolio Manager. WMF-636 has one electric meter and is also tracked in Portfolio Manager. There are no plans to install any additional meters at AMWTP because the facility is scheduled to be shutdown.
Eight buildings at the ATR Complex are metered together as a process and are shown in FIMS as excluded buildings for the energy efficiency goals. The EROB HPC Data Center and two processes at ESL are also shown in FIMS as excluded facilities and/or processes. Due to their construction completion at the end of FY 2019, the new Collaborative Computing Center and Cybercore buildings in Idaho Falls will be excluded from FY 2019 goal-subject energy reporting until energy-use data is compiled and can be used to accurately calculate energy intensity for the FY 2020 reporting period. The square footage of these buildings appears on the FY 2019 excluded facilities list in Appendix A.
Portfolio Manager is used for energy benchmarking of INL buildings. Monthly energy and water data from utility bills and INL-owned advanced meters is uploaded each month. Additionally, energy consumption graphs and tables are posted monthly on an internal website for facility managers to view.
Plans and Projected Performance1.3.2
BEA will continue to evaluate and develop metering plans for additional buildings that may meet the Guiding Principles, all new construction projects, and any other buildings that would benefit from metering on a case-by-case basis. There are no meter installations planned for existing buildings inFY 2020, but three new construction projects (with advanced metering) are scheduled to be completed in FY 2020. Details on further metering are outlined in the INL Metering Plan contained in Appendix B.
Table 2 provides a summary of the number of buildings with meters and percentage of INL electricity that is expected to be metered by the end of FY 2020.
Table 2. INL electrical metering summary.
Fluor Idaho has an existing utilities control system for the remote and automatic operation of the electrical distribution system from control consoles located in CPP-1673. The INTEC utilities control system is planned to receive a major upgrade on the controls for substations, power controls centers, and load centers by the end of January 2021. Part of this upgrade is expected to include the installation of the new Utility Control System, which will enhance metering capability. Power directed through this new control system can be transmitted, displayed, and recorded at one of two computers within the INTEC control room. When completed, this modification is planned to allow power measurement at many ofINTEC’s 82 buildings and 12 trailers, including 19 covered buildings.
Metering Summary Quantity
INL Covered Buildings 160
Covered Buildings Metered through FY 2019 103
Non-Covered Buildings Metered through FY 2019 15
Additional Covered Buildings to be Metered through FY 2020 2
Additional Non-Covered Buildings to be Metered through FY 2020 1
Total Buildings Metered through FY 2020 121
Percentage of Total INL Electricity Metered through FY 2020 (BEA Metering Planning Spreadsheet Tools calculation)
63.8%

xii
Non-Fleet Vehicle and Equipment Energy Use1.4
Equipment usage at INL is heavily dependent upon construction and building projects, repair and renewing of existing infrastructure and structures, and for seasonal needs such as dust mitigation and fire suppression.
Performance Status1.4.1
INL non-fleet vehicle energy use consists of gasoline, diesel, and propane fuels. In FY 2019, INLused 120,268 gal of these various fuels in the non-fleet vehicles and equipment. Together, non-fleet vehicle and equipment energy use totaled 2% of INL total energy use.
Plans and Projected Performance1.4.2
BEA plans to progress with evaluations of electric equipment, such as hybrid diesel/electric bucket trucks and small transport and utility vehicles to ensure they can meet INL demands year-round. Accordingly, BEA will increase usage of electrical equipment instead of diesel equipment, where it can still meet the needs of the users.

xiii
INTENTIONALLY BLANK

xiv
WATER MANAGEMENT2.
Potable water is provided to all Idaho Falls building locations through the City of Idaho Falls municipal water system. Almost all the water use for these locations is metered with billing for both water supply and sewage treatment. Irrigation and the water use for several small buildings is calculated on building square footage and building function. All water at the INL Site is pumped from an underground aquifer and treated onsite. Each of the major industrial areas at the INL Site have their own water pumping, treatment, and disposal facilities. All water pumped at INL is considered potable and there are no alternate non-potable sources such as lakes, rivers, or streams. Therefore, industrial, landscape, and agricultural (ILA) water use is not applicable to INL.
INL has several large process users of potable and raw water, including the ATR cooling system, the INTEC fuel storage pools, an industrial/construction tank filling system at the Central Facilities Area (CFA), the bus wash at CFA, and numerous HVAC and compressor cooling systems, both in Idaho Falls and at the INL Site.
Due to the nature of the various INL missions, many of these industrial operations and processes can be cyclical and result in varying usages of water throughout the year and from year to year. In addition, as buildings are removed and processes are shut down, the lower square footage can result in an increase in water use intensity even as overall water usage is reduced.
Due to the age of many INL buildings and utility systems, water leaks of varying degrees are common. The soil in the Snake River Plain is very porous, so most of these leaks are never seen on the surface and need special sonic instrumentation to identify and locate. As many areas have significant underground utilities and have the potential for soil contamination, it is very costly and time consuming to excavate to repair leaks. In several cases, core samples have been taken where leaks were identified only to find no evidence of the leaks themselves.
Inexpensive water and electric rates impact the cost effectiveness of water saving projects. While INL strives to implement water-reduction projects, water consumption is heavily dependent upon process usage and events or activities, such as wildfires, D&D, and construction work, so this goal will be somewhat of a challenge to consistently maintain.
The INTEC facility separates its potable and raw water systems. Although they both are supplied by the Snake River Plain Aquifer, they have their own separate wells, storage tanks, distribution pumps, and piping. The INTEC potable water system supplies restrooms, drinking fountains, personnel showers, safety showers, and eyewash stations. Some additional uses of potable water include a supply to a demineralized water system for process use at the IWTU facility. The INTEC raw water system supplies the INTEC fire water system, treated water system, and demineralized water system. When water losses from these piping systems occur, they are investigated to find and eliminate the leaks. The Environmental Restoration program is in compliance with the Comprehensive Environmental Response, Compensation, and Liability Act (CERCLA). INTEC has successfully located and eliminated numerous pipeline leaks over the past several years as part of a program to help dry up the perched water vadose zone to reduce mobilization and transport of contaminants.
Performance Status2.1
INL used 798.8 M gal of water in FY 2019, resulting in a water usage intensity of 134.5 gal/ft²—a decrease of 22.7% compared to the FY 2007 baseline (173.9 gal/ft²). However, as demonstrated through water use and building square footage data entered into the Dashboard, INL’s total water use has decreased from 1,050.9 M gal in FY 2007 to 798.8 M gal in FY 2019, for a total water use reduction of 24%. Water usage for INL is shown in Figure 5.

xv
FY 07 FY 15 FY 16 FY 17 FY 18 FY 19 FY 20 FY 21 FY 22 FY 23 FY 24 FY 250.0
200.0
400.0
600.0
800.0
1,000.0
1,200.0
Po
tab
le W
ater
Co
nsu
mp
tio
n (
M g
allo
ns)
INL Water Usage History and Forecast
Wat
er U
se In
ten
sity
(ga
l/ft
²)
Figure 5. INL water usage history and forecast.
As further discussed in Section 2.2, Plans and Projected Performance, water use intensity is expected to increase in FY 2021 as the AMWTP and RWMC areas begin a transition of shut down and removal.
A deep well water meter accuracy evaluation was developed in FY 2019 to determine if the five primary deep well meters at the INL Site are accurate to the Idaho State Department of Water Resources accuracy requirement of +10% of actual water pumped. This evaluation will continue into FY 2020 for the actual flow verification measurements and potential correction factor calculations.
xvi
Plans and Projected Performance2.2
Activities and projects that will continue to contribute to water use reductions for INL include several ongoing tasks:
Water meters are planned for installation on additional buildings targeted for implementation of
the Guiding Principles to monitor and trend water consumption and savings.
Water-reduction opportunities identified by annual energy audits will be prioritized and
implemented for buildings targeted to document the Guiding Principles.
ATR Complex will continue to evaluate equipment using potable water and the respective potable
water use rates to identify potential sources for potable water use reductions.
INL will continue purchasing Environmental Protection Agency (EPA) WaterSense or other
water-efficient products, which will be documented by Sustainable Procurement processes.
DOE-EM missions, as they are completed, will contribute to water reductions. These include the
AMWTP complex of buildings transitioning to shutdown and D&D. However, AMWTP capabilities will continue to be maintained and operated until designated transuranic waste at the INL Site is treated and shipped for disposal.
The remaining D&D building closure actions for the Fluor Idaho building reductions project a
modest reduction in water use with significant building square footage reductions, increasing the water intensity ratio for INL. The scope of projected operation/building closures at INTEC, with minimal building footage reduction from D&D, would not significantly impact those activities involving most of the water usage. The potential change in water intensity contributions from INTEC would not significantly affect INL water intensity.

xvii
INTENTIONALLY BLANK

xviii
WASTE MANAGEMENT3.
Many factors influence INL’s waste streams, including a fluctuating employee population, changes in mission direction, and the large land area on which INL’s facilities are located.
INL will continue to implement projects that reduce waste generation, work with recycling coordinators to identify waste reduction opportunities, increase the types and quantities of items sent for recycling, and evaluate implementing a composting pilot program. INL will continue educational campaigns to change employee behaviors.
While significant portions of the cleanup mission are complete, EM operations will continue limited cleanup mission activities, including processing and disposal of wastes.
The recycling program at INL continues to educate employees to help change behaviors and increase participation in the recycling program. Similarly, the recycling coordinator continues to work with program personnel to identify waste minimization opportunities.
Contracted (offsite) Wastewater Treatment and Municipal Waste Disposal strategies:
Encourage the reduction of wastewater generation (implementation/usage of low-flow sanitary
systems).
Encourage pollution prevention opportunity assessments for new applicable research and
development (R&D) and campus activities.
Municipal Solid Waste Recycling and Waste Diversion3.1
Performance Status3.1.1
INL generated 3,037,088.6 lb (1,377.6 MT) of non-hazardous municipal solid waste in FY 2019. In FY 2018, INL generated 2,793,918.9 lb (1,267.3 MT), resulting in an increase of MSW generated of 8.7% YOY. Of this total, INL diverted 58.2% of it by recycling 1,766,343.9 lb (801.2 MT) of materials, including co-mingled materials, office paper, cardboard, scrap metal, wood, cooking oil, toner cartridges, plant mail, and wood pallets. INL landfilled 576.4 MT of non-hazardous municipal solid waste in FY 2019 and 624.2 MT in FY 2018, resulting in a reduction of 7.6% of materials sent to landfill.
The INL Site Pollution Prevention Plan (DOE/ID-10333) describes the pollution prevention practices pursued at INL.
BEA continued the co-mingled recycling and paper shredding programs at CFA, Materials and Fuels Complex (MFC), ATR Complex, and Idaho Falls during FY 2019. All INL employees can participate in the co-mingled recycling program, which allows a variety of recyclable materials to be placed in one collection bin. Except for Specific Manufacturing Capability (SMC), due to security constraints, all INLemployees have the responsibility to participate in the paper shredding recycling program, which includes regular office paper and controlled unclassified information materials. Fluor Idaho continues a comprehensive co-mingled recycling and paper shredding programs at INL Site facilities and Idaho Fallsoffices. Reminders on recycling programs available to employees at work and at home are provided routinely in the CORE Notes along with changes in the company, and home programs. Three additional shredding containers were placed in INL Site facilities due to an increase in need and awareness.
INL continues to utilize several processes to reduce the quantity and toxicity of hazardous chemicals. The processes follow the simple reduce, reuse, and recycle steps to help achieve the overall goal. INLuses chemical coordinators and environmental personnel to help ensure the requested materials are needed, are not available through an exchange/sharing program, and that the smallest/most appropriate quantity is being ordered. BEA also stipulates the use of the Massachusetts Institute of Technology Green Chemical alternatives list to help chemical coordinators identify greener alternatives to requested chemicals.

xix
Researchers at Idaho Falls facilities (INL Research Center [IRC], Energy Innovation Laboratory, and ESL) are networked by the chemical coordinator. The chemical coordinator can identify any existing chemical stock should a researcher need a small quantity of a particular chemical that already exists at BEA. This program helps to ensure that the chemicals are used for their intended purpose and have a continuous turnover of inventory. The program also reduces the time to acquire needed chemicals without having to purchase new chemicals as chemical coordinators actively search for existing inventory to preclude new purchases.
In FY 2019, Chemical Coordinators began purchasing acceptable chemical with their own chemical purchase cards, increasing traceability and improving efficiency for the requestor. The BEA Procurement organization and chemical coordinators screen subcontractor procurement requirements, ensuring that less-hazardous chemicals are utilized when available. INL integrated environmental, waste management, and industrial hygiene practices to maintain chemical reviews and evaluations to identify existing product inventory and less-toxic substitutions prior to purchase. INL is working actively and continually toward a reduction of inventories through the avenues of acquisition, use, and disposal.
BEA continues to purchase additional four-wheeled paper shredding bins and dual-bin recycling stations to better promote and equip facilities to participate in the recycling program. In the third quarter of FY 2018, restrictions were put in place that limited plastics eligible for recycle due to a lack of domestic and international plastic recycling facilities. Existing image-based recycling station signage was revised to indicate which plastic materials are no longer accepted in the co-mingled recycling stream. INL has not seen an apparent impact from this change at this time.
The INL Hazardous Waste Management Act/Resource Conservation and Recovery Act (RCRA) Permit requires that all operating contractors conduct and complete a source reduction evaluation review and written plan in accordance with the procedures and format provided in the “EPA Waste Minimization Opportunity Assessment Manual” (EPA/625/7-88/003). This review and plan are submitted to the Idaho Department of Environmental Quality every 4 years, the latest on March 25, 2019, and must include detailed descriptions of any programs for contractors to assist generators of hazardous and mixed waste in reducing the volume (quantity) and toxicity of wastes produced.
The AMWTP facility continues to use soft-sided over-pack containers, soil sacks, and macro bags in lieu of corrugated steel “cake boxes” for containment of degraded waste boxes. These containers are lessexpensive, weigh less, and require less material to manufacture. As a result, less fuel is required for transportation and the volume of radioactive waste destined for land disposal is reduced. In addition, six drum overpacks made of plywood are utilized onsite only to get six drums of waste into the box linetroughs for processing more efficiently. AMWTP continues to investigate additional opportunities to use less packaging and lighter, more reusable containers to fulfill its missions.
BEA incorporates a “Sustainability” review of new activities as well as pollution prevention reviews through the Environmental Checklist process, allowing waste diversion activities to be identified earlier in the project life cycle and implementation costs to be built into project budget estimates. Fluor Idaho incorporates reviews of chemical use and storage, use, reuse and recycling of resources and waste generation and management of new activities through the Environmental Checklist process. These environmental aspects are reviewed by the Pollution Prevention coordinator to identify waste reduction or waste diversion opportunities early in the project.
BEA landscaping contractors use mulching mowers at the Idaho Falls buildings to return grass clippings to the lawn rather than taking them to a landfill. In FY 2019, approximately 190,000 lb of grass clippings were diverted from the landfill.
BEA cafeteria contractors continued to recycle their used cooking oil through a contracted vendor.
The Fluor Idaho Pollution Prevention program continued to improve through employee requests for additional recycling containers, suggested container placement to better serve individuals not familiar with meeting and training rooms, and clarification of the battery recycling process.

xx
Plans and Projected Performance3.1.2
INL plans and projected performance for FY 2020 will continue to:
Educate and encourage employees to reduce their waste generation and participate in the
recycling and paper shredding programs at Idaho Falls and INL Site campuses.
Evaluate potential outlets and the expansion of recyclable waste streams, such as and food
wastes, glass, biomass waste.
Reduce the use of printing paper through a campaign for users to ensure printers and copiers are
set to duplex printing. Printing paper with at least 30% post-consumer fiber is required.
Meet or exceed this goal as funding is allocated to further optimize the current waste diversion
systems and modify contracts, and to divert selected waste streams if markets are available.
Construction and Demolition Recycling and Waste Diversion3.2
Performance Status3.2.1
INL generated 18,070.5 MT of construction and demolition (C&D) waste in FY 2019, compared to 30,104.7 MT in FY 2018, resulting in a reduction of 39.6% of C&D waste generated YOY. INL diverted 69.6% (27,915,818.3 lb or 12,662.4 MT) of its C&D waste in FY 2019.
ATR operations and Facilities and Site Services employees negotiated the resale of old diesel fuel that sat in unused diesel tanks since the conversion of backup generator change from diesel to commercial power. The ~35,000 gal of diesel were sold to the vendor, who was able to treat and resell the fuel, providing ~$46,000 toward the costs of the project to treat and demolish the empty tanks.
The CFA landfill continued diverting asphalt removed from onsite paved surfaces and stockpiling it onsite for future reuse on onsite resurfacing projects. BEA diverted over 6 M lb of asphalt in FY 2019 as part of the Washington Boulevard repaving project. Subcontractors used the Recycled Asphalt Base Stabilization process to resurface the road.
BEA continued a volumetric measurement for recycled metals and facility C&D materials generated during construction activities. Both materials are excessed, and as a result, are diverted from the landfill. Paving projects and large legacy cleanout projects at the INL Site locations resulted in significant wastes being sent for reuse or recycle in FY 2019.
Fluor Idaho’s diversion of C&D waste in FY 2019 was limited to non-radiological scrap metal and recycled universal waste from limited D&D activities. Due to the radiological potential of most Fluor Idaho’s C&D waste from D&D waste management activities, most Fluor Idaho’s C&D waste continued to be landfilled.
Fluor Idaho performing D&D scope at MFC coordinated with their BEA counterparts to reduce both Fluor Idaho’s and BEA’s impact on the environment. DOE-ID instructed Fluor Idaho to close the MFCCERCLA Landfill requiring a significant amount of fill material to meet the closure requirements for the CERCLA landfill. At the same time, BEA’s mission required them to excavate a significant amount of rock and dirt from inside the MFC facility to construct a new utility corridor. As a result, INL:
Diverted 57 truckloads of clean fill material to the landfill
Eliminated 114 truck trips of 40 miles each and replaced by 57 trips of 2 miles each saving
4,500 truck miles
Saved about 750 gal of diesel fuel, as well as eliminated the subsequent CO2 emissions.

xxi
Plans and Projected Performance3.2.2
BEA intends to perform the following actions to enhance the C&D waste diversion process:
Incorporate standard instructions on management (diversion) of asphalt wastes for subcontractors
performing paving work in the Environmental Checklist process
Continue to analyze the conditional waste stream to develop better segregation and reuse
strategies
Engage construction subcontractors to solicit best practice ideas relative to BEA logistics and
market potential.
BEA incorporates metals recycling into D&D tasks when allowed under the current DOE policy for recycling metals while Fluor Idaho will continue with existing metals recycling practices as part of ongoing D&D operations.

xxii
FLEET MANAGEMENT4.
Many factors influence INL’s fleet vehicle composition, fuels usages, and related GHG emissions. The large land area on which the INL Site facilities are located requires long commutes (typically over 50 miles each way) and an extensive fleet to provide transportation and equipment for INL Site operations. BEA operates and maintains a large bus fleet with 86 over-the-road motor coaches to provide daily commute services to over 3,000 site workers. Operation of the BEA and Fluor Idaho subcontracted bus fleets helps to improve overall safety on the roads to the INL Site while reducing GHG emissions from both government and privately-owned vehicles. As the only remaining large bus fleet in the DOE complex, BEA will continue to use this fleet as a test bed for the advancement of fuel efficiency, real-world transportation, and transportation fuels R&D.
Fleet Petroleum Consumption4.1
INL continues to implement diversified strategies for reducing fossil fuel use and carbon emissions associated with light- and heavy-duty vehicles. These strategies affect DOE’s petroleum fuel usage through fuel usage reduction and fuel switching activities.
Performance Status4.1.1
In FY 2019, INL used 581,331 gasoline-gallon equivalents (GGE) of petroleum-based fuels for a 38% reduction from FY 2005. This usage is a compilation of all INL contractors, and the total of unleaded gasoline and diesel fuels as reported into the Fleet Automotive Statistical Tool (FAST) database. This reduction calculation indicates that INL continues to exceed the 20% reduction goal.
INL continued its efforts to right size the fleet with more fuel-efficient vehicles. INL acquired 57new light-duty vehicles in FY 2019, 44 of which were AFV or low greenhouse gas (LGHG).
Generally, the BEA-managed fleet, including buses, trucks, and light-duty vehicles, are fitted with Zonar telematics equipment: global positioning systems, electronic-verified inspection report hardware and software, and ZPass asset tracking for riders. This equipment tracks vehicle location, mileage, speed, and other diagnostic data; upgrades and automates vehicle inspections; and electronically logs bus riders. Use of the telematic devices improves safety and efficiency of BEA-managed fleet vehicles; enhances bus routing, lot use, and ridership data; and streamlines vehicle pre-trip safety/maintenance checks.
The Green Fleet Award is open to all federal, state, and local government fleets and is awarded to the top 100 fleets in North America. INL was selected as a 2019 winner, placing 37th out of the 100 awards.The Government Green Fleet Award is a comprehensive set of criteria specifically tailored around the challenges and requirements of the government fleet. The evaluation categories include Fleet Composition, Fuel and Emissions, Policy and Planning, Fleet Utilization, Education, Executive and Employee Involvement, and supporting programs.
In the first quarter of FY 2019, Bergstom Inc., in conjunction with INL and Motor Coach Industries (MCI), was awarded the 2018 Innovative Solutions Award from METRO Magazine for the innovative use of the “no-idle” battery electric auxiliary power unit with solar in a motor coach. This award honors operators and solution providers who develop innovative solutions that save money, run more efficiently, streamline operations, improve customer satisfaction, or increase ridership.
Additional BEA actions included:
Continued to evaluate and use renewable diesel (R99) fuel for all 86 buses in the BEA-managed
fleet
Installed solar panel and battery powered heating and cooling system in several light-duty vehicle
to reduce engine idle
Installed solar panels on all regular run buses to help keep the batteries charged while the buses

xxiii
sit idle over the weekends. This helps reduce the load on the charging systems and ensures that the buses start during cold temperatures
Compiled quarterly flex-fuel usage and calculate the percentage of E85 used compared to
unleaded gasoline. BEA then uses this data, when needed, to encourage the use of E85
Utilized low-speed electric vehicles in place of diesel-powered utility task vehicles (UTVs)
across INL. Initial reviews are positive regarding safety features (i.e., outside mirrors and a backup camera), as well as slower deacceleration than the diesel-powered UTVs. However, heating performance is still an issue.
In FY 2019, the AMWTP vanpool was discontinued and replaced with a commercial bus service.The commercial bus service operates daily between Pocatello, Blackfoot, Idaho Falls, and AMWTP.
Plans and Projected Performance4.1.2
BEA will continue its partnership with MCI and Virginia Commonwealth University to enhance the full-scale bus cab simulator at INL’s ESL. The simulator provides sophisticated research and training to improve driving efficiency and fuel economy. In addition to developing software for a more efficient driver training program, INL is pursuing the installation of Vision Systems Smart-Vision—an intelligent mirrorless rearview system to reduce wind resistance and increase fuel efficiency.
Additional reductions in petroleum-based transportation fuels will be obtained through numerous INL-identified projects and activities implemented in FY 2020 as funding allows:
Continue efforts to build and install no-idle solar-powered HVAC systems on additional buses
Continue the installation of no-idle solar-powered HVAC systems on additional light-duty
vehicles
Support further testing and deployment of a commercial no-idle system with MCI and Bergstrom.
MCI, Bergstrom, and BEA will partner to evaluate the data and encourage potential commercial implementation
As BEA had various issues with R99 in FY 2018, BEA continues to work to mitigate these issues
and will continue to expand the rollout of R99 in additional vehicles and equipment that run on diesel
Fluor Idaho will continue to evaluate its use of light-duty vehicles and bus commuting methods.
Fleet Alternative Fuels Consumption4.2
INL continues to develop diversified strategies for increasing alternative fuel consumption and reducing carbon emissions associated with the operation of light- and heavy-duty vehicles. These strategies affect DOE’s alternative fuel consumption primarily through fuel-switching activities.
Performance Status4.2.1
In FY 2019, INL used 253,848 GGEs of alternative fuels. This represents an increase of 232% fromthe FY 2005 use. These usages are a compilation of all INL contractors and the total of each of the various alternative fuels as reported into the FAST database. This increase calculation indicates that INL continues to far exceed the 10% increase in total alternative fuels as required by the alternative fuelsconsumption goal.
INL is actively pursuing the use of E85, achieving a 666% increase as compared to FY 2005. BEAcontinuing to monitor R99 fuel for use in the bus fleet throughout the year and across varied climaticconditions. Additionally, BEA:
Completed installation of eight electric vehicle charging stations at INL for fleet vehicles,
including a solar power unit at the Central Facilities Area
Implemented the laboratory-wide process for employee personal vehicle use of the charging

xxiv
stations on a cost-recovery basis
Continued testing efforts to enable the use of R99 for use in the bus fleet year around without
cold temperature problems
Conducted a forum in Idaho Falls and Boise in collaboration with the Yellowstone-Teton Clean
Cities Coalition to encourage and cooperate with commercial trucking companies and state agencies on alternative fuel options and fuel credits
Continued efforts to right size the fleet with more flex-fuel vehicles capable of using E85 and to
maximize alternative fuel use
Provided flex-fuel vehicle custodians quarterly reports detailing the percentage of E85 usage
compared to unleaded gasoline usage and were encouraged to use E85 fuel. This method of encouraging self-governing through information has led to increases in E85 fuel use.
Plans and Projected Performance4.2.2
Increase the number of electric vehicles in the light-duty fleet in conjunction with the increase of electric vehicle infrastructure Sitewide.
Install an additional seven grid-sourced electric vehicle charging stations across INL in FY 2020. Continue to evaluate additional electric vehicle charging stations and install as appropriate and cost effective as the BEA-managed electric vehicle fleet continues to expand.
Efforts will be made to evaluate electric equipment such as hybrid diesel/electric bucket trucks and additional electric-only vehicles to ensure they can meet INL demands year-round. Accordingly, BEA will increase usage of electric-powered equipment instead of diesel equipment, where it can be utilized and still meet the needs of the users.
Obtain additional increases in the use of alternative fuels through the expanded rollout of renewable diesel (R99) usage in other vehicles and equipment that currently run on regular diesel.
Promote R99 for diesel-powered heavy- and light-duty vehicles as much as possible. BEA will also evaluate the use of renewable diesel in additional light-duty diesel vehicles and equipment capable of using renewable diesel and only acquire replacement light-duty diesel vehicles that are rated for renewable diesel.
Light-Duty Vehicle Acquisition4.3
INL procures light-duty fleet vehicles almost exclusively through the General Services Administration (GSA) vehicle-leasing program. A rotation schedule based on vehicle age and mileage determines when vehicles are returned to GSA. Working closely with GSA on the light-duty fleet replacement schedule has allowed INL to favor the replacement of all vehicles with AFVs and gasoline-only hybrid vehicles. Although hybrid vehicles are high-efficiency vehicles, they typically do not use an ethanol-blend fuel mixture above 10% and are not counted as AFVs. However, they are considered LGHG emitting vehicles, which assist with reduced petroleum fuel use and its associated GHG emissions.
Performance Status4.3.1
INL acquired 57 new light-duty vehicles in FY 2019, 44 of which were AFV or LGHGs, resulting in 77% of the vehicle acquisitions as AFVs or LGHGs.

xxv
Working with GSA, BEA light-duty vehicle acquisitions totaled 44 new vehicles in FY 2019, of which 31 were AFVs and 13 were gasoline/diesel-only vehicles. Currently, BEA has 378 vehicles in its light-duty vehicle fleet, of which 335 are AFVs. The remaining 43 vehicles are a variety: two electric, 35 gasoline, and six diesel vehicles. The current mix of AFVs in the light-duty fleet is 89%.
In FY 2019 Fluor Idaho replaced 14 light-duty GSA vehicles with 13 AFV E85 flex-fuel vehicles.Fluor Idaho has 110 light-duty vehicles, consisting of 108 AFV E85 flex-fuel vehicles, one gasoline-only hybrid vehicle, and one gasoline-only vehicle, 99% of the entire Fluor Idaho-managed fleet is AFV.
Plans and Projected Performance4.3.1
INL will continue to focus on a light-duty fleet configuration of 100% AFVs.
The BEA fleet manager, in conjunction with GSA, will identify the next gasoline vehicles for replacement with AFVs, which will increase the total AFV percentage in the light-duty fleet. BEA will also continue to leverage vehicle telematics to track fuel usage and ensure that only alternative fuels are used in AFVs.
Fluor Idaho will continue to replace aging light-duty vehicles with AFVs throughout the duration of the project.

xxvi
RENEWABLE ENERGY5.
Large-scale onsite renewable energy generation and the direct purchase of new renewable electricity is not likely to be feasible due to the low cost of electricity from local utilities. Additionally, the generation mix from the local utility provides is dominated by abundant older hydroelectric and coal sources with limited availability of new renewable electricity. INL’s primary electrical supplier for the INL Site facilities currently owns interests in three coal generation plants with plans to eliminate interests in two of them by 2025 and evaluate options for continued emissions reductions from the third plant. Idaho Power is committed to its goal of 100% clean energy generation by 2045, which should dramatically change the mix of renewable energy generated at the utility level.
An evaluation of potential onsite renewable energy generation at INL was completed on October 18, 2011. This evaluation summarized the costs and payback to install the infrastructure to support the installation of a renewable energy project. Costs were estimated at $7M with a payback calculated at 211 years for photovoltaic and 60 years for a single wind turbine. Onsite renewable energy generation is unlikely to be successful without supplemental funding to support such projects.
Low electricity rates benefit INL, allowing for increased strategic missions and facility enhancements. However, cost benefit analyses generally lead decision makers to place a lower priority on installation of renewable energy projects due to longer-than-acceptable project payback periods. In lieu of onsite generation of clean and/or renewable energy, BEA makes an annual recurring purchase of renewable energy certificates (RECs) from Idaho Falls Power, which provides locally generated renewable energy from the Horse Butte Wind Farm.
BEA calculates the number of RECs to purchase based on the total amount of electricity used in the previous year. Generation from onsite renewable electric sources is subtracted from the total electricity usage to determine the quantity of RECs needed to meet the 7.5% requirement.
Purchased RECs meet all Western Renewable Energy Generation Information System requirements, are Green-e Energy Eligible, are retired on behalf of INL, and the generation sources were placed into service within 10 years prior to the beginning of this fiscal year as required. RECs purchased from Idaho Falls Power satisfy the third-level priority of renewable energy purchases as INL is using the energy produced from the RECs purchased.
During annual retro-commissioning, energy audits, existing lease updates, and new lease negotiations, the installation of renewable energy generation is considered, and the payback evaluated. BEA R&D continues to investigate the potential installation of numerous renewable energy technologies but will not invest limited funding into non-research renewable projects that are not economically viable nor mission compatible. INL could meet the onsite renewable energy generation goal if significant funding is secured to support a renewable energy installation.
Performance Status5.1
BEA has one solar transpired wall on the IRC Records Storage Facility at the Idaho Falls campus and two other transpired solar walls on two buildings at MFC. These three solar walls provide a combined total of 149,502 kWh equivalents of renewable thermal energy.
INL maintains numerous small photovoltaic systems (1,200 watts or less) for applications, such as remote air monitoring, environmental monitoring, well instrumentation, evaporative pond circulation, signage lighting, and a solar walkway light. These small onsite photovoltaic systems generated a calculated 220 kWh.
BEA continued to develop the Renewable Energy Micro-grid research project at ESL IF-685. This project capacity is currently at 24 kW from a variety of renewable sources. The energy generated from this project is used to offset the energy used in the ESL’s west high bay. In FY 2019, the micro-grid produced 35,290 kWh of renewable electricity for total INL onsite generation of 35,510 kWh.

xxvii
In addition to the onsite generation from the solar walls, micro-grid, and small photovoltaic systems, INL procured 18,685 MWh of RECs from Idaho Falls Power at a total cost of $31,764. This purchase of new renewable energy RECs, in addition to the 35.5 MWh of onsite generation, totals 18,721 MWh(8.4%) of renewable energy for FY 2019. Table 3 summarizes the renewable energy consumption and RECs purchased in FY 2019.
Table 3. Renewable energy consumption for FY 2019.
Total INL Electric Consumption (MWh)
7.5% Purchase Goal (MWh)
FY 2019 Onsite Generation
(MWh)
FY 2019 Purchased RE (MWh)
FY 2019 Purchased
RECs (MWh)
Total 2019 Renewable
Energy (MWh)
222,184 16,664 35.5 0 18,685 18,721
Percentage <.1% 0 8.42% 8.44%
Plans and Projected Performance5.2
In FY 2020, BEA will purchase RECs from Idaho Falls Power and/or generate renewable energy from the micro-grid or other research projects at a minimum of 10% of the total electric energy consumption.
Moving forward, INL will continue to consider onsite energy generation capability with a long-term goal of at least 7.5% of total electrical energy consumption. In addition to onsite renewable energy generation, the renewable energy goal will be met with the purchase of locally generated renewable energy through servicing utilities, and an annual purchase of RECs, together totaling at least 30.5% of INL electricity consumption by FY 2025 as outlined in the 2019 Sustainability Report and Implementation Plan (SRIP).
Figure 6 summarizes the 10-year history and forecast of total electric energy usage in MWh, onsite renewable generation in kWh, and RECs purchased and percentage in MWh.
FY 16 FY 17 FY 18 FY 19 FY 20 FY 21 FY 22 FY 23 FY 24 FY 250
50,000
100,000
150,000
200,000
250,000
Elec
tric
ity
Usa
ge a
nd
REC
s P
urc
has
ed (
MW
h)
0.0%
5.0%
10.0%
15.0%
20.0%
25.0%
30.0%
35.0%
INL REC Purchase History and Forecast
REC
Pu
rch
ase
Per
cen
tage
(%
)
Figure 6. INL renewable energy credit purchase history and forecast.

xxviii
SUSTAINABLE BUILDINGS6.
Guiding Principles6.1
BEA has incorporated the Guiding Principles into appropriate management documents, including STD-139, “INL Engineering Standards,” and the INL/EXT-10-17808, INL High Performance and Sustainable Building Strategy. Sustainability concepts in general are interwoven into 13 separate BEApolicies, plans, and execution documents. Fluor Idaho has incorporated the Guiding Principles into Fluor Idaho documents, including engineering standards, and they are interwoven into separate policies, plans, and execution documents.
Performance Status6.1.1
As indicated in the Dashboard, INL has 153 buildings greater than 5,000 ft² that are appropriate to consider for the Guiding Principles. At the end of FY 2019, 20 DOE-owned buildings were compliant with the Guiding Principles, two of which are less than 5,000 ft² (see Table 4). Including the two small buildings, a total of 155 buildings are applicable for Guiding Principles.
BEA has documented the Guiding Principles for an additional 10 buildings that are leased buildings.
Table 4. Buildings meeting the Guiding Principles (DOE-owned).
Building NameBuilding Number
GSF
New Construction (NC) or Existing Building
(EB)
GP Year
ATR Technical Support Building TRA-1608 16,567 NC 2011
Radiological & Envir Sciences Lab (RESL) IF-683 13,383 NC 2013
Health Physics Instrument Lab CF-1618 15,484 EB 2013
Irradiated Materials Characterization Lab MFC-1729 12,147 NC 2013
Radiological & Envir. Sciences Office IF-601 20,078 EB 2014
Records Storage Facility IF-663 21,716 EB 2014
CFA Medical Facility CF-1612 22,417 EB 2014
Machine Shop Building MFC-782 5,096 EB 2015
IRC Office Building IF-602 45,619 EB 2016
CFA Transportation Complex CF-696 81,102 EB 2016
Engineering Office Bldg. MFC-710 11,418 EB 2016
Office/Three Labs CF-612 9,872 EB 2016
ATR Test Train Assembly Facility (TTAF) TRA-1626 4,483 EB 2016
Security Building MFC-701 5,825 EB 2016
ATR Simulator Training Facility TRA-679 10,114 EB 2017
CFA Fire Station CF-1611 29,099 EB 2017
Instrument & Maintenance Facility MFC-791 16,332 EB 2017
Office Building CF-615 9,685 EB 2017
Reactor Building & Annex EBR-I-601 27,152 EB 2017
RHLLW - Administration Building B21-631 3,947 NC 2017

xxix
Table 5 shows achievement of Guiding Principles by the number of buildings and building square foot. The “Applicable Buildings” count and square foot totals include the two buildings less than 5,000 ft2
per the “Implementing Instructions for Executive Order 13834 Efficient Federal Operations.”
Table 5. Guiding Principles achievement.Guiding Principles Metric >5,000 GSF Goal >10,000 GSF Goal
Count GSF Count GSF
Total Applicable Buildings 155 4,111,264 98 3,711,349
Total Guiding Principles Buildings 20 381,536 20 381,536
Percent Guiding Principles Achieved 12.9% 9.3% 20.4% 10.3%
Plans and Projected Performance6.1.2
BEA identified seven additional DOE Office of Nuclear Energy buildings that have the highest probability of fully implementing the Guiding Principles. These seven buildings are shown in Table 6.INL will continue to evaluate the existing building stock for an additional candidate.
Two significant barriers to documenting the Guiding Principles are the older building stock and the challenge of cost effectively implementing the modifications needed to meet the energy and water-reduction goals. Energy and water upgrade opportunities can be modeled to reach the reduction goals, but due to the cost of working at INL, along with relatively inexpensive power and water rates, the payback periods of these projects often exceed the life expectancy of the equipment and even the remaining life of the building. BEA will continue to encourage all building modification projects to meet the 30% better than ASHRAE requirement from the Guiding Principles.
INL buildings targeted to meet the Guiding Principles do not include buildings owned by DOE-EM. Since the DOE-EM mission at INL is to reduce footprint and complete cleanup, the existing building life is either too short or too uncertain to invest in upgrades for most DOE-EM buildings.
Table 6. Existing buildings targeted to meet the Guiding Principles (FY 2020–FY 2024).
Building NameBuilding Number
GSFNew Construction(NC) or Existing
Building (EB)
Target Year
MFC Research Collaboration Facility MFC-1742 12,956 NC 2020
TAN Warehouse TAN-1617 17,176 NC 2020
ATR Maintenance Support Building TRA-1643 15,500 NC 2020
Systems Analysis Facility IF-627 11,505 EB 2021
ATR Complex Security Building TRA-1644 11,000 NC 2021
MFC Administration Building MFC-1747 19,000 NC 2021
Sample Preparation Laboratory MFC-1743 42,000 NC 2024
Totals 7 buildings 129,137
After Guiding Principles documentation is completed for the targeted buildings, INL will beexceeding the goal with 16.9% by count of buildings >5,000 GSF (12% by GSF) achieving the Guiding Principles and 26.2% by count with respect to the 10,000 GSF goal (13.4% by GSF).
New Building Design6.2
All BEA construction projects are guided by the “INL Engineering Standards” (STD-139), and by the INL High Performance and Sustainable Building Strategy. BEA considers the 2016 Guiding Principles for Sustainable Federal Buildings as the source for sustainable building design guidance, which is

xxx
included in both documents. Sustainability subject matter experts are included as part of design review teams.
Fluor Idaho has incorporated the Guiding Principles into Fluor Idaho documents, including engineering standards, and they are interwoven into separate policies, plans, and execution documents.
Performance Status6.2.1
INL completed construction on four buildings in FY 2019, all of which have design requirements intended to meet the Guiding Principles.
Table 7. New buildings - construction completed in FY 2019.
Building NameBuilding Number
Owned or Leased
GSF
Design % better than ASHRAE
90.1
Collaborative Computing Center IF-692 Leased 78,576 14.80%
Cybercore Integration Center IF-691 Leased 65,336 19.50%
MFC Research Collaboration Facility MFC-1742 Owned 12,956 13.85%
TAN Warehouse TAN-1617 Owned 17,176 30%
The requirement for energy efficiency to exceed ASHRAE 90.1 by at least 30% is included in the design requirements for these facilities. Documentation for meeting the Guiding Principles will be prepared now that construction is complete.
Barriers to documenting the Guiding Principles for New Construction are similar to existing buildings, including the challenge of cost effectively implementing efficient design upgrades along with limited budgets for new buildings.
Plans and Projected Performance6.2.2
BEA will continue to pursue Guiding Principles and ASHRAE efficiency standards for all new construction projects as are cost effective and appropriate.
New construction projects are guided by “INL Engineering Standards” (STD-139) and the INL High Performance and Sustainable Building Strategy. Energy efficiency requirements of 30% better than ASHRAE 90.1 are incorporated into these documents.

xxxi
INTENTIONALLY BLANK

xxxii
ACQUISITION AND PROCUREMENT7.
Performance Status7.1
INL reports indicate 94.3% of the contracts in FY 2019 contained applicable sustainable acquisition (SA) clauses. The information below is for BEA and Fluor only. DOE information was assumed to be included in the Federal Procurement Data System and reported separately.
Table 8. FY 2019 sustainable acquisition progress.
FY 2019 Sustainable Acquisition (SA) Progress
Metric Total
Number of Eligible Contract Actions 123
Number of Contract Actions w/SA Clauses 116
Percent of Contract Actions w/SA Clauses 94.3%
Total Eligible Contract Dollars ($) $139,212,895
Total Contract Dollars ($) w/SA Clauses $130,279,321
Percent of Contract Dollars w/SA Clauses 93.6%
INL maintains sustainable acquisition language in contracts and requires suppliers of standard desktop computers to provide items designated as Electronic Product Environmental Assessment Tool (EPEAT) Silver or better.
BEA subcontractor requisitions are routed through a review process that includes a check for potential sustainable acquisition products. Documentation of the manufacturer’s literature on the product’s attributes are electronically attached to the requisition and maintained as part of the procurement record. Products are suggested, if not already specified, and the supplier is required to provide a listing and quantity of the sustainable acquisition products upon completion of the project.
BEA continues to use commodity codes related to sustainable acquisition products to enhance automated tracking and reporting within the current system.
Preference Program: BEA’s automatic document generation system was used to further
incorporate sustainable acquisition language. For example, BEA requires its supplier of standard desktop computers to provide items designated as EPEAT Silver or better.
Estimation, Certification, and Verification: BEA requires suppliers (e.g., construction services,
office products, paper products, janitorial products) to deliver spend reports listing the designatedproduct versus preferred purchases. In addition, BEA has developed standard reports that provide the summary data necessary for reporting spending for recycled content products and janitorial products.
Annual Review and Monitoring: BEA conducts an annual assessment of the sustainable
acquisition program to ensure that the appropriate clauses are in place.
Fluor Idaho reduces and minimizes the quantity and toxicity of hazardous chemicals and materials through a procurement process that encourages environmentally preferable purchases. One of the objectives stated in the Fluor Idaho management procedure for the acquisition of material and services is to utilize products and materials that contain recycled and biobased content when practical. Purchase requisitions are screened by an assigned procurement specialist for environmentally preferable materials.
INL does not have a reliable or standard method for tracking only biobased purchases. In FY 2019, INL engaged in approximately 114 requisitions with over 300 purchase actions where affirmative procurement reviews were completed and estimates a 10-20% increase in FY 2020.

xxxiii
Plans and Projected Performance7.2
As regulations and reporting increase, many changes and additions continue to be in sustainable acquisition requirements. BEA plans to continue the following actions to improve their sustainable acquisition programs:
Develop better resources for subcontractors to incorporate sustainable acquisition and biobased
product purchases into their projects and improve reporting process to INL
Enhance the current ordering system to increase sustainable acquisition and biobased product
visibility to the laboratory community
Conduct a campaign to increase the education and awareness of sustainable acquisitions and
biobased products and their effect on performance requirements
Ensure personnel resources are adequate and aligned in accordance with the proper organizational
roles and responsibilities
Enhance appropriate mechanisms to augment the existing reporting requirements and track
compliance with this goal.
Due to the EM cleanup mission, incorporation of additional sustainable acquisition contract clauses into Fluor Idaho subcontracts, including reporting requirements, will be considered, if feasible. Fluor Idaho assisted DOE through compliance with DOE Acquisition Regulation 953.223-78, “Sustainable Acquisition Program,” as required by the Fluor Idaho contract.

xxxiv
MEASURES, FUNDING, AND TRAINING8.
Performance Status8.1
Efficiency and Conservation Measures8.1.1
INL implemented six energy conservation projects in FY 2019 and will work an additional nineprojects in FY 2020. These projects are summarized in Table 9.
Table 9. FY 2019 and FY 2020 sustainability projects summary.
Project Cost ($)Energy Savings (kWh)
Energy Cost
Savings
Project Status
Completed in FY 2019
BEA – B21-608 Whole Building LED Lighting $24,734 21,744 $1,334 Operational
BEA – TAN-678 Cafeteria LED Whole Building Lighting
$14,463 10,579 $845 Operational
BEA – CPP-651 and CPP-653 LED Lighting $25,180 35,085 $1,829 Operational
BEA – TRA-658 Whole Building LED Lighting $25,636 49,932 $2,300 Operational
Fluor Idaho – WMF-676 Chiller Replacement $75,335 130,080 $6,504 Operational
Fluor Idaho – IF-604A HVAC Upgrade $164,000 381,818 $21,000 Operational
FY 2019 TOTAL $329,348 629,238 $33,812
To be Completed in FY 2020
BEA – IF-627 Whole Building LED Lighting $36,329 35,704 $4,097 Awarded
BEA – IF-616 Exterior LED Flood Lighting $16,448 14,095 $648 Awarded
BEA – IF-693 High Bay LED Lighting $26,350 78,468 $3,547 Verified
BEA – IF-639 TLED Lighting $26,250 14,644 $2,126 Verified
BEA – IF-670 TLED Lighting $10,000 28,368 $2,500 Verified
BEA – CF-601 North End LED Lighting $26,250 14,644 $2,162 Verified
BEA – CF-622 High Bay LED Lighting $34,144 27,175 $1,919 Awarded
BEA – CF-674 High Bay LED Lighting $64,430 353,540 $15,431 Verified
BEA – CF-1612 Whole Building LED Lighting $25,315 65,700 $3,723 Awarded
FY 2020 TOTAL $265,516 632,338 $36,153
Performance Contracts8.1.2
INL has one active Energy Savings Performance Contract (ESPC) project in the maintenance stage atMFC (ESPC Project 2 - detailed below). This project has provided consistent and defendable energy savings as documented from annual measurement and verification reports developed by the Energy Services Contractor (ESCo) and reviewed, validated, and approved by DOE-ID. This project has struggled to provide energy cost savings as the actual unit costs for fuel oil and electricity have not escalated as estimated by the original project development.
ESPC Project 1 included lighting and primary transformer upgrades at the IRC Complex for an installed cost of $779K. In FY 2018, the 18-year Energy Savings Performance Contract was fulfilled 2 years early, saving INL $69,817 in avoided debt service payments.
ESPC Project 2 included boiler and compressor replacements, lighting and HVAC upgrades, and solar thermal wall installations at the MFC Complex for an installed cost of $33M. The project was

xxxv
completed in 2010 and is in Year 9 (maintenance stage) of a 16-year contract term.
BEA and Fluor Idaho evaluated a third ESPC project to upgrade steam systems, lighting systems, and other miscellaneous buildings and systems that had not been impacted by recent retrofit projects or the two current ESPC projects. This project was determined to not be cost effective due to the complexity of several of the ECMs, the short life of key steam systems for fuel switching, and the low cost of energy sources at INL. This project was evaluated in FY 2012 and no other alternative financed project has been considered since.
INL has compiled the cost-effective ECMs developed by the energy audit and retro-commissioning activities completed from FY 2014 through FY 2019, into a comprehensive project opportunity that would upgrade specific technologies across INL. This project has a rough order of magnitude cost estimate of over $4.9M and may make an acceptable alternatively funded project, possibly using the ENABLE ESPC funding mechanism. BEA will evaluate this opportunity in FY 2020 to determine if it is a good candidate for an ESPC or if it can and should be funded, in whole or in part, internal to INL.
The primary challenge to implement alternatively funded projects at INL continues to be the low cost of electricity already used as a major energy source. To overcome that challenge, internal costs to develop and oversee projects will need to be reduced. Inexpensive water and long payback periods also affect performance contract viability.
Appropriations/Direct Obligations8.1.3
As a government entity, INL is limited in funding acquisition pathways. There is no standard formula for funding sustainability initiatives. However, potential funding strategies reflect five main sources:
Direct and indirect funding and reinvesting cost savings from sustainable actions
Special funding requests (third-party, DOE base funding, and line item)
Utility incentive programs
Integration of sustainability into new infrastructure, major renovations, and maintenance
activities
ESPCs and UESCs.
In FY 2019, INL spent $329,348 on various energy-related upgrade projects, while also spending $234,719 on energy auditing activities for a total of $564,067. Spending levels for continued efficiency upgrade projects and audits are similar for future years with $491,216 planned for FY 2020 and $475,700estimated for FY 2021.
The base Sustainable INL Program is managed with indirect funding. However, because indirect budgets are typically constrained, it is difficult to fund many of the planned potential sustainability projects. BEA can use utility incentives and internal energy savings reinvestment funding to implement additional facility energy upgrades. Strategic investment dollars are prioritized at a senior leadership level and balanced against laboratory needs.
Training and Education8.1.4
INL has reviewed the “Federal Buildings Personnel Training Act of 2010,” and determined that current Energy Manager Training and Certification meets the requirements of this Act.
BEA employs one certified energy manager, accredited through the Association of Energy Engineers. The energy manager along with a senior energy analyst, engineers, facility managers, and project managers use specialized training to identify, develop, and implement energy-reduction projects based on all available energy-use data and trends, INL mission criteria, and FIMS.
Fluor Idaho has evaluated job functions and determined that Energy Manager Training and Certification are applicable to Fluor Idaho operations and will continue to evaluate them for

xxxvi
implementation.
Plans and Projected Performance8.2
INL has numerous potential Energy Conservation Measures (ECM) developed from the results of the energy audits completed during FY 2014 through FY 2019. BEA evaluated and prioritized 797 ECMs and consolidated them into a proposed project of 190 ECMs at a total cost of $4.9M. These ECMs range from relatively inexpensive control system schedule modifications to more complex and costly capital projects. INL will continue to streamline this comprehensive project opportunity and identify potential funding for completion. However, INL will also continue to consider the individual ECMs for smaller upgrade opportunities when cost effective.
BEA will focus on individual cost-effective projects that lead to the documentation of the Guiding Principles and for overall reductions in energy and water use. BEA will continue to leverage indirect and direct funding along with utility incentives and funding in the BEA reinvestment program to develop and implement these projects.
INL will continue to evaluate the cost effectiveness and practicality of using the ENABLE ESPCprocess to implement projects identified by the ongoing energy and water evaluations. Every effort will be made to bundle like project technologies into an alternatively funded project and expedite the development and approval lead time. Technologies that might be bundled into an ESPC project for BEAinclude:
Exterior lighting upgrades for all Idaho Falls buildings and parking lots
Chiller, heat pump, and air conditioning system and controls upgrades
Interior LED lighting across the entire INL complex
Motor retrofits.

xxxvii
INTENTIONALLY BLANK

xxxviii
TRAVEL AND COMMUTE9.
Air Travel, Ground Travel, and Commute Data9.1
Performance Status9.1.1
In FY 2019, INL employees flew 36,283,197 airlines miles, an increase of 15.6% from the FY 2018total of 31,375,706 miles. INL employees also drove 3,059,633 business-related miles in rental cars and personal vehicles, an increase of 58.9% from the FY 2018 total of 1,925,852 miles. These increases areattributed to increased business volume of INL.
INL conducted an employee commute survey to estimate the total number of miles driven by employees, either to/from work locations or bus stops. The commute survey gathered data on the work schedule, work locations, number of days buses are used, number of days that are teleworked, and number of weeks away from work (sick days, holiday, personal leave, etc.). Employee responses are computed and extrapolated to determine total INL miles traveled for input into the Dashboard.
In FY 2019, INL employees commuted 37,588,461 miles to/from their work location, an increase of 11.1% over the estimated miles commuted in FY 2018. A total of 93,514 miles were attributed to human-powered transportation, such as walking and biking.
INL continues to reduce employee commute by transporting employees with a modernized bus transportation system, taking nearly 2,000 cars off the road per day. By streamlining the INL mass transit system that provides safe, efficient, and sustainable transportation to work for INL employees throughout the eastern Idaho region, INL encourages travel behavior changes to reduce fossil fuel consumption and increase highway safety. In doing so, INL models future trends in mass transit to local government planning across the region. Other actions include instituting a park and ride system, eliminating the cost to BEA employees for using the bus system, adding additional buses to accommodate increased ridership, and relocating employees from the INL Site to Idaho Falls offices.
AMWTP has developed its own rideshare program that currently aids over 75% of its workforce in their commute to and from the INL Site. In addition, five contracted coach buses are used by over 400 employees each workday. These processes have significantly reduced emissions generated by employee commuting.
Plans and Projected Performance9.1.2
INL will continue to implement projects that reduce employee commuting by encouraging the use of the bus system and reducing unneeded travel. As these projects and activities are implemented, corresponding commute mile reductions will occur. BEA is increasing the number of employees while Fluor Idaho and DOE-ID are decreasing or are stable; therefore, INL will likely experience an increase in employee commuting miles and travel.
Employee commute reduction tactics:
Change commuting habits by encouraging carpooling and increased INL bus use
Increase telework and create telework centers
Promote use of emission-free commute transportation sources such as walking and biking and
provide bike-friendly building enhancements such as secure bike storage/lockers or bike racks.
Employee travel reduction strategies:
Use video and web conferencing to hold virtual meetings to avoid travel when possible
Reduce air travel, particularly short-range (<300 miles) air travel, except when required for the
INL mission
Reduce car rentals by promoting carpooling and public or group transportation modes at

xxxix
conferences and other meetings while on business travel.
Regional and Local Planning9.2
Performance Status9.2.1
As INL’s primary contractor responsible for land management and Sitewide transportation, BEAmaintains excellent relationships with local community planning groups and government entities including the cities of Idaho Falls, Blackfoot, Arco, Rexburg, and Pocatello, as well as the Idaho counties of Bonneville, Butte, Bingham, and Bannock. Interactions include transportation infrastructure and maintenance, facility planning locations, traffic patterns, and future infrastructure needs.
Although limited, existing community transportation infrastructure usage is encouraged. BEA works with local and state agencies on transportation planning by providing input and sponsoring awareness events to promote employee-commuting ridership.
Bicycling remains a seasonal method of commuting to the Idaho Falls campus with increasing awareness of personal fitness and energy conservation. Several buildings have changing rooms and showers available for bicycle commuters. Nearly all Idaho Falls buildings have designated bicycle spaces and BEA continues to explore the possibility of covered parking for cycling and motorcycle commuters. BEA encourages walking and bicycling as means of travel within INL Site boundaries. Long-range development envisions continuous improvement of a bicycle and pedestrian-friendly environment.
INL served as a primary and organizing sponsor of the Idaho Falls Earth Day event that showcased alternative fuel/hybrid buses, environmental cleanup, a clean transportation display, and demonstrated ways INL is evolving into a sustainable laboratory. Thousands of community members celebrated sustainability at the event. The Earth Day celebration promoted an awareness of protecting the environment and its resources to create a better future for the world—one of INL’s primary goals. Fluor’s booth focused on recycling to educate the community on recent changes in plastics acceptance criteria. Efforts were made again this year to increase the waste diversion from the event by collecting food waste and recyclables. Approximately 82% of the volume of waste generated at the event was diverted from the landfill.
Plans and Projected Performance9.2.2
BEA continues to work with the following state and local planning organizations:
Idaho Strategic Energy Alliance
Yellowstone-Teton Clean Cities Coalition
Bonneville Metropolitan Planning Organization
Bonneville Transportation Committee
Pocatello Regional Transit
Idaho Transportation Department.
Sustainable development encompasses an integrated approach during the refurbishment and planning of future onsite facilities and infrastructure, which is consistent with the INL Annual Laboratory PlanFiscal Year 2019. INL land, campus, and space planning is a critical element in transforming INL to meet DOE national nuclear R&D goals. The major objective for land, campus, and space utilization is to consolidate and co-locate like activities, and plan and prepare to support future mission needs. BEAcapabilities are consolidated around three main campuses (the ATR Complex, MFC, and Idaho Fallscampus) with each campus supporting specific missions based on capabilities and functions.

xl
FUGITIVES AND REFRIGERANTS10.
Performance Status10.1
INL changed methodologies from the default approach (Quantity issued vs Quantity returned to supply) to the simplified mass balance approach in FY 2019. In previous years, data was not available to use the simplified mass balance approach. The inventory information maintained at INL does not account for materials to be “returned to supply,” so in prior years all inventory purchased was assumed emitted. This resulted in an over-estimate of actual emissions. The fugitive and refrigerant emissions are from emissions generated from 37 fugitives and refrigerants used in INL operations. INL total fugitive and refrigerant emissions for FY 2019 are -314.3 MT compared to 2,485.0 MT in FY 2018. Reporting accuracy should improve with the change in methodology.
INL maintains preventative maintenance schedules for all refrigerant equipment, conducts repairs,and removes and replaces refrigerants with certified refrigerant technicians.
Plans and Projected Performance10.2
INL will continue to look for ways to minimize usage through practicing timely preventative maintenance repairs and will continue to work with facilities personnel to find appropriate substitutes that could have a lower global warming potential.

xli
INTENTIONALLY BLANK

xlii
ELECTRONIC STEWARDSHIP11.
Purchase of EPEAT-Registered Products11.1
Performance Status11.1.1
The INL standard for procurement of desktop computers, workstations, and laptops is to meet or exceed EPEAT Silver and wherever possible, EPEAT Gold standards. INL achieved 96.6% of eligible electronics acquisitions meeting EPEAT standards in FY 2019.
Several ongoing activities helped with achieving a 96.6% success rate:
BEA was one of 59 winners nationwide of the 2019 EPEAT Purchaser Award.
BEA promoted the standard for new electronic equipment and hardware to be a minimum of
ENERGY STAR 5.0 Category B rating and wherever possible, Category A Energy Rating. Dell™ Energy Smart is enabled from the manufacturer. Dell eSMART settings are used wherever possible.
BEA Information Management (IM) continues to promote and maintain up to 300 virtual desktop
infrastructure (VDI) thin client computers in FY 2019.
Fluor Idaho continued to procure ENERGY STAR monitors and computers that are registered as
EPEAT when applicable to the procurement.
Plans and Projected Performance11.1.2
INL will continue to evaluate electronics acquisition requests to ensure that non-standard electronics are registered with EPEAT whenever possible.
Additional expansion of VDI computers will be considered wherever it makes sense and budget allows.
Power Management11.2
Performance Status11.2.1
Power management controls are in place on all eligible computer systems. At INL, 100% of eligible personal computers (PCs), laptops, and monitors have power management controls.
BEA currently has both a policy and procedure that covers the responsibility and directions for implementing and maintaining power management on PCs and monitors to shut down PCs (and peripherals) when not in use. The laboratory-wide procedure covers 100% of BEA IM-managed systems and excludes sensitive and mission-critical equipment. It also calls for owners of self-managed systems to implement the “company-standard” power management settings.
BEA’s written guidance contains instructions for both power management and configuration management software deployed on all BEA computers, ensuring that 100% of the eligible monitors and computers on BEA-managed systems have ENERGY STAR power management settings in place. Currently, 5.6% of managed systems have exemptions. Through configuration management software, the majority of BEA’s computer users do not have administrative rights; therefore, they are not allowed to change the settings on their computers, including the power management settings.
BEA IM continues to use a centrally managed configuration tool (LANDesk) to set and maintain power management settings on all BEA IM-managed and jointly managed computers. Administrators of self-managed computers are given instruction on how to set the power management settings on their computers. The number of variances was reduced to improve the end user’s experience.
Power management default settings are on all eligible Fluor Idaho computer systems. Desktop configuration hardware complies with ENERGY STAR and DOE standby power requirements. However, certain production and plant operations systems were not configured to automatically conserve energy

xliii
(i.e., control room systems and camera monitors, as those systems are safety and operations related and must remain in the “on” position). Fluor Idaho employees are prevented from making changes to conservation settings by Fluor Idaho cybersecurity policies.
Plans and Projected Performance11.2.2
INL will continue to focus efforts on improved power management that are cost effective and least disruptive to performers and will continue to work with IM to improve power management.
Automatic Duplexing11.3
Performance Status11.3.1
At the end of FY 2019, 100% of managed INL equipment has duplex printing enabled, where possible.
INL manages print services for all networked printers and multifunction devices. This includes setting all managed printers to automatically duplex print with the ability for individuals to select single-sided printing on a per-job basis. Additional non-networked copiers are enabled to duplex print where applicable.
Additionally, instructions for individual printers are posted on the internal BEASustainability–Electronic Stewardship website with directions to have BEA Operations Center assist in setting their printers to default duplex print, where available.
Plans and Projected Performance11.3.2
INL will continue to encourage and enable duplex printing on all printers, copiers, and multifunction devices while assessing new opportunities to improve sustainability of printing operations and continuing to reduce the number of personal printers.
Additionally, BEA IM will require business justification for purchasing smaller, stand-alone printers versus using larger group or department-wide enterprise printers.
Electronics End of Life11.4
Performance Status11.4.1
In FY 2019, INL recorded that 100% of electronic devices were reused or recycled. Of that total, 41.3% was sent to a certified recycler, Technology Conservation Group of Portland, Oregon who was certified under the Responsible Recycling (R2) Certification and Recycling Industry Operating Standard (RIOSTM), 43.3% was donated or reused, and 15.4% was recycled through a local non-certified recycler. Sending electronic devices for reuse or recycle meets the GSA definition for recycling electronics.
INL provides an effective electronics disposition program for reusable equipment, which is just one aspect of the overall INL Property Management Systems that is requirements driven and flows down from federal requirements to a comprehensive set of procedures. The system utilizes transfer provisions for onsite use and GSA electronic screening provisions to promote reuse by other federal and state agencies, and offers reuse programs, including donations and sales, following GSA requirements for disposition.
BEA maintains procedures through a series of controlling documents, including, but not limited to, LWP-8000, “Environmental Instructions for Facilities, Processes, Materials, and Equipment, PDD-2000, “Property Management System Description,” and IQ Work Smart process flows. These procedures outline the procedural steps required when materials and equipment require disposition for both users/generators and disposal personnel. Specifically, in LWP-8000, Section 4.8, there are requirements for reuse and/or donation of working electronic products and for use of a certified recycler should the materials not be reusable.
Currently, Fluor Idaho reuses computer equipment when applicable. Fluor Idaho sells un-reusable

xliv
computer equipment to electronics recyclers that use environmentally sound management practices. Fluor Idaho will comply with any applicable federal, state, and local laws, and regulations, and implement the following instructions:
Send all computer equipment received for recycling at the end of their useful life, including those
that are broken and obsolete, to electronics recyclers that use environmentally sound management practices.
Perform due diligence when selecting an electronics recycler to verify that the recycler will
handle and process electronic equipment consistent with all federal, state, and local regulations, and in an environmentally sound manner.
BEA PC redistribution collected electronics, shredded hard drives, and recycled the materials through a certified recycler. In FY 2019, INL recycled approximately 16.6 MT of electronics through a certified recycler.
As an alternative to traditional recycling, BEA, through multiple transfer/donation programs (Education and Research Transfer Program, Laboratory Equipment Donation Program, and Computers for Learning) was able to transfer 816 computers and other various electronic laboratory equipment to local high schools and universities. These transfers were beneficial to DOE and local schools. They prevented the destruction of the equipment and allowed the schools to increase their lab capabilities along with various science, technology, engineering, and mathematics (STEM) programs and activities with little-to-no expense and extend the life of over $2M worth of equipment.
Plans and Projected Performance11.4.2
INL will continue to focus efforts that are cost effective and least disruptive to performers and will continue to work with IM and Property Disposal Services to improve electronics end-of-life disposition.
Data Center Efficiency11.5
Performance Status11.5.1
To achieve greater energy efficiency, BEA IM has embraced numerous emerging technologies within the HPC Data Center:
Completed the installation of additional cooling infrastructure to enable the mechanical systems
to operate more efficiently, including more frequent utilization of free cooling.
Water-cooled rear-doors used to increase the efficiency of the most energy-intensive systems.
Used hot-cold aisle containment to decrease system loads and increase the effectiveness of heat
transfer.
Reoriented servers to achieve better efficiency.
Shut down and eliminated non-needed servers.
Raised supply water temperature to minimize energy use and maximize potential free-cooling
time.
Plans and Projected Performance11.5.2
BEA has commenced consolidating server infrastructure from three locations into the old HPC data center. This will reduce overall power and cooling needs.
BEA plans to close two server locations at the Information and Operation Research Center by the end of the first quarter of FY 2021. The goal is to virtualize as many of the servers as possible into a new virtual machine farm in the former HPC data center.
DOE HQ purchased licenses for a data center infrastructure management tool called Nlyte. BEA has

xlv
reserved license for INL use but has not initiated implementation. Plans to secure funding to implement Nlyte are being developed while BEA continues to focus on server consolidations.
INTENTIONALLY BLANK

xlvi
RESILIENCE12.
Resilience includes the ability to withstand and recover from deliberate attacks, accidents, or naturally occurring threats or incidents. Energy resiliency is the ability to prepare, prevent, and recover from energy and water disruptions that impact mission assurance on federal installations. This means providing reliable power under routine and off-normal conditions, including those caused from extreme weather events.
Performance Status12.1
At INL, all sustainable activities support energy resiliency and by default, make the laboratory a more resilient institution. INL’s sustainable activities include:
Since 2011, BEA painted 3,000 power poles 5 feet up from the ground with the fire-retardant
paint. INL prioritized power poles receiving the paint based on service area, damage risk, and vegetation density. Every pole painted with the latex-based fire-retardant paint survived the 2019 Sheep Fire, which burned 112,000 acres. Even poles that had not been repainted since their initial coat in 2012 and 2013 survived. INL’s mitigation efforts successfully kept power to its grid during the Sheep Fire.
Sustainable Acquisition clauses are found in INL electronics acquisition blanket purchase orders.
As noted in the INL Green Purchaser award, using EPEAT products reduces energy use, helping reduce electric load and demand.
INL procurement requirements lend preference to use local suppliers and manufacturers,
shortening the supply chain and reducing the chances of delivery disruptors.
Completed annual update of operational procedures and processes to address sustainability,
emergency planning, and operational resiliency.
Completed numerous energy and water-reduction projects resulting in lower energy use and load
demands on the servicing utility.
Continued evaluating and considering alternative energy solutions ranging in scope from micro-
grid renewable generation to potential small modular reactor projects capable of providing local clean alternative energy.
In FY 2014, the University of Idaho participated in developing a vulnerability assessment for INL—one of the first vulnerability assessments completed by DOE. University of Idaho and BEA used a common framework for assessing vulnerability that considers exposure, sensitivity, impact, and adaptive capacity to assess vulnerability. In FY 2019, University of Idaho experts determined that an update to the vulnerability study was not needed. However, impacts to operating systems and affected buildingscontinue to be evaluated. BEA will re-examine the vulnerability study in FY 2021.
INL has comprehensive emergency response procedures in place that cover all INL facilities:
BEA procedures include: PLN-114, “Idaho National Laboratory (INL) Emergency Plan/Resource
Conservation and Recovery Act (RCRA) Contingency Plan,” addresses the elements of, and is the primary component in defining and directing the INL Emergency Management Program. The plan implements DOE policy and requirements for an emergency management system and a RCRA contingency plan specified in LRD-16100, “Emergency Management System,” which includes citations to DOE O 151.1C, “Comprehensive Emergency Management System,” and other DOE requirements. The plan was updated in FY 2019.
Fluor Idaho procedures include: PLN-2012, “ICP Core Emergency Plan/RCRA Contingency
Plan,” includes the emergency response elements that are required in DOE O 151.1D, “Comprehensive Emergency Management System,” for INTEC, RWMC (AMWTP and Accelerated Retrieval Project), and the Fluor Idaho-operated buildings in Idaho Falls.
xlvii
Several INL Emergency Management procedures were updated to better prepare INL for naturally occurring phenomenon. INL’s emergency plans and emergency plan implementing procedures (EPIs) are reviewed at least annually and revised if necessary. The plans and EPIs may be revised based on:
Changes in emergency planning or company operations, policy, concept of operations,
procedures, organization and staffing, and facility operations and/or mission
Direction of the DOE-ID Emergency Management Program administrator
Failure of emergency plan implementing procedures during drills, exercises, and real events
Results of audits, evaluations, appraisals, and self-assessments
New facility information.
Plans and Projected Performance12.2
BEA will be guided by science to build resilience into DOE-ID-managed lands, facilities, and equipment. A general framework used in resiliency planning includes identifying exposure, translate that exposure into potential impacts, prioritize risk, devise solutions, and secure funding. BEA will work with internal and external stakeholders to address threats to missions and programs. Priority actions include:
Investing in research and supplying critical data and information
Implementing actions that highlight benefits of new technologies, innovative resource
management, and infrastructure improvements that will improve the resiliency of DOE-ID’s operating footprint.
BEA continues the process of incorporating resilient design into new and existing buildings. Program leads and engineers are well versed on the trends associated with resilient design. As this new field emerges and expertise becomes more refined, controlling documents will be targeted for incorporatingresiliency tactics. In FY 2019, three engineering procedures were updated to reflect the newest requirement set and a new process implemented to ensure safe and resilient upgrades to existing lighting fixtures. A fully mature program is approximately 3 years away.
Processes and actions for future activities include the following (for both new and existing buildings):
Incorporate resilient design and management into the BEA facilities planning process
Identify and evaluate vulnerabilities to natural hazard risks (e.g., storm events, localized flooding,
extreme temperatures, and wildfires)
Consider enhanced fire-proofing strategies and designs
Consider designs for enhanced drought tolerance
Ensure continuity of operations and access to electricity in the event of an extended power outage
Improve energy performance of building envelopes, such as new compressors to increase
reliability and efficiency at INTEC
As appropriate, use information modeling to assess design options and to improve decisions
based on life-cycle analysis
When cost effective, adopt passive and natural design strategies overactive and mechanical
systems.
INL is well positioned to address the need for organizational resilience elements in future plans. With leadership commitment, INL will continue to ensure that the appropriate events and risk elements are considered as part of INL programs and planning activities. Policies and procedures will be evaluated to determine whether they should be modified to consider organizational risks. Emergency response, workplace safety and health, and the most updated scientific knowledge will continue to be incorporated

xlviii
into all facets of organizational resilience.

xlix
Appendix A
Excluded Buildings Self-Certification

l
INTENTIONALLY BLANK

li
Appendix AExcluded Buildings Self-Certification

lii
Program Office NE
Site 602
Site 603 Idaho National Lab - Scoville
Site # Property ID
Justification Comments
Real Property
Unique IDProperty Name Exclusion Part
Property
TypeGross ft² Goal Subject ft² Excluded ft²
602 B60-606 205829 Boise Outreach Office #2 C - Full Service Lease Building 1,520 0 1,520
602 B60-607 218017 University of Utah Research Park C - Full Service Lease Building 3,869 0 3,869
602 IF-654 96845 Engineering Research Office Bldg G - Separately Metered Intensive Load(s) Building 239,746 234,461 5,285
602 IF-654A 205463 EROB Mechanical Building Annex G - Separately Metered Intensive Load(s) Building 1,083 0 1,083
602 IF-661 219136 Idaho Falls ICP Training Center C - Full Service Lease Building 4,650 0 4,650
602 IF-691 219283 Cybercore Integration Center E - Building Entering the INL Inventory Building 78,576 0 78,576
602 IF-692 219285 Collaborative Computing Center E - Building Entering the INL Inventory Building 65,336 0 65,336
602 IF-694 218732 N&HS Laboratory & Training Facility C - Full Service Lease Building 23,624 0 23,624
This report qualifies DOE Owned, DOE Leased, Contractor Leased, Contractor License and Permit buildings and trailers where the Excluded Facilities (GSF) is greater than zero.
The offices rented in the Boise Outreach Office #2 include a full-service lease where all utilities are included in the lease. The utility account is owned and maintained by the building owner so the energy and building are excluded
from the Goal Subject energy usage and energy intensity. B60-606 is excluded based on Exclusion Part C. Ernest Fossum, CEM 11/7/19
INL is excluding the EROB High Performance Computing (HPC) data center due to its significant use of energy that is not impacted by traditional building level energy efficiency improvements. IF-654A is solely responsible for
cooling of the HPC servers and is separately metered. IF-654A is excluded based on Exclusion Part G. Ernest Fossum, CEM 10/30/19
INL's new Cybercore Integration Center is a new building that was completed at the end of FY 2019. Energy use for this building is metered and will be excluded from the Goal Subject energy usage for the FY 2019 reporting
period. IF-691 is excluded based on Exclusion Part E. Ernest Fossum, CEM 10/30/19
The new N&HS Laboratory and Training Facility is a newly leased building with a full-service where all utilities are included in the lease. Energy use for this building is metered, but the account is owned and maintained by the
building owner so it is excluded from the Goal Subject energy usage. IF-694 is excluded based on Exclusion Part C. Ernest Fossum, CEM 11/7/19
INL's new Collaborative Computing Center is a new building that was completed at the end of FY 2019. Energy use for this building is metered and will be excluded from the Goal Subject energy usage for the FY 2019 reporting
period. IF-692 is excluded based on Exclusion Part E. Ernest Fossum, CEM 10/30/19
The new Idaho Falls ICP Training Center is a newly leased building with a full-service where all utilities are included in the lease. Energy use for this building is metered, but the account is owned and maintained by the building
owner so it is excluded from the Goal Subject energy usage. IF-661 is excluded based on Exclusion Part C. Ernest Fossum, CEM 11/7/19
The offices rented in the University of Utah Research Park include a full-service lease where all utilities are included in the lease. The utility account is owned and maintained by the building owner so the energy and building is
excluded from the Goal Subject energy usage and energy intensity. B60-607 is excluded based on Exclusion Part C. Ernest Fossum, CEM 11/7/19
(SSP FIMS Data) U.S. Department of Energy Page 1 of 2
Sustainability Performance Office - Sustainability Dashboard
Energy Consuming Excluded Buildings and Trailers List 11/7/19
Idaho National Lab - Idaho Falls REC
INL is excluding the EROB High Performance Computing (HPC) data center due to its significant use of energy that is not impacted by traditional building level energy efficiency improvements. The EROB HPC uses 5,285 ft² in
EROB and is separately metered from the rest of the office building. The EROB HPC along with IF-654A are excluded based on Exclusion Part G. Ernest Fossum, CEM 10/30/19
FY 2020 INL SSP / FY 2019 Energy Reporting to the DOE Sustainability Dashboard

liii
Program Office NE
Site 602
Site 603 Idaho National Lab - Scoville
Site # Property ID
Justification Comments
Real Property
Unique IDProperty Name Exclusion Part
Property
TypeGross ft² Goal Subject ft² Excluded ft²
603 TRA-640 96650 Hazardous Chem Storage Bldg G - Separately Metered Intensive Load(s) Building 1,891 0 1,891
603 TRA-670 96138 ATR Reactor Building G - Separately Metered Intensive Load(s) Building 128,040 0 128,040
603 TRA-671 96139 ATR Cooling Tower Pumphouse G - Separately Metered Intensive Load(s) Building 3,568 0 3,568
603 TRA-672 96140 Pump House & Well #4 G - Separately Metered Intensive Load(s) Building 404 0 404
603 TRA-674 96652 Diesel Generator Bldg G - Separately Metered Intensive Load(s) Building 704 0 704
603 TRA-676 92397 ATR Fitness Center G - Separately Metered Intensive Load(s) Building 2,146 0 2,146
603 TRA-689 131170 Dynamic Learning Facility G - Separately Metered Intensive Load(s) Building 5,359 0 5,359
Idaho National Lab - Idaho Falls REC
(SSP FIMS Data) U.S. Department of Energy Page 2 of 2
Sustainability Performance Office - Sustainability Dashboard
Energy Consuming Excluded Buildings and Trailers List 11/7/19
FY 2020 INL SSP / FY 2019 Energy Reporting to the DOE Sustainability Dashboard
This report qualifies DOE Owned, DOE Leased, Contractor Leased, Contractor License and Permit buildings and trailers where the Excluded Facilities (GSF) is greater than zero.
The ATR and its three support facilities use 62% of the total electricity consumed at the ATR Complex area. This building is one of three small incidental buildings that are campus metered with the four primary ATR Buildings.
Energy use for these buildings is separately metered from the rest of the ATR Complex. TRA-689 is excluded based on Exclusion Part G. Ernest Fossum, CEM 10/30/19
The ATR and its three support facilities use 62% of the total electricity consumed at the ATR Complex area. This building is one of three small incidental buildings that are campus metered with the four primary ATR Buildings.
Energy use for these buildings is separately metered from the rest of the ATR Complex. TRA-676 is excluded based on Exclusion Part G. Ernest Fossum, CEM 10/30/19
Advanced Test Reactor (ATR) process energy use. The ATR and its three support facilities use 62% of the total electricity consumed at the ATR Complex area. This building is one of the four primary ATR Buildings. Energy use
for these buildings is separately metered from the rest of the ATR Complex. TRA-672 is excluded based on Exclusion Part G. Ernest Fossum, CEM 10/30/19
The ATR and its three support facilities use 62% of the total electricity consumed at the ATR Complex area. This building is one of three small incidental buildings that are campus metered with the four primary ATR Buildings.
Energy use for these buildings is separately metered from the rest of the ATR Complex. TRA-640 is excluded based on Exclusion Part G. Ernest Fossum, CEM 10/30/19
Advanced Test Reactor (ATR) process energy use. The ATR and its three support facilities use 62% of the total electricity consumed at the ATR Complex area. This building is one of the four primary ATR Buildings. Energy use
for these buildings is separately metered from the rest of the ATR Complex. TRA-671 is excluded based on Exclusion Part G. Ernest Fossum, CEM 10/30/19
Advanced Test Reactor (ATR) process energy use. The ATR and its three support facilities use 62% of the total electricity consumed at the ATR Complex area. This building is one of the four primary ATR Buildings. Energy use
for these buildings is separately metered from the rest of the ATR Complex. TRA-674 is excluded based on Exclusion Part G. Ernest Fossum, CEM 10/30/19
Advanced Test Reactor (ATR) process energy use. The ATR and its three support facilities use 62% of the total electricity consumed at the ATR Complex area. This building is one of the four primary ATR Buildings. Energy use
for these buildings is separately metered from the rest of the ATR Complex. TRA-670 is excluded based on Exclusion Part G. Ernest Fossum, CEM 10/30/19

liv
INTENTIONALLY BLANK

lv
Appendix B
Idaho National Laboratory Metering Plan

lvi
INTENTIONALLY BLANK

lvii
Appendix B
Idaho National Laboratory Metering Plan
Supplemental to the INL SSPUpdated 11/21/19
Introduction
Using a combination of the “Federal Building Metering Guidance” (November 2014 Update), Executive Order (EO) 13834, “Efficient Federal Operations,” the DOE Sustainability Report and Implementation Plan (SRIP), and DOE Order 436.1 “Departmental Sustainability,” this INL Metering Plan has been prepared to identify appropriate opportunities for installing or upgrading utility metering.
INL is divided into two major areas: Idaho Falls buildings and the INL Site campuses including the Advanced Test Reactor (ATR) Complex, Materials and Fuels Complex (MFC), Idaho Nuclear Technologies and Engineering Center (INTEC), Waste Management Facility (WMF), Central Facilities Area (CFA), and Specific Manufacturing Capability (SMC).
INL uses the Metering Planning Tool created in 2001 by the Federal Energy Management Program (FEMP) and updated regularly by INL. One file is maintained for the Idaho Falls buildings (Metering Planning Tool INL Site 602 FY-1x Update.xlsx), with a separate file maintained for the INL Site campuses (Metering Planning Tool INL Site 603 FY-1x Update.xlsx). These files are used to evaluate all INL covered building inventory for cost-effective and appropriate metering opportunities. These filesshow the currently planned meter installations for FY 2020 through FY 2024.
This metering plan and associated planning tools are intended to be living documents and will be updated on an as-needed basis.
Metering Program Objectives
INL has a need to expand its current energy and water metering capabilities to ensure metered data is entered into the EPA Portfolio Manager database for all covered buildings and that this data is available to evaluate buildings for incorporation of the Guiding Principles for High Performance Sustainable Buildings as outlined in Executive Order 13834 and emphasized in DOE Order 436.1 and the SRIP.
The current goal is to ensure that a minimum of 15% of the enduring existing buildings greater than 10,000 ft² have been evaluated and documented for incorporation of the Guiding Principles by FY 2025.The Guiding Principles include an evaluation of energy and water intensity for each building. Metering is required to collect and compile energy and water usage data.
In addition to goal-related objectives, INL Site uses metered data to trend building performance, determine potential efficiency options, and assist facility management with operational problem identification and correction. The INL Sustainability Program includes a Certified Energy Manager and a Senior Energy Analyst who trend, track, and evaluate energy use at the building level where meters are installed and at the macro level for INL. Increased metering provides the ability to track and trend utility usages and provide appropriate management assistance.
To improve trending and tracking of energy data, Sustainable INL continues with a partnership INL FMCS. The focus of this partnership is to identify opportunities to improve employee comfort and productivity along with effective energy and water trending leading to decreased utility resource costs.

lviii
Existing Metering
All INL Site energy and water use is metered at the macro level using an annual total methodology. All the major INL Site campuses are metered for total electricity and for selected programs or processes within each campus. Building level metering, as a rule, has not historically been provided or maintained for individual buildings across INL Site campuses.
All buildings in Idaho Falls, both owned and leased, are metered on an individual building level for electricity and for natural gas using a combination of advanced and standard metering. Electrical metering is maintained by the City of Idaho Falls for municipal utility billing purposes. The City of Idaho Falls incorporated an advanced meter installation project throughout its utilities’ territory in 2012, so most of INL’s significant Idaho Falls buildings have advanced metering. The city has provided a link so that INL buildings and sustainability organizations can monitor electric usage data. All-natural gas meters are standard meters.
The updated planning tool spreadsheets indicate that through FY 2019, 62.2% of the total INLelectric energy is metered. Currently, there are a total of 118 buildings metered and an additional 59covered buildings that have not yet been metered. As illustrated in Table B-1, by the end of FY 2020there will be 121 buildings metered for a total of 63.8% of the total INL electric energy metered at the building level.
Table B-1. INL electric metering summary.
Final State Metering
BEA plans to implement building-level metering in all covered buildings that are targeted for documentation of the Guiding Principles and then continue metering additional covered buildings on a case-by-case basis working toward the goal of all covered buildings being metered at the building level.
Evaluation Criteria
According to the Metering Guidance, all federal buildings, including owned and leased, are considered appropriate for energy or water metering unless identified for potential exclusion.
The following exclusion criteria are used to select buildings that are not appropriate to be included and analyzed by the two spreadsheet tools for additional metering opportunities:
Buildings with a planned removal or D&D date within the next four years (audit cycle)
Buildings listed in FIMS as “Pending D&D,” “Operational Standby,” or “Shutdown”
Buildings without an energy-consuming heating/cooling system or without significant process
loads
Buildings less than the minimum ft² thresholds in Table B-2.
Metering Summary Quantity
INL Covered Buildings 160
Covered Buildings Metered through FY 2019 103
Non-Covered Buildings Metered through FY 2019 15
Additional Covered Buildings to be Metered through FY 2020 2
Additional Non-Covered Buildings to be Metered through FY 2020 1
Total Buildings Metered through FY 2020 121
Percentage of Total INL Electricity Metered through FY 2020 (BEA Metering Planning Spreadsheet Tools calculation)
63.8%

lix
Table B-2. Minimum ft² thresholds for metering.
Food Service/Sales <1,000 ft²
Warehouses <25,000 ft²
All Other Building Functions <5,000 ft²
All other buildings and all covered buildings are considered appropriate for metering.
METERING IMPLEMENTATION PLANNING – Idaho Falls Buildings
There are 32 owned and leased buildings in Idaho Falls with billed utility energy use. The Metering Planning Tool spreadsheet for Idaho Falls buildings shows all 32 to be appropriate for metering and that all 32 are metered. Note that this spreadsheet is regularly updated with the most recent update being used.
Metering Planning Tool INL Town 602 FY-20.xlsx.
Electricity
There are 34 owned and leased buildings in Idaho Falls. All these buildings are metered for electricity on a building level basis with either standard or advanced metering.
Natural Gas
There are 22 owned or leased buildings in Idaho Falls metered for natural gas. All these buildings are metered by Intermountain Gas for individual billing purposes. INL compiles this usage data on a monthly and quarterly basis for input to Portfolio Manager and the Dashboard. There are no current plans to upgrade any of the natural gas standard meters to advanced metering.
Water
Of the 32 buildings in Idaho Falls, 17 are metered for water along with one building that is billed through water use calculations. There are also 14 buildings at the IRC Complex that are campus metered by a single meter. The IF-606A RAP Addition is metered along with IF-606 and the IF-654A Mechanical Building Annex is metered along with EROB (IF-654). Two buildings in Idaho Falls do not use water.
The INL Sustainability Program currently compiles and reports the metered and calculated water usage data on a monthly and quarterly basis for input to Portfolio Manager and the Dashboard.
METERING IMPLEMENTATION PLANNING - INL Site Buildings
Of the 505 owned buildings at the INL Site industrial complex locations, 156 are identified as appropriate to be considered for metering and are listed in the Metering Planning Tool spreadsheet for INL Site buildings. Note that this spreadsheet is also regularly updated with the most recent update being used.
Metering Planning Tool INL Site 603 FY-20.xlsx.Electricity
The INL Site currently meters electricity for 84 covered and non-covered buildings, 61 of which have advanced meters while the remaining 23 have standard meters. A balance of 59 covered and 13 non-covered unmetered buildings are spread across all of the major INL Site industrial complex campuses andwill be evaluated on a case-by-case basis to determine the cost effectiveness and applicability of metering with the first priority being to document the Guiding Principles.
Seven buildings at the ATR Complex are metered together as a process and are shown in FIMS as excluded buildings from the energy efficiency goals. The EROB HPC Data Center and two processes at ESL are also shown in FIMS as excluded facilities and/or processes. These buildings are shown in FIMSas excluded in the sustainability attributes using Subgroup G – Metered Intensive Loads. The square footage of these buildings appears on the excluded facilities list in Appendix A.

lx
Portfolio Manager is used for energy benchmarking of INL buildings. Monthly energy and water data from utility bills and INL-owned advanced meters is uploaded each month. Additionally, energy consumption graphs and tables are posted monthly on an internal website for facility managers to view.
Natural Gas
Two buildings at CFA share one Liquefied Natural Gas storage tank and share the resultant natural gas for heating purposes: the CFA Dispensary and the CFA Fire Station. Both buildings have standard meters for natural gas, which are read monthly by hand.
Steam
As part of the MFC ESPC project that upgraded and consolidated the MFC central steam system to five individual buildings that would need steam distribution. Steam metering was installed on all five of these buildings. The remainder of the INL Site has several steam systems that will be further evaluated for applicability and cost effectiveness of steam metering.
Water
All water that is pumped from the Snake River Plain Aquifer through the INL Site deep wells is metered and the data compiled for annual reporting. Nineteen buildings have building level water meters.
Advanced Metering Equipment Package
INL has selected a metering equipment package that will allow for remote meter data reading and compilation. The use of a standard meter with hand reading requirements is not typically considered an alternative for new installations.
Veris Energy Meter BACnet capable
APC Uninterruptable Power Supply
Veris Amperage Sensors (3)
Enclosures, conduit, wire, and miscellaneous as needed for final installation.
Costs for this metering package that is compatible with existing INL building control and data monitoring systems is approximately $8,500. Installation costs, including off-hour lock-out/tag-out for a complete building shut down to install the amperage sensors, are approximately $14,500 depending upon the building and complexity of the connections. Total installation cost for one meter and as entered intothe metering planning tools is $23,000.
INTEC Breaker System Upgrade
INTEC has an existing utility control system (UCS) for the remote and automatic operation of the electrical distribution system from the control consoles located in CPP-1673. By the end of January 2021, the INTEC utility control system will receive a major upgrade on the controls for substations, power control centers, and load centers. Part of this upgrade will include modifying the breaker communication software to allow power consumption (kWh) to be recorded at one of two HMI PCs within INTEC control room (CPP-1673) as shown in Figure B-1.

lxi
Figure B-1. INTEC Utility Control System project upgrade summary.
This modification will allow INTEC power measurement at many the 82 INTEC buildings and 12trailers, including the 19 INTEC covered buildings listed in the Metering Planning Tool.
Energy Tracking Systems
The INL Energy Manager and Senior Sustainability Analyst continue to track and evaluate all metered buildings for energy-use anomalies and efficiency improvements. Portfolio Manager is used for benchmarking of metered buildings and all energy and water reports are published in .pdf format on the internal Sustainability website.
The INL FMCS team is continuing to develop electricity consumption dashboards and implement SkySpark programming for more effective data management and improved energy trending.
Funding Process
The remaining covered buildings that are currently unmetered will be evaluated on a case-by-case basis to determine the cost effectiveness and applicability of metering with the priority being to document the Guiding Principles and to progress toward the final goal of 100% covered buildings metered. Direct and indirect funding sources will be considered and requested as applicable to meet the goals of the SSPand the SRIP.

lxii
INTENTIONALLY BLANK

lxiii
Appendix C
DOE Sustainability DashboardSummary Report

lxiv
INTENTIONALLY BLANK

lxv
Appendix C
DOE Sustainability Dashboard
Summary Report
SCOPE 1 &2 Greenhouse Gas Emissions FY 2008 (baseline) FY 2019 % Change
Total (MtCO2e) 141,005.1 81,806.8 -42.0%
Energy Intensity FY 2003 (baseline) FY 2019 % Change
Energy Intensity (Btu/GSF) 182,978.5 154,015.7 -15.8%
Energy Intensity FY 2015 (baseline) FY 2019 % Change
Energy Intensity (Btu/GSF) 154,357.7 154,015.7 -0.2%
Renewable Energy
FY 2019 Electricity
Consumption
FY 2019
Renewable Electricity
w/ Bonuses % of Total
Total (MWh) 222,184 19,316 8.7%
Potable Water Intensity FY 2007 (baseline) FY 2019 % Change
Water Intensity (Gal/GSF) 173.9 134.5 -22.7%
Industrial, Landscape, Agriculture Water FY 2010 (baseline) FY 2019 % Change
Total ILA Water (million gal) 0.0 0.0 N/A
High Performance Sustainable Buildings
>5,000 GSF Building
Count
Total Applicable
FY 2019
Guiding Principles
Certified % of Buildings
Performance (%) 155 20 12.9%
High Performance Sustainable Buildings
10,000 GSF Building
Count
Total Applicable
FY 2019
Guiding Principles
Certified % of Buildings
Performance (%) 98 20 20.4%
Fleet Petroleum FY 2005 (baseline) FY 2019 % Change
Total Petroleum (GGE) 938,197 581,331 -38.0%
Fleet Alternative Fuel FY 2005 (baseline) FY 2019 % Change
Total Alternative (GGE) 76,436 253,848 232.1%
Municipal Solid Waste Diversion FY 2019 %
Non-diverted Waste 576.4 41.8%
Total Diverted Waste 801.2 58.2%
Total Waste (metric tons) 1,377.6 100.0%
C&D Waste Diversion FY 2019 %
Diverted C&D Waste 12,662.4 69.6%
Total C&D Waste (metric tons) 18,192.4 100.0%
Electronics Acquisition EPEAT Acquired Total Acquired %
Total Acquired 6,994 7,241 96.6%
Electronics Recycling Transferred / Recycled Landfilled %
Total Electronics Waste (metric tons) 40.272 0.000 100.0%
Power Management (PM) Total Owned PM Enabled Exempt %
Total Items 32,397 30,754 1,643 100.0%
Duplex Printing Total Owned Duplex Enabled Incapable %
Total Printers 873 761 112 100.0%
Sustainable Acquisition (SA)
Number of Eligible
Contract Actions
Contracts Without SA
Clause
Contracts with SA
Clause %
Number of Contracts 123 7 116 94.3%
Waste
Electronics
Acquisition
Comprehensive Scorecard Summary - INL FY 2019Greenhouse Gas Inventory
Facilities
Fleet