Embed Size (px)
Citation preview

FY 2020 Results
16 February 2021

ME
TIN
VE
ST
HO
LD
ING
.CO
M
Disclaimer
This presentation and its contents are confidential and may not be reproduced, redistributed, published or passed on to any person, directly or indirectly, in whole or in part, for any purpose. If this presentation has been received in error, it must be returned immediately to Metinvest B.V. (the “Company”).
This presentation does not constitute or form part of any advertisement of securities, any offer or invitation to sell or issue or any solicitation of any offer to purchase or subscribe for, any securities of the Company or any of its subsidiaries in any jurisdiction, nor shall it or any part of it nor the fact of its presentation or distribution form the basis of, or be relied on in connection with, any contract or investment decision.
This presentation is not directed to, or intended for distribution to or use by, any person or entity that is a citizen or resident of, or located in, any locality, state, country or other jurisdiction where such distribution or use would be contrary to law or regulation or which would require any registration or licensing within such jurisdiction.
This presentation is not an offer of securities for sale in the United States. The Company’s securities may not be offered or sold in the United States except pursuant to an exemption from, or transaction not subject to, the registration requirements of the United States Securities Act of 1933, as amended.
This presentation is directed solely at persons outside the United Kingdom, or within the United Kingdom, to (i) persons with professional experience in matters relating to investments falling within Article 19(5) of the Financial Services and Markets Act 2000 (Financial Promotion) Order 2005 as amended (the “Order”), (ii) high net worth entities, and other persons to whom it may lawfully be communicated, falling within Article 49(2)(a) to (d) of the Order and (iii) persons to whom an invitation or inducement to engage in investment activity (within the meaning of section 21 of the Financial Services and Markets Act 2000) in connection with the issue or sale of any securities of the Company or any member of its group may otherwise lawfully be communicated or caused to be communicated (all such persons above being “relevant persons”). Any investment activity to which this presentation relates will only be available to and will only be engaged with relevant persons. Any person who is not a relevant person should not act or rely on this presentation.
No representation, warranty or undertaking, express or implied, is made as to, and no reliance should be placed on, the fairness, accuracy, completeness or correctness of the information or the opinions contained herein and no reliance should be placed on such information. None of the Company or any of its affiliates, advisors or representatives shall have any liability whatsoever (in negligence or otherwise) for any loss howsoever arising from any use of this presentation or its contents or otherwise arising in connection with the presentation.
To the extent available, any industry and market data contained in this presentation has come from official or third-party sources. Third party industry publications, studies and surveys generally state that the data contained therein have been obtained from sources believed to be reliable, but that there is no guarantee of the accuracy or completeness of such data. In addition, certain of the industry and market data contained in this presentation may come from the Company's own internal research and estimates based on the knowledge and experience of the Company's management in the market in which the Company operates. While the Company believes that such research and estimates are reasonable and reliable, they, and their underlying methodology and assumptions, have not been verified by any independent source for accuracy or completeness and are subject to change without notice. Accordingly, undue reliance should not be placed on any of the industry or market data contained in this presentation.
The presentation has been prepared using information available to the Company at the time of preparation of the presentation. External or other factors may have impacted on the business of the Company and the content of this presentation, since its preparation. In addition all relevant information about the Company may not be included in this presentation. The information in this presentation has not been independently verified.
This presentation contains forward-looking statements, which include all statements other than statements of historical facts, including, without limitation, any statements preceded by, followed by or including the words “targets”, “believes”, “expects”, “aims”, “intends”, “may”, “anticipates”, “would”, “could” or similar expressions or the negative thereof. Such forward-looking statements involve known and unknown risks, uncertainties and other important factors beyond the Company’s control that could cause the Company’s actual results, performance or achievements to be materially different from future results, performance or achievements expressed or implied by such forward-looking statements. Such forward-looking statements are based on numerous assumptions regarding the Company’s present and future business strategies and the environment in which it will operate in the future. These forward-looking statements speak only as at the date of this presentation. The Company expressly disclaims any obligation or undertaking to disseminate any updates or revisions to any forward-looking statements contained herein to reflect any change in its expectations with regard thereto or any change in events, conditions or circumstances on which any of such statements are based.
Individual figures (including percentages) appearing in this presentation have been rounded according to standard business practice. Figures rounded in this manner may not necessarily add up to the totals contained in a given table. However, actual values, and not the figures rounded according to standard business practice, were used in calculating the percentages indicated in the text.
2

3
ME
TIN
VE
ST
HO
LD
ING
.CO
M
Industry Overview

ME
TIN
VE
ST
HO
LD
ING
.CO
M
774 836 907980
206 205 192 169
653 666 667 576
1,633 1,707 1,767 1,725
2017 2018 2019 2020F
China Europe Rest of the world
Global steel, iron ore and coking coal marketsGlobal finished steel consumption is expected to have declined by 2.4% y-o-y in 2020, as the economic downturn caused by the the COVID-19 pandemic has affected all major economies. At the same time, China is showing another year of steel consumption growth in 2020, due to prompt virus containment and provision of economic support.
Numerous lockdowns impacted supply and demand across all commodities, and this was particularly severe in 1H 2020.
Economic stimulus measures and easing of lockdown restrictions later in 2020 helped economies to begin to recover and spurred a commodity price rally.
The price of hot-rolled coils (HRC) on FOB Black Sea basis surged by 25% q-o-q to US$582/t in 4Q 2020, which helped to bring the 2020 average to US$475/t (+2% y-o-y).
The price of 62% Fe iron ore increased by 13% q-o-q to US$133/t in 4Q 2020, bringing the 2020 average to US$109/t (+16% y-o-y). This was attributable to strong demand in China, where hot metal production rose by 4% y-o-y in 2020, as well as a slower than expected supply pick-up in Brazil.
Meanwhile, the pellet premium in Europe fell by 49% y-o-y to US$29/t in 2020, amid a 9% y-o-y drop in steel output in the region.
The hard coking coal spot price dropped by 30% y-o-y to an average of US$124/t in 2020, due to the imposition of import restrictions in China and weak demand in the rest of the world.
Steel price and production in Europe MT
Finished steel consumption
Hard coking coal priceIron ore price
41. Apparent consumption of finished steel products. 2020 data are WSA estimates as at October 20202. Europe includes the current 27 EU member states and the UK, Bosnia-Herzegovina, North Macedonia, Norway, Serbia and Turkey3. FOB Black Sea4. 62% Fe iron ore fines, CFR China5. FOB Australia
Source: World Steel Association (WSA) Source: WSA, Metal Expert
US$/t US$/t
Source: Bloomberg, WSA Source: Bloomberg, Platts
1
3
4
5
2
12
14
16
18
20
350
500
650
800
Jan
-18
Ap
r-18
Jul-1
8
Oct-
18
Jan
-19
Ap
r-19
Jul-1
9
Oct-
19
Jan
-20
Ap
r-20
Jul-2
0
Oct-
20
Steel production in Europe, MT (RHS)HRC, US$/t (LHS)
De
c-2
0
50
100
150
200
250
Jan
-18
Ap
r-18
Jul-1
8
Oct-
18
Jan
-19
Ap
r-19
Jul-1
9
Oct-
19
Jan
-20
Ap
r-20
Jul-2
0
Oct-
20
Daily spot index
De
c-2
0
De
c-2
0
, US$/t (LHS)

ME
TIN
VE
ST
HO
LD
ING
.CO
M
3.5%3.9%2.7%
3.7%2.9%
4.7%3.9%
1.5%
-1.3%
-11.4%
-3.5%
-1.5%
-12%
-10%
-8%
-6%
-4%
-2%
0%
2%
4%
6%
1Q
18
2Q
18
3Q
18
4Q
18
1Q
19
2Q
19
3Q
19
4Q
19
1Q
20
2Q
20
3Q
20
4Q
20
The Ukrainian economy demonstrated sustained growth for four straight years through 2019, amid overall macroeconomic stabilisation. This was supported by structural reforms, a rise in domestic investment, a revival in household consumption, an expansion of the agricultural sector and construction activity, as well as the improved environment on external markets.
Beginning in 1Q 2020, the Ukrainian economy has been contracting amid a decrease in industrial output and lockdown measures introduced to contain the COVID-19 pandemic. The easing of restrictive measures spurred economic recovery in 2H 2020. Nevertheless, the NBU expects real GDP to have fallen by 4.4% y-o-y in 2020, compared with growth of 3.2% y-o-y in 2019.
The NBU continued to follow an interest rate policy of inflation targeting and keeping the local currency floating:
• the consumer price index (CPI) amounted to 2.7% y-o-y in 2020, compared to 7.9% in 2019, dropping below the target of 5%
• from April 2019, the NBU began a cycle of monetary policy easing and cut its key interest rate several times from 18.0% 2019 to 6.0% from June 2020
• the hryvnia depreciated against the US dollar by 4.2% y-o-y to 26.96 in 2020 from 25.84 in 2019
In 2020, total steel output declined by 1.1% y-o-y. At the same time, apparent steel consumption fell by 2.3% y-o-y, mainly due to a 18.5% drop in machinery output and a 10.2% reduction in pipe production, partly offset by a 4.0% y-o-y growth in construction activity.
Macro and steel industry in Ukraine
5
Inflation targeting policy in placeReal GDP dynamics (y-o-y)
Key steel-consuming sectors2Steel industry
MT
Source: State Statistics Service of Ukraine, NBU Source: National Bank of Ukraine (NBU), State Statistics Service of Ukraine
Source: WSA, Metal Expert Source: State Statistics Service of Ukraine, Metal Expert
1
1. Consumption in Ukraine includes flat, long and certain semi-finished products, but excludes pipes.2. Index represents the cumulative index from the beginning of the respective year, y-o-y change.
0%
5%
10%
15%
20%
23
24
25
26
27
28
29
Jan
-18
Ap
r-18
Jul-1
8
Oct-
18
Jan
-19
Ap
r-19
Jul-1
9
Oct-
19
Jan
-20
Ap
r-20
Jul-2
0
Oct-
20
Key interest rate (RHS)US$/UAH average exchange rate (LHS)CPI y-t-d change (RHS)
21.1 20.8 20.6
5.7 5.5 5.3
2018 2019 2020
Crude steel production Rolled steel consumption
E
De
c-2
0
-40%
-30%
-20%
-10%
0%
10%
20%
30%
40%
1Q
18
2Q
18
3Q
18
4Q
18
1Q
19
2Q
19
3Q
19
4Q
19
1Q
20
2Q
20
3Q
20
4Q
20
Construction Machinery output
Pipe production
1

6
ME
TIN
VE
ST
HO
LD
ING
.CO
M
FY 2020 Highlights

ME
TIN
VE
ST
HO
LD
ING
.CO
M
Financial highlights
Total revenues decreased by 3% y-o-y to US$10,453 mn:
• metallurgical revenues fell by 6% y-o-y to US$8,200 mn
• mining revenues rose by 9% y-o-y to US$2,253 mn
Adjusted EBITDA1 increased by 82% y-o-y to US$2,204 mn:
• metallurgical EBITDA recovered to positive US$890 mn
• mining EBITDA increased by 8% y-o-y to US$1,448 mn
The segmental contribution to EBITDA2 changed y-o-y:
• metallurgical accounted for 38% (-9% in 2019)
• mining accounted for 62% (109% in 2019)
The consolidated EBITDA margin rose by 10 pp y-o-y to 21%:
• metallurgical EBITDA margin recovered to positive 11%
• mining EBITDA margin increased by 6 pp y-o-y to 46%
CAPEX totalled US$663 mn, down 37% y-o-y
Free cash flow3 reached US$916 mn in 2020, amid strong profitability and EBITDA to operating cash flow conversion
Net debt4 to EBITDA decreased to 1.0x as at 31 December 2020, down 1.3x y-o-y, driven mainly by strong EBITDA generation and a high cash balance
7
EBITDARevenues
Net debt to EBITDACAPEXUS$ mn x
US$ mn US$ mn
1. Adjusted EBITDA is calculated as earnings before income tax, finance income and costs, depreciation and amortisation, impairment of property, plant and equipment, foreign exchangegains and losses, the share of results of associates and other expenses that the management considers non-core plus the share of EBITDA of joint ventures. Adjusted EBITDA will bereferred to as EBITDA in this presentation
2. The contribution is to the gross EBITDA, before adjusting for corporate overheads and eliminations3. Free cash flow is calculated as net cash from operating activities less net cash used in investing activities4. Net debt is calculated as total debt less cash and cash equivalents
Due to rounding, numbers presented throughout this presentation may not add up precisely to the totals provided and percentages may not precisely reflect absolute figures.
81% 78%
19% 22%
10,757 10,453
2019 2020
Metallurgical Mining
-23 -134-107
8901,343
1,4481,213
2,204
2019 2020
HQ and eliminations Metallurgical Mining
49%50%
48%
47%
3%
3%
1,055
663
2019 2020
Metallurgical Mining Corporate overheads
2.3x
1.0x
0.7x
2.0x
31 Dec 2019 31 Dec 2020
Net debt to EBITDA Headroom
ME
TIN
VE
ST
HO
LD
ING
.CO
M
72109
307
403
537 543
83110
303
371
485 492
IOC Pellets Pig iron Slabs Flatproducts
Longproducts
2019 2020
Sales portfolio
8
Mining sales by regionMetallurgical sales by region
Total sales by currency in 2020Price trends, FCA basisUS$/t US$ mn
US$ mn US$ mn
1. Iron ore concentrate2. Excluding railway products
2
1
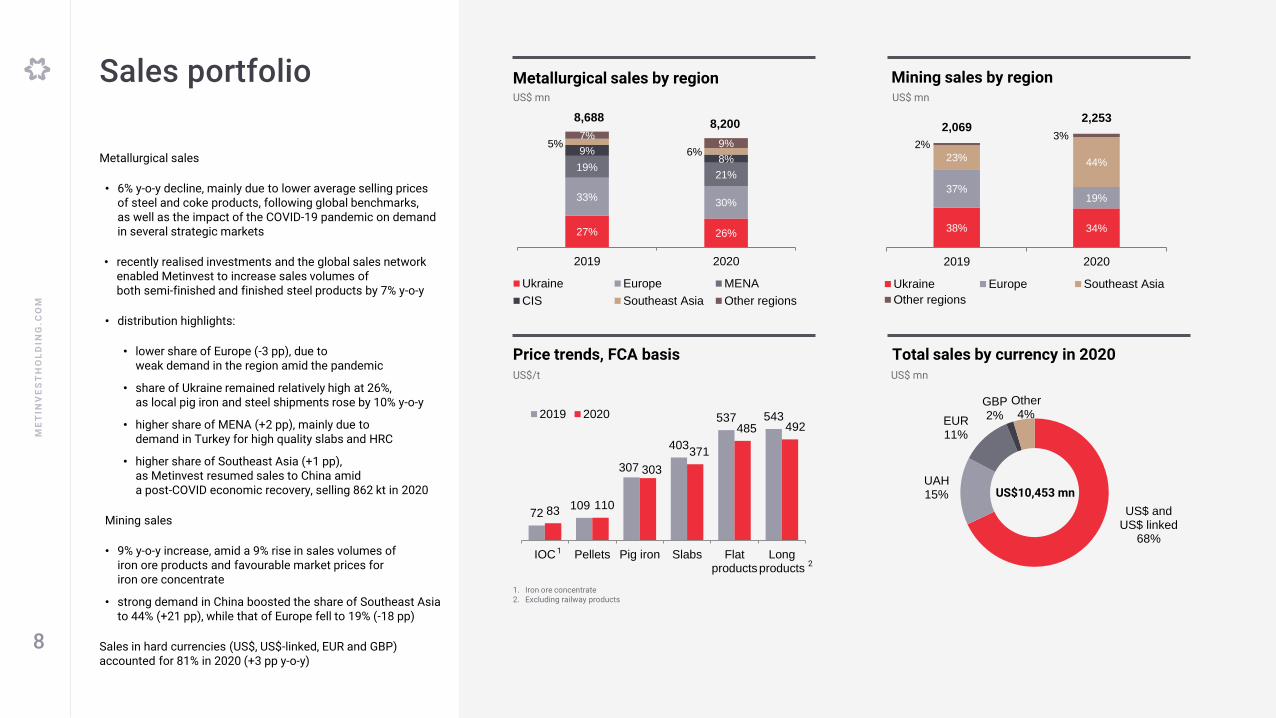
Metallurgical sales
• 6% y-o-y decline, mainly due to lower average selling prices of steel and coke products, following global benchmarks, as well as the impact of the COVID-19 pandemic on demand in several strategic markets
• recently realised investments and the global sales network enabled Metinvest to increase sales volumes of both semi-finished and finished steel products by 7% y-o-y
• distribution highlights:
• lower share of Europe (-3 pp), due to weak demand in the region amid the pandemic
• share of Ukraine remained relatively high at 26%, as local pig iron and steel shipments rose by 10% y-o-y
• higher share of MENA (+2 pp), mainly due to demand in Turkey for high quality slabs and HRC
• higher share of Southeast Asia (+1 pp),as Metinvest resumed sales to China amid a post-COVID economic recovery, selling 862 kt in 2020
Mining sales
• 9% y-o-y increase, amid a 9% rise in sales volumes of iron ore products and favourable market prices for iron ore concentrate
• strong demand in China boosted the share of Southeast Asia to 44% (+21 pp), while that of Europe fell to 19% (-18 pp)
Sales in hard currencies (US$, US$-linked, EUR and GBP) accounted for 81% in 2020 (+3 pp y-o-y)
US$10,453 mn
US$ and US$ linked
68%
UAH15%
EUR11%
GBP2%
Other4%
27% 26%
33%30%
19%21%
9%8%
5%6%
7%9%
8,6888,200
2019 2020
Ukraine Europe MENA
CIS Southeast Asia Other regions
38% 34%
37%19%
23% 44%
2%3%
2,0692,253
2019 2020
Ukraine Europe Southeast Asia
Other regions

ME
TIN
VE
ST
HO
LD
ING
.CO
M
1,213
2,204
153
448
67
348
142
103
376
28222
EBITDA2019
Sellingvolumes
Sellingprices
Resales Rawmaterials
Energy FOREX Opera-tional
improve-ments
Othercosts
JVs EBITDA2020
EBITDA
EBITDA rose by 82% y-o-y to US$2,204 mn, mainly driven by:
• a positive effect from operational improvements amid:
• improved efficiency of raw and energy materialconsumption
• increased productivity of key production equipment
• streamlined logistics
• enhanced value proposition for customers
• lower spending on raw materials, primarily as a result of decreased market prices (namely for coking coal, coke, scrap, ferroalloys), reduced consumption of seaborne coking coal, lower railway costs in the US and Ukraine, lower inventory destocking and fewer purchases of third-party coils for further processing
• improved performance of the joint ventures
• higher sales volumes
• lower expenses on energy materials, mainly amid reduced prices of natural gas (-35% y-o-y) and PCI coal (-35% y-o-y)
• 4.2% y-o-y depreciation of the hryvnia against the US dollar
• higher average iron ore concentrate selling prices
Negative impact on EBITDA was from lower selling prices for steel products, coke and coking coal concentrate, as well as weaker pellet premiums
9
EBITDA driversUS$ mn
1
1. Net of resales2. Other costs include logistics, fixed costs and other expenses; net of resales
21
Rawmaterials
63%
Sellingvolumes
and prices28%
Energy5%
Logistics4%
Other1%

ME
TIN
VE
ST
HO
LD
ING
.CO
M
274
826
2,204
38917 242
119
215
678
146
3604
Cash31 Dec2019
EBITDA Share inEBITDAof JVs
Othernon-cash
items
Workingcapitalrelease
CITpaid
Interestpaid
Purchaseof PPEand IA
OtherInvesting
CF
FinancingCF
FOREXon cash
Cash31 Dec2020
Cash flow
Operating cash flow (OCF)
• US$1,740 mn in 2020, up 2.1x y-o-y
• EBITDA to OCF conversion reached 79% in 2020, up 12 pp y-o-y
Working capital release, attributable to:
• a decrease in inventory (US$217 mn), mainly iron ore products (-838 kt), coal (-609 kt) and pig iron (-87 kt)
• an increase in trade payables (US$372 mn)
Cash conversion cycle1 shortened to 30 days in 2020, down 22 days y-o-y
Purchases of property, plant and equipment (PPE) and intangible assets (IA) totalled US$678 mn, down 24% y-o-y
Financing cash outflow, mainly attributable to:
• PXF repayment of US$178 mn, includinga US$45 prepayment in December
• net trade financing repayments of US$130 mn
• dividends paid of US$100 mn
Free cash flow2 reached US$916 mn in 2020
Cash balance improved to US$826 mnas at 31 December 2020, up 3.0x y-o-y
10
Cash flow in 2020US$ mn
Free cash flow – US$916 mn
1. Cash conversion cycle is calculated as days of inventories on hand and days of sales outstanding less days of payables2. Free cash flow is calculated as net cash from operating activities less net cash used in investing activities

ME
TIN
VE
ST
HO
LD
ING
.CO
M
Capital expenditure
In 2020:
• CAPEX was US$663 mn, down 37% y-o-y, as planned
• the Metallurgical segment accounted for 50% of total investments, up 1 pp y-o-y
• the share of strategic projects was 28%, down 4 pp y-o-y
2020 CAPEX priorities:
• ring-fenced environmental agenda: such investments totalled a record high US$204 mn in 2020, up 32% y-o-y
• Core works are completed for the largest project –the reconstruction of the Ilyich Steel’s sinter plant
• Ilyich Steel completed the construction of new gas cleaning facilities for the casthouseand stockhouse of blast furnace (BF) no. 3
• complete ongoing strategic projects:
• Ilyich Steel’s hot strip mill 1700 is progressing towards target capacity utilisation, the new down coiler was installed in 4Q 2020
• Central GOK completed the upgrade of its beneficiation facilities to produce premium quality iron ore products
• Northern GOK completed the first stage of the technical modernisation of the OK-306 roasting machine
• conducting crucial maintenance
• developing design for projects in the pipeline, driven by the Technological Strategy 2030
CAPEX by purposeUS$ mn
CAPEX by segment
CAPEX by key asset
11
US$ mn
US$ mn
49%50%
48%
47%
3%
3%
1,055
663
2019 2020
Metallurgical Mining Corporate overheads
68%72%
32%
28%
1,055
663
2019 2020
Maintenance Strategic
236
178
209
139
207
92
124
85
124
6247
23 17 14 15 8
7662
2019 2020 2019 2020 2019 2020 2019 2020 2019 2020 2019 2020 2019 2020 2019 2020 2019 2020
IlyichSteel
NorthernGOK
Azovstal InguletsGOK
CentralGOK
UnitedCoal
AvdiivkaCoke
ZaporizhiaCoke
Otherassets
Maintenance Strategic

ME
TIN
VE
ST
HO
LD
ING
.CO
M
Key strategic CAPEX projects in 2020
12
No Project Asset Description Status
1 Reconstruction of hot strip mill (HSM) 1700 Ilyich Steel
Increase HSM capacity to 2.5 mt/y; improve HRC quality by reducing the minimum thickness to 1.2 mm, increasing weight to 32 t, as well as allowing widths of 900-1600 mm; and reduce production costs
The mill was shut down for a scheduled major overhaul from 27 August to 5 November 2019. First coils were produced in November 2019. Equipment operation is approaching design parameters. The new down coiler was installed and produced first coils in November 2020
2 Construction of air separation units Ilyich SteelIncrease production of oxygen and nitrogen required for steel production
Detailed engineering has been developed. Air Liquide was selected as the key equipment supplier. Contracting process with sub-suppliers has been started. Pre-construction works have been completed. Commissioning is expected in 1H 2022
3 Sinter plant reconstruction Ilyich Steel Comply with environmental requirementsConstruction of the complex for the two-stage gas cleaning system of sintering and cooling zones for all 12 sintering machines has been completed. Auxiliary works to be finalised in 2021
4Reconstruction with new construction of the gas cleaning facilities for the casthouse and stockhouse of BFs nos. 3, 4 and 5
Ilyich Steel Comply with environmental requirementsThe project at BF no. 3 was completed in March 2020, KPIs have been fulfilled. The project at BF no. 5 started in 3Q 2020, with its completion expected in mid-2021. The next in line will be BF no. 4
5Reconstruction of gas cleaning equipment of basic oxygen furnaces (BOF)
Azovstal Comply with environmental requirementsBasic and detailed engineering and documentation is being developed. A contract for the main technological equipment supply has been signed. Launch is scheduled for 2022
6 Installation of a new plasma cutting lineMetinvest Trametal
Increase the cutting capacity by 150-190 kt/y of plates with a thickness from 4 mm to 40 mm
Basic and detailed engineering and documentation was developed. Tendering process with suppliers has been started
7 Re-equipment of beneficiation facilities Central GOKImprove mechanical properties of pellets (produce DRI-quality pellets) to penetrate new premium markets
Upgraded facilities put into pilot operation in March 2020. Test shipmentsof BF pellets were sent to customers
8 Construction of crusher and conveyor system Ingulets GOKReduce operational and capital expenditure in iron ore mining and maintain production volumes
Construction is ongoing on the Eastern conveyor line. It is expected to be completed in 2H 2021
9Construction of crusher and conveyor system at Pervomaisky quarry
Northern GOKReduce operational and capital expenditure in iron ore mining and maintain production volumes
Construction of the facility for rock transportation is ongoing. Completion is scheduled for 2H 2021
10Upgrade of OK-306 roasting machine (1st stage)
Northern GOKImprove mechanical properties of pellets to capture additional market premium
Completed in 3Q 2020
11Replacement of gas cleaning units inLurgi 552-A roasting machine
Northern GOKComply with environmental requirements and improve workplace conditions
Active construction works are ongoing. Completion is expected in 1H 2022

ME
TIN
VE
ST
HO
LD
ING
.CO
M
Debt profile Total debt as at 31 December 2020US$ mn
Total and net debt
Corporate debt maturity as at 31 December 20204
13
US$ mn
As at 31 December 2020:
• total debt was US$2,937 mn (-3% y-o-y)
• net debt was US$2,111 mn (-23% y-o-y)
• net debt to EBITDA was 1.0x (-1.3x y-o-y)
Metinvest proactively improved its debt portfolio:
• extended bond maturity profile by issuing US$333 mn 7-year paper to redeem bonds due in 2021and 38% of bonds due in 2023
• partnered with an international financial institution –the Black Sea Trade and Development Bank – and secured EUR62 mn 7-year facility
• raised more than US$70 mn of other CAPEX financing
• launched its first EUR75 mn securitisation programme
• repaid US$178 mn of the PXF facility, including a US$45 mn prepayment amid strong liquidity position
1. Total debt is calculated as the sum of bank loans, bonds, trade finance and lease liabilities2. Net debt is calculated as total debt less cash and cash equivalents3. Lease liability under the IFRS 16 and other bank loans4. Notes:
• Presented amounts of scheduled installments include principal only (without accrued interest, fees, commissions and discounts)• Bonds: US$311 mn at 7.75% pa due in 2023, EUR300 mn at 5.625% pa due in 2025 (converted at EUR/USD f/x of 1.2287), US$648 mn at 8.50% pa due in 2026,
US$333 mn at 7.65% pa due in 2027, US$500 mn at 7.75% pa due in 2029• PXF : US$228 mn at LIBOR + margin due in October 2022• Other includes ECA-covered and other facilities• Trade finance lines are mainly rollovers, so are excluded from the maturity profile chart; Lease liability under the IFRS 16 is excluded
US$ mn3
1 2
US$2,937 mn
C R E D I T R A T I N G S
S&P
B stable / rating affirmed (Jul-20)
Moody’s
B2 stable / rating upgrade (Jun-20)
Fitch
BB- negative / outlook change (Jun-20)
3,032 2,9372,758
2,111
31 Dec 2019 31 Dec 2020
Total debt Net debt
Bonds74%
PXF8%
Trade finance
9%
CAPEX financing
7%
Other2%
133 94
311 369
648
333500
203125
326
42
409
675
358
22
503
2021 2022 2023 2024 2025 2026 2027 2028 2029+
Other Bonds PXF

ME
TIN
VE
ST
HO
LD
ING
.CO
M
Environment Social Governance
Goals
Reduce environmental footprint
Introduce more efficient, energy-saving technology
Meet best global standards in this area
Proactively address critical issues
Cooperate with the communities where Metinvest operates to achieve sustainable improvements in social conditions
Maintain a close dialogue with local stakeholders
Achieve zero incidents
Develop the corporate governance system to be among the most transparent international companies and serve the interests of all stakeholders as thoroughly as possible
Results in2020
Around US$455 mn was spent on environmental safety1 in 2020, up 18% y-o-y
Progress on key projects to reduce environmental footprint:
• reconstruction of the gas cleaning system at Ilyich Steel’s sinter plant – expected up to 90% reduction in dust emissions and up to 46% reduction in SOx emissions
• reconstruction of the gas cleaning systems for basic oxygen furnaces nos. 1 and 2 at Azovstal – expected 70% reduction in dust emissions
• replacement of gas cleaning units of Lurgi 552-A roasting machine at Northern GOK – expected 40% reduction in dust emissions
• systematic extensive maintenance of coke oven chambers at all coke production facilities to keep dust and gaseous emissions at well below permitted levels
Around 69,000 employees as at 31 December 2020
US$105 mn was spent on health and safety in 2020, up 14% y-o-y
LTIFR was 0.529 in 2020 – the lowest rate in Metinvest’s history
Metinvest rejected tax holidays offered by Ukrainian government and paid US$612 mn of taxes globally in 2020, incl. CIT
US$15 mn was invested to support communities in 2020, of which around US$6 mn was spent to help fight COVID-19
In response to the COVID-19 pandemic:
• all administrative employees switched to remote working, enhanced health protocols introduced at all assets
• the Group purchased 18,000 COVID-19 express tests for44 medical institutions and financed the delivery of humanitarian supplies from China
• Metinvest constructed 240 additional oxygen supply points at four healthcare facilities in Mariupol
The Supervisory Board includes three independent members, who are deemed independent within the meaning of the Dutch Corporate Governance Code 2016
Avetik Chalabyan joined the Supervisory Board and became a member of the Strategy and Investments Committee. Mr. Chalabyan held various positions at McKinsey & Company (2001-2020), including Senior Partner (2013-2020) leading the global Metallurgical practice
Metinvest published the Sustainability Report 2019, which was prepared in accordance with the Global Reporting Initiative (GRI) and, for the first time ever, the guidelines of the SustainabilityAccounting Standards Board (SASB) were considered
In June 2020, Sustainalytics assigned Metinvest an ESG Risk Ratings score of 32.0 on a scale between 0 (lowest risk) and 100 (highest risk). While the risk of experiencing material financial impacts driven by ESG factors was assessed as high due to the steel industry’s significant exposure, Sustainalytics recognisedthe Group’s management of material ESG issues as strong.
As of 2020, Metinvest received MSCI ESG Rating of ‘B’4. (on a scale of AAA-CCC) in the MSCI ESG Ratings assessment. The rating remained unchanged y-o-y.
14
ESG
Note: FY2020 data on this slide are preliminary and may change upon completion of internal verification procedures1. Including both capital and operational improvements2. The lost-time injury frequency rate (LTIFR) is the number of lost-time incidents per 1 million man-hours.3. The fatality frequency rate (FFR) is the number of job-related fatalities per 1 million man-hours.4. Disclaimer statement. The use by Metinvest B.V. of any MSCI ESG Research LLC or its affiliates (“MSCI”) data, and the use of MSCI logos, trademarks, service marks or index names
herein, do not constitute a sponsorship, endorsement, recommendation, or promotion of Metinvest B.V. by MSCI. MSCI services and data are the property of MSCI or its information providers, and are provided ‘as-is’ and without warranty. MSCI names and logos are trademarks or service marks of MSCI.
Spending on the environment1
US$ mn
LTIFR2 and FFR3
32.0
92155
204
171
229
251263
384455
2018 2019 2020
CAPEX OPEX & Other
0.8590.790
0.529
0.099 0.053 0.044
2018 2019 2020
LTIFR FFR

15
ME
TIN
VE
ST
HO
LD
ING
.CO
M
Segmental Review

ME
TIN
VE
ST
HO
LD
ING
.CO
M
Mining operations
Overall iron ore concentrate output grew by 5% y-o-y, as a result of:
• the Group’s mining assets boosting ore production
• operational improvements
• Central GOK processing third-party ore
Iron ore self-sufficiency of around 299%1 in 2020
Merchant iron ore concentrate2 output surgedby 32% y-o-y, due to greater overall concentrate output and changes in the order book at Northern GOK
Merchant pellet2 output dropped by 29% y-o-y
• the share of high-grade pellets was 46%, up 16 pp y-o-y, primarily as a result of the launch of production of concentrate with 70.5% Fe content and pellets with 67.5% Fe content that is used in DRI technology after the upgrade of beneficiation facilities at Central GOK
• output of pellets with 67.5% Fe content reached 1,004 kt in 2020
16
Coking coal concentrate output3 at United Coal in the US fell by 3% y-o-y , as operations were suspended at one of the blocks of the Affinity mine in late March and the Huffman mine in February
Coking coal self-sufficiency was 46%4 in 2020
Direct supplies of Russian coal resumed in March 2020
Additional long-term supplies are secured following the acquisition of 24.77% in the biggest coking coal asset in Ukraine
Iron ore concentrate productionkt
Output of iron ore products by Fe % Coking coal productionktkt
1. Iron ore self-sufficiency is calculated as actual iron ore concentrateproduction divided by actual consumption of iron ore products to produce hotmetal in the Metallurgical segment
2. Merchant iron ore product output figures exclude intragroup sales andconsumption. The production data for merchant iron ore concentrate in 2019and 1Q 2020 was revised to exclude sales between the mining assets toproduce pellets.
3. Excluding production from raw coal purchased from third parties4. Coal self-sufficiency is calculated as actual coal concentrate production
divided by actual consumption of coal concentrate to produce coke requiredfor production of hot metal in the Metallurgical segment, and coalconsumption for PCI is included in the calculation
Concentrate Pellets
43% 42%
15% 16%
42% 42%
29,02830,501
2019 2020
Ingulets GOK Central GOK Northern GOK
100% 100%
2,961 2,883
2019 2020
United Coal
70%
78%
30%
22%10,685
14,155
2019 2020
<67% ≥67%
70%
54%
30%
46%
6,951
4,920
2019 2020
<65% ≥65%

ME
TIN
VE
ST
HO
LD
ING
.CO
M
Sales
• external sales increased by 9% y-o-y, driven by higher selling prices of iron ore concentrate,a 9% y-o-y rise in sales volumes of iron ore products and strong demand in China
• share of pellets in the iron ore sales mix fell to 26% in 2020 (-14 pp y-o-y), amid lower demand and premiums globally, while that of merchant concentrate rose to 74%
• the top five customers of the segment accounted for 48%of segmental sales (62% in 2019)
• overall, 61% of iron ore volumes were sold underannual contracts (71% in 2019)
EBITDA
• EBITDA rose by 8% y-o-y, amid higher segmental top line, a positive effect of operational improvements, as well as improved contribution from the Mining JV
• the contribution to gross EBITDA1 totalled 62%, down 47 pp y-o-y
• the EBITDA margin was 46%, up 6 pp y-o-y
The segment’s CAPEX decreased by 39% y-o-y to US$313 mn, primarily due to lower maintenance investments at iron ore and coking coal producers
Mining segment financials
1. The contribution is to the gross EBITDA, before adjusting for corporate overheads and eliminations17
kt
Sales by product Sales by productUS$ mn
US$ mn 2020 2019 CHANGE
Sales (total) 3,155 3,390 -7%
Sales (external) 2,253 2,069 9%
% of Group total 22% 19% +3 pp
EBITDA 1,448 1,343 8%
% of Group total1 62% 109% -47 pp
Margin 46% 40% +6 pp
CAPEX 313 510 -39%
10,69714,220
7,050
5,051
752 759
17,74719,271
2019 2020
Iron ore concentrate Pellets
Coking coal concentrate
44%
62%
44%
29%7%
4%5%5%
2,0692,253
2019 2020
Iron ore concentrate PelletsCoking coal concentrate Other products

ME
TIN
VE
ST
HO
LD
ING
.CO
M
44% 45% 53% 51%
56% 55% 47% 49%
7,9288,475
7,5788,268
2019 2020 2019 2020
Hot metal Crude steel
Azovstal Ilyich Steel
Metallurgical operations
Hot metal output increased by 7% y-o-y, amid:
• a 9% increase at Azovstal amid the launch of BF no. 3 after a major overhaul and upgrade in June 2019 and a planned major overhaul of BF no. 2 in 4Q 2019
• a 5% rise at Ilyich Steel due to a lower base in the prior year, attributable to the shutdown of BFs nos. 3 and 5 for planned overhauls in 2019
Crude steel output climbed by 9% y-o-y as a result of:
• a 4% increase at Azovstal amid greater hot metal production
• a 14% rise at Ilyich Steel due to the reallocation of hot metal to steelmaking
Merchant pig iron and steel product mix highlights:
• higher share of slabs (+2 pp) and lower share of pig iron (-3 pp), due to a 17% rise in output of the former amid greater demand
• unchanged share of flat products due to higher HRC production after the revamp of HSM 1700 at Ilyich Steel and steady market demand for that product, which fully compensated for the drop in plate output
• higher share of long products (+1 pp), amid an increase in orders for rebar
• stable shares of pipes and rails
18
Dnipro Coke has been a subsidiary of the Group since March 2020
Coke1 output grew by 3% y-o-y, following the consolidation of Dnipro Coke’s production from 2Q 2020 (383 kt)
Coke self-sufficiency stood at 160%2 in 2020
In 3Q 2020, Metinvest increased its stake in Zaporizhia Refractories, a producer of refractory products and materials in Ukraine, to 50.79%, following which it became a subsidiary of the Group
Hot metal and crude steel productionkt
Merchant pig iron and steel product output Coke productionktkt
1. Dry blast furnace coke output. Starting in 2Q 2020, coke production datainclude production volumes of Dnipro Coke after the Group increased itsstake in the asset to 73.01%
2. Coke self-sufficiency is calculated as actual coke production divided by actualconsumption of coke to produce hot metal in the Metallurgical segment
15% 12%
22% 24%
53% 53%
8% 9%2% 2%8,755 9,147
2019 2020
Pig iron Slabs Flat products
Long products Pipes and rails
25% 24%
57% 50%
18%18%
8%
4,667 4,808
2019 2020
Azovstal Avdiivka Coke
Zaporizhia Coke Dnipro Coke

ME
TIN
VE
ST
HO
LD
ING
.CO
M
4,278 3,953
4,545 5,335
5,5926,160
1,882 2,145
14,41515,448
2019 2020
Coke Steel and pig iron resales
Steel and pig iron excl. HVA HVA
Sales
• external sales declined by 6% y-o-y, mainly due to decreased steel and coke selling prices following global benchmarks
• the share of HVA products1 in the sales mix volumes, excluding resales, was 43% in 2020, down 5 pp y-o-y
• the top five customers accounted for 16% of the segment’s revenues, unchanged y-o-y
• almost all steel volumes were sold on the spot market
EBITDA
• EBITDA recovered to positive US$890 mn, driven primarily by lower expenses for raw and energy materials amid lower purchase prices and improved consumption efficiency, greater sales volumes of pig iron and steel products, as well as higher contribution fromthe Metallurgical JV
• contribution to gross EBITDA2 reached 38%, up 47 pp y-o-y
• EBITDA margin rose by 12 pp y-o-y to 11%,as a result of a lower cost base
The segment’s CAPEX declined by 36% y-o-y to US$332 mn, following the completion of major strategic projects at Azovstal and Ilyich Steel
Metallurgical segment financials
1. HVA products include thick plates, cold-rolled flat products, hot-dip galvanised sheets and coils, structural sections, rails and pipes2. The contribution is to the gross EBITDA, before adjusting for corporate overheads and eliminations
19
kt
Sales by product Sales by productUS$ mn
Metinvest’s volumes
US$ mn 2020 2019 CHANGE
Sales (total) 8,270 8,771 -6%
Sales (external) 8,200 8,688 -6%
% of Group total 78% 81% -3 pp
EBITDA 890 -107 +997
% of Group total2 38% -9% +47 pp
Margin 11% -1% +12 pp
CAPEX 332 519 -36%
8% 10%10% 11%6% 7%
51% 49%
10% 11%
7%6%
9%6%
8,6888,200
2019 2020
Pig iron Slabs Square billets
Flat products Long products Coke
Other products

ME
TIN
VE
ST
HO
LD
ING
.CO
M
Investor relations contacts
Yana Kalmykova
+380 44 251 83 36
Andrey Makar
+380 44 251 83 37
metinvestholding.com
20