Embed Size (px)
Citation preview

1
nexi
February 12th, 2020
FY 2019 Preliminary Results

2
Disclaimer
This Presentation may contain written and oral “forward-looking statements”, which includes all statements that do not relate solely to historical or current facts and which aretherefore inherently uncertain. All forward-looking statements rely on a number of assumptions, expectations, projections and provisional data concerning future events and are subjectto a number of uncertainties and other factors, many of which are outside the control of Nexi Group (the “Company”). There are a variety of factors that may cause actual results andperformance to be materially different from the explicit or implicit contents of any forward-looking statements and thus, such forward-looking statements are not a reliable indicator offuture performance. The Company undertakes no obligation to publicly update or revise any forward-looking statements, whether as a result of new information, future events orotherwise, except as may be required by applicable law. The information and opinions contained in this Presentation are provided as at the date hereof and are subject to changewithout notice. Neither this Presentation nor any part of it nor the fact of its distribution may form the basis of, or be relied on or in connection with, any contract or investmentdecision.
The information, statements and opinions contained in this Presentation are for information purposes only and do not constitute a public offer under any applicable legislation or anoffer to sell or solicitation of an offer to purchase or subscribe for securities or financial instruments or any advice or recommendation with respect to such securities or other financialinstruments. None of the securities referred to herein have been, or will be, registered under the U.S. Securities Act of 1933, as amended, or the securities laws of any state or otherjurisdiction of the United States or in Australia, Canada or Japan or any other jurisdiction where such an offer or solicitation would be unlawful (the “Other Countries”), and there will beno public offer of any such securities in the United States. This Presentation does not constitute or form a part of any offer or solicitation to purchase or subscribe for securities in theUnited States or the Other Countries.
Pursuant the consolidated law on financial intermediation of 24 February 1998 (article 154-bis, paragraph 2) Enrico Marchini, in his capacity as manager responsible for the preparationof the Company’s financial reports declares that the accounting information contained in this Presentation reflects Nexi Group’s documented results, financial accounts and accountingrecords.
Neither the Company nor any of its representatives, directors or employees accept any liability whatsoever in connection with this Presentation or any of its contents or in relation toany loss arising from its use or from any reliance placed upon it.
3
Executive Summary
2019 highlights
Strong focus on financial delivery• EBITDA +18.5% y/y growth, at 502.5 €M in FY 2019
• Revenues +7.1% y/y underlying growth excluding zero-margin hardware reselling contracts. +5.7% y/y reported growthat 984.1 €M in FY 2019
• Improved Net financial Debt/EBITDA at 2.9x from 3.5x post IPO
Continued progress on key business initiatives• Merchant Services and Solutions (49% of Revenues): continued growth on SmartPOS proposition, release of new omni-
channel capabilities, acceleration of omni-acceptance, further acceleration on E-Commerce
• Cards and Digital Payments (39% of Revenues): continued growth of International Debit, YAP millennials payments appand CVM up/cross selling activities
• Digital Banking Solutions (12% of Revenues): underlying FY growth thanks to new propositions acceleration, further stepinto Open Banking leadership thanks to the tender win for extending CBI Globe capabilities and use cases
• Cost initiatives and integration synergies contributing to -4.9% y/y reported costs reduction, -2.9% y/y excluding zero-margin hardware reselling contracts, despite continued investments
• Transformation costs below EBITDA -60% y/y
• Continued focus on investments in Technology and Innovation: Capex at 167 €M, 17% of Revenues
FY 2019 performance better than IPO guidance
2020 target growth in line with IPO medium/long term guidance, starting from a stronger 2019

4
Healthy Revenue growth and strong EBITDA performance
Margin
250.4 265.7
930.6984.1
4Q18 1 FY18 14Q19 FY19
6.1%
5.7%
115.1134.1
424.1
502.5
FY194Q194Q18 1 FY18 1
16.4%
18.5%
Underlying performance(excl. zero-margin HW reselling contracts)
Note: (1) Proforma for Group reorganization and OASI / Bassilichi non core disposal
Net Revenues (€M) EBITDA (€M)
46%
7.1%
7.7%
51%
5
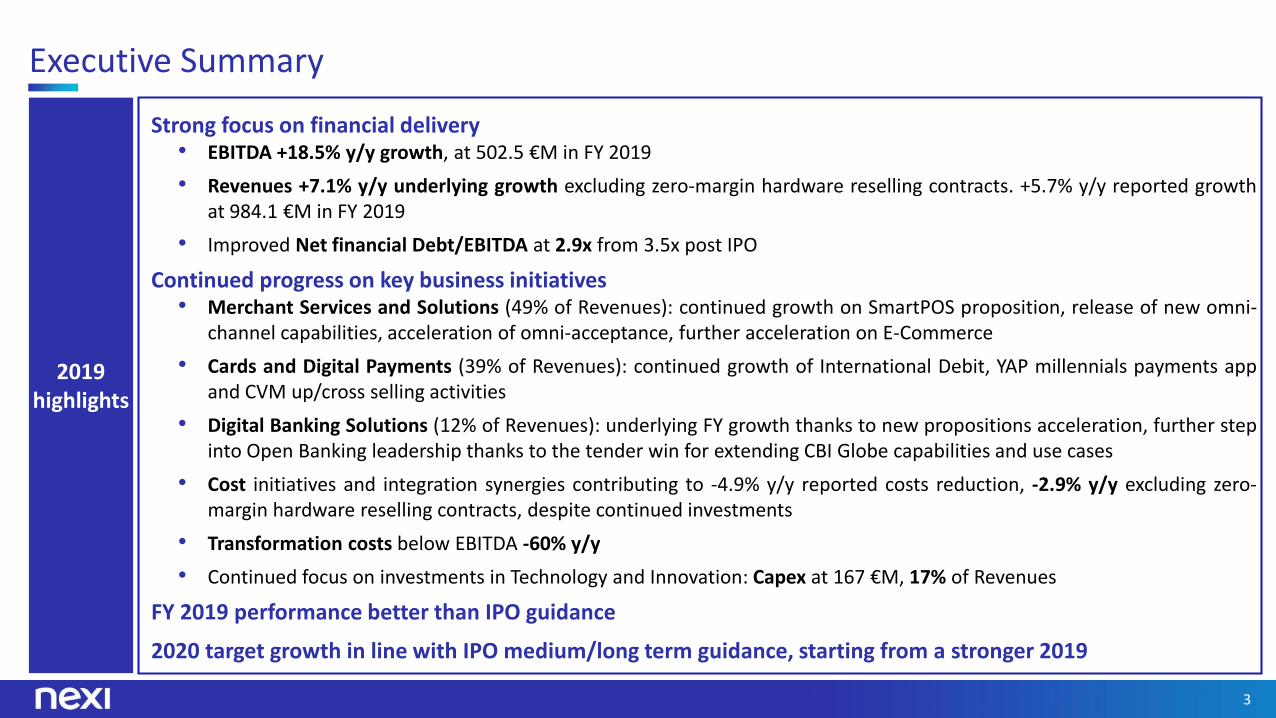
Merchant Services & Solutions: continued strong growth
Merchant Services & Solutions
Note: (1) Contribution to total FY Group Revenues. (2) 2018 pro-forma figures.
49%1
249.1 259.1
FY18 2 FY19
4.0%
3,1933,548
FY18 2 FY19
11.1%
120.7 131.4
448.2479.0
4Q18 2 4Q19 FY19FY18 2
8.9%
6.9%
Net Revenues (€M) Key HighlightsManaged Transactions (#M)
Value of Managed Transactions (€B)
Managed transactions sustained byInternational Schemes growth(+20.6% y/y) and growing adoptionon lower tickets and day-by-dayusage
Value of managed transactionssustained by International Schemesgrowth (+10.2% y/y), partiallyoffset by reduction in certaindomestic debit low value/marginservices
Accelerated E-Commerce growth in4Q19 (+22% y/y transaction value),leading to +19% y/y transactionvalue in FY19
International Schemes
International Schemes
+20.6%
+10.2%
8.1%
7.7%
Underlying performance(excl. zero-margin HW reselling contracts)

6
Merchant Services & Solutions: key business update
Nexi Business Merchant app, data/business intelligence service, achieving >220k enrolled merchants (+100k from December 2018), with positive customer feedback (4.6 rating on Apple store)
Overall penetration on addressable merchant base at 42%, with best practice at ~80%
Be the payment services provider of
choice for every Italian merchant,
in partnership with our partner banks
Continued progress on SmartPOS proposition, with frontbook penetration up to 40% during CVM-supported campaigns on active banks
Strong interest across all merchant segments, from SME to Large Merchants, and industries
Growing success of SmartPOS Cassa1, also due to new regulation on electronic tax data transmission, with frontbook penetration at 24% in 4Q on SmartPOS sales
SmartPOS
Release of new omni-channel capabilities including cross border and most advanced solutions
Further investment on dedicated team, with focus on vertical industry experts and solution engineers
Acceleration of advanced vertical solutions on Large Merchants (insurance, grocery, mobility,..); ~50% offlagship initiatives on International Brands
Large MerchantsOmni-Channel
Continued growth supported by physical customer base cross-selling (with full cross-channel contractual enablement already in place), partnerships with developers and software vendors, large omnichannelmerchants and Public Administration
E-Commerce
Acceleration of multiple payment rails acceptance (meal vouchers and Asian schemes)
Roll-out of new PagoBancomat capabilities (c-less, mobile payments enabling) with over 50% upgraded POS acceptance in 1 year
Omni-Acceptance
Nexi Business data app
Note: (1) Including electronic cash register

7
Cards & Digital Payments: continued strong growth
Cards & Digital
Payments
196.8 204.0
FY19FY18 2
3.7%
2,357 2,592
FY18 2 FY19
9.9%
94.1 101.4
360.6387.4
4Q18 2 FY18 14Q19 FY19
7.7%
7.4%
39%1
Net Revenues (€M) Key HighlightsManaged Transactions (#M)
Value of Managed Transactions (€B)
Managed transactions sustained byInternational Schemes growth(+19.1% y/y) and growing adoptionon lower tickets and day-by-dayusage
Value of managed transactionssustained by International Schemes(+10.2% y/y) with strong Debitgrowth (+30% y/y), partially offsetby reduction in certain domesticdebit low value/margin services
+19.1%International Schemes
+10.2%International Schemes
Note: (1) Contribution to total FY Group Revenues. (2) 2018 pro-forma figures.

8
Cards & Digital Payments: key business update
Be the Italian banks’ partner of choice, offering a full portfolio with
best-in-class Cards and Digital
Payments services for customers
Credit
New full corporate proposition including virtual account B2B and lodge solutions now fully launched.Growing spontaneous interest from corporates across multiple industrial sectors
New premium credit cards with leading capabilities (fully digital experience, world elite program,…)
Debit Continued growth of International Debit (+30% y/y transaction value) with 34 banks now active
National Debit upgrade delivered: c-less and tokenization, mobile features under development
Customer Value Management
and Value-Added Services
Further development and roll out of distinctive capabilities supported by internal data scientist team to drive usage and up/cross selling to higher value products: ~200 available campaigns, 90 banks engaged
Strong usage elasticity with ioVINCO instant lottery: +13p.p. faster growth in managed transactions (active versus not active) and +34% y/y active users
Redesign of premium loyalty program with +30% y/y subscribers
YAP millennials payments app
Continued progress on YAP, with ~750k enrolled clients to date (up from 105k at the end of 2018). Positive customer feedback, with >50 Net Promoter Score and 4.8 rating on Apple store
“Bank-connect” solution to engage banks in go-to-market; early implementations now live
Digital All Banks now active with mobile payments. Wearable experience now extended to Fitbit and Garmin
Supporting large banks on their digital properties (API gateway integrations and whitelabel projects) whilecontinuing to push for the adoption of Nexi digital properties (Nexi Pay app and Nexi portals)

9
35.6 32.9
121.7117.7
4Q18 2 FY194Q19 FY18 2
-7.6%
-3.3%
Digital Banking Solutions: accelerated underlying performance
Digital Banking
Solutions
12%1
Net Revenues (€M) Key Highlights
Return to growth confirmed, withFY19 Net revenues at +1.8% y/y
Growth acceleration supported byroll out of new higher value andmore advanced self bankingproducts/platform and DigitalCorporate Banking
Early contribution from OpenBanking solutions deployment
Note: (1) Contribution to total FY Group Revenues. (2) 2018 pro-forma figures.
1.8%
7.9%
Underlying performance(excl. zero-margin HW reselling contracts)

10
Provide state-of-the-art innovative
solutions to support Bank customers
digitalization with E2E outsourcing
models
Digital Banking Solutions: key business update
Self-banking Continued roll out of new higher value advanced self banking products/ solutions
Continued growth of advanced ATMs installations, in the context of Banks’ branches transformationplans
Instant Payments Continued progress on new banks/financial institutions onboarding and rollout
Digital Corporate Banking
Rolling out of new advanced platform with key partner banks. Live with new innovative corporatemobile app
Continued organic growth of installed workstations on active partner banks
Open Banking
280+ banks/financial institutions live (over 78% of Italian market) and 80+ third parties alreadyconnected to PSD2 Open Banking gateway
Won banking system tender for the new CBI Globe TPP Gateway capabilities aggregating andharmonizing other Italian and European gateways and enabling new fintech services from banks andthird parties
Innovative value added services for financial institutions and corporates under development, alsoleveraging partnerships with fintech leading vertical players
11
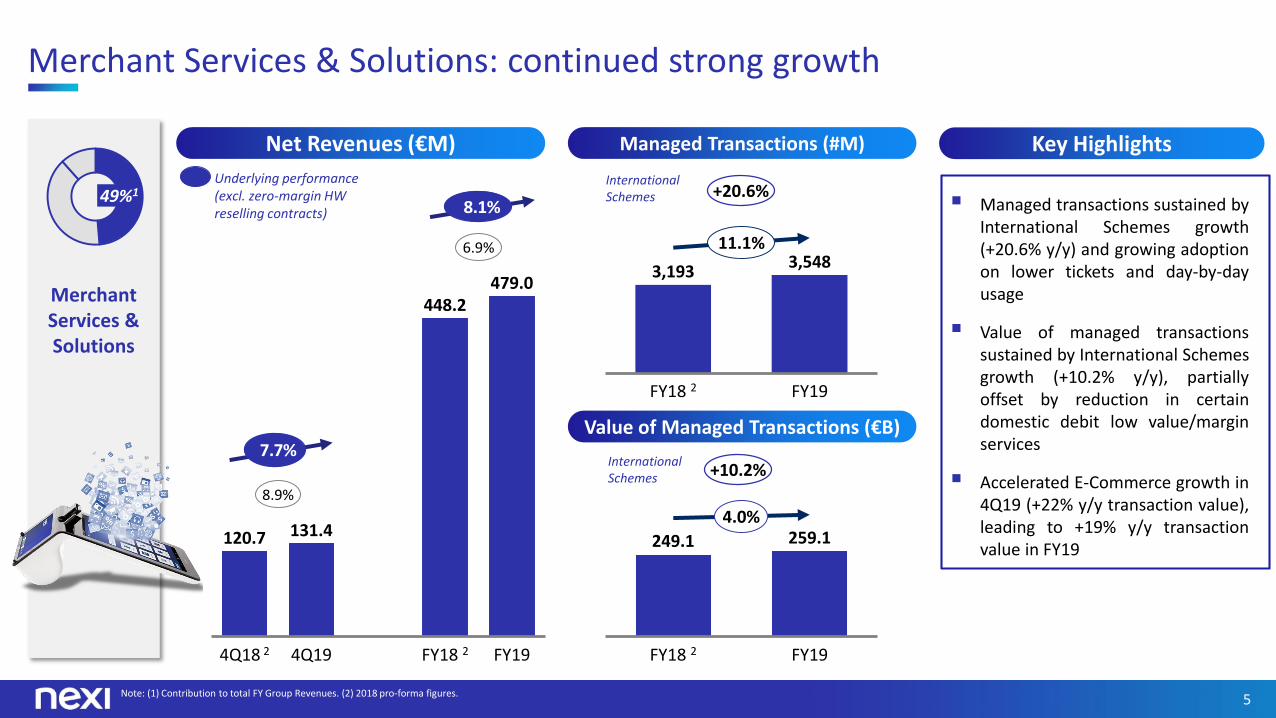
Costs: strong reduction despite continuous investment in development initiatives
94.3 86.9
351.2315.0
41.0 44.7
155.3166.6
4Q18 1 4Q19 FY18 1 FY19
135.3 131.6
506.4481.6
-2.7%
-4.9%Personnel Costs
Operating Costs
Note: (1) 2018 pro-forma figures.
Y/Y
Q/Q
Key HighlightsTotal Costs (€M)
Strong decrease in operating costs drivenby:
• continuous saving initiatives
• synergies from the integration ofacquired businesses slightly ahead ofplan
• early impacts from implementation of ITstrategy
• IFRS 16 impact ~13.6 €M in FY 2019
Continued investment in peoplecapabilities
-2.9%
7.3%
-10.3%
-0.1%
9.1%
-7.9%
Underlying performance(excl. zero-margin HW reselling contracts)
12
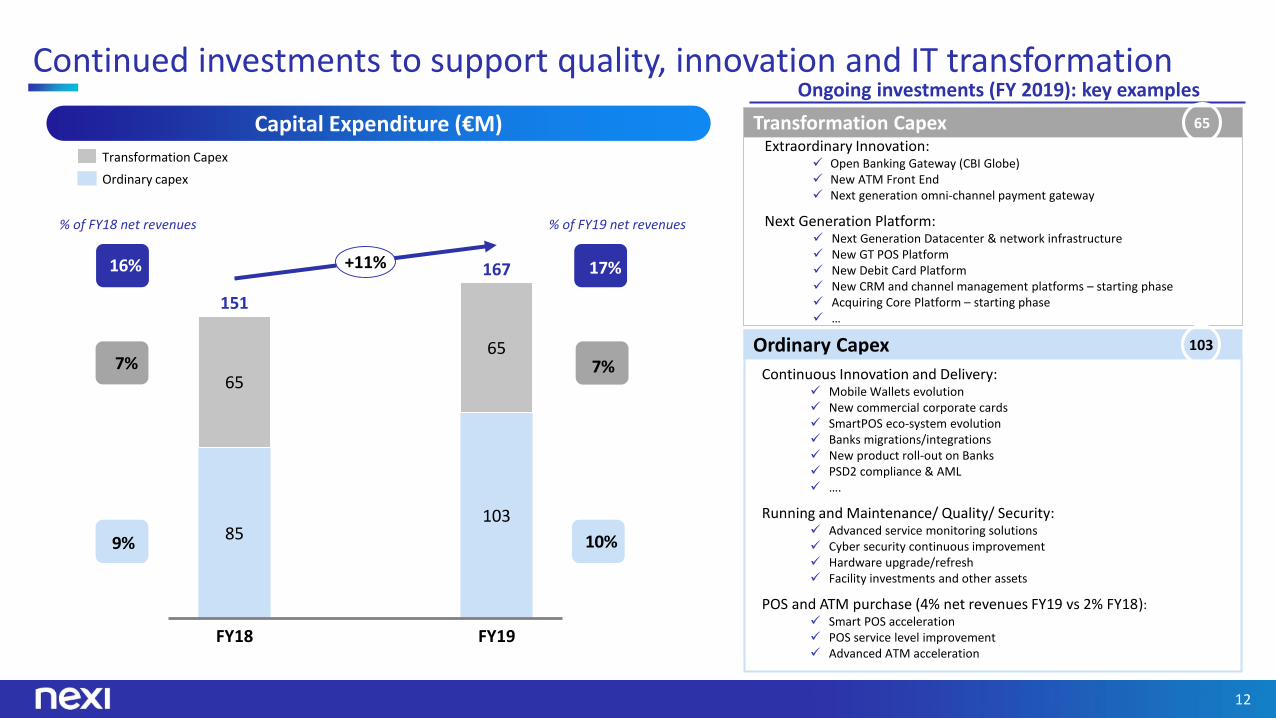
Continued investments to support quality, innovation and IT transformation
85103
65
65
FY18 FY19
151
167+11%
Transformation Capex
Ordinary capex
Capital Expenditure (€M)
% of FY18 net revenues
16%
9%
7%
% of FY19 net revenues
17%
10%
7%
Ongoing investments (FY 2019): key examples
Transformation Capex
Ordinary Capex 103
65
Extraordinary Innovation: Open Banking Gateway (CBI Globe) New ATM Front End Next generation omni-channel payment gateway
Next Generation Platform: Next Generation Datacenter & network infrastructure New GT POS Platform New Debit Card Platform New CRM and channel management platforms – starting phase Acquiring Core Platform – starting phase …
Continuous Innovation and Delivery: Mobile Wallets evolution New commercial corporate cards SmartPOS eco-system evolution Banks migrations/integrations New product roll-out on Banks PSD2 compliance & AML ….
Running and Maintenance/ Quality/ Security: Advanced service monitoring solutions Cyber security continuous improvement Hardware upgrade/refresh Facility investments and other assets
POS and ATM purchase (4% net revenues FY19 vs 2% FY18): Smart POS acceleration POS service level improvement Advanced ATM acceleration
13
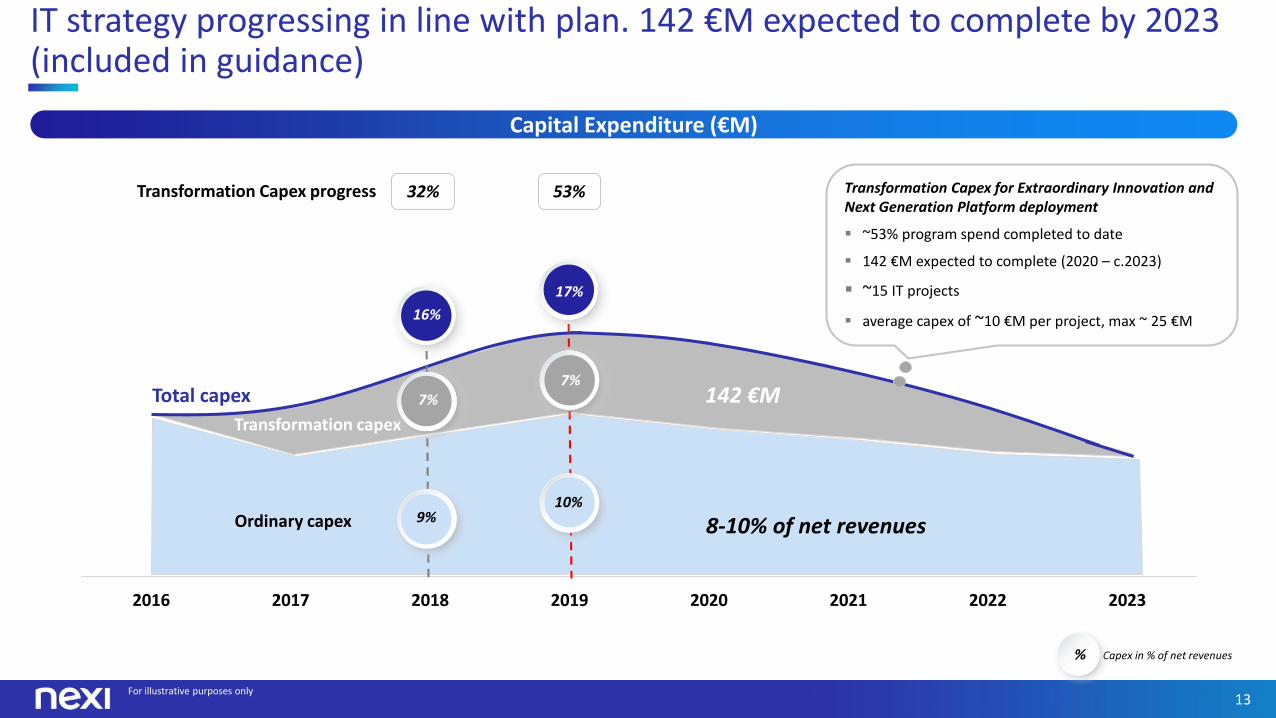
IT strategy progressing in line with plan. 142 €M expected to complete by 2023 (included in guidance)
Capex in % of net revenues
For illustrative purposes only
Capital Expenditure (€M)
%
Transformation Capex progress 32% 53%
0%
5%
10%
15%
20%
40
60
80
100
120
140
160
2016 2017 2018 2019 2020 2021 2022 2023
Total capex
8-10% of net revenuesOrdinary capex
Transformation capex
142 €M
16%
7%
9%
17%
7%
10%
Transformation Capex for Extraordinary Innovation and Next Generation Platform deployment
~53% program spend completed to date
142 €M expected to complete (2020 – c.2023)
~15 IT projects
average capex of ~10 €M per project, max ~ 25 €M
14
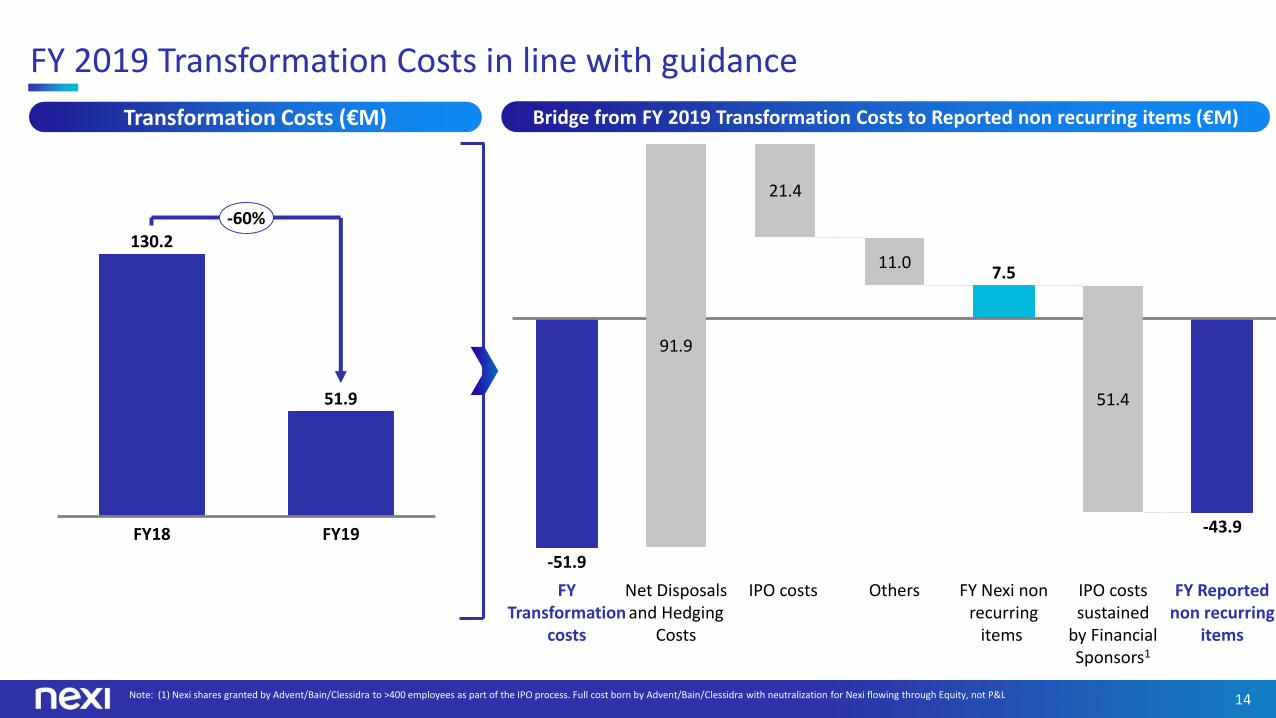
-51.9
7.5
-43.9
21.4
11.0
OthersNet Disposals and Hedging
Costs
FY Transformation
costs
FY Nexi non recurring
items
91.9
IPO costs
51.4
IPO costs sustained
by Financial Sponsors1
FY Reported non recurring
items
FY 2019 Transformation Costs in line with guidance
130.2
51.9
FY19FY18
-60%
Note: (1) Nexi shares granted by Advent/Bain/Clessidra to >400 employees as part of the IPO process. Full cost born by Advent/Bain/Clessidra with neutralization for Nexi flowing through Equity, not P&L
Transformation Costs (€M) Bridge from FY 2019 Transformation Costs to Reported non recurring items (€M)

15
159.9
42.6
34.5
38.0
44.8
Interest & other Financial Expense - Reported FY19
Non-cash amortized Costs2
Bond buy back premium
Δ Interest Expense (vs. current debt
structure) and Other
Interest & other Financial Expense -Normalized FY19 3
Cost of debt reduced to 1.9% from 3.8% post reorganization in July 2018. Extraordinary events impacted 2019 Reported Interest Expenses
Note: (1) Weighted average pre-tax cash coupon. (2) One-off impact related to the amortized costs bring-down following the 2.6 €B Senior Secured Notes redemptions in 2019 (amortized costs previously capitalized). (3) Normalized yearly interest expenses based on current capital structure, in place since 21st October 2019, excluding extraordinary items
Reported and Normalized Interest Expenses FY 2019 (€M)
117.3 €M gross of taxes89.2 €M net of taxes
1.9%
Weighted average coupon1

16
Normalized Net Profit growing 19% Y/Y
502.5
130.0
222.7
157.8
159.9
43.937.2
117.3
43.9
105.8
FY19 EBITDA Reported Net Profit
11.0
D&A Interest Expense
Non recurring items
Cash Taxes & Minorities
D&A customer contracts
Non-recurring items
Δ Interest Expenses
Δ Taxes Normalized Net Profit
€M
51.9 €M Transformation Costs
-91.9 €M Net disposals and Hedging Costs
83.9 €M Others
Y/Y performance
+19%
17
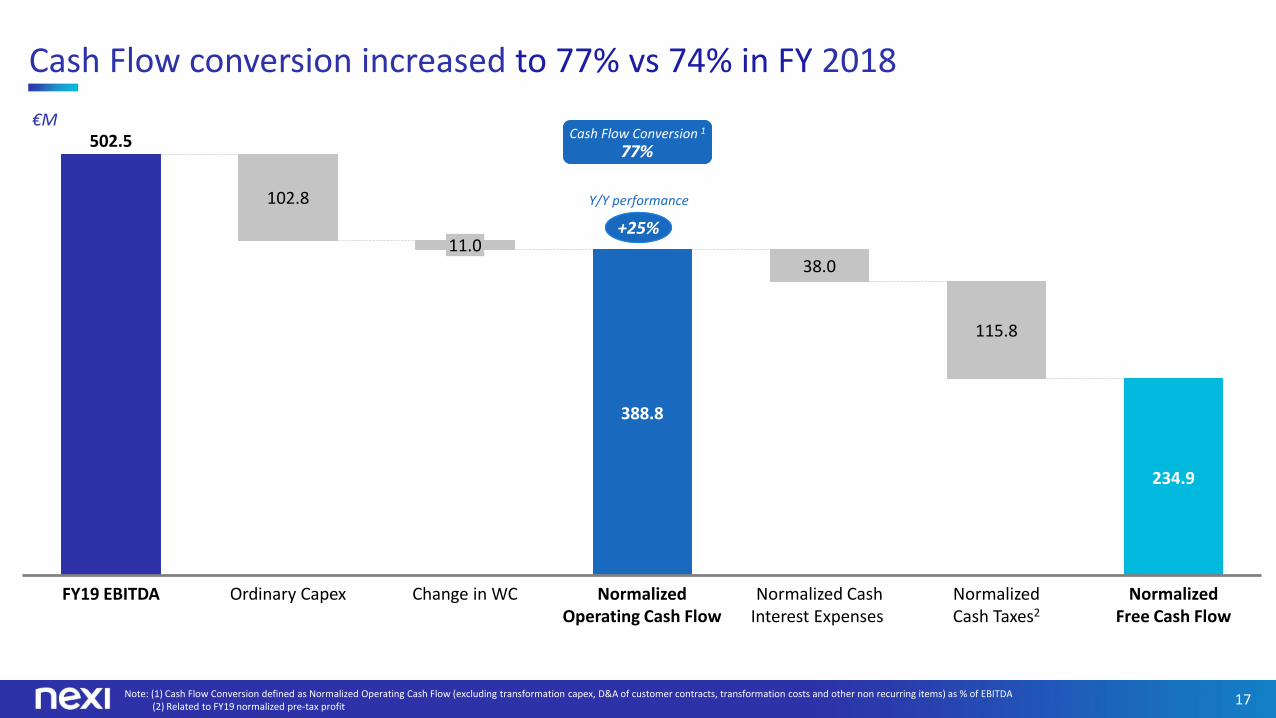
Cash Flow conversion increased to 77% vs 74% in FY 2018
502.5
388.8
234.9
102.8
38.0
115.8
11.0
Normalized Cash Interest Expenses
FY19 EBITDA Normalized Operating Cash Flow
Ordinary Capex Change in WC Normalized Free Cash Flow
Normalized Cash Taxes2
€M
Note: (1) Cash Flow Conversion defined as Normalized Operating Cash Flow (excluding transformation capex, D&A of customer contracts, transformation costs and other non recurring items) as % of EBITDA(2) Related to FY19 normalized pre-tax profit
+25%
Y/Y performance
Cash Flow Conversion 1
77%

18
Net Financial Debt / EBITDA at 2.9x at year-end
Note: (1) Visa preferred shares held by the Company, VISA Europe deferred compensation (until Q1 2019) and Oasi post closing adjustments. (2) S&P Global Ratings affirmed both Nexi BB- ratings and the positive outlook. Moody’s Investors Service changed the outlook to stable from positive, while affirming the previous corporate family and instrument ratings at Ba3. Fitch Rating placed both Nexi LT issuer default rating of 'BB' and the debt rating of 'BB' on rating watch negative
2.9x
LTM 2Q19FY18 LTM 3Q19 FY19
5.8x
3.3x 3.1x
EBITDA (€M) 424 463
Net Financial Debt (€M)
Net Financial Debt / EBITDA (€M)
484
825 €M 1.75% Senior Unsecured Notes (dueOct2024) issued in October to repay 825 €M4.125% Senior Secured Notes (due Nov2023)
Indebtedness now fully unsecured Weighted average pre-tax cash coupon per
annum reduced from 3.1% post IPO to 1.9%(3.8% post reorganization)
Nexi’s credit ratings unchanged followingannouncement of ISP’s merchant acquiring businessacquisition2
Current Debt structure: 1 €B Term Loan due 2024 825 €M Fixed-Rate Note due 2024 Other residual debt (mainly IFRS 16)
Nexi also benefits of an undrawn 350 €M RevolvingCredit Facility, committed to 2024, that furthersupports its liquidity profile
Key Highlights
503
Dec 18 Dec 19
Gross Financial Debt 2,605 1,840
Cash (41) (248)
Cash Equivalents 1 (110) (123)
Net Financial Debt 2,454 1,470
19
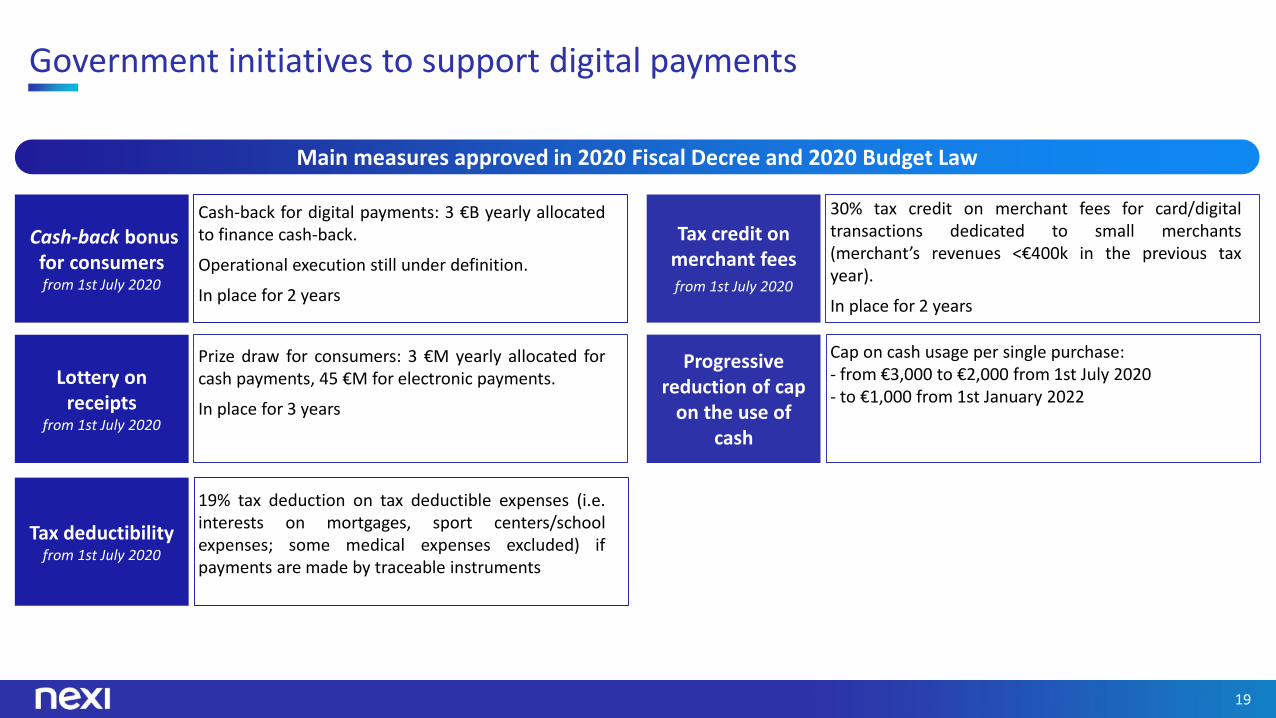
Government initiatives to support digital payments
Main measures approved in 2020 Fiscal Decree and 2020 Budget Law
Progressive reduction of cap
on the use of cash
Cap on cash usage per single purchase:- from €3,000 to €2,000 from 1st July 2020- to €1,000 from 1st January 2022
Lottery on receipts
from 1st July 2020
Prize draw for consumers: 3 €M yearly allocated forcash payments, 45 €M for electronic payments.
In place for 3 years
Tax credit on merchant feesfrom 1st July 2020
30% tax credit on merchant fees for card/digitaltransactions dedicated to small merchants(merchant’s revenues <€400k in the previous taxyear).
In place for 2 years
Cash-back bonus for consumersfrom 1st July 2020
Cash-back for digital payments: 3 €B yearly allocatedto finance cash-back.
Operational execution still under definition.
In place for 2 years
Tax deductibilityfrom 1st July 2020
19% tax deduction on tax deductible expenses (i.e.interests on mortgages, sport centers/schoolexpenses; some medical expenses excluded) ifpayments are made by traceable instruments
20
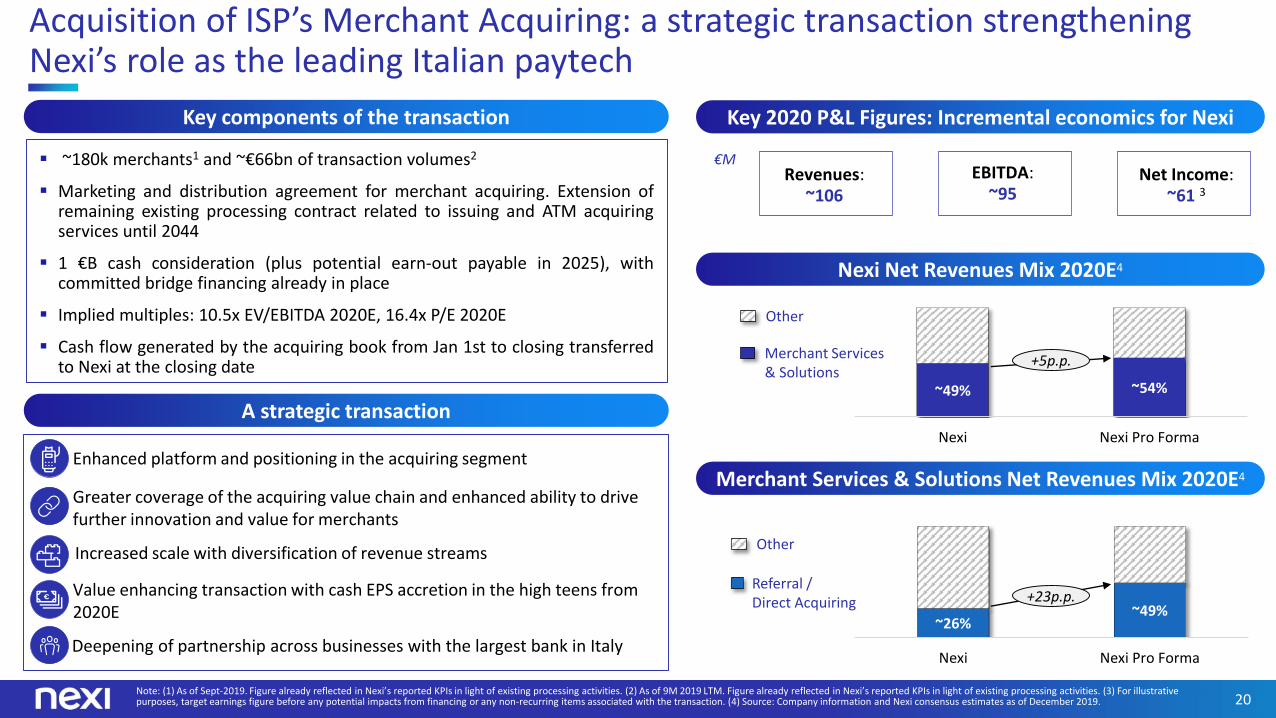
Acquisition of ISP’s Merchant Acquiring: a strategic transaction strengthening Nexi’s role as the leading Italian paytech
Key components of the transaction
Note: (1) As of Sept-2019. Figure already reflected in Nexi’s reported KPIs in light of existing processing activities. (2) As of 9M 2019 LTM. Figure already reflected in Nexi’s reported KPIs in light of existing processing activities. (3) For illustrative purposes, target earnings figure before any potential impacts from financing or any non-recurring items associated with the transaction. (4) Source: Company information and Nexi consensus estimates as of December 2019.
Revenues: ~106
Key 2020 P&L Figures: Incremental economics for Nexi
€M
A strategic transaction
Merchant Services & Solutions
Other
~49% ~54%
Nexi Nexi Pro Forma
+5p.p.
Nexi Net Revenues Mix 2020E4
~26%~49%
Nexi Nexi Pro Forma
Referral / Direct Acquiring
Other
+23p.p.
Merchant Services & Solutions Net Revenues Mix 2020E4
EBITDA: ~95
Net Income: ~61 3
Deepening of partnership across businesses with the largest bank in Italy
Enhanced platform and positioning in the acquiring segment
Greater coverage of the acquiring value chain and enhanced ability to drive further innovation and value for merchants
Increased scale with diversification of revenue streams
Value enhancing transaction with cash EPS accretion in the high teens from 2020E
~180k merchants1 and ~€66bn of transaction volumes2
Marketing and distribution agreement for merchant acquiring. Extension ofremaining existing processing contract related to issuing and ATM acquiringservices until 2044
1 €B cash consideration (plus potential earn-out payable in 2025), withcommitted bridge financing already in place
Implied multiples: 10.5x EV/EBITDA 2020E, 16.4x P/E 2020E
Cash flow generated by the acquiring book from Jan 1st to closing transferredto Nexi at the closing date

21
Reiterating IPO guidance growth starting from a stronger 2019
Net Revenues
EBITDA
• 5-7% annual net revenue growth over medium term, targeting higher end of the range
Capex
Capital Structure &
Capital Allocation
• 13-16% annual EBITDA growth over medium term
• Continued strong operating leverage
• 8-10% ordinary capex as % of net revenues over long term
• Transformation capex on top of ordinary capex of 142 €M cumulative (2020 – c.2023)
• Total capex to trend towards ordinary capex as % of net revenues over medium to long term
• Organic de-leveraging with target net debt of ~2.0-2.5x EBITDA over medium to long term
• Invest in organic growth; potentially consider accretive and strategically compelling M&A
• Progressive moderate dividend policy, targeting pay-out ratio of 20-30% of distributable profits in medium to long term
Non-recurring Items • Rapid further decrease of non-recurring items affecting reported EBITDA
ISP transactionnot included
22Note: (1) Operating Cash Flow excluding transformation capex, D&A of customer contracts, transformation costs and other non recurring items. (2) Cash Flow Conversion defined as Normalized Operating Cash Flow as % of EBITDA. (3) Normalized yearly interest expenses based on new capital structure in place since 21st October 2019.
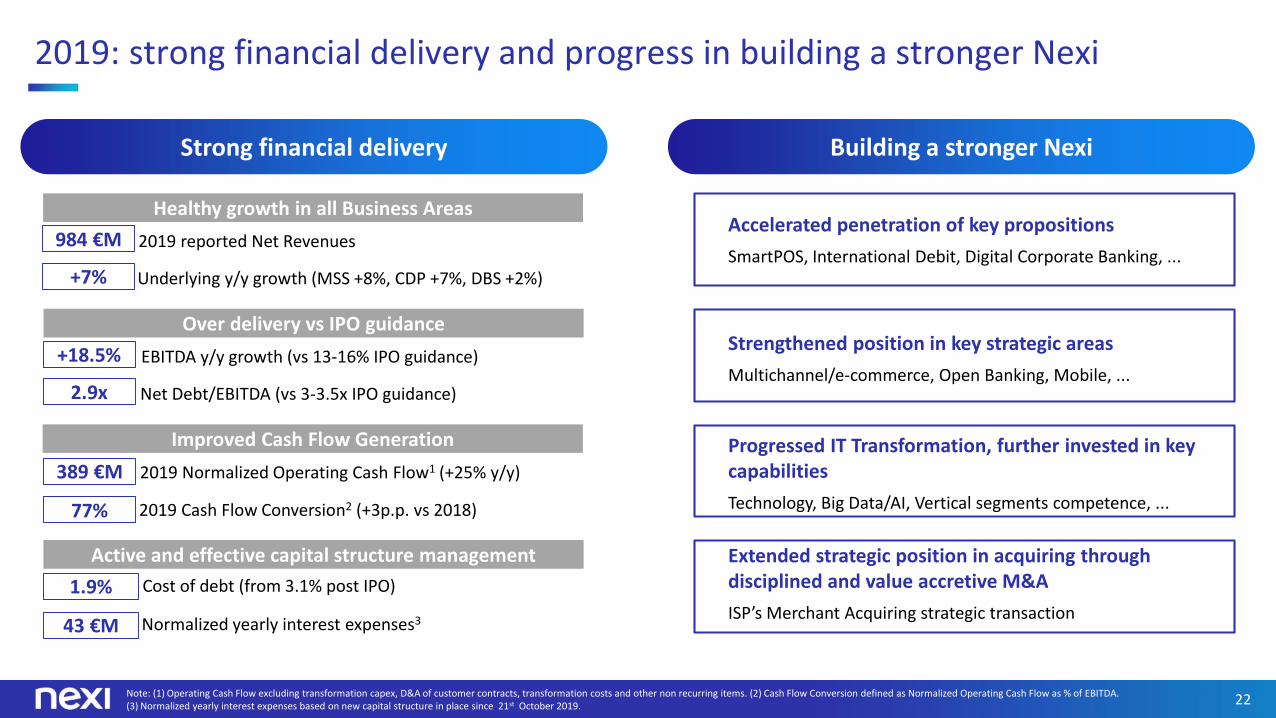
Strong financial delivery
Over delivery vs IPO guidance
2.9x
+18.5%
Net Debt/EBITDA (vs 3-3.5x IPO guidance)
EBITDA y/y growth (vs 13-16% IPO guidance)
Active and effective capital structure management
43 €M
1.9%
Normalized yearly interest expenses3
Cost of debt (from 3.1% post IPO)
Improved Cash Flow Generation
77%
389 €M
2019 Cash Flow Conversion2 (+3p.p. vs 2018)
2019 Normalized Operating Cash Flow1 (+25% y/y)
2019: strong financial delivery and progress in building a stronger Nexi
Healthy growth in all Business Areas
+7%
984 €M
Underlying y/y growth (MSS +8%, CDP +7%, DBS +2%)
2019 reported Net Revenues
Building a stronger Nexi
Accelerated penetration of key propositions
SmartPOS, International Debit, Digital Corporate Banking, ...
Strengthened position in key strategic areas
Multichannel/e-commerce, Open Banking, Mobile, ...
Progressed IT Transformation, further invested in key capabilities
Technology, Big Data/AI, Vertical segments competence, ...
Extended strategic position in acquiring through disciplined and value accretive M&A
ISP’s Merchant Acquiring strategic transaction

23
Q&A

24
Annex
25
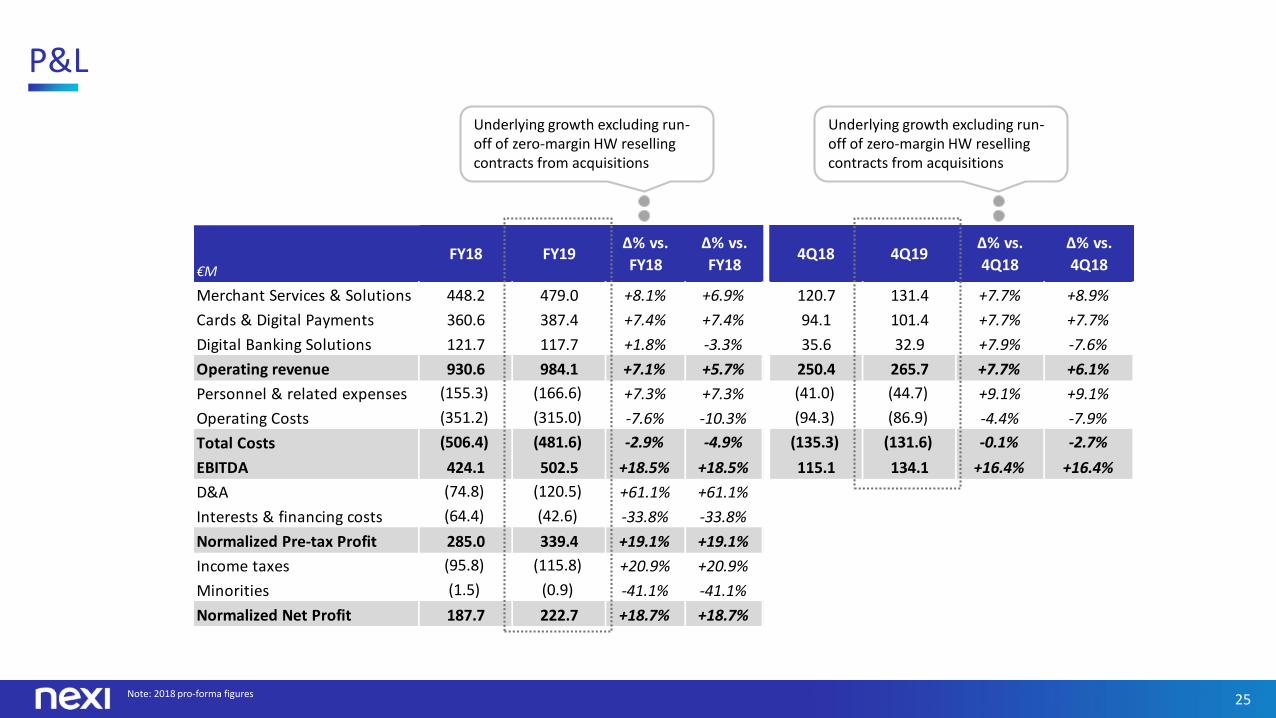
€MFY18 FY19
Δ% vs.
FY18
Δ% vs.
FY184Q18 4Q19
Δ% vs.
4Q18
Δ% vs.
4Q18
Merchant Services & Solutions 448.2 479.0 +8.1% +6.9% 120.7 131.4 +7.7% +8.9%
Cards & Digital Payments 360.6 387.4 +7.4% +7.4% 94.1 101.4 +7.7% +7.7%
Digital Banking Solutions 121.7 117.7 +1.8% -3.3% 35.6 32.9 +7.9% -7.6%
Operating revenue 930.6 984.1 +7.1% +5.7% 250.4 265.7 +7.7% +6.1%
Personnel & related expenses (155.3) (166.6) +7.3% +7.3% (41.0) (44.7) +9.1% +9.1%
Operating Costs (351.2) (315.0) -7.6% -10.3% (94.3) (86.9) -4.4% -7.9%
Total Costs (506.4) (481.6) -2.9% -4.9% (135.3) (131.6) -0.1% -2.7%
EBITDA 424.1 502.5 +18.5% +18.5% 115.1 134.1 +16.4% +16.4%
D&A (74.8) (120.5) +61.1% +61.1%
Interests & financing costs (64.4) (42.6) -33.8% -33.8%
Normalized Pre-tax Profit 285.0 339.4 +19.1% +19.1%
Income taxes (95.8) (115.8) +20.9% +20.9%
Minorities (1.5) (0.9) -41.1% -41.1%
Normalized Net Profit 187.7 222.7 +18.7% +18.7%
P&L
Note: 2018 pro-forma figures
Underlying growth excluding run-off of zero-margin HW reselling contracts from acquisitions
Underlying growth excluding run-off of zero-margin HW reselling contracts from acquisitions

26
Reported P&L vs Normalized P&L
Note: (1) Transformation costs included in Reported Non recurring items
Delta
D&A: D&A customer contracts
Interests & financing costs: coherent with the new debt structure (detailed bridge on slide 15)
Non recurring items: detailed bridge on slide 14
Income taxes: Partecipation Exemption regime on Oasidisposal and favourable tax ruling (DTA) on certain corporate transactions
€M
Reported
FY19Delta
Normalized
FY19
Merchant Services & Solutions 479.0 479.0
Cards & Digital Payments 387.4 387.4
Digital Banking Solutions 117.7 117.7
Revenues 984.1 984.1
Personnel & related expenses (166.6) (166.6)
Operating Costs (315.0) (315.0)
Total Costs (481.6) (481.6)
EBITDA 502.5 502.5
D&A (157.8) 37.2 (120.5)
Interests & financing costs (159.9) 117.3 (42.6)
Non recurring items (43.9) 43.9 -
Pre-tax Profit 140.9 198.5 339.4
Income taxes (10.1) (105.8) (115.8)
Minorities (0.9) (0.9)
Net Profit 130.0 92.7 222.7
Transformation costs 1 (51.9) (51.9)

27
ISP transaction: impacts on guidance (as per December 19th presentation)
Net Revenues
Reiterated
Increased scale and resilience, with further diversification
EBITDA Reiterated
Marginal fixed cost impact
Capex
Improved
Marginal incremental ordinary Capex on larger revenue baseLimited extraordinary integration Capex
Increased cash conversion
Capital Structure
Reiterated
Strong organic deleveraging
Improved cash EPS
and
cash flow conversion