Embed Size (px)
Citation preview
historic downtown
museum club
tourist homeall day café
route 66 circa 1950
museum of northern arizona
City of Flagstaff Comprehensive Annual Financial Report
Fiscal Year Ended June 30, 2018
18 Flagstaff and the Mother Road: Living Americanaon Historic Route 66
Comprehensive Annual Financial Report
For Fiscal Year Ended June 30, 2018
City of Flagstaff, Arizona
Prepared By: Management Services Division
Finance and Budget Section
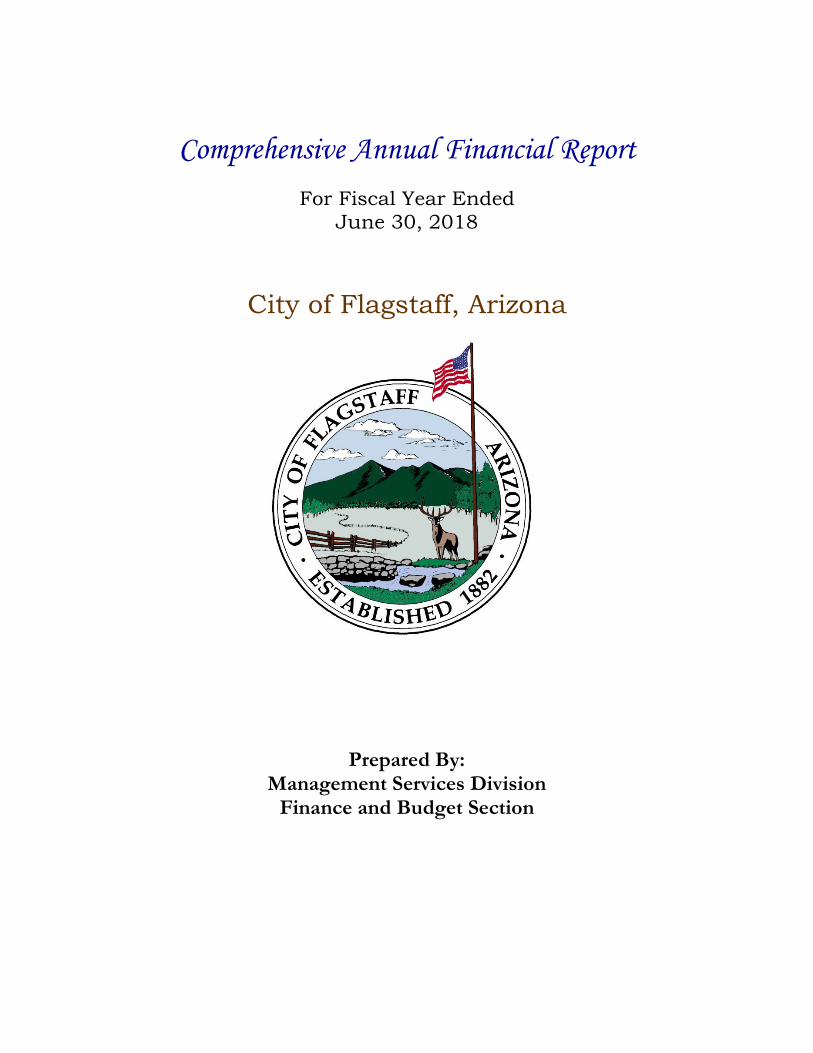
City of Flagstaff Comprehensive Annual Financial Report
For the Fiscal Year Ended June 30, 2018
Table of Contents Page
Introductory Section Transmittal Letter........................................................................................................................................... iii GFOA Certificate of Achievement .............................................................................................................. xii Organizational Chart ................................................................................................................................... xiii List of Elected and Appointed Officials .................................................................................................... xiv
Financial Section Independent Auditor’s Report ....................................................................................................................... 1
Management’s Discussion and Analysis ......................................................................................... 5
Basic Financial Statements Government-wide Financial Statements:
Statement of Net Position ............................................................................................................... 19 Statement of Activities .................................................................................................................... 20
Fund Financial Statements: Balance Sheet – Governmental Funds ........................................................................................... 22 Reconciliation of the Balance Sheet to the Statement of Net Position – Governmental Activities ............................................................................................................. 25 Statement of Revenues, Expenditures and Changes in Fund Balances – Governmental Funds ................................................................................................................... 26 Reconciliation of the Statement of Revenues, Expenditures and Changes in Fund Balances of Governmental Funds to the Statement of Activities ........................... 28 General Fund - Statement of Revenues, Expenditures and Changes in Fund Balances – Budget and Actual ......................................................................................... 30 Transportation Fund - Statement of Revenues, Expenditures and Changes in Fund Balances – Budget and Actual ......................................................................................... 31 Statement of Net Position – Proprietary Funds ........................................................................... 32 Statement of Revenues, Expenses and Changes in Fund Net Position – Proprietary Funds .................................................................................... 34 Statement of Cash Flows – Proprietary Funds ............................................................................ 36
Notes to the Financial Statements ................................................................................................................ 40
Required Supplementary Information Schedule of Proportionate Share of the Net Pension Liability................................................................. 96 Schedule of Changes in Net Pension Liability and Related Ratios ......................................................... 97 Schedule of Changes in Net OPEB Asset, Liability and Related Ratios ................................................. 99 Schedule of the City’s Pension Contributions .......................................................................................... 101 Notes to the Required Supplementary Information ................................................................................ 102
Combining Statements Non-Major Funds – Other Governmental Funds .................................................................................... 103 Combining Statements and Schedules:
Combining Balance Sheet – Non-major Governmental Funds ................................................ 104 Combining Statement of Revenues, Expenditures and Changes in
Fund Balances – Non-major Governmental Funds ................................................................... 106 Non-Major Funds – Other Proprietary Funds ......................................................................................... 108
i
Combining Statements and Schedules: Combining Statement of Net Position – Non-major Proprietary ............................................ 109
Combining Statement of Revenues, Expenses and Changes in Fund Net Position – Non-major Proprietary Fund ................................................................... 110
Combining Statement of Cash Flows Non-major Proprietary Fund ....................................................................................................... 111
Supplemental Information Capital Assets Used in the Operations of Governmental Funds:
Schedule by Function and Activity ............................................................................................. 114 Schedule of Changes by Function and Activity ........................................................................ 116
Budgetary Comparison Schedules – Non-major Governmental Funds Library Fund................................................................................................................................... 117 Highway User Revenue Fund ...................................................................................................... 118 Bed, Board and Beverage Fund ................................................................................................... 119 Housing and Community Services Fund ................................................................................... 120 Metropolitan Planning Organization Fund ............................................................................... 121 Parking Fund .................................................................................................................................. 122 General Obligation Bond Fund .................................................................................................... 123 Secondary Property Tax Revenue Fund ..................................................................................... 124 Special Assessment Bond Fund ................................................................................................... 125 Capital Projects Bond Construction Fund .................................................................................. 126
Financial Data Submission Schedules Net Position Accounts ................................................................................................................... 127 Revenue, Expenses and Changes in Fund Net Position Accounts ......................................... 129 Revenue, Expenses and Changes in Fund Net Position Accounts- Public Housing - Consolidated ................................................................................................ 132
Statistical Section Net Position by Component ....................................................................................................................... 136 Changes in Net Position .............................................................................................................................. 138 Fund Balances, Governmental Funds ....................................................................................................... 140 Changes in Fund Balances, Governmental Funds ................................................................................... 141 Tax Revenue by Source, Governmental Funds ........................................................................................ 142 Intergovernmental Revenue by Source, Governmental Funds ............................................................. 143 Full Cash Value of Taxable Property ......................................................................................................... 144 City Tax Revenue for Major Categories .................................................................................................... 145 Direct and Overlapping Property Tax Rates ............................................................................................ 146 Principal Property Tax Payers .................................................................................................................... 147 Property Tax Levies and Collections ......................................................................................................... 148 Direct and Overlapping Sales Tax Rates ................................................................................................... 149 Ratios of Outstanding Debt by Type ......................................................................................................... 150 Ratios of General Bonded Debt Outstanding ........................................................................................... 151 Direct and Overlapping Governmental Activities Debt ......................................................................... 152 Legal Debt Margin Information ................................................................................................................. 154 Pledged Revenue Coverage ........................................................................................................................ 156 Demographic and Economic Statistics ...................................................................................................... 162 Principal Employers .................................................................................................................................... 163 Full-time Equivalent City Government by Function/Program ............................................................. 164 Operating Indicators by Function/Program ............................................................................................ 165 Capital Asset Statistics by Function/Program ......................................................................................... 167 Insurance Summary ..................................................................................................................................... 168
ii

December 20, 2018
To the Honorable Mayor, City Council and Citizens of the City of Flagstaff, Arizona:
I am pleased to submit the Comprehensive Annual Financial Report for the City of Flagstaff, Arizona for the fiscal year ended June 30, 2018, as required by Article VI, Section 5 of the City Charter. This report is published to fulfill that requirement for the fiscal year ended June 30, 2018.
Management is responsible for establishing and maintaining an internal control structure designed to ensure that the assets of the City of Flagstaff are protected from loss, theft or misuse and that adequate accounting data is compiled to allow for the preparation of the basic financial statements in conformity with generally accepted accounting principles (GAAP). Because the cost of internal controls should not outweigh their benefits, the City of Flagstaff’s comprehensive framework of internal controls have been designed to provide reasonable, rather than absolute assurance that the financial statements will be free from material misstatement. As management, we assert that, to the best of our knowledge and belief, this financial report is complete and reliable in all material respects.
CliftonLarsonAllen, LLP, a firm of licensed certified public accountants, have issued an unmodified (“clean”) opinion on the City of Flagstaff’s financial statements for the year ended June 30, 2018. The independent auditors’ report is located at the front of the financial section of this report.
Management’s discussion and analysis (MD&A) immediately follows the independent auditors’ report and provides a narrative introduction, overview and analysis of the basic financial statements. The MD&A complements this letter of transmittal and should be read in conjunction with it.
City of Flagstaff Profile
Flagstaff is located in Coconino County, Arizona at the intersection of Interstate 17 and Interstate 40. Flagstaff is the largest city in Northern Arizona and is the regional center and county seat for Coconino County, the second largest county in the 48 contiguous states. The 2010 United States Census showed a population of 65,870. The Arizona Department of Economic Security estimates the population as of July 1, 2017 at 71,961. The City of Flagstaff became a town in 1894, incorporated as a city in 1928 and its boundaries currently encompass an area of approximately 66 square miles. Flagstaff is nestled at the base of the San Francisco Peaks and is surrounded by one of the largest ponderosa pine forests on earth. Flagstaff drew its name from a very tall pine tree made into a flagpole in 1876 to celebrate our nation’s centennial. At nearly 7,000 feet, Flagstaff is one of the highest elevation cities in the United States.
The City of Flagstaff operates under a council-manager form of government as provided by its Charter. The Mayor is elected at large on a non-partisan ballot for a two-year term and six City
City of Flagstaff
iii
Council members are elected at large on a non-partisan ballot for four-year terms. The City Council appoints the City Manager, who has full responsibility for carrying out City Council policies and administering City operations. The City Manager, in turn, appoints City employees and division heads under service procedures specified by Charter.
The City of Flagstaff provides a full range of services including General Government, Police and Fire Protection, Environmental Services, Transportation, Library, Parks and Recreation, Airport, Water, Wastewater, Housing Authority and Stormwater services.
The annual budget serves as the foundation for the City of Flagstaff’s financial planning and control. The City Council formally adopts the budget and legally allocates, or appropriates, available monies for all funds and entities related to the City of Flagstaff. All of these funds and entities are included in the basic financial statements. The City Manager submits to the City Council each spring a proposed budget for the fiscal year commencing the following July 1. The budget includes proposed expenditures and the means of financing them. A public hearing is held prior to the budget’s final adoption and tax levy in order to obtain taxpayer comments. The budget is legally enacted through the passage of a resolution and the tax levy is adopted by an ordinance. The resolution sets the limit for expenditures during the fiscal year. The legal level of control for the budget is the division level. Additional expenditures may be authorized for unanticipated and/or inadequately budgeted events threatening the public’s health or safety as prescribed in Article 9, Section 20 of the State Constitution.
Local Economy
Employment Flagstaff is a governmental, educational, transportation, cultural and commercial center. Government is one of the largest employment sectors. Major private employers in the Flagstaff area include Flagstaff Medical Center, W. L. Gore and Associates, Walmart, Grand Canyon Railways and Nestle Purina PetCare. Major public employers in the Flagstaff area include Northern Arizona University, Flagstaff Unified School District, Coconino County, City of Flagstaff, U.S. Forest Service and Coconino Community College. Northern Arizona University, the largest employer in the City, has a major economic impact annually. It is the home of over 31,000 students in their 158 degree programs. In addition, NAU’s year-round use of its campus facilities draws in tourists from throughout the world. Campus activities include a multitude of music, educational and athletic camps, as well as a broad variety of conferences from across the nation. Tourism is also has a large employment sector. Based on a 2017-2018 tourism study, the City sees over 5.5 million visitors a year which is up nearly one million over the 2014-2015 study. Tourism is a year-round industry attracting skiers in the winter, vacationers in the summer and sightseers viewing the aspens turning gold in the fall. Non-city residents provide an estimated 50% of the sales tax revenues.
Sales Taxes Sales taxes are the largest revenue resource for the City of Flagstaff. The City of Flagstaff collects four different sales taxes.
General Sales Tax The first is a 1% tax on all general sales, except for food. This is a general purpose tax that benefits the General Fund. The City of Flagstaff is the only city left in the State of Arizona that has a sunset clause on the general sales tax. This tax must go before the voters every ten years and is currently authorized until November 2024. Per Schedule 5 in the Statistical Section, the 1% general city sales tax receipts saw a slight
iv
decrease, less than 1%, from the prior fiscal year based on the modified accrual method, while on a cash basis receipts were up over prior year. This is related to the timing of collections from the state and the calculation of the 60-day accrual. The average over the past two years is 5.3%. The City continues to follow its’ practice to not allocate 100% of construction and auto sales related sales tax revenues to ongoing budgetary needs due to the potential of fluctuation in recessionary periods.
Bed, Board and Beverage Tax Bed, Board and Beverage (BBB) tax collects an additional 2% for motel rooms/campgrounds, restaurants and bars. This revenue is restricted in use to certain economic, arts, beautification, recreation, or tourism activities. The BBB tax also has a sunset clause and it is currently authorized until 2028. Tourism is a major industry to the City of Flagstaff’s local economy. Per schedule 5, this tax category also saw a less than 1% decrease over prior year based on the modified accrual method. The average over the past two years is 7.1%. In addition to a strong tourism market, the timing of collections from the state and the 60-day accrual had an impact.
Transportation Tax The Transportation Tax is a 1.051% sales tax on the same types of general sales; however the tax is restricted in use to certain transportation projects. The four components of this tax include Safety Improvements, Street Improvements, 4th Street Overpass and Transit. These transportation tax components, excluding transit, expire in 2020. Revenue trends are the same as the general sales tax. The transit component of the tax was approved by voters to extend for an additional ten years and will expire in 2030. Voters approved the extension of the transportation tax for roadway, pedestrian, bicycle and safety improvements during the November 2018 election. The extended tax will expire June 2041. In addition, the voters approved a tax increase to construct a railroad overpass to connect Route 66 to Butler Avenue.
Road Repair and Street Safety Tax The Road Repair and Street Safety improvement tax is a 0.33% sales tax on the same types of the general sales tax. The proceeds from this tax are specifically dedicated to providing overdue maintenance including reconstructions on deteriorating City streets. This tax has a twenty-year life and the work program is anticipated to touch every City of Flagstaff owned street within the corporate boundary. Revenue trends are the same as the general sales tax.
State Shared Revenues State shared revenues include a distribution of a portion of sales tax and income tax collected by the State. These distributions are made based on a city or town’s relative share of population in comparison with all other cities and towns. The population estimates are based on annual population estimates provided by the US Census Bureau with the exception of census years.
State shared sales tax revenues have increased for the eighth year in a row. For FY 2018 there was a 6.6% growth in these revenues. State income tax revenues increased by 2.9%, however we are below the pre-recessionary revenues by 3.3%. The State continues to implement reductions in corporate income tax liabilities, which are expected to have a neutral impact on these revenues through increased economic development.
Highway user revenue (gas tax) funds (HURF) increased by 5.3% in FY 2018 which puts the revenues nearly 6% over the annual revenue peak in FY 2006. These revenues are distributed based on a complex Arizona
v
Department of Transportation formula, based in part on the amount of fuel purchased in the region. This is a per gallon tax. The City benefits from lower gas prices and higher public consumption. The State has implemented revenues shifts ‘off the top’ to fund other public safety and motor vehicle department needs. During the past two fiscal years, the state has restored a portion of these sweeps to the cities. As evidenced by the increase in BBB taxes and other statistical data, the City of Flagstaff remains a popular drive destination from Las Vegas, Los Angeles and Phoenix.
Overall, these three state shared revenues grew by 4.7% in FY 2018 and the State of Arizona projects continued growth.
Property Taxes Excluding new construction, total assessed valuations have increased 1.1% for tax year 2017, FY 2018. With new construction, total assessed valuations increased 6.7% for the tax year. Cities are statutorily allowed to set a primary property tax rate that would allow for 2% annual growth in levy (revenue) plus the additional levy generated from new construction. When the City of Flagstaff does not take advantage of the statutorily allowed 2% annual increase, it does not lose the ability to take the increase in the future. For FY 2018 the City of Flagstaff had a capacity to increase the tax levy by 12%. During the FY 2018 budget discussions City Council approved a plan to fund twelve public safety positions through the use of the property tax capacity. City Council approved a 7% tax levy increase in FY 2018 and FY 2019 to support public safety staffing. The rate for the primary property tax is adjusted annually to generate a levy equal to the prior year, plus new construction.
Additional Information While revenue fluctuations continue in some areas, the City of Flagstaff continues to see an increase in General Fund budgeted revenue in FY 2019 (excluding grants and miscellaneous revenue) by 3.6%, which reflects increases in local and state revenues. The City of Flagstaff increased its overall staffing count by 10.52 full time equivalencies for the upcoming fiscal year. This is the fourth year the City has increased its position count since 2009, however authorized full-time equivalent staff level is 30.7 positions below 2009.
With strong student enrollment at Northern Arizona University, there were two new student housing developments opened in the fall of 2017 and one new student housing development opened in the fall of 2018. There is currently one additional student housing project currently under construction. Development within the City continues to be very strong in every sector; single family, multi-family, commercial and mixed use. There are currently three new hotels in the construction or planning stage for development as well as three hotels looking to rebuild or expand. Currently the City operated airport provides daily flights to Phoenix. Recently the City added a second airline for next spring that offers daily flights to Dallas. The economic analysts for our local and state region continue to expect slow and steady growth over the next few years and add caution of a possible recession in the next two years. The City of Flagstaff will plan accordingly to ensure its financial position remains strong should a recession occur.
Due to its strong and healthy local economy, the City of Flagstaff has maintained a general obligation bond credit rating of Aa2 from Moody’s Investor Service since 2010 and a credit rating of AA from Standard and Poor’s since 2010.
vi
Long-Term Financial Planning
The City’s responsiveness to emerging economic challenges and its careful long-range planning have been key factors in the City of Flagstaff’s fiscal health. The City of Flagstaff continues to plan in a five to ten year horizon as economic conditions change. Some of these financial plan elements are financial resource planning, multi-year budget planning, strategic capital improvement project planning and financial policy impacts, all of which are further identified below.
Financial Resource Planning Strategic financial planning begins with determining the City of Flagstaff’s fiscal capacity based upon long-term financial forecasts of recurring available revenues. Financial forecasts coupled with financial trend analysis help preserve the fiscal well-being of the City of Flagstaff. Strategic financial capacity planning is a critical element to reach long-term financial stability goals and to determine special financial needs for critical objectives of the City Council.
Multi-Year Budget Planning Multi-year budget planning encompasses long-range operating expenditure plans (including the operating impacts of capital projects), which are linked to the community expectations and broad goals of the City Council. The multi-year approach provides a better opportunity for staff to change its financial paradigm from what do we need this year to how do we accomplish our service objectives over-time, given our financial capacity. While the City of Flagstaff is required to adopt an annual budget to meet State statutory requirements, the City of Flagstaff builds a financial plan for the next five years to help anticipate future impacts and ensure achievement of City objectives within limited or decreasing resources.
Strategic Capital Improvement Project Planning City of Flagstaff Capital Improvement Projects are planned for five or more years and analyzed using City of Flagstaff specific prioritization criteria. The operating cost impacts of projects are also planned and considered in developing future operating budget plans. Projects with significant operating impacts are carefully timed to avoid contingent liabilities, which future operating resources cannot meet. Pay-as-you-go funding sources are also conservatively estimated to avoid over-committing to capital construction using revenues that are not certain. To the extent debt financing is used and/or required, capital project plans are sized to conform to existing debt management policies.
Financial Policy Planning The City of Flagstaff financial policies dictate minimum fund balance levels, as a percentage of operating revenues, for the General, Special Revenue and Enterprise Funds. The General Fund is required to maintain a fund balance of 15% of ongoing revenues and Special Revenue and Enterprise Funds are to maintain a 10% fund balance, as calculated against ongoing revenues. The City has made a commitment to maintain General Fund balance at 20%, exceeding policy, to position the City better in times of economic decline. City Council adopted a Water, Wastewater and Reclaimed Water policy that sets a goal of minimum fund balance at 25% and new rates were recently adopted to achieve this goal.
vii
City Council Updates Goals and Objectives
During FY 2017, the City Council created their goals and objectives and during FY 2018 City Council updated these goals and objectives as shown below. These goals and objectives are used to help management and staff to build work programs and develop budgets. Staff has developed matrices to help define and report on progress and are available on the City of Flagstaff website.
Council Goals and Objectives
Economic Development Grow and strengthen a more equitable and resilient local economy.
• Improve the small business experience when going through the City process.• Support and enhance services to all businesses in the local community.• Complete the sale of the auto mall properties.• Increase eco and historic tourism in Flagstaff.• Form an arts district and build a cultural arts facility.• Market Parks and Recreation as accessible for all regardless of income.• Promote internet connectivity throughout the community.
Affordable Housing Support development and increase the inventory of public and private affordable housing for renters and homeowners throughout the community.
• Increase the number of affordable rental units.• Promote energy efficient rental units.• Improve the distribution of affordable rental units throughout the community.• Seek partnerships with private developers to increase the inventory of affordable rental and
ownership housing.• Pursue financing strategies that will create additional inventory of affordable rental and ownership
opportunities.• Modify the building and zoning codes to encourage more affordable housing options.• Adopt the maximum primary property tax increase and allocate the additional revenues to city-
managed rental housing program.• Establish an employer assisted housing program.• Advocate for full funding of Public Housing, Section 8 Housing Choice Voucher Program and the
Community Development Block Grant Program.• Advocate for the state to review Low Income Housing Tax Credit applications more than once a
year.
Social Justice Advance social justice in the community.
• Increase communication and engagement with Indigenous communities regarding city decisions.• Strengthen and repair relationships with Indigenous and immigrant communities.• Revisit the anti-camping ordinance.• Sponsor and support state or federal legislation that restores and protects funding for social and
other services to our population with special needs.• Advocate for healthcare as a human right.• Develop a strategic plan to implement the Indigenous Circle of Flagstaff recommendations.
Improve overall communications and engagement with Native Nations as we work in partnershipon shared issues and concerns.
• Support implementation priorities of the Memorandum of Understanding between Navajo NationHuman Rights Commission and City of Flagstaff.
viii

• Facilitation of annual meetings with tribal nations and collaborate on agenda development.
Transportation and Other Public Infrastructure Deliver quality infrastructure and continue to advocate for and implement a highly performing multi-modal transportation system.
• Send a transportation tax renewal question to voters in November 2018 and earn majority votersupport.
• Evaluate, plan, and implement strategies to address the impacts of winter recreation visitation.• Advocate for additional state and federal funding for state and federal roads.• Facilitate construction of new infrastructure needed to develop private land.• Develop a Downtown and Southside multimodal transportation plan.• Advocate for Fourth street connection with John Wesley Powell Boulevard.• Secure funding for widening of the bridge over I-40 at Fourth Street through Arizona Department
of Transportation five-year Capital Improvement Program.• Support the Regional Transportation Plan.• Complete construction of the new core maintenance facility in the next two years.• Complete the Intergovernmental Agreement with the County for a new courthouse and begin the
design process.• Evaluate water, wastewater and reclaimed water infrastructure capacity issues.• Replace aging infrastructure.• Provide airport infrastructure upgrades to enhance tenant and patron experience and secure a
second airline.
Building and Zoning/Regional Plan Revise the zoning code to remove ambiguities, and ensure it is consistent with community values and the regional plan.
• Align building codes, zoning codes and regional plan.• Adjust the codes to better reflect community values and the intent of the regional plan.• Improve clarity and readability of existing building and zoning codes.• Continue efforts to understand the impacts of student housing while supporting the housing type.• Amend codes to encourage more affordable housing.• Complete and update neighborhood plans specific to Housing Urban Development consolidated
plan and target neighborhoods within that plan.• Continue the conversation about adoption of impact fees.
Climate Change Take meaningful climate change action.
• Develop and implement a climate action plan.• Become a 100% renewable energy city organization and community.• Divest from fossil fuels.• Sponsor and support state and federal legislative action that combats climate change.• Update the Energy Code.
Water Conservation Become a national leader in water conservation in all sectors.
• Develop a sustainable water budget.• Enhance water conservation efforts.• Encourage commercial and multi-housing sectors to participate in water conservation efforts.• Secure long-term water resources.• Prioritize reclaimed water for necessary uses.
ix
Environmental and Natural Resources Actively manage and protect all environmental and natural resources.
• Aggressively support efforts for forest health.• Preserve natural resources.• Further develop sustainability and waste removal policies and programs.• Align City policies and Street Lights to Enhance Dark Skies (SLEDS) committee recommendations.• Continue to support the Four Forest Restoration Initiative (4FRI).• Increase City recycling from 13% to 75%.
Administrative Goals
Personnel Attract and retain quality staff.
• Invest in employee training.• Ensure adequate Public Safety staffing levels.• Provide pay raises for all employees.• Provide paid maternity and paternity leave.• Expand the housing assistance program for all City staff.• Enhance tuition reimbursement opportunities throughout the organization.• Provide parking incentives for employees.• Evaluate ways to pay down unfunded pension liabilities.
Community Outreach Enhance public transparency and accessibility.
• Create greater public access to Council meetings.• Define the City’s public communication program.• Take a more proactive role in communicating issues and progress on Council Goals and Objectives.• Develop a social media management plan.• Build and enhance neighborhood services from the City.
Town & Gown Enhance relationships between the city and institutions of higher education.
• Establish a comprehensive internship program through Coconino Community College (CCC) andNorthern Arizona University (NAU).
• Coordinate with NAU, CCC and the Arizona Board of Regents (ABOR) in planning for futuregrowth of the student population.
Code Compliance Achieve comprehensive and equitable code compliance.
• Review current City Code to align with community expectations.• Establish proactive strategic enforcement of the City Code to maximize compliance.
Awards and Acknowledgements
The Government Finance Officers Association of the United States and Canada (GFOA) awarded a Certificate of Achievement for Excellence in Financial Reporting to the City of Flagstaff for its comprehensive annual financial report (CAFR) for the fiscal year ended June 30, 2017. This was the 24th consecutive year that the City has achieved this prestigious award. In order to receive a Certificate of Achievement, the City had to publish an easily readable and efficiently organized CAFR that satisfied both generally accepted accounting principles and applicable program requirements.
x
A Certificate of Achievement for Excellence in Financial Reporting is valid for a period of one year only. However, we believe that our current CAFR continues to meet the Certificate of Achievement for Excellence in Financial Reporting Program’s requirements, and are submitting it to the GFOA to determine its eligibility for another certificate.
The City also received the GFOA’s Distinguished Budget Presentation Award for our fiscal year 2018 annual budget (also 24 years in a row). To qualify for the Distinguished Budget Presentation Award, the City’s budget document had to be judged proficient as a policy document, a financial plan, an operations guide and a communications device.
In addition, in 2018, the City received the Achievement in Excellence in Procurement award for the seventh year in a row by the National Purchasing Institute. This award program is designed to recognize organizational excellence in public procurement measuring innovation, professionalism, productivity, e-procurement and leadership attributes.
The preparation of this report would not have been possible without the skill, effort and dedication of the entire staff of the Management Services Division. A special note of appreciation is given to Brandi Suda, Finance Director, Heidi Derryberry, Finance Manager and the dedicated staff in Finance for their efforts to prepare this year’s CAFR. The hard work of staff brings together a document that consistently receives recognition of its quality. We wish to thank all government divisions for their assistance in providing the data necessary to prepare this report. Credit also is due to the Mayor and the Council for their support for maintaining the highest standards of professionalism in the management of the City of Flagstaff finances.
Respectfully submitted,
Rick Tadder, Management Services Director
xi
Government Finance Officers Association
Certificate of Achievement for Excellence in Financial Reporting
Presented to
City of Flagstaff
Arizona
For its Comprehensive Annual
Financial Report
for the Fiscal Year Ended
June 30, 2017
Executive Director/CEO
xii
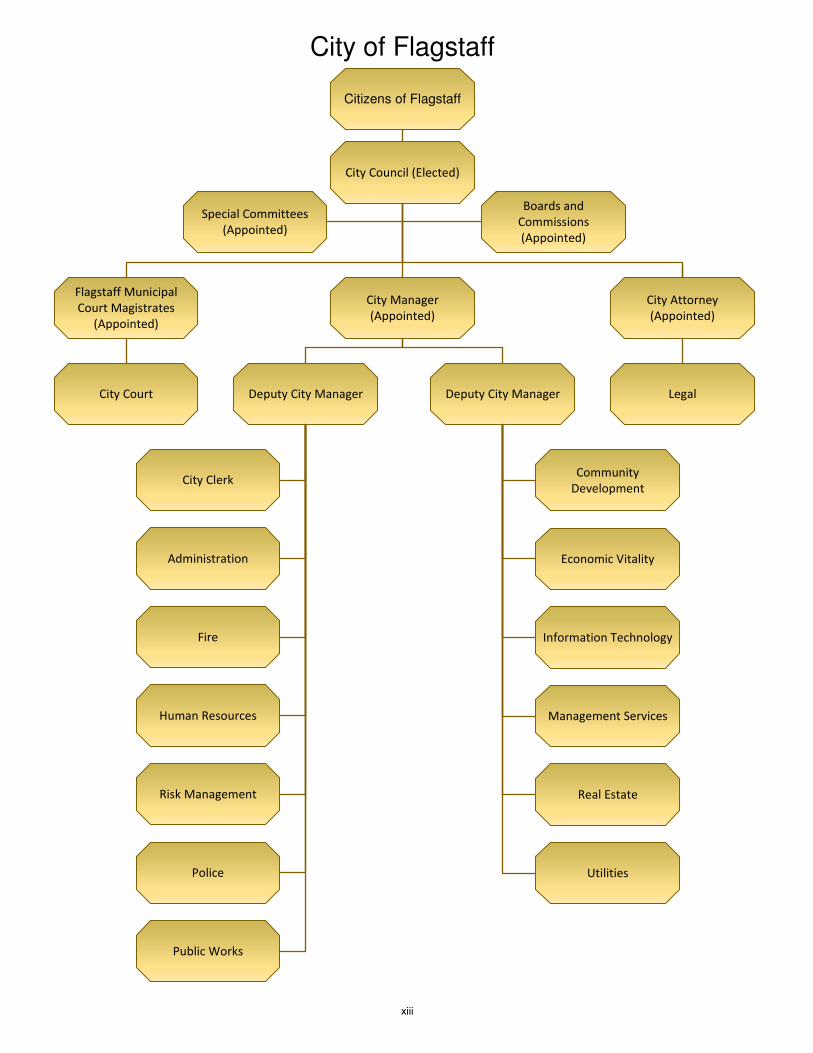
Citizens of Flagstaff
City Council (Elected)
Special Committees
(Appointed)
Boards and
Commissions
(Appointed)
Flagstaff Municipal
Court Magistrates
(Appointed)
City Manager
(Appointed)
City Attorney
(Appointed)
City Court Deputy City Manager Deputy City Manager Legal
Administration
Fire
Human Resources
Risk Management
Police
Public Works
City ClerkCommunity
Development
Economic Vitality
Information Technology
Management Services
Real Estate
Utilities
City of Flagstaff
xiii
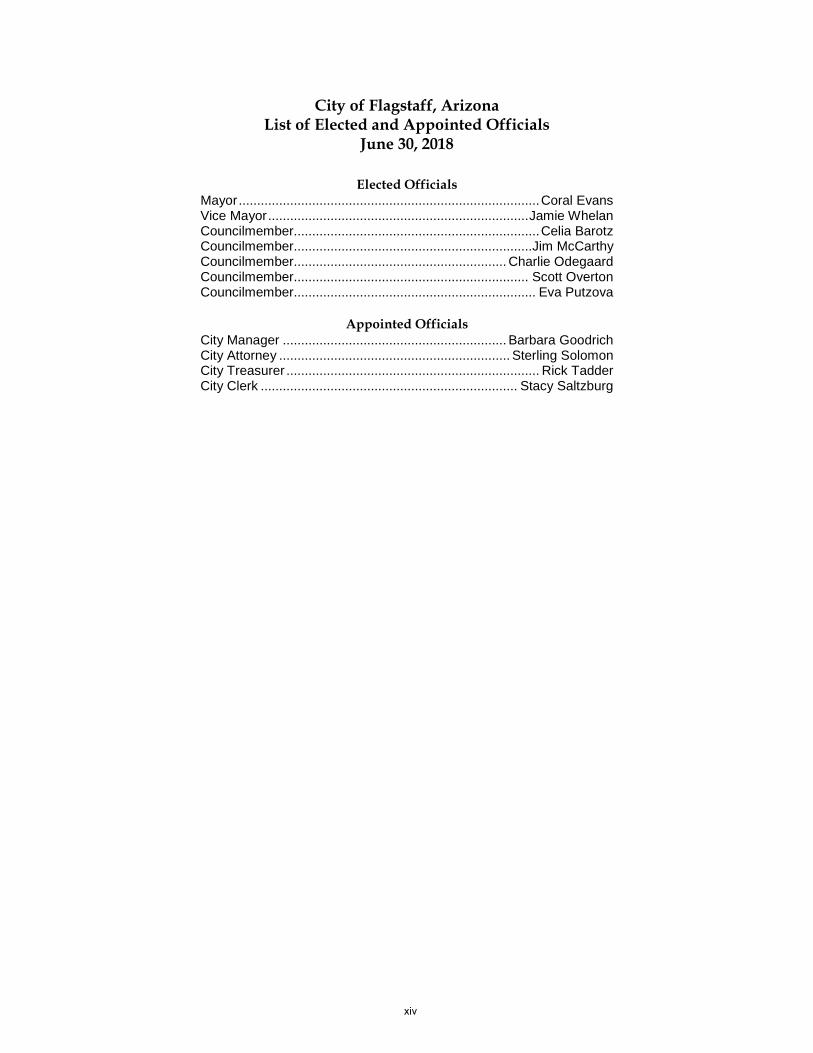
City of Flagstaff, Arizona List of Elected and Appointed Officials
June 30, 2018
Elected Officials Mayor .................................................................................. Coral Evans Vice Mayor ....................................................................... Jamie Whelan Councilmember................................................................... Celia Barotz Councilmember.................................................................Jim McCarthy Councilmember.......................................................... Charlie Odegaard Councilmember................................................................ Scott Overton Councilmember.................................................................. Eva Putzova
Appointed Officials City Manager ............................................................. Barbara Goodrich City Attorney ............................................................... Sterling Solomon City Treasurer ..................................................................... Rick Tadder City Clerk ...................................................................... Stacy Saltzburg
xiv
CliftonLarsonAllen LLPCLAconnect.com
INDEPENDENT AUDITORS' REPORT
The Honorable Mayor and Members of City CouncilCity of Flagstaff, ArizonaFlagstaff, Arizona
Report on the Financial Statements
We have audited the accompanying financial statements of the governmental activities, the business-type activities, each major fund, and the aggregate remaining fund information of the City of Flagstaff, Arizona (City), as of and for the year ended June 30, 2018, and the related notes to the financial statements, which collectively comprise the City’s basic financial statements as listed in the table of contents.
Management’s Responsibility for the Financial Statements
Management is responsible for the preparation and fair presentation of these financial statements in accordance with accounting principles generally accepted in the United States of America; this includes the design, implementation, and maintenance of internal control relevant to the preparation and fair presentation of financial statements that are free from material misstatement, whether due to fraud or error.
Auditors’ Responsibility
Our responsibility is to express opinions on these financial statements based on our audit. We conducted our audit in accordance with auditing standards generally accepted in the United States of America and the standards applicable to financial audits contained in Government Auditing Standards, issued by the Comptroller General of the United States. Those standards require that we plan and perform the audit to obtain reasonable assurance about whether the financial statements are free from material misstatement.
An audit involves performing procedures to obtain audit evidence about the amounts and disclosures in the financial statements. The procedures selected depend on the auditors’ judgment, including the assessment of the risks of material misstatement of the financial statements, whether due to fraud or error. In making those risk assessments, the auditor considers internal control relevant to the City’spreparation and fair presentation of the financial statements in order to design audit procedures that are appropriate in the circumstances, but not for the purpose of expressing an opinion on the effectiveness of the City’s internal control. Accordingly, we express no such opinion. An audit also includes evaluating the appropriateness of accounting policies used and the reasonableness of significant accounting estimates made by management, as well as evaluating the overall presentation of the financial statements.
We believe that the audit evidence we have obtained is sufficient and appropriate to provide a basis for our audit opinions.
1
The Honorable Mayor and Members of City CouncilCity of Flagstaff, ArizonaPage 2
Opinions
In our opinion, the financial statements referred to above present fairly, in all material respects, the respective financial position of the governmental activities, the business-type activities, each major fund, and the aggregate remaining fund information of the City of Flagstaff, Arizona as of June 30, 2018, and the respective changes in financial position and, where applicable, cash flows thereof and the budgetary comparison schedules of the General Fund and Transportation Fund for the year then ended in accordance with accounting principles generally accepted in the United States of America.
Emphasis of a Matter
During the fiscal year ended June 30, 2018, the City adopted the provisions of Governmental Accounting Standards Board Statement (GASBS) No. 75, Accounting and Financial Reporting for Postemployment Benefits Other than Pensions. As a result of the implementation of GASBS No. 75, the City reported a restatement for the change in accounting principle (see Note II.C). Our auditors’opinion was not modified with respect to the restatement.
Other Matters
Required Supplementary Information
Accounting principles generally accepted in the United States of America require that the management’s discussion and analysis and the required supplementary information for the City’s pension plans and other postemployment benefits (as listed in the table of contents) be presented to supplement the basic financial statements. Such information, although not a part of the basic financial statements, is required by the Governmental Accounting Standards Board who considers it to be an essential part of financial reporting for placing the basic financial statements in an appropriate operational, economic, or historical context. We have applied certain limited procedures to the required supplementary information in accordance with auditing standards generally accepted in the United States of America, which consisted of inquiries of management about the methods of preparing the information and comparing the information for consistency with management’s responses to our inquiries, the basic financial statements, and other knowledge we obtained during our audit of the basic financial statements. We do not express an opinion or provide any assurance on the information because the limited procedures do not provide us with sufficient evidence to express an opinion or provide any assurance.
Supplementary and Other Information
Our audit was conducted for the purpose of forming opinions on the financial statements that collectively comprise the City’s basic financial statements. The combining and individual nonmajor fund financial statements, supplementary information and the introductory and statistical sections are presented for purposes of additional analysis and are not a required part of the basic financial statements.
2
The Honorable Mayor and Members of City CouncilCity of Flagstaff, ArizonaPage 3
The combining and individual nonmajor fund financial statements and the supplemental information(capital assets used in the operations of the government, budgetary comparison schedules for nonmajor governmental funds and the financial data submission schedules) are the responsibility of management and were derived from and relate directly to the underlying accounting and other records used to prepare the basic financial statements. Such information has been subjected to the auditing procedures applied in the audit of the basic financial statements and certain additional procedures, including comparing and reconciling such information directly to the underlying accounting and other records used to prepare the basic financial statements or to the basic financial statements themselves, and other additional procedures in accordance with auditing standards generally accepted in the United States of America. In our opinion, the information is fairly stated, in all material respects, in relation to the basic financial statements as a whole.
The introductory and statistical sections have not been subjected to the auditing procedures applied in the audit of the basic financial statements, and accordingly, we do not express an opinion or provide any assurance on it.
Other Reporting Required by Government Auditing Standards
In accordance with Government Auditing Standards, we have also issued our report dated December 20, 2018, on our consideration of the City’s internal control over financial reporting and on our tests of its compliance with certain provisions of laws, regulations, contracts, and grant agreements and other matters. The purpose of that report is solely to describe the scope of our testing of internal control over financial reporting and compliance and the result of that testing, and not to provide an opinion on the effectiveness of the City’s internal control over financial reporting or on compliance. That report is an integral part of an audit performed in accordance with Government Auditing Standards in considering the City’s internal control over financial reporting and compliance.
aCliftonLarsonAllen LLP
Phoenix, ArizonaDecember 20, 2018
3

4
Management Discussion and Analysis
As management of the City of Flagstaff (the City), we offer readers of the City’s Financial Statements this narrative overview and analysis of the financial activities of the City for the fiscal year ended June 30, 2018. We encourage readers to consider the information presented here in conjunction with additional information that we have furnished in our letter of transmittal, which can be found on pages iii –xi of this report.
Financial Highlights The City’s total net position at the close of the most recent fiscal year is $596.9 million. The government’s total net position increased by $13.5 million during the fiscal year. This is a result
of an increase in net position in the governmental activities of $8.5 million and an increase in net position in the business type activities of $5.0 million.
As of June 30, 2018, the City’s governmental funds reported combined ending fund balances of $121.4 million, a decrease of $0.5 million in comparison to the prior fiscal year. Approximately 22.6% of this total amount ($27.4 million) is unassigned fund balance available for spending at the government’s discretion.
As of June 30, 2018, total unassigned fund balance for the general fund was $27.5 million, or 46.4% of total general fund expenditures ($59.1 million).
As of June 30, 2018, the City’s proprietary funds reported combined total net position of $352.0 million, and total unrestricted of $24.9 million. The largest unrestricted component of net position is in the Water and Wastewater Fund ($26.2 million).
Overview of The Financial Statements This discussion and analysis is intended to serve as an introduction to the City’s basic financial statements. The City’s basic financial statements comprise three components: (1) Government-wide Financial Statements, (2) Fund Financial Statements, and (3) Notes to the Financial Statements. This report also contains other Supplemental Information in addition to the basic financial statements themselves.
Government-wide Financial Statements The Government-wide Financial Statements are designed to provide readers with a broad overview of the City’s finances in a manner similar to a private-sector business.
The Statement of Net Position presents information on all the City’s assets, plus deferred outflows of resources, less liabilities, less deferred inflows of resources, which equal net position. Over time, increases or decreases in net position may serve as a useful indicator of whether the financial position of the City is improving or deteriorating.
The Statement of Activities presents information showing how the City’s net position changed during the most recent fiscal year. All changes in net position are reported as soon as the underlying event giving rise to the change occurs, regardless of the timing of the related cash flows. Thus, revenues and expenses are reported in this statement for some items that will only result in cash flows in future fiscal periods such as revenues pertaining to uncollected taxes or expenses pertaining to earned but unused vacation leave.
Both Government-wide Financial Statements distinguish functions of the City that are principally supported by taxes and intergovernmental revenues (governmental activities) from other functions that are intended to recover all or a significant portion of their costs through user fees and charges (business-type activities). The sections are demonstrated in the table on the following page.
5
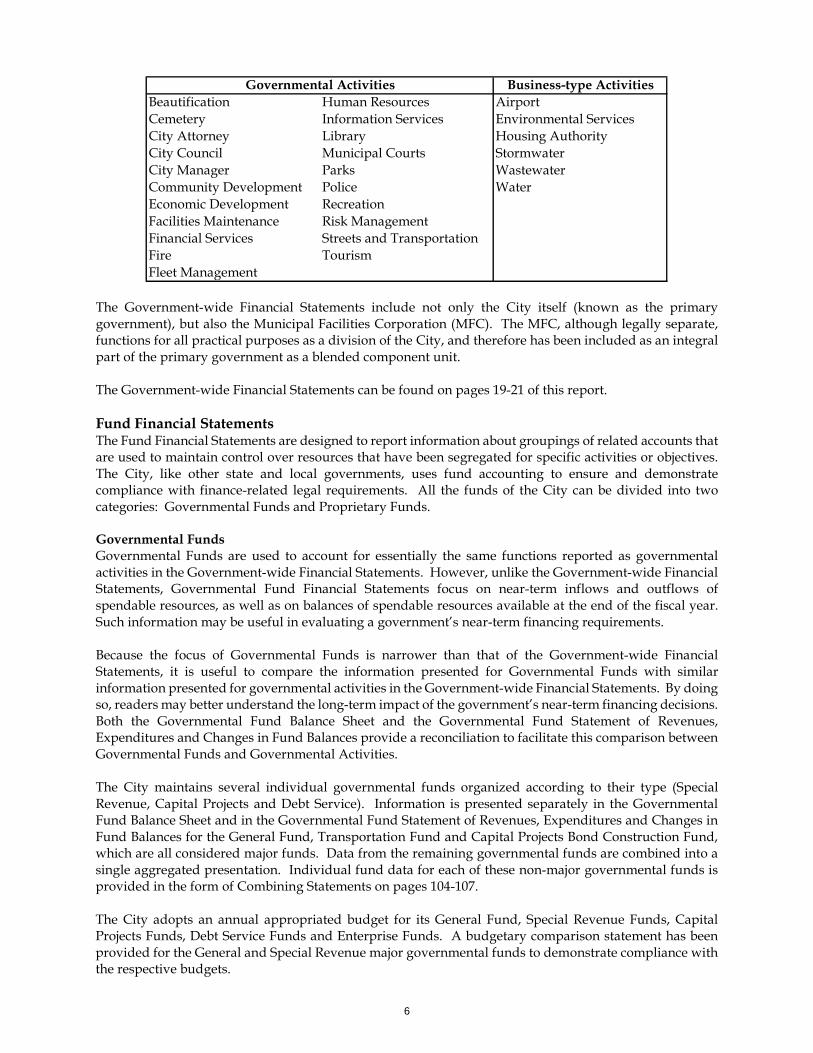
The Government-wide Financial Statements include not only the City itself (known as the primary government), but also the Municipal Facilities Corporation (MFC). The MFC, although legally separate, functions for all practical purposes as a division of the City, and therefore has been included as an integral part of the primary government as a blended component unit. The Government-wide Financial Statements can be found on pages 19-21 of this report. Fund Financial Statements The Fund Financial Statements are designed to report information about groupings of related accounts that are used to maintain control over resources that have been segregated for specific activities or objectives. The City, like other state and local governments, uses fund accounting to ensure and demonstrate compliance with finance-related legal requirements. All the funds of the City can be divided into two categories: Governmental Funds and Proprietary Funds. Governmental Funds Governmental Funds are used to account for essentially the same functions reported as governmental activities in the Government-wide Financial Statements. However, unlike the Government-wide Financial Statements, Governmental Fund Financial Statements focus on near-term inflows and outflows of spendable resources, as well as on balances of spendable resources available at the end of the fiscal year. Such information may be useful in evaluating a government’s near-term financing requirements.
Because the focus of Governmental Funds is narrower than that of the Government-wide Financial Statements, it is useful to compare the information presented for Governmental Funds with similar information presented for governmental activities in the Government-wide Financial Statements. By doing so, readers may better understand the long-term impact of the government’s near-term financing decisions. Both the Governmental Fund Balance Sheet and the Governmental Fund Statement of Revenues, Expenditures and Changes in Fund Balances provide a reconciliation to facilitate this comparison between Governmental Funds and Governmental Activities. The City maintains several individual governmental funds organized according to their type (Special Revenue, Capital Projects and Debt Service). Information is presented separately in the Governmental Fund Balance Sheet and in the Governmental Fund Statement of Revenues, Expenditures and Changes in Fund Balances for the General Fund, Transportation Fund and Capital Projects Bond Construction Fund, which are all considered major funds. Data from the remaining governmental funds are combined into a single aggregated presentation. Individual fund data for each of these non-major governmental funds is provided in the form of Combining Statements on pages 104-107. The City adopts an annual appropriated budget for its General Fund, Special Revenue Funds, Capital Projects Funds, Debt Service Funds and Enterprise Funds. A budgetary comparison statement has been provided for the General and Special Revenue major governmental funds to demonstrate compliance with the respective budgets.
Business-type ActivitiesBeautification Human Resources AirportCemetery Information Services Environmental ServicesCity Attorney Library Housing AuthorityCity Council Municipal Courts StormwaterCity Manager Parks WastewaterCommunity Development Police WaterEconomic Development RecreationFacilities Maintenance Risk ManagementFinancial Services Streets and TransportationFire TourismFleet Management
Governmental Activities
6
The basic Governmental Fund Financial Statements can be found on pages 22-31 of this report. Proprietary Funds Proprietary Funds are generally used to account for services for which the City charges customers – either outside customers, or divisions of the City. Proprietary Funds provide the same type of information shown in the Government-wide Financial Statements, only in more detail. The City maintains the following two types of proprietary funds:
Enterprise Funds are used to report the same function presented as business-type activities in the Government-wide Financial Statements. The City uses Enterprise Funds to account for Water and Wastewater, Airport, Environmental Services, Stormwater and the Housing Authority. All are major funds of the City except for the Airport and Housing Authority Fund.
Internal Service Funds are used to report activities that provide supplies and services for certain City programs and activities. The City uses an Internal Service Fund to account for its workers compensation, health insurance, other risk related activity, including claims adjustment, and general liability and property insurance. Because these services predominantly benefit governmental rather than business-type functions, they have been included within governmental activities in the Government-wide Financial Statements. The Internal Service Fund is combined into a single, aggregated presentation in the Proprietary Fund Statements.
The Basic Proprietary Fund Financial Statements can be found on pages 32-39 of this report. The non-major Proprietary Fund Finance Statements are found on pages 108-112. Notes to the Financial Statements The Notes to the Financial Statements provide additional information that is essential to a full understanding of the data provided in the Government-wide and Fund Financial Statements. The notes to the Financial Statements can be found on pages 40-94 of this report. Combining Statements The Combining Statements referred to earlier in connection with non-major governmental funds and proprietary funds are presented on pages 103-112. Other Information In addition to the Basic Financial Statements and accompanying Notes to the Financial Statement, this report also presents certain other Supplemental Information concerning the City’s capital asset activity, budgetary comparison of other major and non-major governmental funds and financial data submission schedules. Other Supplemental Information can be found on pages 113-134 of this report. Government-wide Statements Financial Analysis Analysis of Net Position As noted earlier, net position may serve as a useful indicator of a government’s financial position. For the City, assets plus deferred outflows of resources exceeded liabilities plus deferred inflows of resources by $596.9 million as of June 30, 2018. Of the City’s Net Position, 96.9% reflects its investment of $578.4 million in capital assets (e.g. land, buildings and equipment), less any outstanding debt used to acquire those assets. The City uses these capital assets to provide services to citizens; consequently, these assets are not available for future spending. Although the City’s investment in its capital assets is reported net of related debt, it should be noted that the resources needed to repay this debt must be provided from other sources, since the capital assets themselves cannot be liquidated for these liabilities.
7
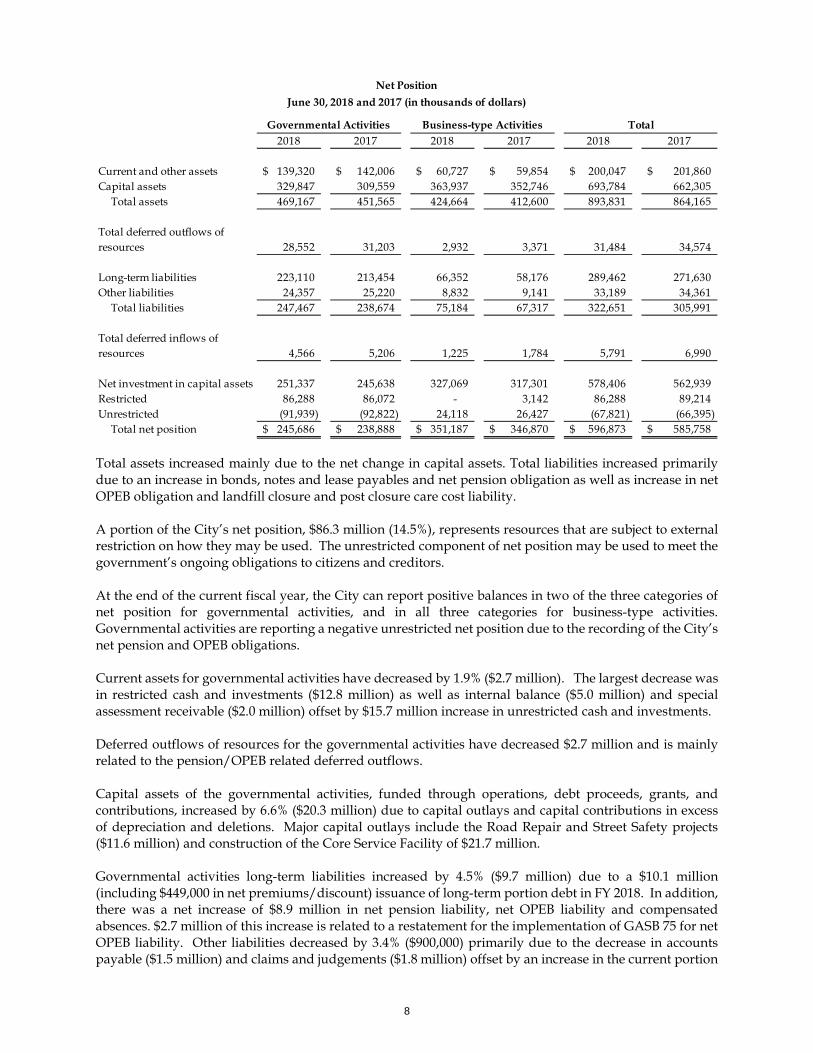
Total assets increased mainly due to the net change in capital assets. Total liabilities increased primarily due to an increase in bonds, notes and lease payables and net pension obligation as well as increase in net OPEB obligation and landfill closure and post closure care cost liability. A portion of the City’s net position, $86.3 million (14.5%), represents resources that are subject to external restriction on how they may be used. The unrestricted component of net position may be used to meet the government’s ongoing obligations to citizens and creditors. At the end of the current fiscal year, the City can report positive balances in two of the three categories of net position for governmental activities, and in all three categories for business-type activities. Governmental activities are reporting a negative unrestricted net position due to the recording of the City’s net pension and OPEB obligations. Current assets for governmental activities have decreased by 1.9% ($2.7 million). The largest decrease was in restricted cash and investments ($12.8 million) as well as internal balance ($5.0 million) and special assessment receivable ($2.0 million) offset by $15.7 million increase in unrestricted cash and investments. Deferred outflows of resources for the governmental activities have decreased $2.7 million and is mainly related to the pension/OPEB related deferred outflows. Capital assets of the governmental activities, funded through operations, debt proceeds, grants, and contributions, increased by 6.6% ($20.3 million) due to capital outlays and capital contributions in excess of depreciation and deletions. Major capital outlays include the Road Repair and Street Safety projects ($11.6 million) and construction of the Core Service Facility of $21.7 million. Governmental activities long-term liabilities increased by 4.5% ($9.7 million) due to a $10.1 million (including $449,000 in net premiums/discount) issuance of long-term portion debt in FY 2018. In addition, there was a net increase of $8.9 million in net pension liability, net OPEB liability and compensated absences. $2.7 million of this increase is related to a restatement for the implementation of GASB 75 for net OPEB liability. Other liabilities decreased by 3.4% ($900,000) primarily due to the decrease in accounts payable ($1.5 million) and claims and judgements ($1.8 million) offset by an increase in the current portion
Net PositionJune 30, 2018 and 2017 (in thousands of dollars)
Governmental Activities Business-type Activities Total2018 2017 2018 2017 2018 2017
Current and other assets 139,320$ 142,006$ 60,727$ 59,854$ 200,047$ 201,860$ Capital assets 329,847 309,559 363,937 352,746 693,784 662,305 Total assets 469,167 451,565 424,664 412,600 893,831 864,165
Total deferred outflows of resources 28,552 31,203 2,932 3,371 31,484 34,574
Long-term liabilities 223,110 213,454 66,352 58,176 289,462 271,630 Other liabilities 24,357 25,220 8,832 9,141 33,189 34,361 Total liabilities 247,467 238,674 75,184 67,317 322,651 305,991
Total deferred inflows of resources 4,566 5,206 1,225 1,784 5,791 6,990
Net investment in capital assets 251,337 245,638 327,069 317,301 578,406 562,939 Restricted 86,288 86,072 - 3,142 86,288 89,214 Unrestricted (91,939) (92,822) 24,118 26,427 (67,821) (66,395) Total net position 245,686$ 238,888$ 351,187$ 346,870$ 596,873$ 585,758$
8
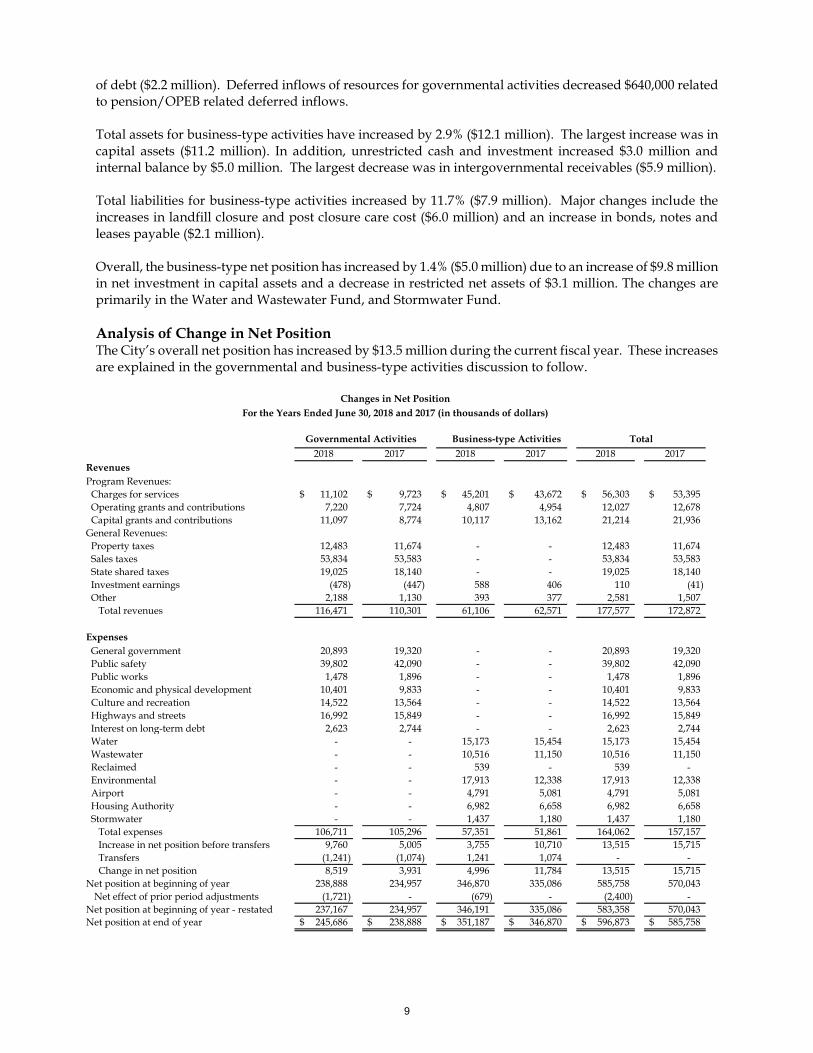
of debt ($2.2 million). Deferred inflows of resources for governmental activities decreased $640,000 related to pension/OPEB related deferred inflows. Total assets for business-type activities have increased by 2.9% ($12.1 million). The largest increase was in capital assets ($11.2 million). In addition, unrestricted cash and investment increased $3.0 million and internal balance by $5.0 million. The largest decrease was in intergovernmental receivables ($5.9 million). Total liabilities for business-type activities increased by 11.7% ($7.9 million). Major changes include the increases in landfill closure and post closure care cost ($6.0 million) and an increase in bonds, notes and leases payable ($2.1 million). Overall, the business-type net position has increased by 1.4% ($5.0 million) due to an increase of $9.8 million in net investment in capital assets and a decrease in restricted net assets of $3.1 million. The changes are primarily in the Water and Wastewater Fund, and Stormwater Fund. Analysis of Change in Net Position The City’s overall net position has increased by $13.5 million during the current fiscal year. These increases are explained in the governmental and business-type activities discussion to follow.
Changes in Net PositionFor the Years Ended June 30, 2018 and 2017 (in thousands of dollars)
Governmental Activities Business-type Activities Total2018 2017 2018 2017 2018 2017
RevenuesProgram Revenues: Charges for services 11,102$ 9,723$ 45,201$ 43,672$ 56,303$ 53,395$ Operating grants and contributions 7,220 7,724 4,807 4,954 12,027 12,678 Capital grants and contributions 11,097 8,774 10,117 13,162 21,214 21,936 General Revenues: Property taxes 12,483 11,674 - - 12,483 11,674 Sales taxes 53,834 53,583 - - 53,834 53,583 State shared taxes 19,025 18,140 - - 19,025 18,140 Investment earnings (478) (447) 588 406 110 (41) Other 2,188 1,130 393 377 2,581 1,507 Total revenues 116,471 110,301 61,106 62,571 177,577 172,872
Expenses General government 20,893 19,320 - - 20,893 19,320 Public safety 39,802 42,090 - - 39,802 42,090 Public works 1,478 1,896 - - 1,478 1,896 Economic and physical development 10,401 9,833 - - 10,401 9,833 Culture and recreation 14,522 13,564 - - 14,522 13,564 Highways and streets 16,992 15,849 - - 16,992 15,849 Interest on long-term debt 2,623 2,744 - - 2,623 2,744 Water - - 15,173 15,454 15,173 15,454 Wastewater - - 10,516 11,150 10,516 11,150 Reclaimed - - 539 - 539 - Environmental - - 17,913 12,338 17,913 12,338 Airport - - 4,791 5,081 4,791 5,081 Housing Authority - - 6,982 6,658 6,982 6,658 Stormwater - - 1,437 1,180 1,437 1,180 Total expenses 106,711 105,296 57,351 51,861 164,062 157,157 Increase in net position before transfers 9,760 5,005 3,755 10,710 13,515 15,715 Transfers (1,241) (1,074) 1,241 1,074 - - Change in net position 8,519 3,931 4,996 11,784 13,515 15,715 Net position at beginning of year 238,888 234,957 346,870 335,086 585,758 570,043
Net effect of prior period adjustments (1,721) - (679) - (2,400) - Net position at beginning of year - restated 237,167 234,957 346,191 335,086 583,358 570,043 Net position at end of year 245,686$ 238,888$ 351,187$ 346,870$ 596,873$ 585,758$
9
Governmental Activities Governmental activities increased the City’s net position by $8.5 million. The key factors for this increase are as follows: Revenues exceeded expenses by $9.8 million as compared to last years of $5.0 million. Capital grants and contributions had the largest increase by dollars at $2.3 million (26.5%). Highway
and street increased $1.8 million related to developer capital and transportation contributions. City sales tax revenues increased by 0.5% ($250,000). Comparing actual revenues to budgeted revenues
the City exceeded estimates by $3.1 million. The City has seen positive sales tax growth in the last seven years.
Charges for services increased 14.2% ($1.4 million) related primarily to the new parking district revenues in addition to increases in building and construction permits and fees due to the increase in construction in the community.
Operating grants and contributions decreased 6.5% ($0.5 million) due primarily to a decrease in CDBG grant revenue compared to prior years.
State shared taxes had a 4.9% increase as the economy in the region and at the State level continues to grow at slow to moderate levels.
Property taxes increased 6.9% ($0.8 million) mainly due to an increase in City primary property taxes. Expenses have increased by $1.4 million (1.3 %). The major increases were in general government ($1.6
million), economic and physical development ($0.6 million), culture and recreation ($1.0 million) and highways and streets ($1.1 million). The decreases were in public works for $0.4 million and $2.3 million in public safety.
Business-type Activities Business-type activities had a net position increase of $5.0 million. The key factors for this increase include: Charges for service have increased by 3.5% ($1.5 million). Funds with increases were, Wastewater and
Reclaimed ($0.7 million), Stormwater ($510,000), Housing Authority ($215,000), Water ($182,000) and Airport ($121,000).
Capital grants and contributions have decreased by 23.1% ($3.0 million) due to a decrease in utility capacity fees and developer contributed capital.
Investment earnings are up slightly ($0.2 million). Expenses have increased over the prior year by 10.6 % ($5.5 million). There were increases in the,
Stormwater Fund ($0.3 million), Housing Authority Fund ($0.3 million) and Environmental Services Fund ($5.6 million). There were decreases in the Airport ($0.3 million) and in the Water, Wastewater and Reclaimed Water Fund ($0.4 million).
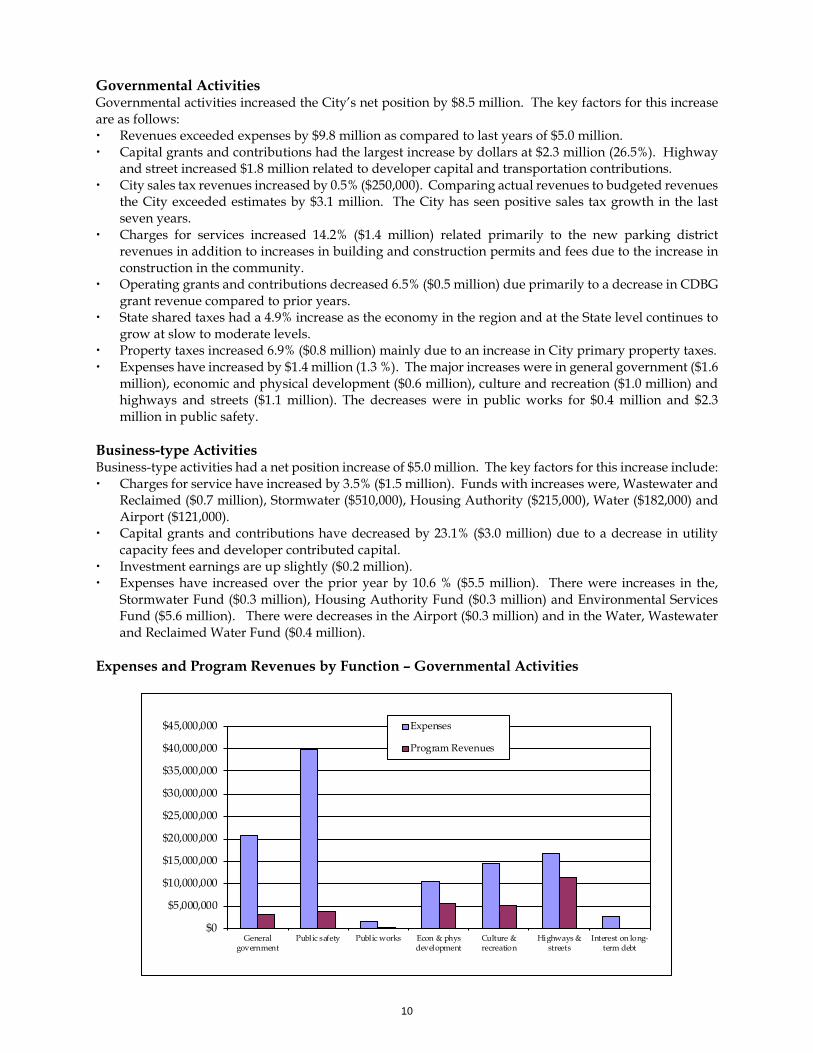
Expenses and Program Revenues by Function – Governmental Activities
$0
$5,000,000
$10,000,000
$15,000,000
$20,000,000
$25,000,000
$30,000,000
$35,000,000
$40,000,000
$45,000,000
Generalgovernment
Public safety Public works Econ & physdevelopment
Culture &recreation
Highways &streets
Interest on long-term debt
Expenses
Program Revenues
10
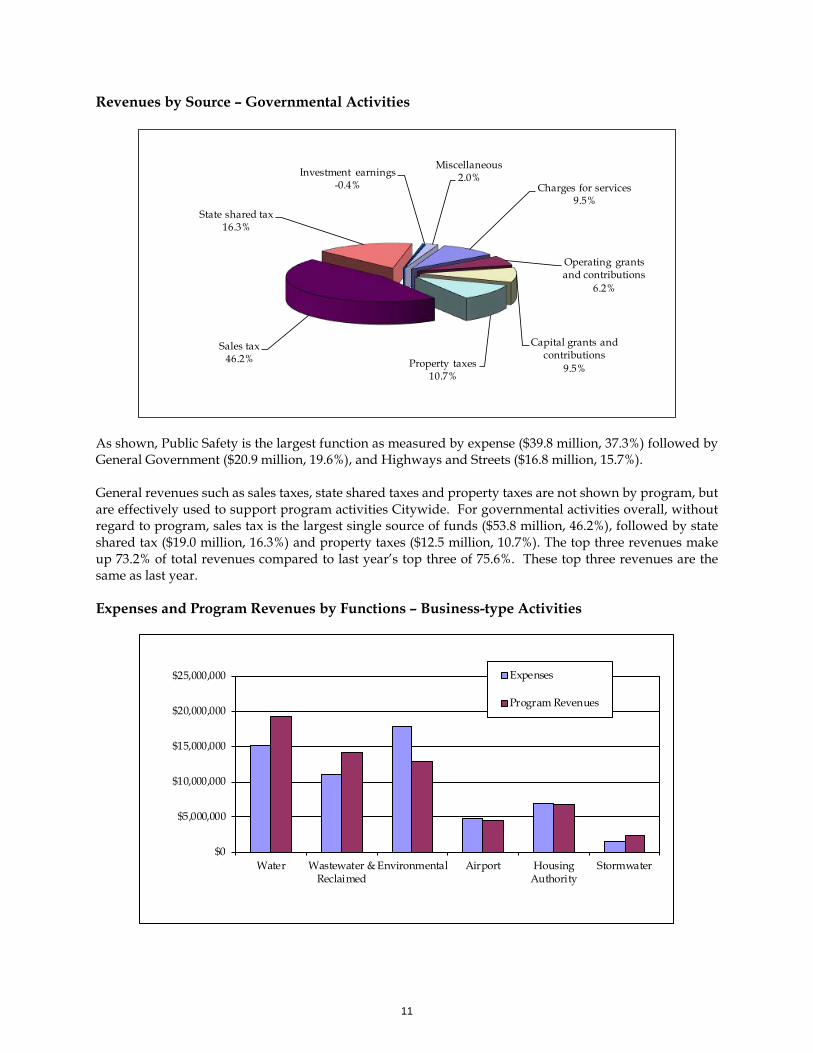
Revenues by Source – Governmental Activities
As shown, Public Safety is the largest function as measured by expense ($39.8 million, 37.3%) followed by General Government ($20.9 million, 19.6%), and Highways and Streets ($16.8 million, 15.7%). General revenues such as sales taxes, state shared taxes and property taxes are not shown by program, but are effectively used to support program activities Citywide. For governmental activities overall, without regard to program, sales tax is the largest single source of funds ($53.8 million, 46.2%), followed by state shared tax ($19.0 million, 16.3%) and property taxes ($12.5 million, 10.7%). The top three revenues make up 73.2% of total revenues compared to last year’s top three of 75.6%. These top three revenues are the same as last year. Expenses and Program Revenues by Functions – Business-type Activities
Charges for services9.5%
Operating grants and contributions
6.2%
Capital grants and contributions
9.5%Property taxes10.7%
Sales tax46.2%
State shared tax16.3%
Investment earnings-0.4%
Miscellaneous2.0%
$0
$5,000,000
$10,000,000
$15,000,000
$20,000,000
$25,000,000
Water Wastewater &Reclaimed
Environmental Airport HousingAuthority
Stormwater
Expenses
Program Revenues
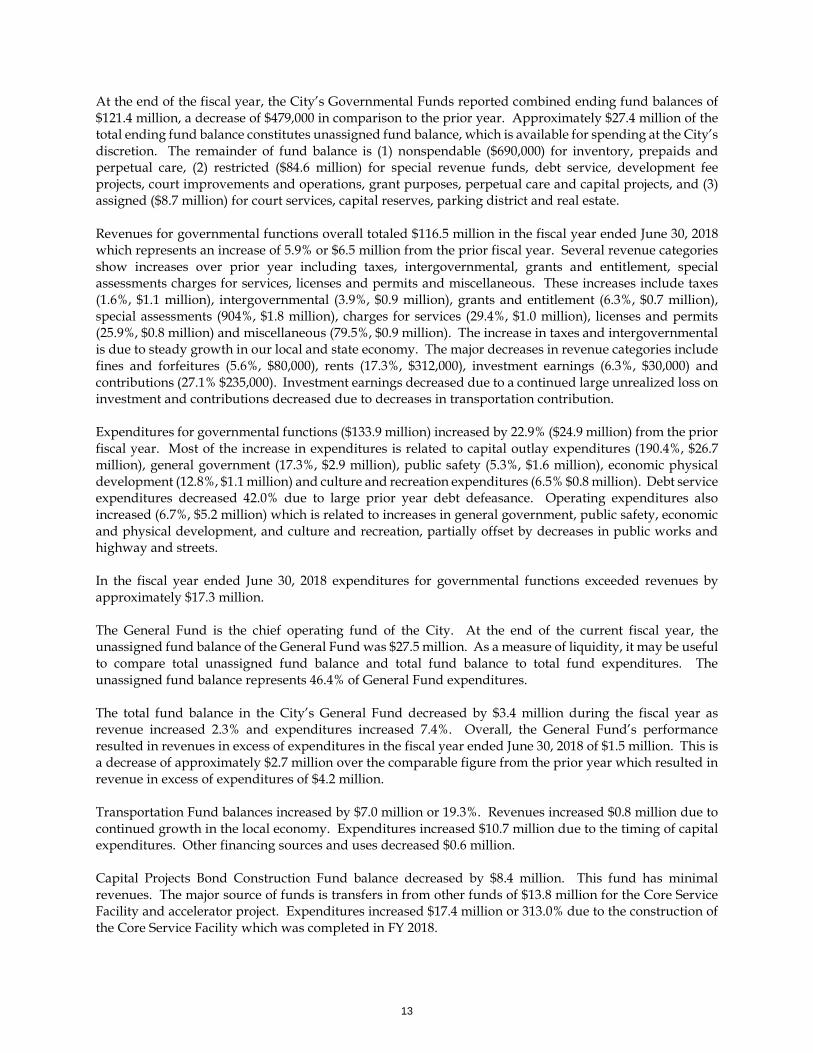
11
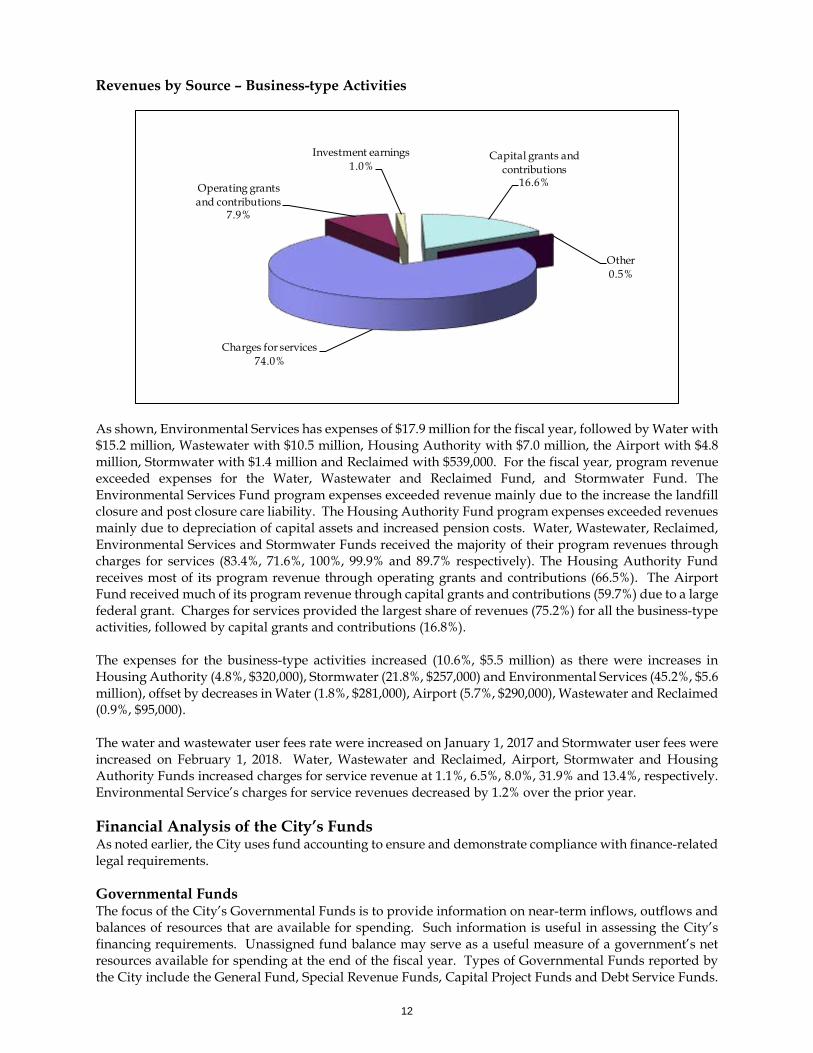
Revenues by Source – Business-type Activities
As shown, Environmental Services has expenses of $17.9 million for the fiscal year, followed by Water with $15.2 million, Wastewater with $10.5 million, Housing Authority with $7.0 million, the Airport with $4.8 million, Stormwater with $1.4 million and Reclaimed with $539,000. For the fiscal year, program revenue exceeded expenses for the Water, Wastewater and Reclaimed Fund, and Stormwater Fund. The Environmental Services Fund program expenses exceeded revenue mainly due to the increase the landfill closure and post closure care liability. The Housing Authority Fund program expenses exceeded revenues mainly due to depreciation of capital assets and increased pension costs. Water, Wastewater, Reclaimed, Environmental Services and Stormwater Funds received the majority of their program revenues through charges for services (83.4%, 71.6%, 100%, 99.9% and 89.7% respectively). The Housing Authority Fund receives most of its program revenue through operating grants and contributions (66.5%). The Airport Fund received much of its program revenue through capital grants and contributions (59.7%) due to a large federal grant. Charges for services provided the largest share of revenues (75.2%) for all the business-type activities, followed by capital grants and contributions (16.8%). The expenses for the business-type activities increased (10.6%, $5.5 million) as there were increases in Housing Authority (4.8%, $320,000), Stormwater (21.8%, $257,000) and Environmental Services (45.2%, $5.6 million), offset by decreases in Water (1.8%, $281,000), Airport (5.7%, $290,000), Wastewater and Reclaimed (0.9%, $95,000). The water and wastewater user fees rate were increased on January 1, 2017 and Stormwater user fees were increased on February 1, 2018. Water, Wastewater and Reclaimed, Airport, Stormwater and Housing Authority Funds increased charges for service revenue at 1.1%, 6.5%, 8.0%, 31.9% and 13.4%, respectively. Environmental Service’s charges for service revenues decreased by 1.2% over the prior year. Financial Analysis of the City’s Funds As noted earlier, the City uses fund accounting to ensure and demonstrate compliance with finance-related legal requirements. Governmental Funds The focus of the City’s Governmental Funds is to provide information on near-term inflows, outflows and balances of resources that are available for spending. Such information is useful in assessing the City’s financing requirements. Unassigned fund balance may serve as a useful measure of a government’s net resources available for spending at the end of the fiscal year. Types of Governmental Funds reported by the City include the General Fund, Special Revenue Funds, Capital Project Funds and Debt Service Funds.
Charges for services74.0%
Operating grants and contributions
7.9%
Investment earnings1.0%
Capital grants and contributions
16.6%
Other0.5%
12
At the end of the fiscal year, the City’s Governmental Funds reported combined ending fund balances of $121.4 million, a decrease of $479,000 in comparison to the prior year. Approximately $27.4 million of the total ending fund balance constitutes unassigned fund balance, which is available for spending at the City’s discretion. The remainder of fund balance is (1) nonspendable ($690,000) for inventory, prepaids and perpetual care, (2) restricted ($84.6 million) for special revenue funds, debt service, development fee projects, court improvements and operations, grant purposes, perpetual care and capital projects, and (3) assigned ($8.7 million) for court services, capital reserves, parking district and real estate. Revenues for governmental functions overall totaled $116.5 million in the fiscal year ended June 30, 2018 which represents an increase of 5.9% or $6.5 million from the prior fiscal year. Several revenue categories show increases over prior year including taxes, intergovernmental, grants and entitlement, special assessments charges for services, licenses and permits and miscellaneous. These increases include taxes (1.6%, $1.1 million), intergovernmental (3.9%, $0.9 million), grants and entitlement (6.3%, $0.7 million), special assessments (904%, $1.8 million), charges for services (29.4%, $1.0 million), licenses and permits (25.9%, $0.8 million) and miscellaneous (79.5%, $0.9 million). The increase in taxes and intergovernmental is due to steady growth in our local and state economy. The major decreases in revenue categories include fines and forfeitures (5.6%, $80,000), rents (17.3%, $312,000), investment earnings (6.3%, $30,000) and contributions (27.1% $235,000). Investment earnings decreased due to a continued large unrealized loss on investment and contributions decreased due to decreases in transportation contribution. Expenditures for governmental functions ($133.9 million) increased by 22.9% ($24.9 million) from the prior fiscal year. Most of the increase in expenditures is related to capital outlay expenditures (190.4%, $26.7 million), general government (17.3%, $2.9 million), public safety (5.3%, $1.6 million), economic physical development (12.8%, $1.1 million) and culture and recreation expenditures (6.5% $0.8 million). Debt service expenditures decreased 42.0% due to large prior year debt defeasance. Operating expenditures also increased (6.7%, $5.2 million) which is related to increases in general government, public safety, economic and physical development, and culture and recreation, partially offset by decreases in public works and highway and streets. In the fiscal year ended June 30, 2018 expenditures for governmental functions exceeded revenues by approximately $17.3 million. The General Fund is the chief operating fund of the City. At the end of the current fiscal year, the unassigned fund balance of the General Fund was $27.5 million. As a measure of liquidity, it may be useful to compare total unassigned fund balance and total fund balance to total fund expenditures. The unassigned fund balance represents 46.4% of General Fund expenditures. The total fund balance in the City’s General Fund decreased by $3.4 million during the fiscal year as revenue increased 2.3% and expenditures increased 7.4%. Overall, the General Fund’s performance resulted in revenues in excess of expenditures in the fiscal year ended June 30, 2018 of $1.5 million. This is a decrease of approximately $2.7 million over the comparable figure from the prior year which resulted in revenue in excess of expenditures of $4.2 million. Transportation Fund balances increased by $7.0 million or 19.3%. Revenues increased $0.8 million due to continued growth in the local economy. Expenditures increased $10.7 million due to the timing of capital expenditures. Other financing sources and uses decreased $0.6 million. Capital Projects Bond Construction Fund balance decreased by $8.4 million. This fund has minimal revenues. The major source of funds is transfers in from other funds of $13.8 million for the Core Service Facility and accelerator project. Expenditures increased $17.4 million or 313.0% due to the construction of the Core Service Facility which was completed in FY 2018.
13
Proprietary Funds The City’s Proprietary Funds provide the same type of information found in the Government-wide Financial Statements, but in more detail. At the end of the fiscal year, the unrestricted component of net position had positive balances for Water and Wastewater, Environmental Services and Stormwater. The Internal Service Fund, which is used to account for risk management and health insurance activities, had an unrestricted net position of $3.3 million. Revenues and transfers exceeded expenses and transfers out in the proprietary funds by $5.0 million for the fiscal year ended in June 30, 2018. Water and Wastewater and Stormwater had growth in their net position for the fiscal year ended June 30, 2018. The Housing Authority Fund and Airport decreases of $186,000 and $287,000, respectively were due to depreciation exceeding grant and other funding for capital replacements. The Environmental Service decrease in net position of $8.6 million was mostly related to an increase in the landfill closure and post closure care cost liability. The major part of the overall increase was related to capital contributions related to grants and external sources ($19.0 million). Budget Highlights The City’s final budget matches the original budget which was approved by Council in June 2017. The City looks at the budget to actual at the division level and no division exceeded its appropriation. There were two revenue transfers that were not budgeted and one transfer that exceeded budget. One transfer was made from the General Fund to Capital Project Fund ($198,000) for the Courthouse construction project and the other was $21,000 from the General Fund to Capital Project Fund for additional funds for the Forest Restoration project. The transfer from General Fund to Capital Project Fund exceeded budget by $37,000 due to additional costs related to the Accelerator construction project. All these transfers were noted and included in the budget documentation during the FY 2018 budget process and adoption. The General Fund was 1.2% ($0.8 million) under the final budgeted total revenues primarily due to grants and entitlements, which was under budget by $1.9 million, rents by $0.7 million and contributions by $0.8 million offset by taxes and licenses and permits being over budget by $0.9 million and $0.8 million, respectively. Licenses and permits exceeded budget due to conservative budget estimates and several large commercial construction projects in fiscal year 2018. Grants and entitlements were under budget mainly due to the City not receiving several larger grants for Fire and Police and not receiving grants at the level budgeted which included the SAFER firefighter grant, COPS hiring grant and Brownfield Assessment grant. Expenditures are under budget in all divisions due to controlled spending and carryover of some capital projects. The divisions that are under budget by larger amounts are related to capital purchases or projects budgeted but not completed. Both transfers in and transfers out are less than budget as many transfers are based on the actual year end expenditure, most significant of which is the budgeted transfer from the General Fund to the Stormwater Fund of $1.7 million for the Rio de Flag Flood Control Project, of which only $484,000 transferred at year end.
14
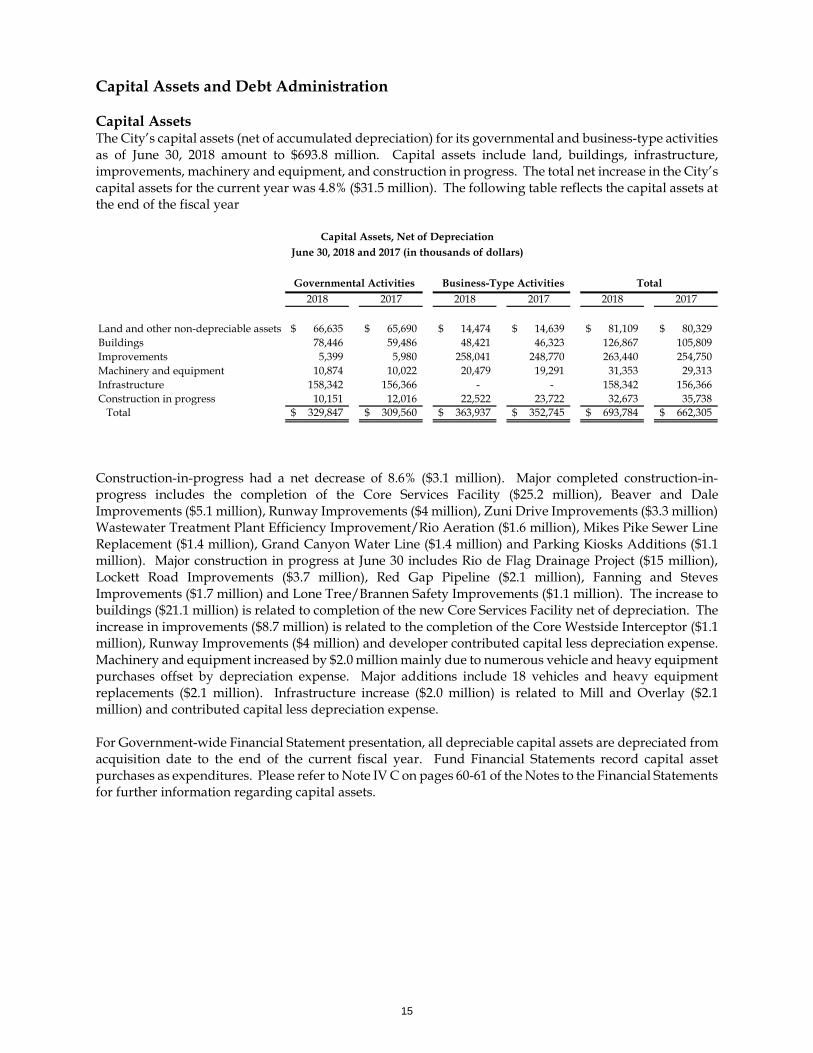
Capital Assets and Debt Administration Capital Assets The City’s capital assets (net of accumulated depreciation) for its governmental and business-type activities as of June 30, 2018 amount to $693.8 million. Capital assets include land, buildings, infrastructure, improvements, machinery and equipment, and construction in progress. The total net increase in the City’s capital assets for the current year was 4.8% ($31.5 million). The following table reflects the capital assets at the end of the fiscal year
Construction-in-progress had a net decrease of 8.6% ($3.1 million). Major completed construction-in-progress includes the completion of the Core Services Facility ($25.2 million), Beaver and Dale Improvements ($5.1 million), Runway Improvements ($4 million), Zuni Drive Improvements ($3.3 million) Wastewater Treatment Plant Efficiency Improvement/Rio Aeration ($1.6 million), Mikes Pike Sewer Line Replacement ($1.4 million), Grand Canyon Water Line ($1.4 million) and Parking Kiosks Additions ($1.1 million). Major construction in progress at June 30 includes Rio de Flag Drainage Project ($15 million), Lockett Road Improvements ($3.7 million), Red Gap Pipeline ($2.1 million), Fanning and Steves Improvements ($1.7 million) and Lone Tree/Brannen Safety Improvements ($1.1 million). The increase to buildings ($21.1 million) is related to completion of the new Core Services Facility net of depreciation. The increase in improvements ($8.7 million) is related to the completion of the Core Westside Interceptor ($1.1 million), Runway Improvements ($4 million) and developer contributed capital less depreciation expense. Machinery and equipment increased by $2.0 million mainly due to numerous vehicle and heavy equipment purchases offset by depreciation expense. Major additions include 18 vehicles and heavy equipment replacements ($2.1 million). Infrastructure increase ($2.0 million) is related to Mill and Overlay ($2.1 million) and contributed capital less depreciation expense. For Government-wide Financial Statement presentation, all depreciable capital assets are depreciated from acquisition date to the end of the current fiscal year. Fund Financial Statements record capital asset purchases as expenditures. Please refer to Note IV C on pages 60-61 of the Notes to the Financial Statements for further information regarding capital assets.
2018 2017 2018 2017 2018 2017
Land and other non-depreciable assets 66,635$ 65,690$ 14,474$ 14,639$ 81,109$ 80,329$ Buildings 78,446 59,486 48,421 46,323 126,867 105,809 Improvements 5,399 5,980 258,041 248,770 263,440 254,750 Machinery and equipment 10,874 10,022 20,479 19,291 31,353 29,313 Infrastructure 158,342 156,366 - - 158,342 156,366 Construction in progress 10,151 12,016 22,522 23,722 32,673 35,738 Total 329,847$ 309,560$ 363,937$ 352,745$ 693,784$ 662,305$
Capital Assets, Net of DepreciationJune 30, 2018 and 2017 (in thousands of dollars)
TotalGovernmental Activities Business-Type Activities
15
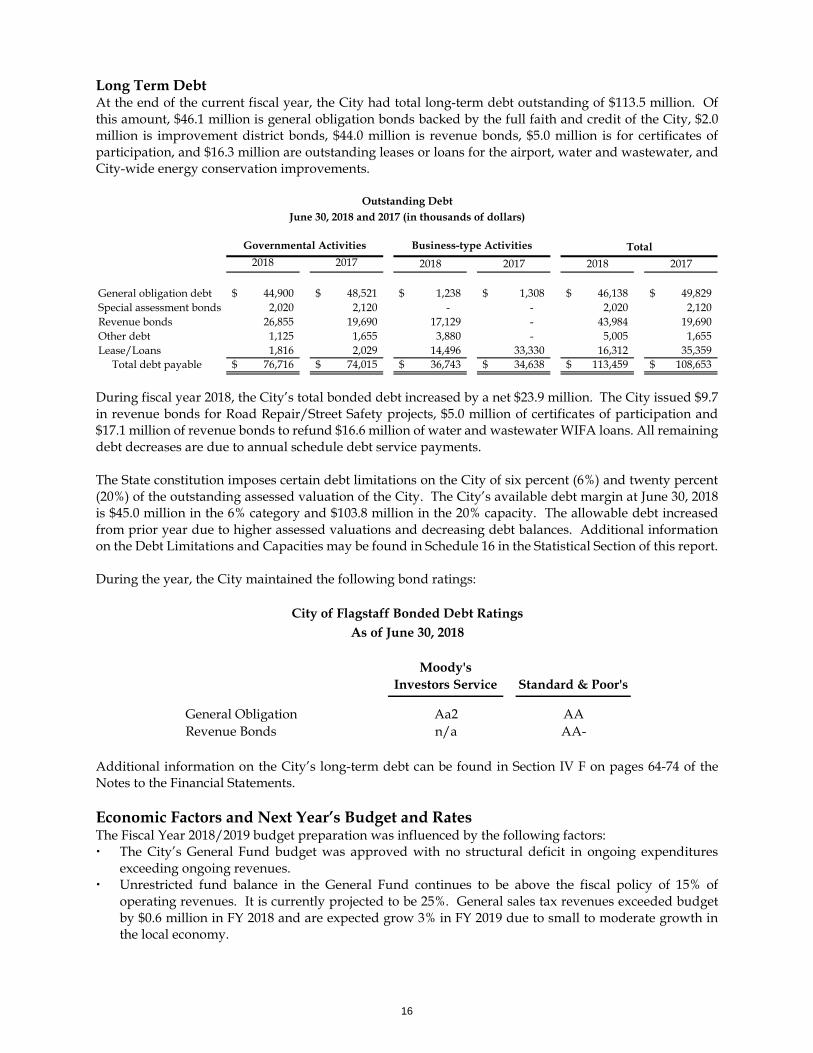
Long Term Debt At the end of the current fiscal year, the City had total long-term debt outstanding of $113.5 million. Of this amount, $46.1 million is general obligation bonds backed by the full faith and credit of the City, $2.0 million is improvement district bonds, $44.0 million is revenue bonds, $5.0 million is for certificates of participation, and $16.3 million are outstanding leases or loans for the airport, water and wastewater, and City-wide energy conservation improvements.
During fiscal year 2018, the City’s total bonded debt increased by a net $23.9 million. The City issued $9.7 in revenue bonds for Road Repair/Street Safety projects, $5.0 million of certificates of participation and $17.1 million of revenue bonds to refund $16.6 million of water and wastewater WIFA loans. All remaining debt decreases are due to annual schedule debt service payments. The State constitution imposes certain debt limitations on the City of six percent (6%) and twenty percent (20%) of the outstanding assessed valuation of the City. The City’s available debt margin at June 30, 2018 is $45.0 million in the 6% category and $103.8 million in the 20% capacity. The allowable debt increased from prior year due to higher assessed valuations and decreasing debt balances. Additional information on the Debt Limitations and Capacities may be found in Schedule 16 in the Statistical Section of this report. During the year, the City maintained the following bond ratings:
Additional information on the City’s long-term debt can be found in Section IV F on pages 64-74 of the Notes to the Financial Statements. Economic Factors and Next Year’s Budget and Rates The Fiscal Year 2018/2019 budget preparation was influenced by the following factors: The City’s General Fund budget was approved with no structural deficit in ongoing expenditures
exceeding ongoing revenues. Unrestricted fund balance in the General Fund continues to be above the fiscal policy of 15% of
operating revenues. It is currently projected to be 25%. General sales tax revenues exceeded budget by $0.6 million in FY 2018 and are expected grow 3% in FY 2019 due to small to moderate growth in the local economy.
Outstanding DebtJune 30, 2018 and 2017 (in thousands of dollars)
2018 2017 2018 2017 2018 2017
General obligation debt 44,900$ 48,521$ 1,238$ 1,308$ 46,138$ 49,829$ Special assessment bonds 2,020 2,120 - - 2,020 2,120 Revenue bonds 26,855 19,690 17,129 - 43,984 19,690 Other debt 1,125 1,655 3,880 - 5,005 1,655 Lease/Loans 1,816 2,029 14,496 33,330 16,312 35,359 Total debt payable 76,716$ 74,015$ 36,743$ 34,638$ 113,459$ 108,653$
Governmental Activities Business-type Activities Total
Moody's Investors Service Standard & Poor's
General Obligation Aa2 AARevenue Bonds n/a AA-
City of Flagstaff Bonded Debt RatingsAs of June 30, 2018
16
Building permits exceeded budget by $0.8 million. However, we remain conservative in our projections for FY 2019 as we rely on these types of revenues as a one-time impact rather than an ongoing source of funding.
The focus of the FY 2019 budget was for Council Priorities related to economic development, affordable housing, social justice, transportation and other public infrastructure building and zoning/regional plan, climate change, water conservation, environmental and natural resources, personnel, community outreach, town and gown and code compliance.
o The FY 2019 budget includes a three-year plan to transition to market based pay for all employees, new positions related to capacity needs, infrastructure and economic development funding and services to support the most vulnerable.
o Some of the larger items are $23.0 million for transportation improvements, $12.5 million for Courthouse construction and $11.2 million programmed for the water and wastewater infrastructure construction.
The total authorized positions increased by 10.5 positions. Public Safety pension (PSPRS) funding continues to be major funding issue. Public Safety pension
required contributions to be increased over $1.2 million in FY 2019 due to required pension contribution rate increases.
The City continues to monitor the State legislature to be aware of potential budget impacts on cities. Property assessments continue to increase at a slow, steady rate. Primary assessed values increased by
an average of 6.1%. The City increase the primary property tax revenue by approximately $530,000 in FY 2019 to the maximum allowable per State statutes. The secondary property tax rates remain flat.
The City continues to pursue federal and state grant dollars to enhance the local economy. The City continues implementation of the electronic information sharing technology to facilitate
transparency in service provision. The City will continue to work on the Flagstaff Watershed Protection Program which was approved
by voters. Requests for Information The Financial Report is designed to provide a general overview of the City’s finances for all of those with an interest in the government’s finances. If you have questions about this report or need additional financial information, contact: City of Flagstaff Finance Section 211 West Aspen Avenue Flagstaff, AZ 86001 Main (928) 213-2000 Arizona Relay 7-1-1
17

18
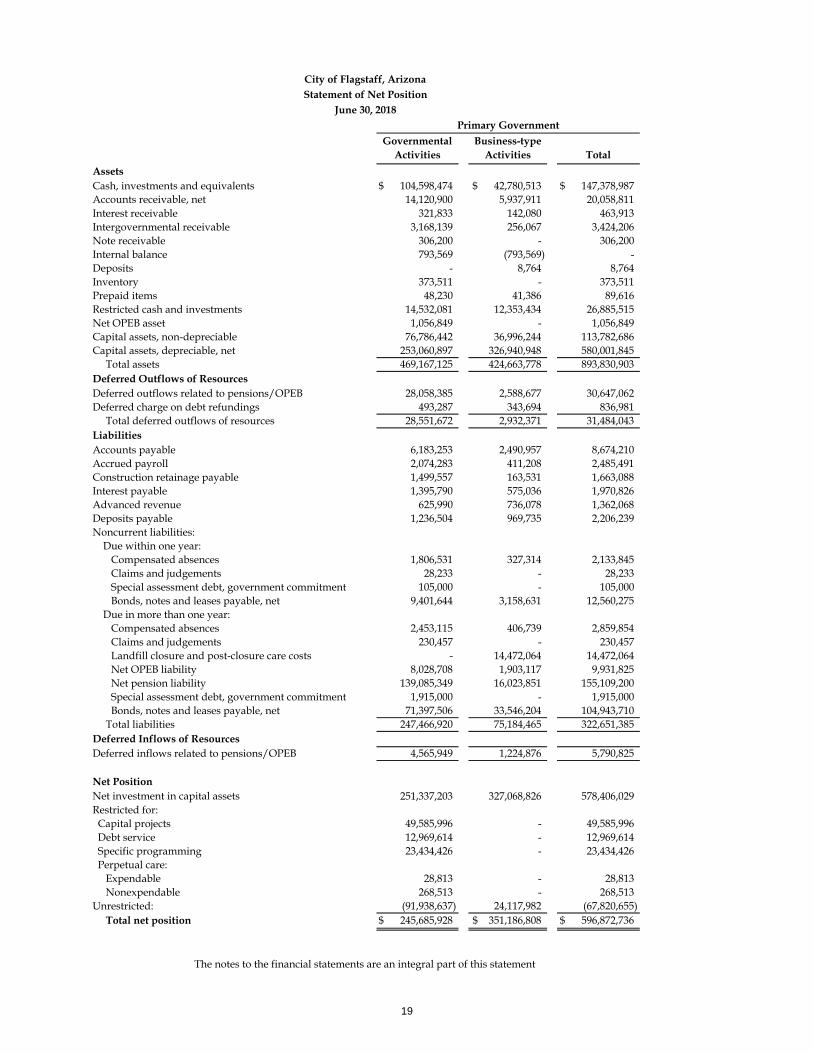
Governmental Activities
Business-type Activities Total
AssetsCash, investments and equivalents 104,598,474$ 42,780,513$ 147,378,987$ Accounts receivable, net 14,120,900 5,937,911 20,058,811Interest receivable 321,833 142,080 463,913Intergovernmental receivable 3,168,139 256,067 3,424,206Note receivable 306,200 - 306,200Internal balance 793,569 (793,569) -Deposits - 8,764 8,764Inventory 373,511 - 373,511Prepaid items 48,230 41,386 89,616Restricted cash and investments 14,532,081 12,353,434 26,885,515Net OPEB asset 1,056,849 - 1,056,849Capital assets, non-depreciable 76,786,442 36,996,244 113,782,686Capital assets, depreciable, net 253,060,897 326,940,948 580,001,845 Total assets 469,167,125 424,663,778 893,830,903Deferred Outflows of ResourcesDeferred outflows related to pensions/OPEB 28,058,385 2,588,677 30,647,062Deferred charge on debt refundings 493,287 343,694 836,981 Total deferred outflows of resources 28,551,672 2,932,371 31,484,043LiabilitiesAccounts payable 6,183,253 2,490,957 8,674,210Accrued payroll 2,074,283 411,208 2,485,491Construction retainage payable 1,499,557 163,531 1,663,088Interest payable 1,395,790 575,036 1,970,826Advanced revenue 625,990 736,078 1,362,068Deposits payable 1,236,504 969,735 2,206,239Noncurrent liabilities: Due within one year: Compensated absences 1,806,531 327,314 2,133,845 Claims and judgements 28,233 - 28,233 Special assessment debt, government commitment 105,000 - 105,000 Bonds, notes and leases payable, net 9,401,644 3,158,631 12,560,275 Due in more than one year: Compensated absences 2,453,115 406,739 2,859,854 Claims and judgements 230,457 - 230,457 Landfill closure and post-closure care costs - 14,472,064 14,472,064 Net OPEB liability 8,028,708 1,903,117 9,931,825 Net pension liability 139,085,349 16,023,851 155,109,200 Special assessment debt, government commitment 1,915,000 - 1,915,000 Bonds, notes and leases payable, net 71,397,506 33,546,204 104,943,710 Total liabilities 247,466,920 75,184,465 322,651,385Deferred Inflows of ResourcesDeferred inflows related to pensions/OPEB 4,565,949 1,224,876 5,790,825
Net PositionNet investment in capital assets 251,337,203 327,068,826 578,406,029Restricted for: Capital projects 49,585,996 - 49,585,996 Debt service 12,969,614 - 12,969,614 Specific programming 23,434,426 - 23,434,426 Perpetual care: Expendable 28,813 - 28,813 Nonexpendable 268,513 - 268,513Unrestricted: (91,938,637) 24,117,982 (67,820,655) Total net position 245,685,928$ 351,186,808$ 596,872,736$
Primary Government
City of Flagstaff, ArizonaStatement of Net Position
June 30, 2018
The notes to the financial statements are an integral part of this statement
19
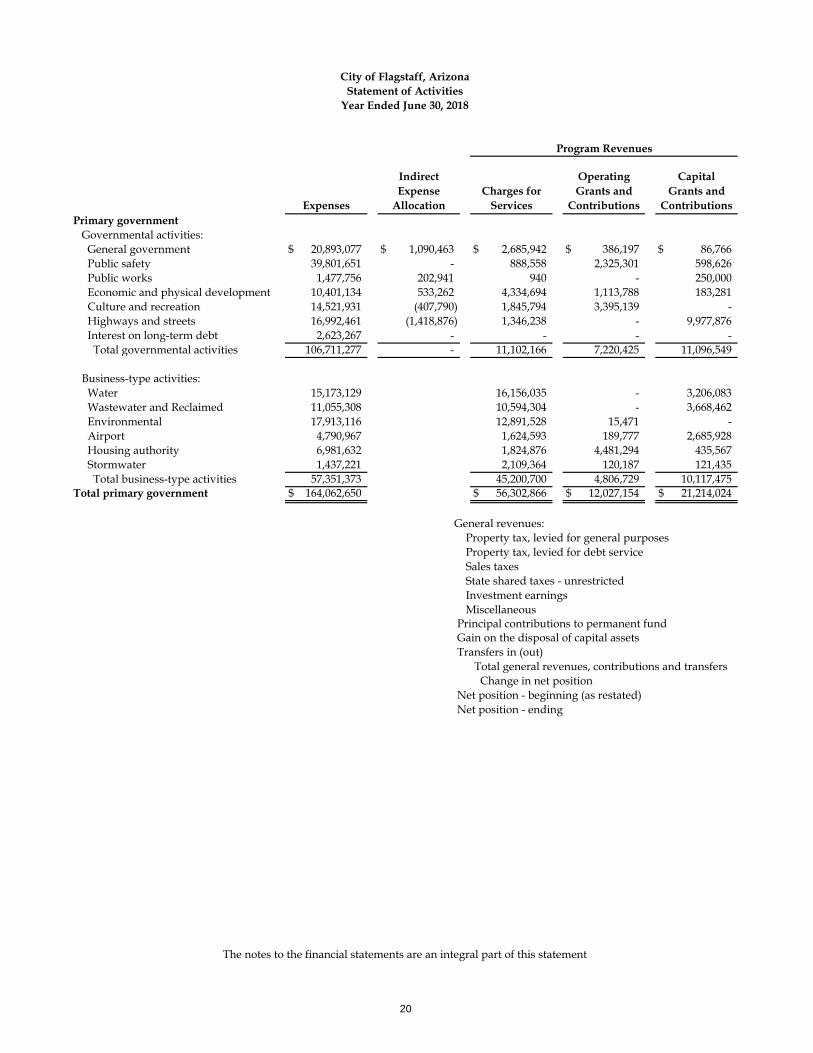
Expenses
Indirect Expense
AllocationCharges for
Services
Operating Grants and
Contributions
Capital Grants and
ContributionsPrimary government Governmental activities: General government 20,893,077$ 1,090,463$ 2,685,942$ 386,197$ 86,766$ Public safety 39,801,651 - 888,558 2,325,301 598,626 Public works 1,477,756 202,941 940 - 250,000 Economic and physical development 10,401,134 533,262 4,334,694 1,113,788 183,281 Culture and recreation 14,521,931 (407,790) 1,845,794 3,395,139 - Highways and streets 16,992,461 (1,418,876) 1,346,238 - 9,977,876 Interest on long-term debt 2,623,267 - - - - Total governmental activities 106,711,277 - 11,102,166 7,220,425 11,096,549
Business-type activities: Water 15,173,129 16,156,035 - 3,206,083 Wastewater and Reclaimed 11,055,308 10,594,304 - 3,668,462 Environmental 17,913,116 12,891,528 15,471 - Airport 4,790,967 1,624,593 189,777 2,685,928 Housing authority 6,981,632 1,824,876 4,481,294 435,567 Stormwater 1,437,221 2,109,364 120,187 121,435 Total business-type activities 57,351,373 45,200,700 4,806,729 10,117,475Total primary government 164,062,650$ 56,302,866$ 12,027,154$ 21,214,024$
The notes to the financial statements are an integral part of this statement
Net position - beginning (as restated) Net position - ending
Principal contributions to permanent fund
Transfers in (out) Total general revenues, contributions and transfers Change in net position
Gain on the disposal of capital assets
Property tax, levied for debt service Sales taxes State shared taxes - unrestricted Investment earnings Miscellaneous
Program Revenues
General revenues: Property tax, levied for general purposes
City of Flagstaff, ArizonaStatement of Activities
Year Ended June 30, 2018
20
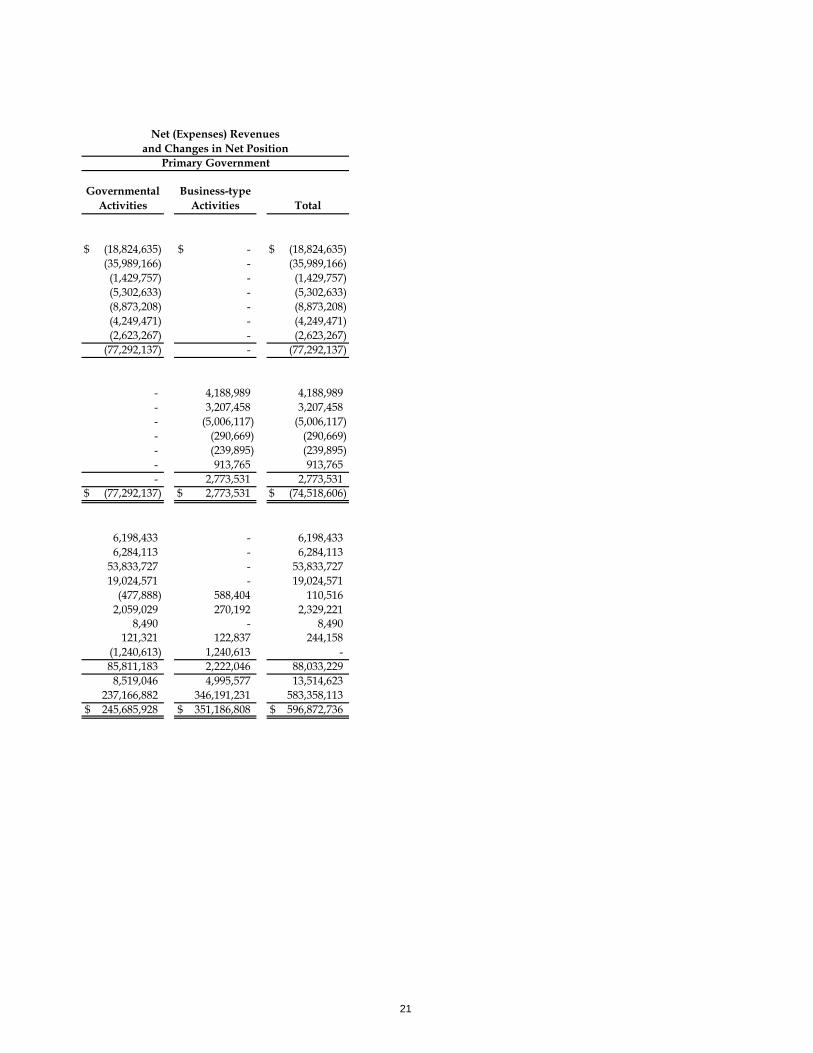
Governmental Activities
Business-type Activities Total
(18,824,635)$ -$ (18,824,635)$ (35,989,166) - (35,989,166)(1,429,757) - (1,429,757)(5,302,633) - (5,302,633)(8,873,208) - (8,873,208)(4,249,471) - (4,249,471)(2,623,267) - (2,623,267)
(77,292,137) - (77,292,137)
- 4,188,989 4,188,989- 3,207,458 3,207,458- (5,006,117) (5,006,117)- (290,669) (290,669)- (239,895) (239,895)- 913,765 913,765- 2,773,531 2,773,531
(77,292,137)$ 2,773,531$ (74,518,606)$
6,198,433 - 6,198,4336,284,113 - 6,284,113
53,833,727 - 53,833,72719,024,571 - 19,024,571
(477,888) 588,404 110,5162,059,029 270,192 2,329,221
8,490 - 8,490121,321 122,837 244,158
(1,240,613) 1,240,613 -85,811,183 2,222,046 88,033,2298,519,046 4,995,577 13,514,623
237,166,882 346,191,231 583,358,113245,685,928$ 351,186,808$ 596,872,736$
Primary Government
Net (Expenses) Revenues and Changes in Net Position
21
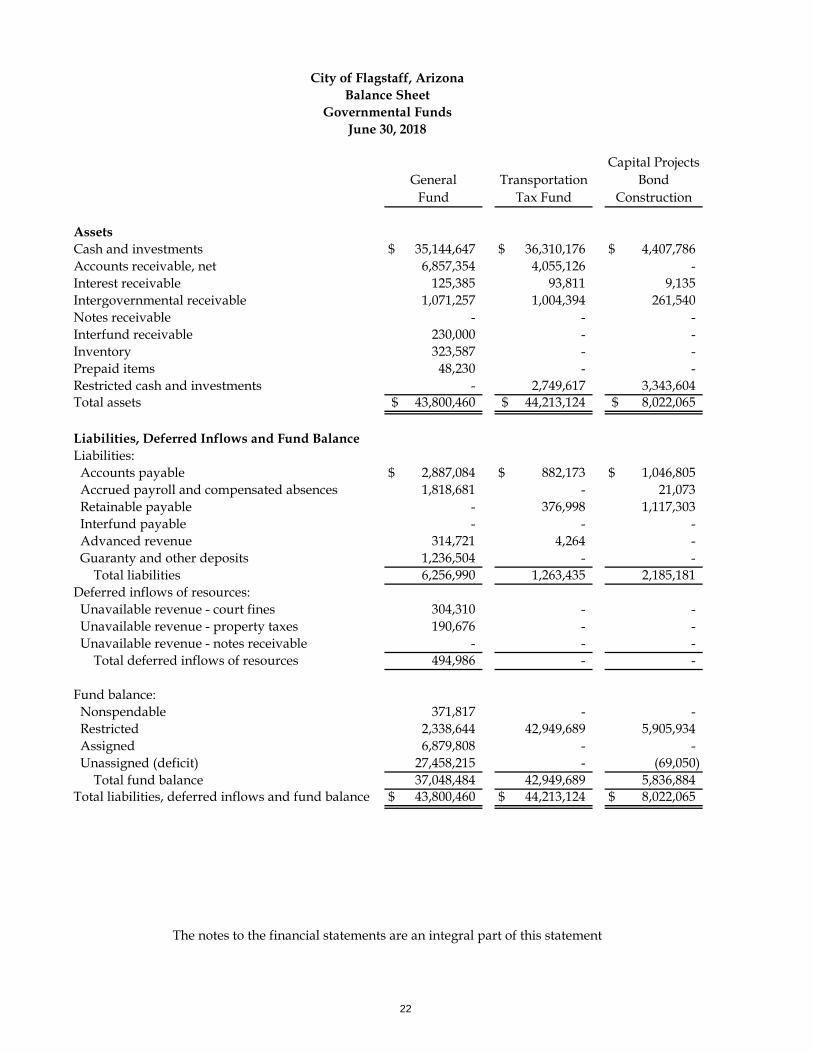
General Fund
Transportation Tax Fund
Capital Projects Bond
Construction
AssetsCash and investments 35,144,647$ 36,310,176$ 4,407,786$ Accounts receivable, net 6,857,354 4,055,126 -Interest receivable 125,385 93,811 9,135Intergovernmental receivable 1,071,257 1,004,394 261,540Notes receivable - - -Interfund receivable 230,000 - -Inventory 323,587 - -Prepaid items 48,230 - -Restricted cash and investments - 2,749,617 3,343,604Total assets 43,800,460$ 44,213,124$ 8,022,065$
Liabilities, Deferred Inflows and Fund BalanceLiabilities: Accounts payable 2,887,084$ 882,173$ 1,046,805$ Accrued payroll and compensated absences 1,818,681 - 21,073 Retainable payable - 376,998 1,117,303 Interfund payable - - - Advanced revenue 314,721 4,264 - Guaranty and other deposits 1,236,504 - - Total liabilities 6,256,990 1,263,435 2,185,181Deferred inflows of resources: Unavailable revenue - court fines 304,310 - - Unavailable revenue - property taxes 190,676 - - Unavailable revenue - notes receivable - - - Total deferred inflows of resources 494,986 - -
Fund balance: Nonspendable 371,817 - - Restricted 2,338,644 42,949,689 5,905,934 Assigned 6,879,808 - - Unassigned (deficit) 27,458,215 - (69,050) Total fund balance 37,048,484 42,949,689 5,836,884Total liabilities, deferred inflows and fund balance 43,800,460$ 44,213,124$ 8,022,065$
City of Flagstaff, ArizonaBalance Sheet
Governmental FundsJune 30, 2018
The notes to the financial statements are an integral part of this statement
22

Other Governmental
Funds
Total Governmental
Funds
25,071,785$ 100,934,394$
3,158,503 14,070,98385,007 313,338
830,948 3,168,139306,200 306,200
- 230,00049,924 373,511
- 48,2308,438,860 14,532,081
37,941,227$ 133,976,876$
1,221,700$ 6,037,762$ 234,529 2,074,283
5,256 1,499,557230,000 230,000306,900 625,885
- 1,236,5041,998,385 11,703,991
- 304,310- 190,676
349,728 349,728349,728 844,714
318,437 690,254
33,411,609 84,605,8761,864,086 8,743,894
(1,018) 27,388,14735,593,114 121,428,17137,941,227$ 133,976,876$
23

24
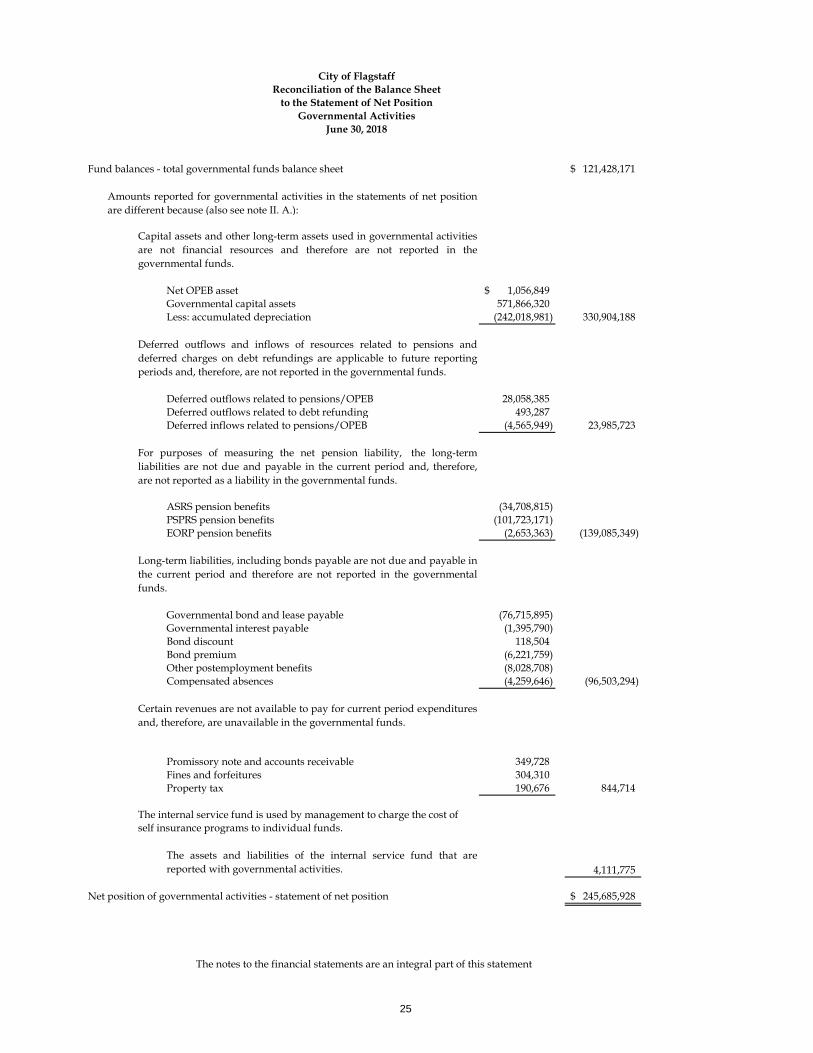
Fund balances - total governmental funds balance sheet 121,428,171$
Net OPEB asset 1,056,849$ Governmental capital assets 571,866,320 Less: accumulated depreciation (242,018,981) 330,904,188
Deferred outflows related to pensions/OPEB 28,058,385 Deferred outflows related to debt refunding 493,287 Deferred inflows related to pensions/OPEB (4,565,949) 23,985,723
ASRS pension benefits (34,708,815) PSPRS pension benefits (101,723,171) EORP pension benefits (2,653,363) (139,085,349)
Governmental bond and lease payable (76,715,895) Governmental interest payable (1,395,790) Bond discount 118,504 Bond premium (6,221,759) Other postemployment benefits (8,028,708) Compensated absences (4,259,646) (96,503,294)
Promissory note and accounts receivable 349,728 Fines and forfeitures 304,310 Property tax 190,676 844,714
The internal service fund is used by management to charge the cost ofself insurance programs to individual funds.
4,111,775
Net position of governmental activities - statement of net position 245,685,928$
The notes to the financial statements are an integral part of this statement
June 30, 2018
City of FlagstaffReconciliation of the Balance Sheet
to the Statement of Net PositionGovernmental Activities
Amounts reported for governmental activities in the statements of net positionare different because (also see note II. A.):
Capital assets and other long-term assets used in governmental activitiesare not financial resources and therefore are not reported in thegovernmental funds.
Deferred outflows and inflows of resources related to pensions anddeferred charges on debt refundings are applicable to future reportingperiods and, therefore, are not reported in the governmental funds.
For purposes of measuring the net pension liability, the long-termliabilities are not due and payable in the current period and, therefore,are not reported as a liability in the governmental funds.
Long-term liabilities, including bonds payable are not due and payable inthe current period and therefore are not reported in the governmentalfunds.
Certain revenues are not available to pay for current period expendituresand, therefore, are unavailable in the governmental funds.
The assets and liabilities of the internal service fund that arereported with governmental activities.
25
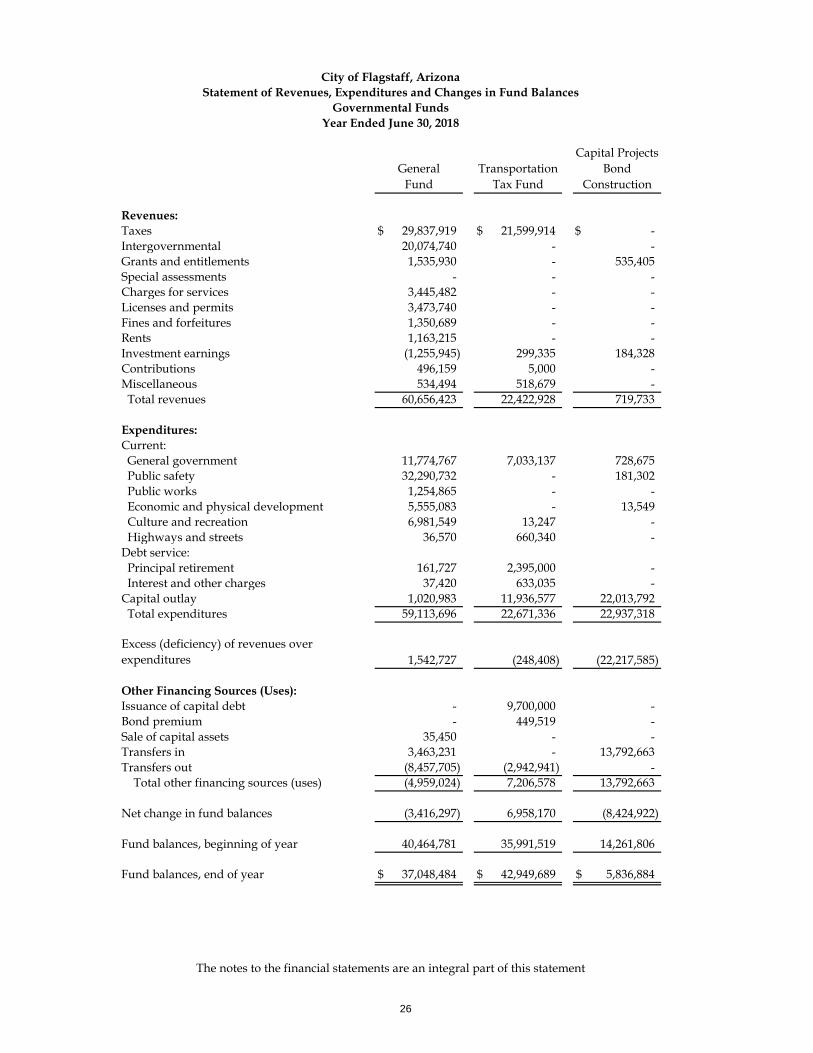
General Fund
Transportation Tax Fund
Capital Projects Bond
Construction Revenues:Taxes 29,837,919$ 21,599,914$ -$ Intergovernmental 20,074,740 - -Grants and entitlements 1,535,930 - 535,405Special assessments - - -Charges for services 3,445,482 - -Licenses and permits 3,473,740 - -Fines and forfeitures 1,350,689 - -Rents 1,163,215 - -Investment earnings (1,255,945) 299,335 184,328Contributions 496,159 5,000 -Miscellaneous 534,494 518,679 - Total revenues 60,656,423 22,422,928 719,733
Expenditures:Current: General government 11,774,767 7,033,137 728,675 Public safety 32,290,732 - 181,302 Public works 1,254,865 - - Economic and physical development 5,555,083 - 13,549 Culture and recreation 6,981,549 13,247 - Highways and streets 36,570 660,340 -Debt service: Principal retirement 161,727 2,395,000 - Interest and other charges 37,420 633,035 -Capital outlay 1,020,983 11,936,577 22,013,792 Total expenditures 59,113,696 22,671,336 22,937,318
Excess (deficiency) of revenues over expenditures 1,542,727 (248,408) (22,217,585)
Other Financing Sources (Uses):Issuance of capital debt - 9,700,000 -Bond premium - 449,519 -Sale of capital assets 35,450 - -Transfers in 3,463,231 - 13,792,663Transfers out (8,457,705) (2,942,941) - Total other financing sources (uses) (4,959,024) 7,206,578 13,792,663
Net change in fund balances (3,416,297) 6,958,170 (8,424,922)
Fund balances, beginning of year 40,464,781 35,991,519 14,261,806
Fund balances, end of year 37,048,484$ 42,949,689$ 5,836,884$
The notes to the financial statements are an integral part of this statement
City of Flagstaff, ArizonaStatement of Revenues, Expenditures and Changes in Fund Balances
Governmental FundsYear Ended June 30, 2018
26
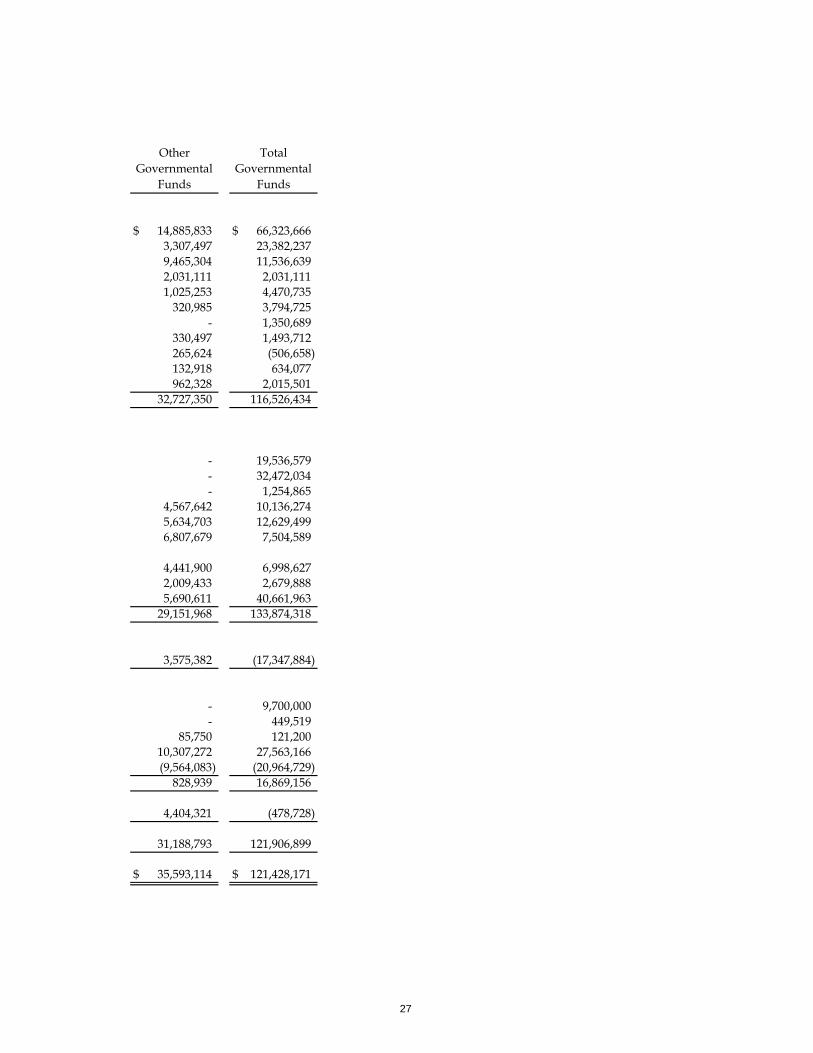
Other Governmental
Funds
Total Governmental
Funds
14,885,833$ 66,323,666$ 3,307,497 23,382,2379,465,304 11,536,6392,031,111 2,031,1111,025,253 4,470,735
320,985 3,794,725- 1,350,689
330,497 1,493,712265,624 (506,658)132,918 634,077962,328 2,015,501
32,727,350 116,526,434
- 19,536,579- 32,472,034- 1,254,865
4,567,642 10,136,2745,634,703 12,629,4996,807,679 7,504,589
4,441,900 6,998,6272,009,433 2,679,8885,690,611 40,661,963
29,151,968 133,874,318
3,575,382 (17,347,884)
- 9,700,000- 449,519
85,750 121,20010,307,272 27,563,166(9,564,083) (20,964,729)
828,939 16,869,156
4,404,321 (478,728)
31,188,793 121,906,899
35,593,114$ 121,428,171$
27
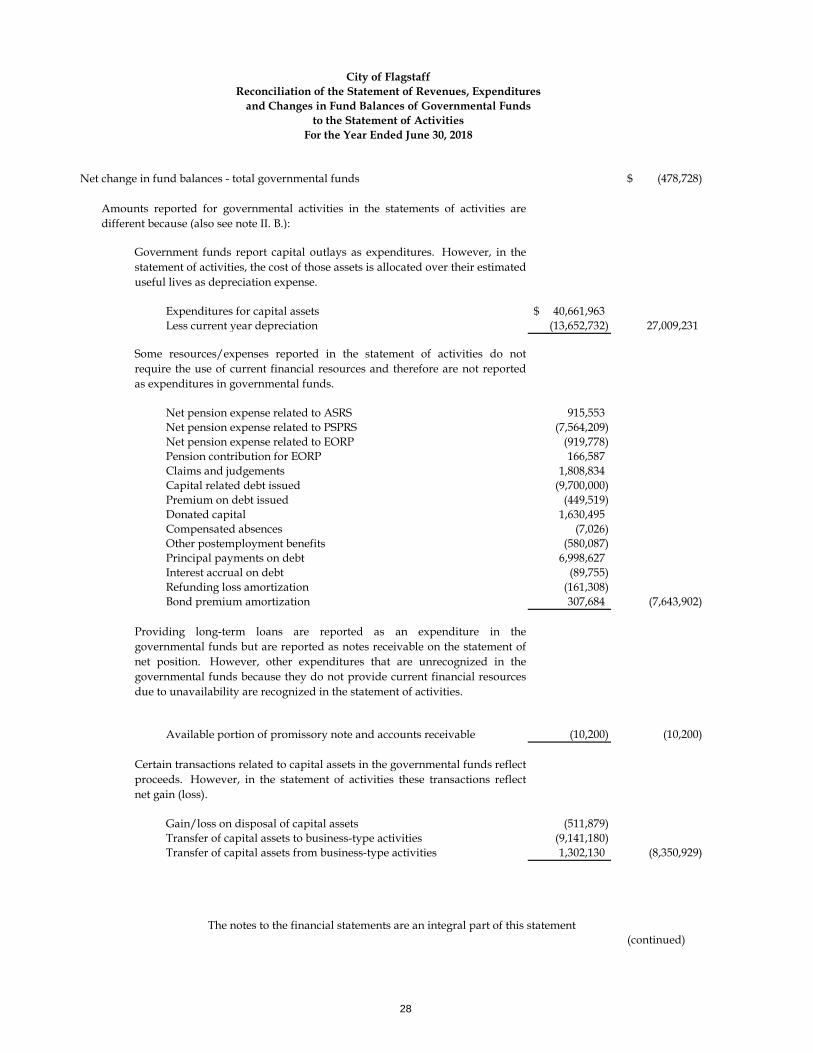
Net change in fund balances - total governmental funds (478,728)$
Expenditures for capital assets 40,661,963$ Less current year depreciation (13,652,732) 27,009,231
Net pension expense related to ASRS 915,553 Net pension expense related to PSPRS (7,564,209) Net pension expense related to EORP (919,778) Pension contribution for EORP 166,587 Claims and judgements 1,808,834 Capital related debt issued (9,700,000) Premium on debt issued (449,519) Donated capital 1,630,495 Compensated absences (7,026) Other postemployment benefits (580,087) Principal payments on debt 6,998,627 Interest accrual on debt (89,755) Refunding loss amortization (161,308) Bond premium amortization 307,684 (7,643,902)
Available portion of promissory note and accounts receivable (10,200) (10,200)
Gain/loss on disposal of capital assets (511,879) Transfer of capital assets to business-type activities (9,141,180) Transfer of capital assets from business-type activities 1,302,130 (8,350,929)
(continued)
For the Year Ended June 30, 2018
The notes to the financial statements are an integral part of this statement
City of FlagstaffReconciliation of the Statement of Revenues, Expenditures
and Changes in Fund Balances of Governmental Fundsto the Statement of Activities
Amounts reported for governmental activities in the statements of activities aredifferent because (also see note II. B.):
Government funds report capital outlays as expenditures. However, in thestatement of activities, the cost of those assets is allocated over their estimateduseful lives as depreciation expense.
Some resources/expenses reported in the statement of activities do notrequire the use of current financial resources and therefore are not reportedas expenditures in governmental funds.
Providing long-term loans are reported as an expenditure in thegovernmental funds but are reported as notes receivable on the statement ofnet position. However, other expenditures that are unrecognized in thegovernmental funds because they do not provide current financial resourcesdue to unavailability are recognized in the statement of activities.
Certain transactions related to capital assets in the governmental funds reflectproceeds. However, in the statement of activities these transactions reflectnet gain (loss).
28
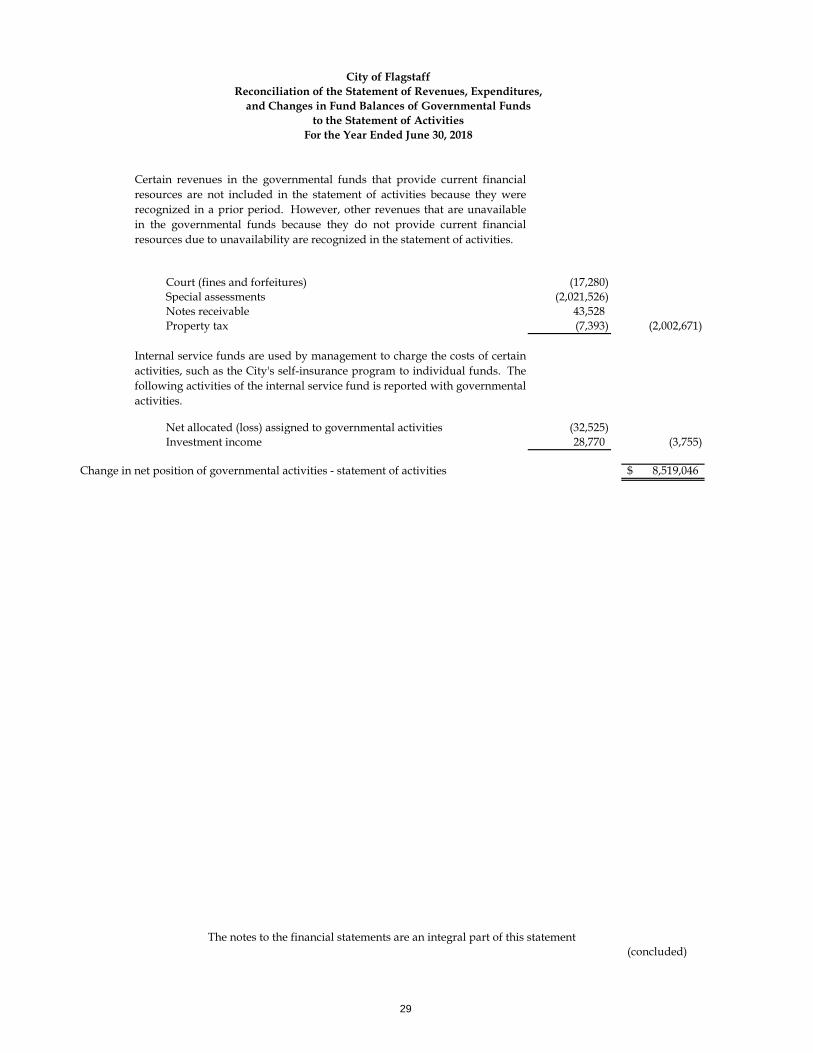
Court (fines and forfeitures) (17,280) Special assessments (2,021,526) Notes receivable 43,528 Property tax (7,393) (2,002,671)
Net allocated (loss) assigned to governmental activities (32,525) Investment income 28,770 (3,755)
Change in net position of governmental activities - statement of activities 8,519,046$
(concluded)The notes to the financial statements are an integral part of this statement
For the Year Ended June 30, 2018
City of FlagstaffReconciliation of the Statement of Revenues, Expenditures,
and Changes in Fund Balances of Governmental Funds
Certain revenues in the governmental funds that provide current financialresources are not included in the statement of activities because they wererecognized in a prior period. However, other revenues that are unavailablein the governmental funds because they do not provide current financialresources due to unavailability are recognized in the statement of activities.
Internal service funds are used by management to charge the costs of certainactivities, such as the City's self-insurance program to individual funds. Thefollowing activities of the internal service fund is reported with governmentalactivities.
to the Statement of Activities
29
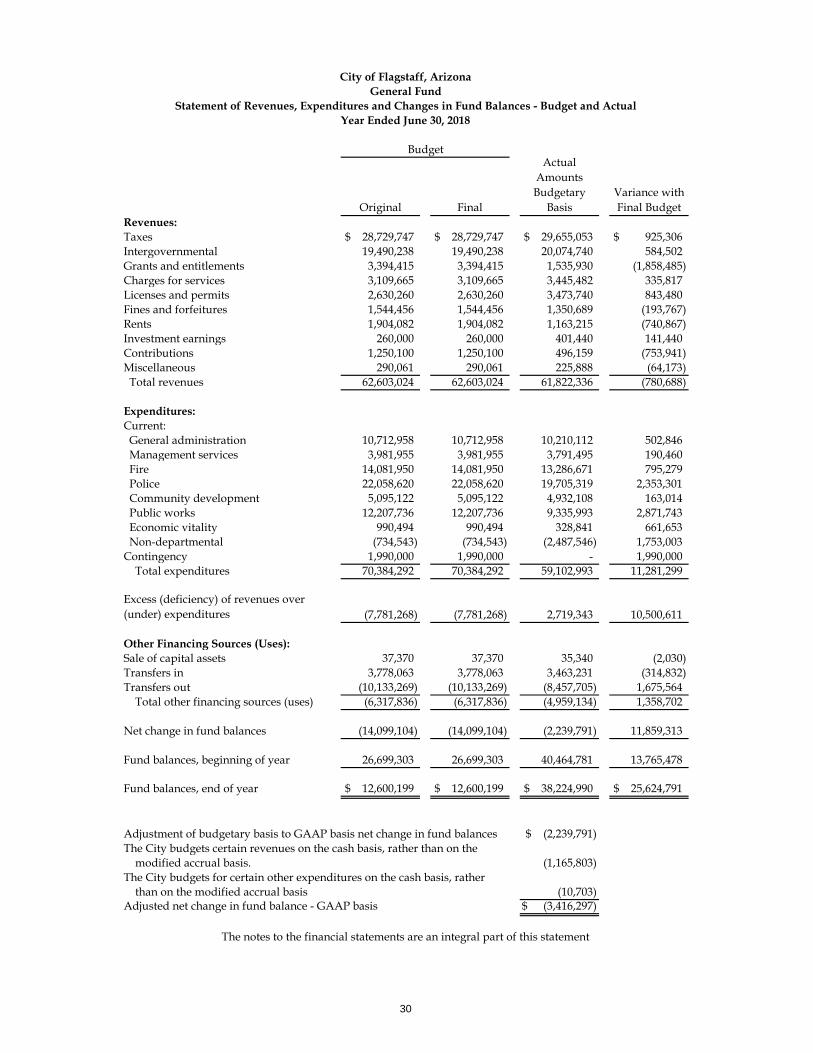
Original Final
Actual Amounts Budgetary
BasisVariance with Final Budget
Revenues:Taxes 28,729,747$ 28,729,747$ 29,655,053$ 925,306$ Intergovernmental 19,490,238 19,490,238 20,074,740 584,502Grants and entitlements 3,394,415 3,394,415 1,535,930 (1,858,485)Charges for services 3,109,665 3,109,665 3,445,482 335,817Licenses and permits 2,630,260 2,630,260 3,473,740 843,480Fines and forfeitures 1,544,456 1,544,456 1,350,689 (193,767)Rents 1,904,082 1,904,082 1,163,215 (740,867)Investment earnings 260,000 260,000 401,440 141,440Contributions 1,250,100 1,250,100 496,159 (753,941)Miscellaneous 290,061 290,061 225,888 (64,173) Total revenues 62,603,024 62,603,024 61,822,336 (780,688)
Expenditures:Current: General administration 10,712,958 10,712,958 10,210,112 502,846 Management services 3,981,955 3,981,955 3,791,495 190,460 Fire 14,081,950 14,081,950 13,286,671 795,279 Police 22,058,620 22,058,620 19,705,319 2,353,301 Community development 5,095,122 5,095,122 4,932,108 163,014 Public works 12,207,736 12,207,736 9,335,993 2,871,743 Economic vitality 990,494 990,494 328,841 661,653 Non-departmental (734,543) (734,543) (2,487,546) 1,753,003Contingency 1,990,000 1,990,000 - 1,990,000 Total expenditures 70,384,292 70,384,292 59,102,993 11,281,299
Excess (deficiency) of revenues over (under) expenditures (7,781,268) (7,781,268) 2,719,343 10,500,611
Other Financing Sources (Uses):Sale of capital assets 37,370 37,370 35,340 (2,030)Transfers in 3,778,063 3,778,063 3,463,231 (314,832)Transfers out (10,133,269) (10,133,269) (8,457,705) 1,675,564 Total other financing sources (uses) (6,317,836) (6,317,836) (4,959,134) 1,358,702
Net change in fund balances (14,099,104) (14,099,104) (2,239,791) 11,859,313
Fund balances, beginning of year 26,699,303 26,699,303 40,464,781 13,765,478
Fund balances, end of year 12,600,199$ 12,600,199$ 38,224,990$ 25,624,791$
Adjustment of budgetary basis to GAAP basis net change in fund balances (2,239,791)$ The City budgets certain revenues on the cash basis, rather than on the modified accrual basis. (1,165,803) The City budgets for certain other expenditures on the cash basis, rather than on the modified accrual basis (10,703) Adjusted net change in fund balance - GAAP basis (3,416,297)$
The notes to the financial statements are an integral part of this statement
Budget
City of Flagstaff, ArizonaGeneral Fund
Statement of Revenues, Expenditures and Changes in Fund Balances - Budget and ActualYear Ended June 30, 2018
30
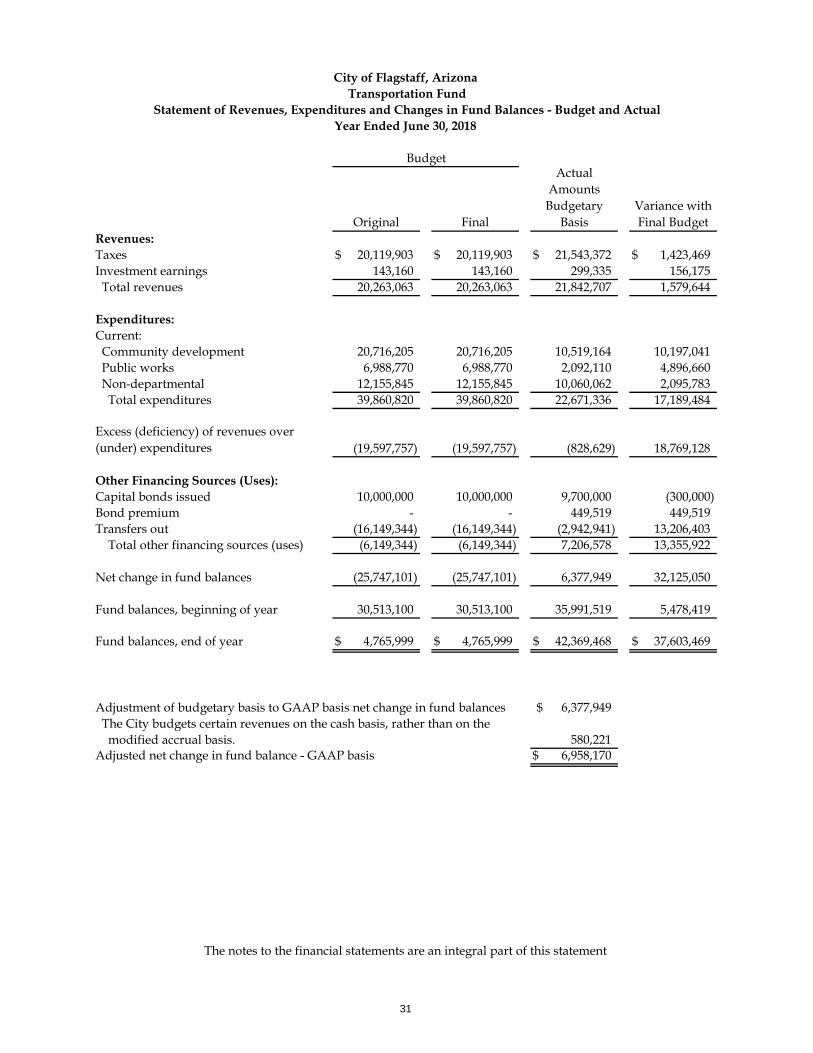
Original Final
Actual Amounts Budgetary
BasisVariance with Final Budget
Revenues:Taxes 20,119,903$ 20,119,903$ 21,543,372$ 1,423,469$ Investment earnings 143,160 143,160 299,335 156,175 Total revenues 20,263,063 20,263,063 21,842,707 1,579,644
Expenditures:Current: Community development 20,716,205 20,716,205 10,519,164 10,197,041 Public works 6,988,770 6,988,770 2,092,110 4,896,660 Non-departmental 12,155,845 12,155,845 10,060,062 2,095,783 Total expenditures 39,860,820 39,860,820 22,671,336 17,189,484
Excess (deficiency) of revenues over (under) expenditures (19,597,757) (19,597,757) (828,629) 18,769,128
Other Financing Sources (Uses):Capital bonds issued 10,000,000 10,000,000 9,700,000 (300,000)Bond premium - - 449,519 449,519Transfers out (16,149,344) (16,149,344) (2,942,941) 13,206,403 Total other financing sources (uses) (6,149,344) (6,149,344) 7,206,578 13,355,922
Net change in fund balances (25,747,101) (25,747,101) 6,377,949 32,125,050
Fund balances, beginning of year 30,513,100 30,513,100 35,991,519 5,478,419
Fund balances, end of year 4,765,999$ 4,765,999$ 42,369,468$ 37,603,469$
Adjustment of budgetary basis to GAAP basis net change in fund balances 6,377,949$ The City budgets certain revenues on the cash basis, rather than on the modified accrual basis. 580,221 Adjusted net change in fund balance - GAAP basis 6,958,170$
The notes to the financial statements are an integral part of this statement
Budget
City of Flagstaff, ArizonaTransportation Fund
Statement of Revenues, Expenditures and Changes in Fund Balances - Budget and Actual Year Ended June 30, 2018
31
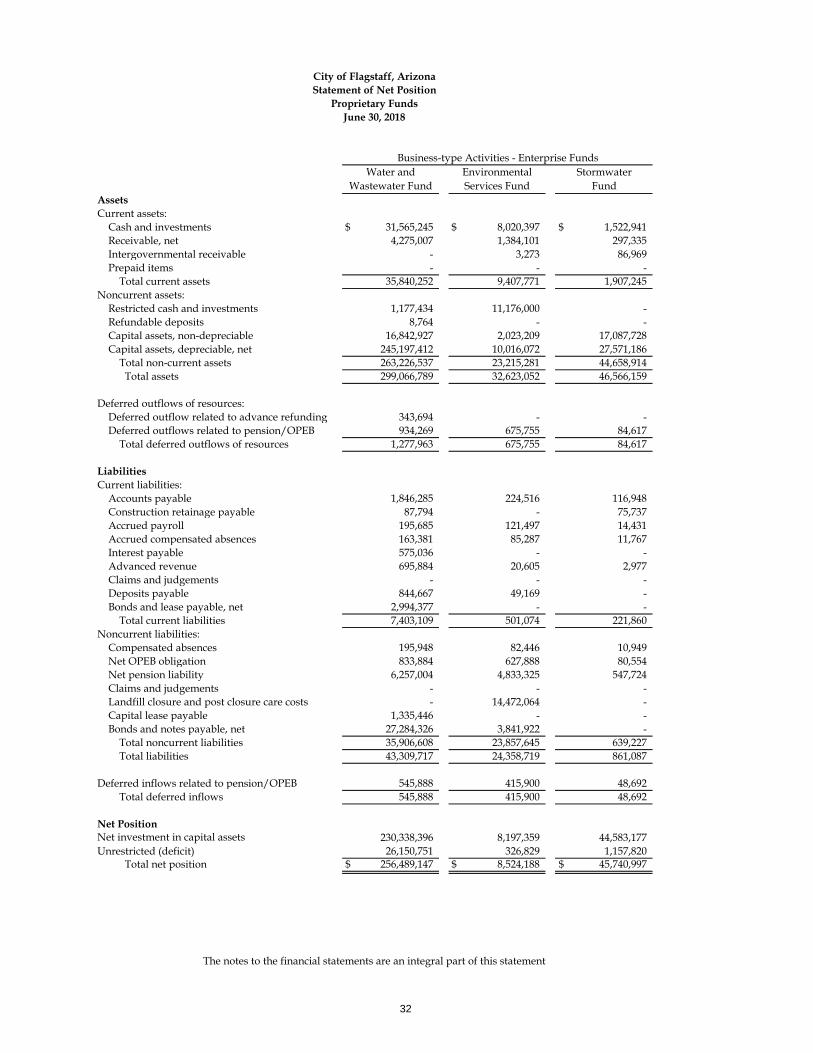
Water and Wastewater Fund
Environmental Services Fund
StormwaterFund
AssetsCurrent assets:
Cash and investments 31,565,245$ 8,020,397$ 1,522,941$ Receivable, net 4,275,007 1,384,101 297,335Intergovernmental receivable - 3,273 86,969Prepaid items - - -
Total current assets 35,840,252 9,407,771 1,907,245Noncurrent assets:
Restricted cash and investments 1,177,434 11,176,000 -Refundable deposits 8,764 - -Capital assets, non-depreciable 16,842,927 2,023,209 17,087,728Capital assets, depreciable, net 245,197,412 10,016,072 27,571,186
Total non-current assets 263,226,537 23,215,281 44,658,914 Total assets 299,066,789 32,623,052 46,566,159
Deferred outflows of resources:Deferred outflow related to advance refunding 343,694 - -Deferred outflows related to pension/OPEB 934,269 675,755 84,617
Total deferred outflows of resources 1,277,963 675,755 84,617
LiabilitiesCurrent liabilities:
Accounts payable 1,846,285 224,516 116,948Construction retainage payable 87,794 - 75,737Accrued payroll 195,685 121,497 14,431Accrued compensated absences 163,381 85,287 11,767Interest payable 575,036 - -Advanced revenue 695,884 20,605 2,977Claims and judgements - - -Deposits payable 844,667 49,169 -Bonds and lease payable, net 2,994,377 - -
Total current liabilities 7,403,109 501,074 221,860Noncurrent liabilities:
Compensated absences 195,948 82,446 10,949Net OPEB obligation 833,884 627,888 80,554Net pension liability 6,257,004 4,833,325 547,724Claims and judgements - - -Landfill closure and post closure care costs - 14,472,064 -Capital lease payable 1,335,446 - -Bonds and notes payable, net 27,284,326 3,841,922 -
Total noncurrent liabilities 35,906,608 23,857,645 639,227Total liabilities 43,309,717 24,358,719 861,087
Deferred inflows related to pension/OPEB 545,888 415,900 48,692 Total deferred inflows 545,888 415,900 48,692
Net PositionNet investment in capital assets 230,338,396 8,197,359 44,583,177Unrestricted (deficit) 26,150,751 326,829 1,157,820
Total net position 256,489,147$ 8,524,188$ 45,740,997$
The notes to the financial statements are an integral part of this statement
City of Flagstaff, ArizonaStatement of Net Position
Proprietary FundsJune 30, 2018
Business-type Activities - Enterprise Funds
32
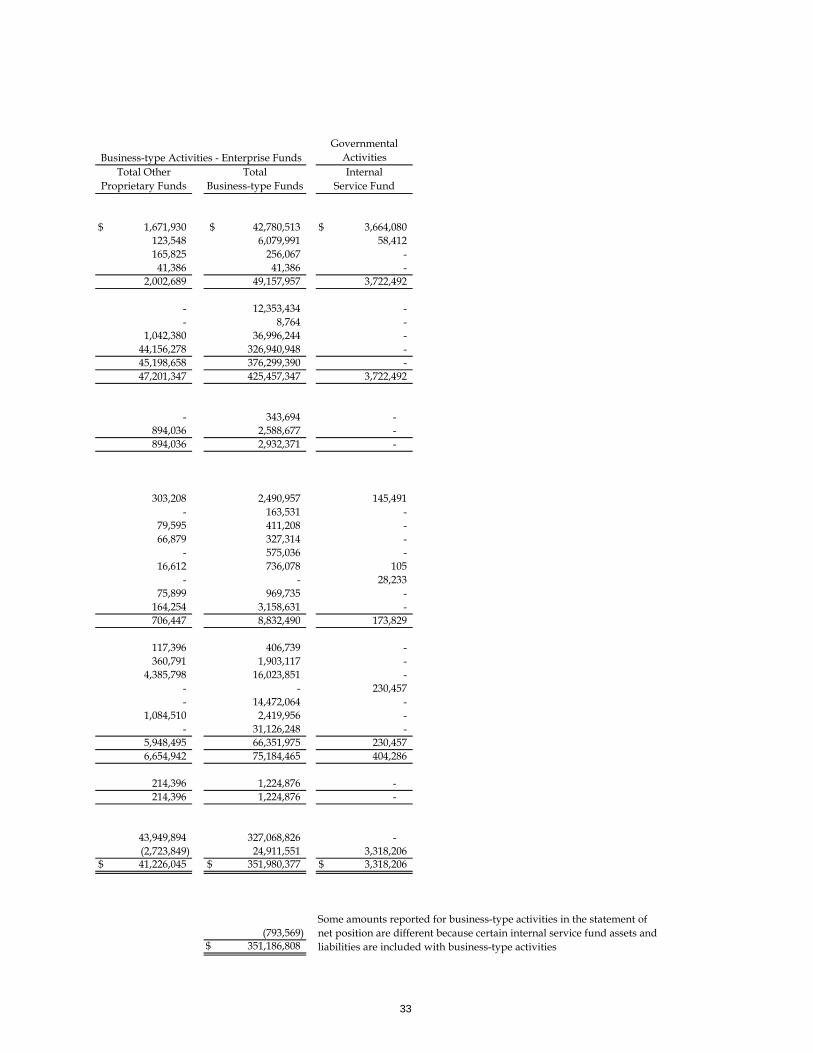
Governmental Activities
Total Other Proprietary Funds
TotalBusiness-type Funds
Internal Service Fund
1,671,930$ 42,780,513$ 3,664,080$ 123,548 6,079,991 58,412165,825 256,067 -
41,386 41,386 -2,002,689 49,157,957 3,722,492
- 12,353,434 -- 8,764 -
1,042,380 36,996,244 -44,156,278 326,940,948 -45,198,658 376,299,390 -47,201,347 425,457,347 3,722,492
- 343,694 - 894,036 2,588,677 - 894,036 2,932,371 -
303,208 2,490,957 145,491- 163,531 -
79,595 411,208 -66,879 327,314 -
- 575,036 -16,612 736,078 105
- - 28,23375,899 969,735 -
164,254 3,158,631 -706,447 8,832,490 173,829
117,396 406,739 -360,791 1,903,117 -
4,385,798 16,023,851 -- - 230,457- 14,472,064 -
1,084,510 2,419,956 -- 31,126,248 -
5,948,495 66,351,975 230,4576,654,942 75,184,465 404,286
214,396 1,224,876 - 214,396 1,224,876 -
43,949,894 327,068,826 - (2,723,849) 24,911,551 3,318,20641,226,045$ 351,980,377$ 3,318,206$
(793,569) 351,186,808$
Business-type Activities - Enterprise Funds
Some amounts reported for business-type activities in the statement of net position are different because certain internal service fund assets and liabilities are included with business-type activities
33
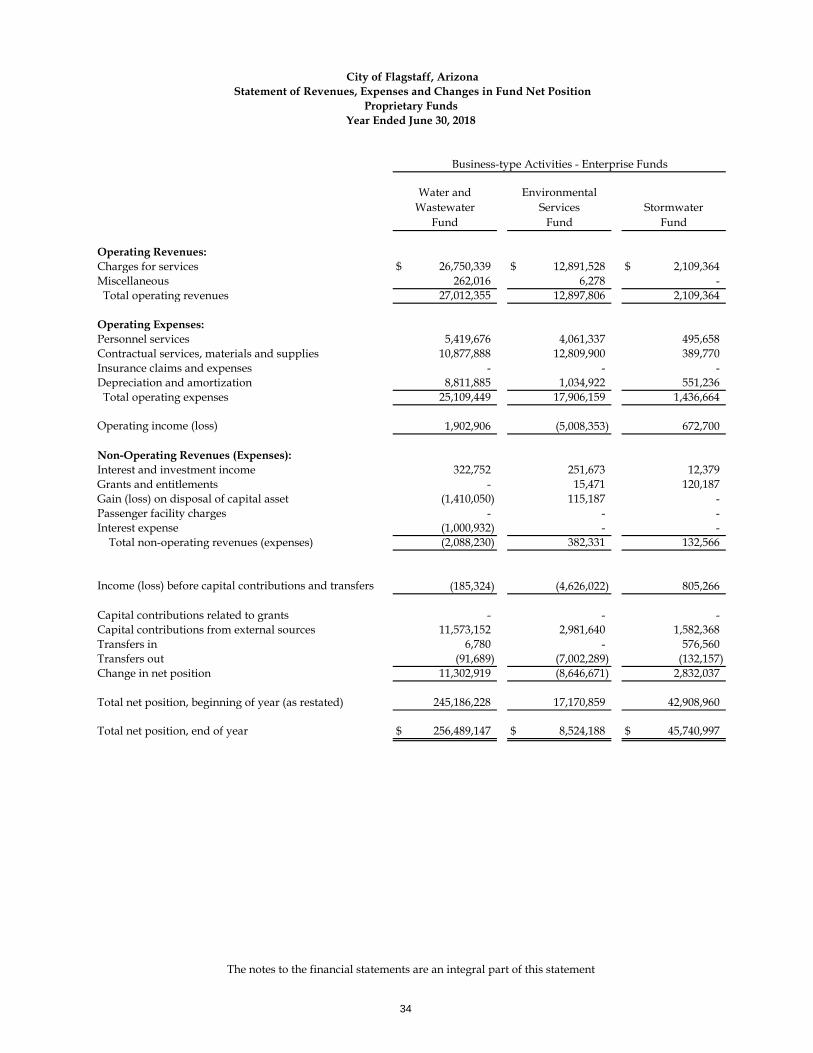
Water and Wastewater
Fund
Environmental Services
FundStormwater
Fund
Operating Revenues:Charges for services 26,750,339$ 12,891,528$ 2,109,364$ Miscellaneous 262,016 6,278 - Total operating revenues 27,012,355 12,897,806 2,109,364
Operating Expenses:Personnel services 5,419,676 4,061,337 495,658Contractual services, materials and supplies 10,877,888 12,809,900 389,770Insurance claims and expenses - - -Depreciation and amortization 8,811,885 1,034,922 551,236 Total operating expenses 25,109,449 17,906,159 1,436,664
Operating income (loss) 1,902,906 (5,008,353) 672,700
Non-Operating Revenues (Expenses):Interest and investment income 322,752 251,673 12,379Grants and entitlements - 15,471 120,187Gain (loss) on disposal of capital asset (1,410,050) 115,187 -Passenger facility charges - - -Interest expense (1,000,932) - -
Total non-operating revenues (expenses) (2,088,230) 382,331 132,566
Income (loss) before capital contributions and transfers (185,324) (4,626,022) 805,266
Capital contributions related to grants - - -Capital contributions from external sources 11,573,152 2,981,640 1,582,368Transfers in 6,780 - 576,560Transfers out (91,689) (7,002,289) (132,157)Change in net position 11,302,919 (8,646,671) 2,832,037
Total net position, beginning of year (as restated) 245,186,228 17,170,859 42,908,960
Total net position, end of year 256,489,147$ 8,524,188$ 45,740,997$
The notes to the financial statements are an integral part of this statement
City of Flagstaff, ArizonaStatement of Revenues, Expenses and Changes in Fund Net Position
Proprietary FundsYear Ended June 30, 2018
Business-type Activities - Enterprise Funds
34
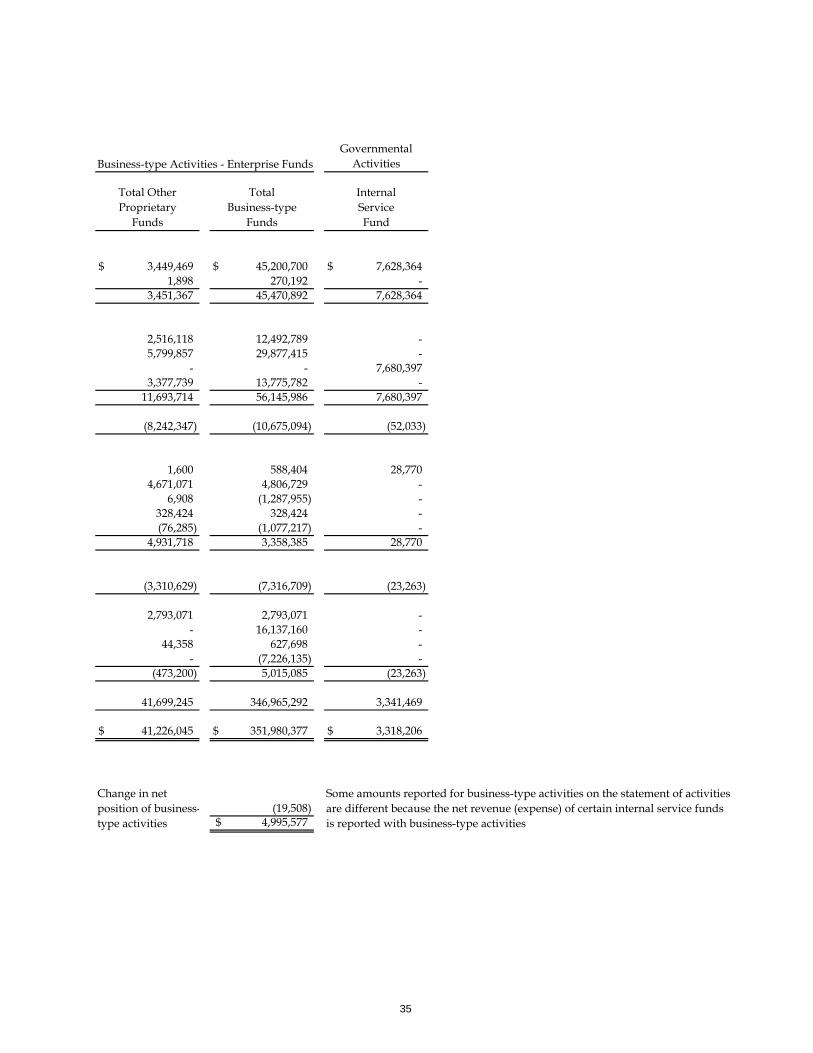
Business-type Activities - Enterprise FundsGovernmental
Activities
Total Other Proprietary
Funds
TotalBusiness-type
Funds
Internal Service Fund
3,449,469$ 45,200,700$ 7,628,364$ 1,898 270,192 -
3,451,367 45,470,892 7,628,364
2,516,118 12,492,789 -5,799,857 29,877,415 -
- - 7,680,3973,377,739 13,775,782 -
11,693,714 56,145,986 7,680,397
(8,242,347) (10,675,094) (52,033)
1,600 588,404 28,7704,671,071 4,806,729 -
6,908 (1,287,955) -328,424 328,424 -(76,285) (1,077,217) -
4,931,718 3,358,385 28,770
(3,310,629) (7,316,709) (23,263)
2,793,071 2,793,071 -- 16,137,160 -
44,358 627,698 -- (7,226,135) -
(473,200) 5,015,085 (23,263)
41,699,245 346,965,292 3,341,469
41,226,045$ 351,980,377$ 3,318,206$
(19,508) 4,995,577$
Change in net position of business-type activities
Some amounts reported for business-type activities on the statement of activities are different because the net revenue (expense) of certain internal service funds is reported with business-type activities
35
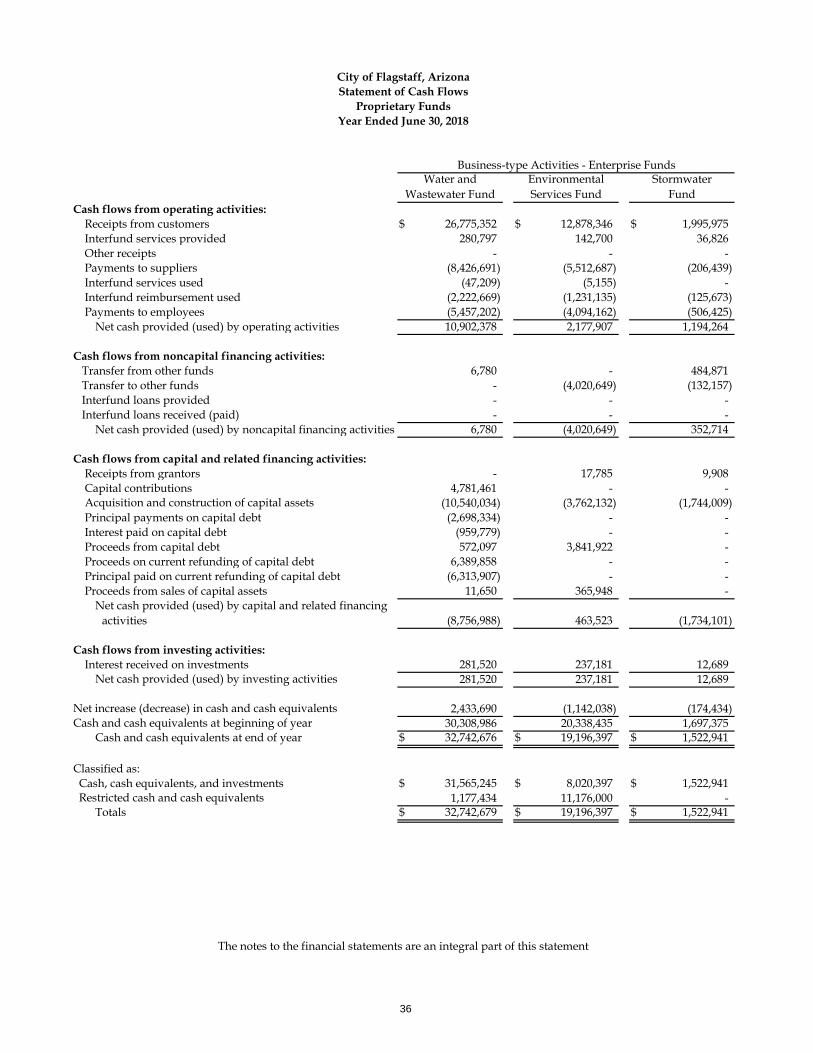
Water and Wastewater Fund
Environmental Services Fund
StormwaterFund
Cash flows from operating activities: Receipts from customers 26,775,352$ 12,878,346$ 1,995,975$ Interfund services provided 280,797 142,700 36,826 Other receipts - - - Payments to suppliers (8,426,691) (5,512,687) (206,439) Interfund services used (47,209) (5,155) - Interfund reimbursement used (2,222,669) (1,231,135) (125,673) Payments to employees (5,457,202) (4,094,162) (506,425)
Net cash provided (used) by operating activities 10,902,378 2,177,907 1,194,264
Cash flows from noncapital financing activities: Transfer from other funds 6,780 - 484,871 Transfer to other funds - (4,020,649) (132,157) Interfund loans provided - - - Interfund loans received (paid) - - -
Net cash provided (used) by noncapital financing activities 6,780 (4,020,649) 352,714
Cash flows from capital and related financing activities: Receipts from grantors - 17,785 9,908 Capital contributions 4,781,461 - - Acquisition and construction of capital assets (10,540,034) (3,762,132) (1,744,009) Principal payments on capital debt (2,698,334) - - Interest paid on capital debt (959,779) - - Proceeds from capital debt 572,097 3,841,922 - Proceeds on current refunding of capital debt 6,389,858 - - Principal paid on current refunding of capital debt (6,313,907) - - Proceeds from sales of capital assets 11,650 365,948 -
Net cash provided (used) by capital and related financing activities (8,756,988) 463,523 (1,734,101)
Cash flows from investing activities: Interest received on investments 281,520 237,181 12,689
Net cash provided (used) by investing activities 281,520 237,181 12,689
Net increase (decrease) in cash and cash equivalents 2,433,690 (1,142,038) (174,434)Cash and cash equivalents at beginning of year 30,308,986 20,338,435 1,697,375
Cash and cash equivalents at end of year 32,742,676$ 19,196,397$ 1,522,941$
Classified as: Cash, cash equivalents, and investments 31,565,245$ 8,020,397$ 1,522,941$ Restricted cash and cash equivalents 1,177,434 11,176,000 -
Totals 32,742,679$ 19,196,397$ 1,522,941$
Business-type Activities - Enterprise Funds
City of Flagstaff, ArizonaStatement of Cash Flows
Proprietary FundsYear Ended June 30, 2018
The notes to the financial statements are an integral part of this statement
36
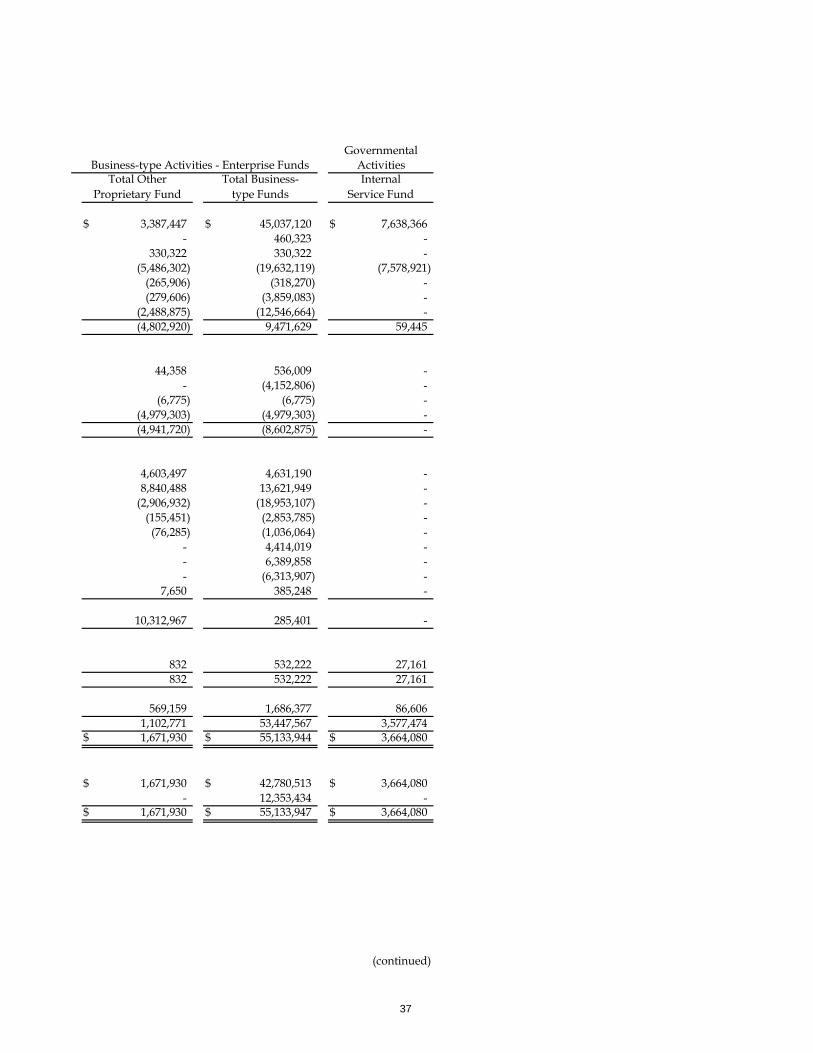
GovernmentalActivities
Total Other Proprietary Fund
Total Business-type Funds
Internal Service Fund
3,387,447$ 45,037,120$ 7,638,366$ - 460,323 -
330,322 330,322 -(5,486,302) (19,632,119) (7,578,921)
(265,906) (318,270) -(279,606) (3,859,083) -
(2,488,875) (12,546,664) -(4,802,920) 9,471,629 59,445
44,358 536,009 -- (4,152,806) -
(6,775) (6,775) -(4,979,303) (4,979,303) -(4,941,720) (8,602,875) -
4,603,497 4,631,190 -8,840,488 13,621,949 -
(2,906,932) (18,953,107) -(155,451) (2,853,785) -
(76,285) (1,036,064) -- 4,414,019 -- 6,389,858 -- (6,313,907) -
7,650 385,248 -
10,312,967 285,401 -
832 532,222 27,161832 532,222 27,161
569,159 1,686,377 86,6061,102,771 53,447,567 3,577,4741,671,930$ 55,133,944$ 3,664,080$
1,671,930$ 42,780,513$ 3,664,080$ - 12,353,434 -
1,671,930$ 55,133,947$ 3,664,080$
(continued)
Business-type Activities - Enterprise Funds
37
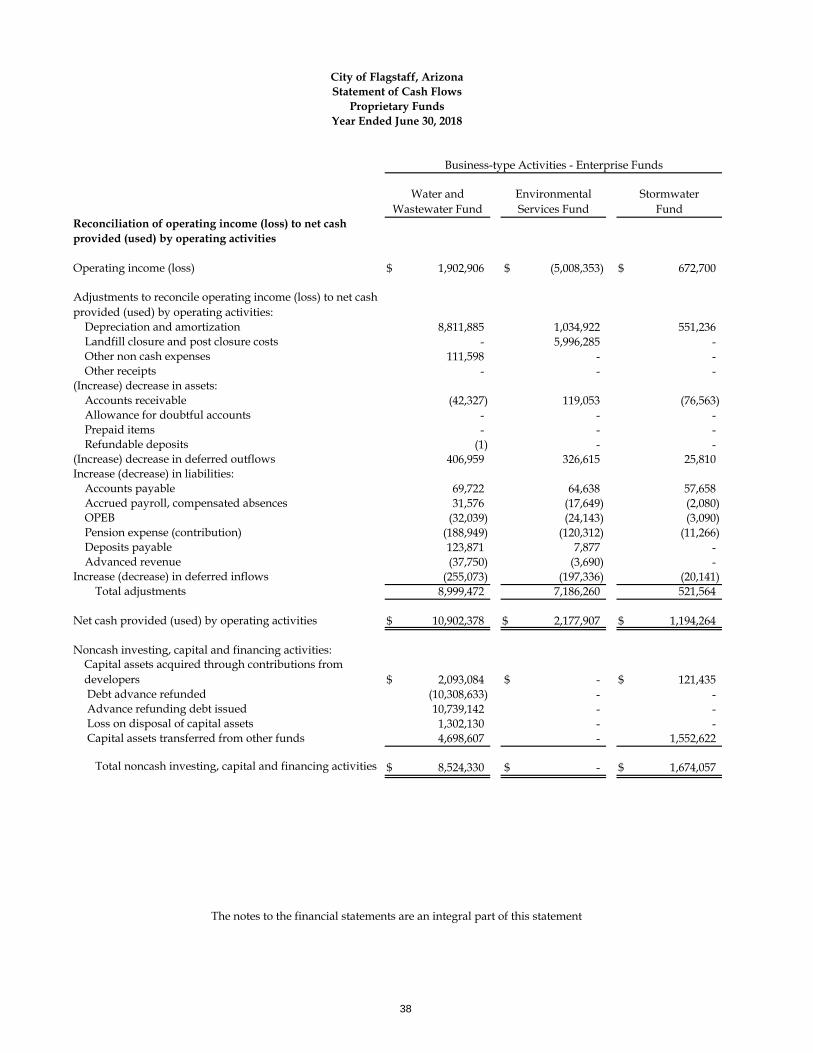
Water and Wastewater Fund
Environmental Services Fund
StormwaterFund
Reconciliation of operating income (loss) to net cash provided (used) by operating activities
Operating income (loss) 1,902,906$ (5,008,353)$ 672,700$
Adjustments to reconcile operating income (loss) to net cash provided (used) by operating activities: Depreciation and amortization 8,811,885 1,034,922 551,236 Landfill closure and post closure costs - 5,996,285 - Other non cash expenses 111,598 - - Other receipts - - -(Increase) decrease in assets: Accounts receivable (42,327) 119,053 (76,563) Allowance for doubtful accounts - - - Prepaid items - - - Refundable deposits (1) - -(Increase) decrease in deferred outflows 406,959 326,615 25,810Increase (decrease) in liabilities: Accounts payable 69,722 64,638 57,658 Accrued payroll, compensated absences 31,576 (17,649) (2,080) OPEB (32,039) (24,143) (3,090) Pension expense (contribution) (188,949) (120,312) (11,266) Deposits payable 123,871 7,877 - Advanced revenue (37,750) (3,690) -Increase (decrease) in deferred inflows (255,073) (197,336) (20,141)
Total adjustments 8,999,472 7,186,260 521,564
Net cash provided (used) by operating activities 10,902,378$ 2,177,907$ 1,194,264$
Noncash investing, capital and financing activities:Capital assets acquired through contributions from developers 2,093,084$ -$ 121,435$ Debt advance refunded (10,308,633) - - Advance refunding debt issued 10,739,142 - - Loss on disposal of capital assets 1,302,130 - - Capital assets transferred from other funds 4,698,607 - 1,552,622
Total noncash investing, capital and financing activities 8,524,330$ -$ 1,674,057$
The notes to the financial statements are an integral part of this statement
Business-type Activities - Enterprise Funds
City of Flagstaff, ArizonaStatement of Cash Flows
Proprietary FundsYear Ended June 30, 2018
38
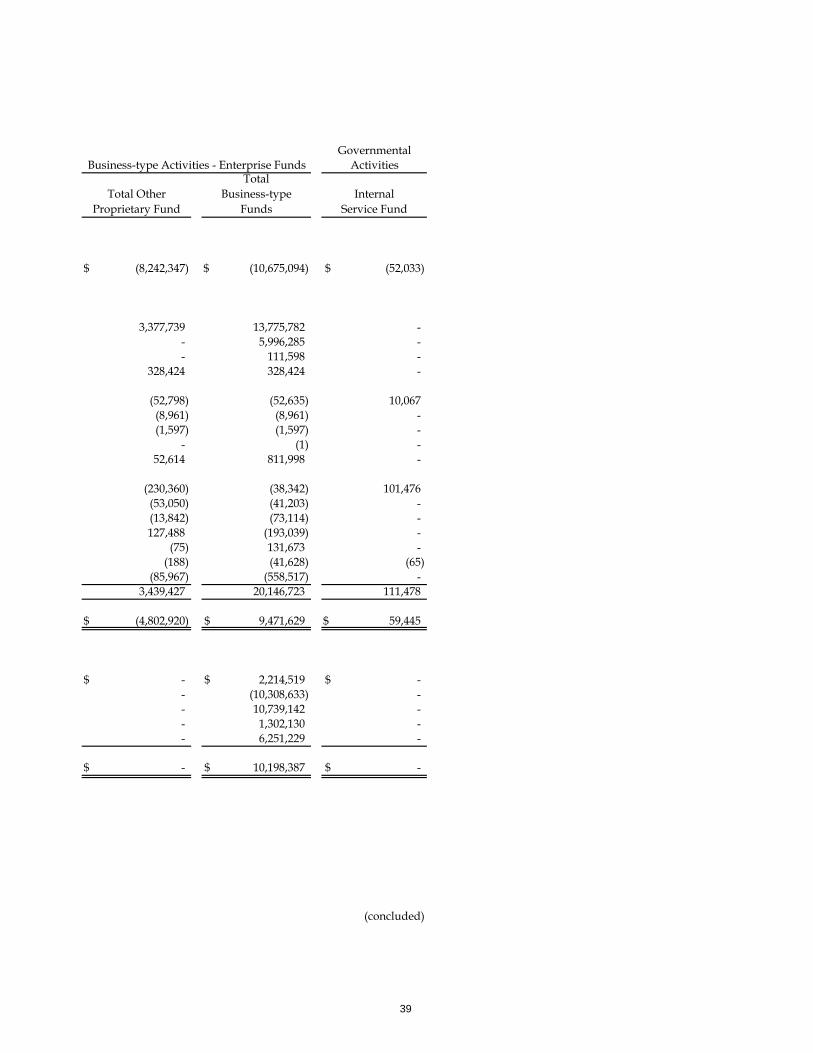
GovernmentalActivities
Total Other Proprietary Fund
TotalBusiness-type
FundsInternal
Service Fund
(8,242,347)$ (10,675,094)$ (52,033)$
3,377,739 13,775,782 -
- 5,996,285 -- 111,598 -
328,424 328,424 -
(52,798) (52,635) 10,067(8,961) (8,961) -(1,597) (1,597) -
- (1) -52,614 811,998 -
(230,360) (38,342) 101,476(53,050) (41,203) -(13,842) (73,114) -127,488 (193,039) -
(75) 131,673 -(188) (41,628) (65)
(85,967) (558,517) -3,439,427 20,146,723 111,478
(4,802,920)$ 9,471,629$ 59,445$
-$ 2,214,519$ -$ - (10,308,633) - - 10,739,142 - - 1,302,130 - - 6,251,229 -
-$ 10,198,387$ -$
(concluded)
Business-type Activities - Enterprise Funds
39
City of Flagstaff, Arizona Notes to the Financial Statements
June 30, 2018
I. Summary of Significant Accounting Policies
A. Financial Reporting Entity
The City of Flagstaff (City) was incorporated as a town in 1894 and as a city in 1928. The current City Charter was approved June 29, 1998. The Charter provides for the Council-Manager form of government and the authority to provide municipal services, as limited by the State Constitution.
The accounting policies of the City conform to accounting principles generally accepted in the United States of America (GAAP) as applicable to Governmental Units. The Governmental Accounting Standards Board (GASB) is the accepted standard-setting body for establishing governmental accounting and financial reporting principles. For the year ended June 30, 2018, the City adopted the provisions of GASB Statement No. 75, Accounting and Financial Reporting for Postemployment Benefits Other than Pensions, as amended by GASB Statement No. 85, Omnibus 2017 and GASB Statement No 89, Accounting for Interest Cost incurred before the end of the Construction Period. GASB Statement No. 75 established standards for measuring and recognizing net assets or liabilities, deferred outflows of resources, deferred inflows of resources and expenses/expenditures related to other postemployment benefits (OPEB) provided through defined benefit OPEB plans. In addition, Statement No. 75 requires disclosure of information related to OPEB. GASB Statement No. 89 establishes accounting requirements for interest cost incurred before the end of a construction period. Statement No. 89 requires that interest cost incurred before the end of a construction period be recognized as an expense in the period in which the cost is incurred for financial statements prepared using the economic resources measurement focus. As a result, interest cost incurred before the end of a construction period will not be included in the historical cost of a capital asset reported in a business-type activity or enterprise fund.
The City of Flagstaff is a municipal corporation governed by an elected mayor and six-member council. The accompanying financial statements include the City and all of its component entities for which the government is considered to be financially accountable. Blended component units, although legally separate entities are, in substance, part of the government’s operations and so data from these units are combined with data of the primary government. Discretely presented component units are reported in a separate column in the Government-wide Statement of Net Position and Activities to emphasize they are legally separate from the government. The City of Flagstaff has no discretely presented component units.
Related Organizations: The City of Flagstaff officials are also responsible for appointing board members of other organizations. However, as the City’s control is limited to making the appointments and there is not a significant operational nor a significant financial relationship between these organizations and the City, they are not included as part of these financial statements.
B. Government-Wide and Fund Financial Statements
The government-wide financial statements (statement of net position and statement of activities) report on the City and its component units as a whole. Governmental activities, which normally are supported by taxes and intergovernmental revenues, are reported separately from business-type activities, which are supported by fees and charges for services.
The government-wide statement of activities demonstrates the degree to which the direct expenses of the various functions and segments of the City are offset by program revenues. Direct expenses are those that are clearly identifiable with a specific function or segment. Interest on long-term debt and depreciation
40
expense on assets shared by multiple functions are not allocated to the various functions. Program revenues include: 1) charges to customers or users who purchase, use or directly benefit from goods, services or privileges provided by a particular function or segment, and 2) grants and contributions that are restricted to meeting the operational or capital requirements of a particular function or segment. Taxes, investment income and other revenues not identifiable with particular functions or segments are included as general revenues. The general revenues support the net costs of the functions and segments not covered by program revenues. Generally, the effect of interfund activity has been removed from the government-wide financial statements. Net interfund activity and balances between governmental activities and business-type activities are shown in the government-wide financial statements. Interdepartmental services performed by one division for another are credited to the performing division and charged to the receiving division to reflect the accurate costs of programs. These indirect costs have been eliminated as part of the program expenses reported for the various functional activities. The rates used are intended to reflect full costs in accordance with generally accepted cost accounting principles and are part of the fund statements. Interfund services provided and used are eliminated in the process of consolidation. The government-wide statement of net position reports all financial and capital resources of the government. It is displayed in a format of assets plus deferred outflows of resources, less liabilities, less deferred inflows of resources, equals net position, with the assets and liabilities shown in order of their relative liquidity. Net position is required to be displayed in three components: 1) net investment in capital assets, 2) restricted, and 3) unrestricted. Net investment in capital assets consists of capital assets, net of accumulated depreciation, reduced by outstanding balances of any bonds, mortgages, notes or other borrowings that are attributable to the acquisition, construction, or improvement of those assets. Deferred outflows of resources and deferred inflows of resources that are attributable to the acquisition, construction, or improvement of those assets or related debt are also included in the net position. The portion of unspent related debt proceeds or deferred inflows of resources at the end of the reporting period is not included in the calculation of net investment in capital assets; instead that portion of the debt or deferred inflows of resources is included in the same net position component as the unspent amount. Restricted net position occurs when a constraint is placed on its use by either: 1) externally imposed by creditors (such as through debt covenants), grantors, contributors, or law or regulations of other governments, or 2) imposed by law through constitutional provisions or enabling legislation. All net position not otherwise classified as restricted, is shown as unrestricted. Generally, the City would first apply restricted resources when an expense is incurred for purposes for which both restricted and unrestricted net position is available. Also, part of the basic financial statements are fund financial statements for governmental funds and proprietary funds. The focus of the fund financial statements is on major funds, as defined by GASB Statement No. 34. Although the reporting model sets forth minimum criteria for determination of major funds (a percentage of assets and deferred outflows, liabilities and deferred inflows, revenues, or expenditures/expenses of fund category and of the governmental and enterprise funds combined), it also gives governments the option of displaying other funds as major funds, which the City has not elected. Other non-major funds are combined in a single column on the fund financial statements and are detailed in combining statements included as supplementary information after the basic financial statements. C. Measurement Focus, Basis of Accounting and Financial Statement Presentation The government-wide financial statements are reported using the economic resources measurement focus and the accrual basis of accounting, as are the proprietary funds. Revenues are recorded when earned and expenses are recorded when a liability is incurred, regardless of the timing of related cash flows. Property taxes are recorded as revenues in the year for which they are levied. Grants and similar items are recognized as revenue as soon as all eligibility requirements imposed by the provider have been met.
41
The governmental fund financial statements are prepared on a current financial resources measurement focus and modified accrual basis of accounting. This is the traditional basis of accounting for governmental funds. This presentation is deemed most appropriate to 1) demonstrate legal and covenant compliance, 2) demonstrate the sources and uses of liquid resources, and 3) demonstrate how the City’s actual revenues and expenditures conform to the annual budget. Since the governmental fund financial statements are presented on a different basis than the governmental activities column of the government-wide financial statements, a reconciliation is provided immediately following each fund statement. These reconciliations explain the adjustments necessary to transform the fund financial statements into the governmental activities column of the government-wide financial statements. The proprietary fund financial statements are prepared on the same basis (economic resources measurement focus and accrual basis of accounting) as the government-wide financial statements. Therefore, most lines for the total enterprise funds on the proprietary fund financial statements will directly reconcile to the business-type activities column on the government-wide financial statements. Because the enterprise funds are combined into a single business-type activities column on the government-wide financial statements, certain interfund activities between these funds may be eliminated in the consolidation for the government-wide financial statements, but are included in the fund columns in the proprietary fund financial statements. The net costs/income of the internal service fund is also partially allocated to the business-type activities column on the government-wide financial statements. On the proprietary fund financial statements, operating revenues are those that flow directly from the operations of that activity, i.e. charges to customers or users who purchase or use the goods or services of that activity. Operating expenses are those that are incurred to provide those goods or services. Non-operating revenues and expenses represent items like investment income, interest expense, and other items that do not fit in any other category and are not a result of the direct operations of the activity. The City uses funds to report its financial position and the results of its operations. Fund accounting segregates funds according to their intended purpose and is designed to demonstrate legal compliance and to aid financial management by segregating transactions related to certain governmental functions or activities. A fund is a separate accounting entity with a self-balancing set of accounts, which includes assets, deferred outflows of resources, liabilities, deferred inflows of resources, fund balance, revenues and expenditures/expenses. The City uses the following fund categories: Governmental Fund Types Governmental Funds are those through which most of the governmental functions of the City are financed. The measurement focus is based upon determination of changes in financial position rather than upon net income determination. General Fund is the primary operating fund of the City. It is used to account for all financial resources except those required to be accounted for in another fund. The General Fund will always be considered a major fund in the basic financial statements. Special Revenue Funds are used to account for the proceeds of specific revenue sources (other than special assessments or major capital projects) that are legally restricted to expenditures for specified purposes. There is one special revenue fund that is presented as a major fund in the basic financial statements. It is the: Transportation Tax Fund accounts for the receipt and expenditures of the transportation tax money as
authorized by voters on May 16, 2000. These resources are restricted to financing improvements in the areas of the 4th Street overpass project, safe to school/pedestrian and bike projects, traffic flow and safety improvements, transit service operations and enhancements and to repay the bonding related to the 4th Street overpass. In FY 2015, voters approved an additional transportation tax for road repair
42
and street safety which is valid through 2035. In FY 2016, voters approved an extension of the transit tax to 2030.
Capital Project Funds are used to account for major capital acquisition and construction separate from ongoing operating activities. Resources for capital projects typically result from the issuance of general obligation or other government debt. Capital Projects Bond Construction Fund, accounts for major capital acquisition and construction projects
which are funded mainly with general obligation or other governmental debt. Debt Service Funds are used to account for the accumulation of resources for, and the payment of, general long-term obligation principal and interest, none of which are presented as major funds. Permanent Funds are used to account for resources that are legally restricted to the extent that only earnings, and not principal, may be used for purposes that support the reporting government’s programs. Resources are generated from ongoing plot sales with a portion allocated to perpetuity. Proprietary Fund Types Proprietary Funds are used to account for the City’s ongoing operations and activities, which are similar to those found in the private sector and where cost recovery and the determination of net income is useful or necessary for sound fiscal management. The measurement focus is based upon determination of net income, changes in net position, net position and cash flows. Enterprise Funds are used to account for operations that provide services to the general public for a fee. Under GASB Statement No. 34, enterprise funds are also required for any activity whose principal revenue sources meet any of the following criteria: 1) any activity that has issued debt backed solely by the fees and charges of the activity, 2) if the cost of providing services for an activity, including capital costs such as depreciation or debt service, must legally be recovered through fees and charges, or 3) it is the policy of the City to establish activity fees or charges to recover the cost of providing services, including capital costs. The City has five enterprise funds, three of which are presented as major funds in the basic financial statements. Water and Wastewater Fund accounts for the City water pumping, treatment and distribution systems
and the City wastewater collection and treatment systems. Environmental Services Fund accounts for the operations of City refuse, management of the City landfill,
recycling collection services and the management of sustainability programs.
Stormwater Fund accounts for the construction, operations and maintenance activities of the City stormwater system.
Internal Service Fund accounts for the operations that provide services to other divisions of the government on a cost-reimbursement basis, thus the internal service fund is presented with the proprietary fund financial statements. The internal service fund represents the self-insurance services provided to other divisions and accounts for the risk management function of the City as well as maintaining the costs of the City’s liability insurance and any claims paid under the City’s self-insurance program. These costs are allocated to all operational activities of the City. Basis of Accounting The accounting and financial reporting treatment applied to a fund is determined by its measurement focus. Governmental funds are accounted for using a current financial resources measurement focus whereby only current assets plus deferred outflows of resources, equals current liabilities plus deferred inflows of resources, plus fund balance. Operating statements present increases (i.e., revenues and other financing sources) and decreases (i.e., expenditures and other financing uses) in net change in fund balances.
43

Enterprise funds are accounted for on a flow of economic resources measurement focus whereby all assets plus deferred outflows of resources, less liabilities and deferred inflows of resources associated with the operation of these funds, equals net position, as presented on the statement of net position. Operating statements present increases (i.e., revenues) and decreases (i.e., expenses) in net total position. The modified accrual basis of accounting is used by governmental funds. Revenues are recognized when susceptible to accrual (i.e., when they become both measurable and available). “Measurable” means the amount of the transaction can be determined and “available” means collectible within the current period or soon enough thereafter to be used to pay liabilities of the current period. The City considers all revenues, except reimbursement grants, to be available if they are collected within 60 days of the end of the current fiscal period. Reimbursement grants are considered available if they are collected within one year of the end of the current fiscal period. Expenditures are generally recorded when the related fund liability is incurred, as under accrual accounting. Principal and interest on long-term debt are recorded as fund liabilities when due. However, debt service expenditures, as well as, expenditures related to compensated absences, claims and judgments are recorded only to the extent they have matured. Revenues susceptible to accrual include property tax, privilege license tax, highway user tax, state shared sales tax, vehicle license tax and interest earned on investments. Licenses and permits, charges for services, fines and forfeitures, parks and recreation charges and miscellaneous revenues are recorded when received in cash since they are generally not measurable until actually received. Only the portion of special assessment receivables due within the current fiscal period is considered to be susceptible to accrual as revenue of the current period. The accrual basis of accounting is followed for all enterprise funds. Revenues are recognized in the accounting period in which they are earned and become measurable, and expenses are recognized when incurred. Enterprise funds distinguish operating revenues and expenses from non-operating items. Operating revenues and expenses generally result from providing services and producing and delivering goods in connection with the funds principal ongoing operations. Operating expenses for enterprise funds include the cost of sales and services, administrative expenses and depreciation on capital assets. All revenues and expenses not meeting this definition are reported as non-operating items. Budgets and Budgetary Accounting The City uses the following procedures in establishing the budgetary data reflected in the accompanying financial statements.
• The maximum legal expenditure permitted for the year is the total budget as adopted. The expenditure appropriations in the adopted budget are maintained in the City’s financial system by division within individual funds. Division appropriations may be amended during the year, within administrative guidelines and adopted Council policies.
• The initial budget for the fiscal year may be amended during the year in a legally permissible
manner.
• The City Manager is generally authorized to transfer budgeted amounts within any specific sections expenditure appropriation. Any budget revisions requiring a transfer between divisions must be approved by the City Council. City manager, human resources and information technology are example sections of the general administration division.
• All unencumbered expenditure appropriations expire at the end of the fiscal year.
44
• Encumbered amounts are re-budgeted in the following year as deemed appropriate and necessary after review by the Budget Committee. Budgetary carry forwards are approved by the City Council as part of the budget adoption process.
• All funds of the City have legally adopted budgets with the exception of the internal service fund
and perpetual care fund. Formal integration of these budgets into the City’s financial systems is employed as a management control device during the year for all funds.
The City prepares its annual budget on a modified cash basis, which differs from GAAP. GASB Statement No. 34 requires that budgetary comparison statements for the General Fund and major special revenue funds be presented in the annual financial statements or as required supplementary information. The City has chosen to present these statements in the basic financial statements. These statements must display original budget, amended budget and actual results on a budgetary basis at the legal level of budgetary control. The City’s legal level of budgetary control is at the division level; however the City’s financial statements are presented at the functional level of detail. Budgetary comparisons provided in the basic financial section are presented for the general fund and major special revenue funds at the division level; these are presented as statements. The supplemental section provides budgetary comparisons for non-major special revenue funds, capital projects funds and debt service funds at the same functional level of detail used in financial statements presentation; these are presented as schedules. D. Assets, Deferred Outflows of Resources, Liabilities, Deferred Inflows of
Resources and Net Position Cash and Investments The City’s cash and cash equivalents are considered to be cash on hand, demand deposits and short-term investments with original maturities of three months or less from the date of acquisition. State statutes authorize the government to invest in the State’s Local Government Investment Pool (LGIP), obligations of the U.S. Treasury, commercial paper and repurchase agreements. Investment income from pooled cash and investments is allocated monthly based on the percentage of a fund’s average daily equity in pooled cash and investments to the total average daily-pooled equity in pooled cash and investments. Investments are stated at fair value based on quoted market prices. The City also has an investment policy. Details of the City’s investment policy can be found in Note IV.A. The LGIP is a part of the State of Arizona Treasurer’s office. The State Board of Deposit provides oversight for the State Treasurer’s pools, and the LGIP Advisory Committee provides consultation and advice to the Treasurer. Investments in the State of Arizona LGIP are stated at fair value, which also approximates the value of the investment upon withdrawal. For purposes of the statement of cash flows, the City considers cash and cash equivalents, including restricted cash and cash equivalents, to be currency on hand, demand deposits with banks, amounts included in pooled cash and investment accounts and liquid investments with a maturity of three months or less. Cash and cash equivalents are included in both unrestricted as well as restricted assets. Receivables and Payables Accounts receivable and taxes receivable are shown net of an allowance for uncollectible accounts. The City’s property tax is levied each year on or before the third Monday in August based on the previous January 1, full cash value as determined by the Coconino County Assessor. Levies are due and payable in two installments on September 1 and March 1. First half installments become delinquent on November 1; second half installments become delinquent on May 1. Interest at the rate of 12% per annum accrues following delinquent dates. Coconino County bills and collects all property taxes, at no charge to the taxing entities. A lien against property assessed attaches on the first day of January preceding assessment and levy thereon.
45
Under Arizona tax laws there are two property tax levies: primary and secondary. Primary property taxes are not restricted as to use and are used to finance the general operations of the City. Secondary property taxes are restricted for general obligation bonded debt service. The secondary property tax levy is recorded as revenue in a debt service fund and transferred to the Water and Wastewater Fund and the General Obligation Bond Fund. Secondary property taxes are restricted for general obligation bonded debt service. The secondary property tax levy is recorded as revenue in a debt service fund and transferred to the Water and Wastewater Fund. Activity between funds that is representative of lending/borrowing arrangements outstanding at the end of the fiscal year is classified as interfund receivables and payables. Any residual balances outstanding between the governmental activities and business-type activities are reported in the government-wide financial statements as internal balance. Deferred Outflows of Resources When a consumption of net position/fund balance applies to a future period it should not be recognized as an outflow of resources, expense or expenditure until that time. Advance refunding resulting in defeasance of debt, the difference between the reacquisition price and the net carrying amount of the old debt is reported as a deferred outflow of resources or a deferred inflow of resources and recognized as a component of interest expense in a systematic and rational manner over the remaining life of the old debt or the life of the new debt, whichever is shorter. Inventory and Prepaids Inventory is valued at cost, which approximates market, using the weighted average cost method. Inventory consists of expendable supplies held for consumption and is charged to expenditure accounts as consumed. Prepayments of the governmental funds, which are prepared using the modified accrual basis of accounting, are recorded under the purchases method, and are therefore recorded as expenditures when purchased. Within the government-wide statements, which are prepared using the accrual basis of accounting, prepayments are recorded as assets and amortized over the life of the related agreement. Prepaid items contain payments made to vendors applicable to future accounting periods in both the government-wide and proprietary fund financial statements. The cost of a prepaid item is recorded as an expense when consumed rather than purchased. Restricted Assets Certain debt proceeds of the City’s bonds, as well as certain resources set aside for their repayment, are classified as restricted on the balance sheet or statement of net position, because they are maintained in trust accounts and their use is limited by applicable debt covenants. Typically, restricted assets, committed assets and assigned assets are used prior to using unassigned assets when both are available for the same purpose. Capital Assets Capital assets, whether owned by governmental activities or business-type activities, are recorded and depreciated (unless the modified approach is used) in the government-wide financial statements. The City has chosen not to apply the modified approach to any networks or subsystems of infrastructure assets. No long-term assets or depreciation are shown in the governmental fund financial statements. Capital assets, including public domain infrastructure (i.e., roads, bridges, curbs and gutters, streets and sidewalks, and other assets that are immovable and of value only to the City) are reported in the applicable governmental or business-type activities columns in the government-wide financial statements. The government defines capital assets as assets with an initial, individual cost of more than $5,000 ($25,000 for capital improvement projects and infrastructure assets) and an estimated useful life greater than three years. Such assets are recorded at historical cost or estimated historical cost if actual amounts are unknown. Donated capital assets are recorded at acquisition value at the date of donation.
46
The cost of normal maintenance and repairs that do not add to the value of the asset or materially extend its life, are not capitalized. Major improvements are capitalized and depreciated over the remaining useful life of the related asset. Major outlays for capital assets and improvements are capitalized as projects are constructed. Property, plant and equipment is depreciated using the straight-line method over the following estimated useful lives (land and construction-in-progress are not depreciated):
Deferred Inflows of Resources Revenues and other governmental fund financial resources are recognized in the accounting period in which they become both measurable and available. When an asset is recorded in the governmental fund financial statements but the revenue is not available, the government reports a deferred inflow of resources until such time as the revenue becomes available. Revenue related to property tax and special assessment liens are recorded in governmental funds but the revenue is not available in the current period so it is reported as a deferred inflow of resources. Pensions and Other Postemployment Benefits For purposes of measuring the net pension and other postemployment benefits (OPEB) assets and liabilities, deferred outflows of resources and deferred inflows of resources related to pensions and OPEB, pension and OPEB expense, information about the pension plans’ fiduciary net position and additions to/deductions from the plans’ fiduciary net position have been determined on the same basis as they are reported by the plans. For this purpose, benefit payments (including refunds of employee contributions) are recognized when due and payable in accordance with the benefit terms. Investments are reported at fair value. Retirees are allowed to participate in the same healthcare plan as active employees and pay the same premium for this benefit which results in an implicit rate subsidy. Even though the City makes no direct payments on behalf of the retirees the City is required to report this implicit cost for active employees who will be able to continue to purchase health insurance once they retire. Compensated Absences Vacation and sick leave is granted to all regular and part-time permanent employees. The annual amount of vacation time accrued varies depending on classification and years of service. Accumulated vacation leave vests and the City is obligated to make payment if the employee terminates. Sick leave accrues at rates based on the full-time equivalency status of each employee. Sick leave is vested with 20 years of service. Sick leave is payable upon termination (if vested) or retirement, up to 50 percent (not more than 520 hours) of accumulated sick leave. For the governmental fund financial statements, the current payroll and current portion of the compensated absences are recorded as a current liability of the applicable funds. Long-term liabilities of governmental funds are not shown on the fund financial statements. For the government-wide financial statements, as well as the proprietary fund financial statements, all of the accrued liabilities for compensated absences are recorded as a liability. Long-Term Obligations In the government-wide financial statements, and proprietary fund types in the fund financial statements, long-term debt and other long-term obligations are reported as liabilities in the applicable statement of net
Assets Useful life (years) Buildings 10-50 Improvements 10-20 Machinery and Equipment 5-25 Infrastructure 25-75
47
position. Bond premiums and discounts are amortized over the life of the bonds using a method which approximates the effective interest method. In the fund financial statements, governmental fund types recognize bond premiums and discounts as well as bond issuance costs in the period in which the bonds are issued. The face amount of debt issued is reported as other financing sources. Premiums received on debt issuance are reported as other financing sources, while discounts on debt issuances are reported as other financing uses. Issuance costs, whether or not withheld from the actual debt proceeds received, are reported as debt service expenditures. Interfund Transactions Interfund transactions, consisting of services performed for other funds or costs billed to other funds are treated as expenditures in the fund receiving the services and as a reimbursement reducing expenditures in the fund performing the services. Exceptions include water sales, sewer charges, and environmental service charges that are recorded as revenue in the enterprise funds and expenses or expenditures in the department receiving the service. In addition, transfers are made between funds to shift resources from a fund legally authorized to receive revenue to a fund authorized to expend the revenue. Grant Revenue The City recognizes grant revenues (net of estimated uncollectible amounts, if any), when all applicable eligibility requirements, including time requirements, are met. Resources transmitted to the City before the eligibility requirements are met are reported as advance revenues. Some grants and contributions consist of capital assets or resources that are restricted to purchase, construct, or renovate capital assets associated with a specific program. These are reported separately from grants and contributions that may be used either for operating expenses or for capital expenditures of the program at the discretion of the City. Fund Balance In the fund financial statements, restricted fund balance is defined as that portion of fund balance that can be spent only for the specific purposes stipulated by constitution, external resource or through enabling legislation. Committed fund balance includes amounts constrained to specific purposes determined by a formal action of the City itself, using its highest level of decision-making authority (i.e. City Council). To be reported as committed, amounts cannot be used for any other purpose unless the City takes the same highest-level action to remove or change the constraint; this action would represent a City ordinance. Assigned fund balance amounts are intended to be used by the government for specific purposes but do not meet the criteria to be restricted or committed. Intent can be expressed by the City Council or by the budget committee with final review completed during the annual budget process; the City has no formal policy in place. Assigned fund balance represents the remaining amount that is not restricted or committed in governmental funds other than the general fund, which is classified as unassigned. Nonspendable fund balance represents amounts that are required to be maintained intact, such as inventories, and nonexpendable portion of permanent funds. Use of Estimates The preparation of the financial statements in conformity with GAAP requires management to make estimates and assumptions that affect the reported amount of assets and liabilities and disclosure of contingent assets and liabilities at the date of the financial statements and the reported amounts of revenues and expenses during the reporting period. Actual results could differ from those estimates.
48
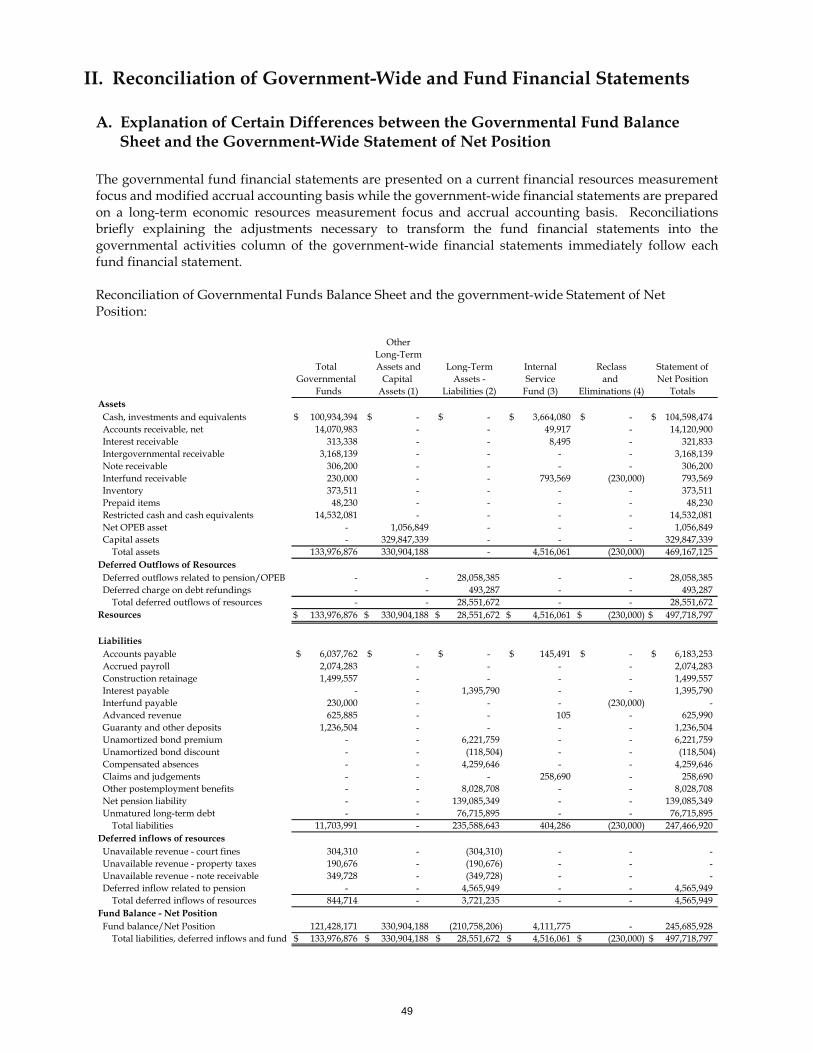
II. Reconciliation of Government-Wide and Fund Financial Statements A. Explanation of Certain Differences between the Governmental Fund Balance
Sheet and the Government-Wide Statement of Net Position The governmental fund financial statements are presented on a current financial resources measurement focus and modified accrual accounting basis while the government-wide financial statements are prepared on a long-term economic resources measurement focus and accrual accounting basis. Reconciliations briefly explaining the adjustments necessary to transform the fund financial statements into the governmental activities column of the government-wide financial statements immediately follow each fund financial statement. Reconciliation of Governmental Funds Balance Sheet and the government-wide Statement of Net Position:
OtherLong-Term
Total Assets and Long-Term Internal Reclass Statement ofGovernmental Capital Assets - Service and Net Position
Funds Assets (1) Liabilities (2) Fund (3) Eliminations (4) TotalsAssets Cash, investments and equivalents 100,934,394$ -$ -$ 3,664,080$ -$ 104,598,474$ Accounts receivable, net 14,070,983 - - 49,917 - 14,120,900 Interest receivable 313,338 - - 8,495 - 321,833 Intergovernmental receivable 3,168,139 - - - - 3,168,139 Note receivable 306,200 - - - - 306,200 Interfund receivable 230,000 - - 793,569 (230,000) 793,569 Inventory 373,511 - - - - 373,511 Prepaid items 48,230 - - - - 48,230 Restricted cash and cash equivalents 14,532,081 - - - - 14,532,081 Net OPEB asset - 1,056,849 - - - 1,056,849 Capital assets - 329,847,339 - - - 329,847,339
Total assets 133,976,876 330,904,188 - 4,516,061 (230,000) 469,167,125 Deferred Outflows of Resources Deferred outflows related to pension/OPEB - - 28,058,385 - - 28,058,385 Deferred charge on debt refundings - - 493,287 - - 493,287
Total deferred outflows of resources - - 28,551,672 - - 28,551,672 133,976,876$ 330,904,188$ 28,551,672$ 4,516,061$ (230,000)$ 497,718,797$
Liabilities Accounts payable 6,037,762$ -$ -$ 145,491$ -$ 6,183,253$ Accrued payroll 2,074,283 - - - - 2,074,283 Construction retainage 1,499,557 - - - - 1,499,557 Interest payable - - 1,395,790 - - 1,395,790 Interfund payable 230,000 - - - (230,000) - Advanced revenue 625,885 - - 105 - 625,990 Guaranty and other deposits 1,236,504 - - - - 1,236,504 Unamortized bond premium - - 6,221,759 - - 6,221,759 Unamortized bond discount - - (118,504) - - (118,504) Compensated absences - - 4,259,646 - - 4,259,646 Claims and judgements - - - 258,690 - 258,690 Other postemployment benefits - - 8,028,708 - - 8,028,708 Net pension liability - - 139,085,349 - - 139,085,349 Unmatured long-term debt - - 76,715,895 - - 76,715,895
Total liabilities 11,703,991 - 235,588,643 404,286 (230,000) 247,466,920 Deferred inflows of resources Unavailable revenue - court fines 304,310 - (304,310) - - - Unavailable revenue - property taxes 190,676 - (190,676) - - - Unavailable revenue - note receivable 349,728 - (349,728) - - - Deferred inflow related to pension - - 4,565,949 - - 4,565,949
Total deferred inflows of resources 844,714 - 3,721,235 - - 4,565,949 Fund Balance - Net Position Fund balance/Net Position 121,428,171 330,904,188 (210,758,206) 4,111,775 - 245,685,928
133,976,876$ 330,904,188$ 28,551,672$ 4,516,061$ (230,000)$ 497,718,797$ Total liabilities, deferred inflows and fund
Resources
49
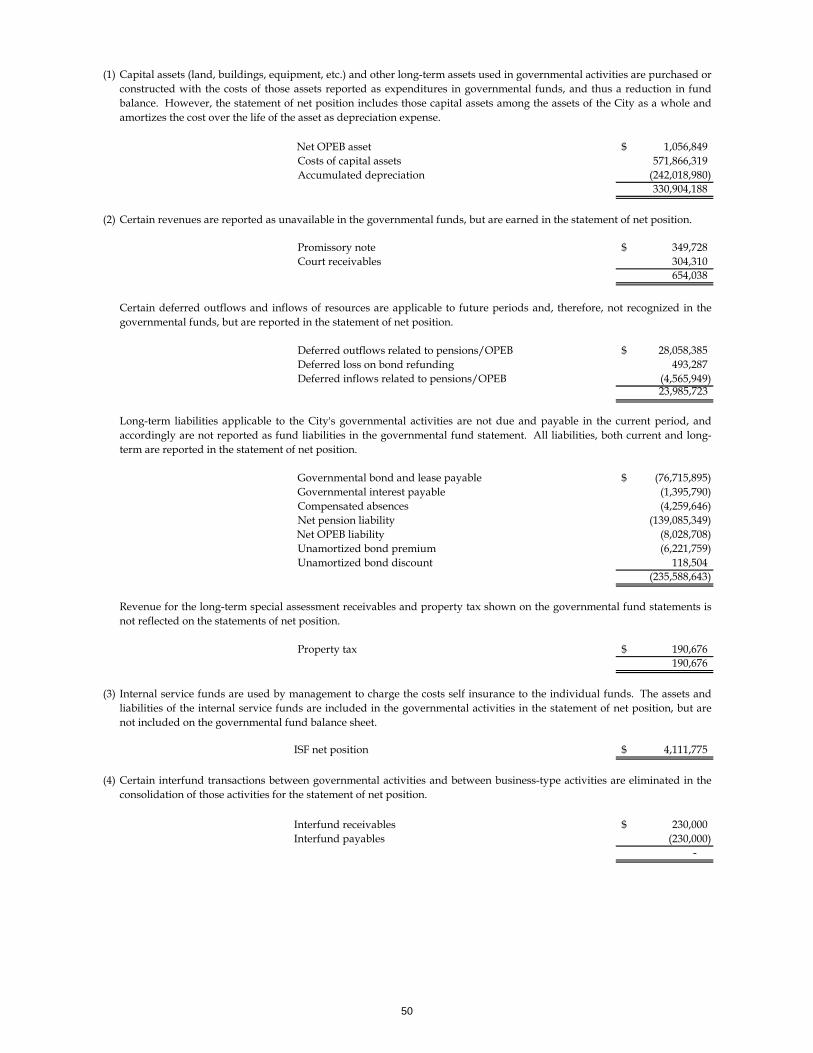
(1)
Net OPEB asset 1,056,849$ Costs of capital assets 571,866,319 Accumulated depreciation (242,018,980)
330,904,188
(2)
Promissory note 349,728$ Court receivables 304,310
654,038
Deferred outflows related to pensions/OPEB 28,058,385$ Deferred loss on bond refunding 493,287 Deferred inflows related to pensions/OPEB (4,565,949)
23,985,723
Governmental bond and lease payable (76,715,895)$ Governmental interest payable (1,395,790) Compensated absences (4,259,646) Net pension liability (139,085,349)
Net OPEB liability (8,028,708) Unamortized bond premium (6,221,759) Unamortized bond discount 118,504
(235,588,643)
Property tax 190,676$ 190,676
(3)
ISF net position 4,111,775$
(4)
Interfund receivables 230,000$ Interfund payables (230,000)
-
Internal service funds are used by management to charge the costs self insurance to the individual funds. The assets andliabilities of the internal service funds are included in the governmental activities in the statement of net position, but arenot included on the governmental fund balance sheet.
Certain interfund transactions between governmental activities and between business-type activities are eliminated in theconsolidation of those activities for the statement of net position.
Capital assets (land, buildings, equipment, etc.) and other long-term assets used in governmental activities are purchased or constructed with the costs of those assets reported as expenditures in governmental funds, and thus a reduction in fundbalance. However, the statement of net position includes those capital assets among the assets of the City as a whole andamortizes the cost over the life of the asset as depreciation expense.
Certain revenues are reported as unavailable in the governmental funds, but are earned in the statement of net position.
Long-term liabilities applicable to the City's governmental activities are not due and payable in the current period, andaccordingly are not reported as fund liabilities in the governmental fund statement. All liabilities, both current and long-term are reported in the statement of net position.
Certain deferred outflows and inflows of resources are applicable to future periods and, therefore, not recognized in thegovernmental funds, but are reported in the statement of net position.
Revenue for the long-term special assessment receivables and property tax shown on the governmental fund statements isnot reflected on the statements of net position.
50
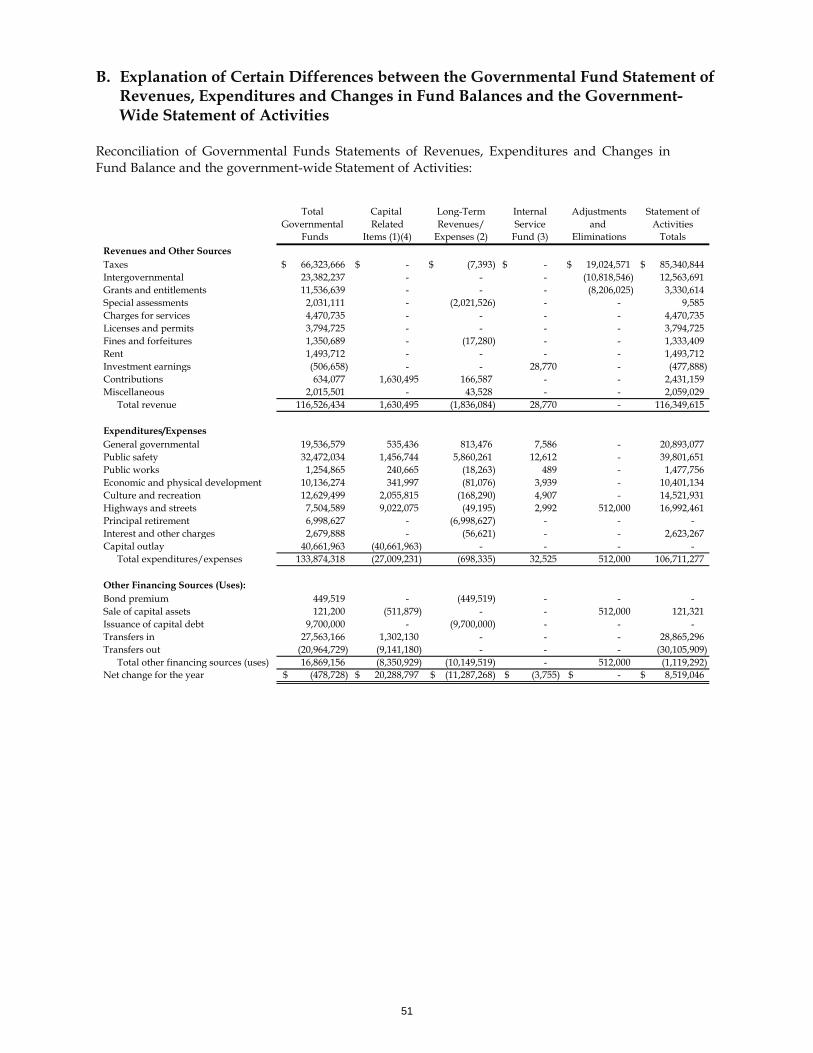
B. Explanation of Certain Differences between the Governmental Fund Statement of Revenues, Expenditures and Changes in Fund Balances and the Government-Wide Statement of Activities
Reconciliation of Governmental Funds Statements of Revenues, Expenditures and Changes in Fund Balance and the government-wide Statement of Activities:
Total Capital Long-Term Internal Adjustments Statement ofGovernmental Related Revenues/ Service and Activities
Funds Items (1)(4) Expenses (2) Fund (3) Eliminations TotalsRevenues and Other SourcesTaxes 66,323,666$ -$ (7,393)$ -$ 19,024,571$ 85,340,844$ Intergovernmental 23,382,237 - - - (10,818,546) 12,563,691 Grants and entitlements 11,536,639 - - - (8,206,025) 3,330,614 Special assessments 2,031,111 - (2,021,526) - - 9,585 Charges for services 4,470,735 - - - - 4,470,735 Licenses and permits 3,794,725 - - - - 3,794,725 Fines and forfeitures 1,350,689 - (17,280) - - 1,333,409 Rent 1,493,712 - - - - 1,493,712 Investment earnings (506,658) - - 28,770 - (477,888) Contributions 634,077 1,630,495 166,587 - - 2,431,159 Miscellaneous 2,015,501 - 43,528 - - 2,059,029
Total revenue 116,526,434 1,630,495 (1,836,084) 28,770 - 116,349,615
Expenditures/ExpensesGeneral governmental 19,536,579 535,436 813,476 7,586 - 20,893,077 Public safety 32,472,034 1,456,744 5,860,261 12,612 - 39,801,651 Public works 1,254,865 240,665 (18,263) 489 - 1,477,756 Economic and physical development 10,136,274 341,997 (81,076) 3,939 - 10,401,134 Culture and recreation 12,629,499 2,055,815 (168,290) 4,907 - 14,521,931 Highways and streets 7,504,589 9,022,075 (49,195) 2,992 512,000 16,992,461 Principal retirement 6,998,627 - (6,998,627) - - - Interest and other charges 2,679,888 - (56,621) - - 2,623,267 Capital outlay 40,661,963 (40,661,963) - - - -
Total expenditures/expenses 133,874,318 (27,009,231) (698,335) 32,525 512,000 106,711,277
Other Financing Sources (Uses):Bond premium 449,519 - (449,519) - - - Sale of capital assets 121,200 (511,879) - - 512,000 121,321 Issuance of capital debt 9,700,000 - (9,700,000) - - - Transfers in 27,563,166 1,302,130 - - - 28,865,296 Transfers out (20,964,729) (9,141,180) - - - (30,105,909)
Total other financing sources (uses) 16,869,156 (8,350,929) (10,149,519) - 512,000 (1,119,292) Net change for the year (478,728)$ 20,288,797$ (11,287,268)$ (3,755)$ -$ 8,519,046$
51
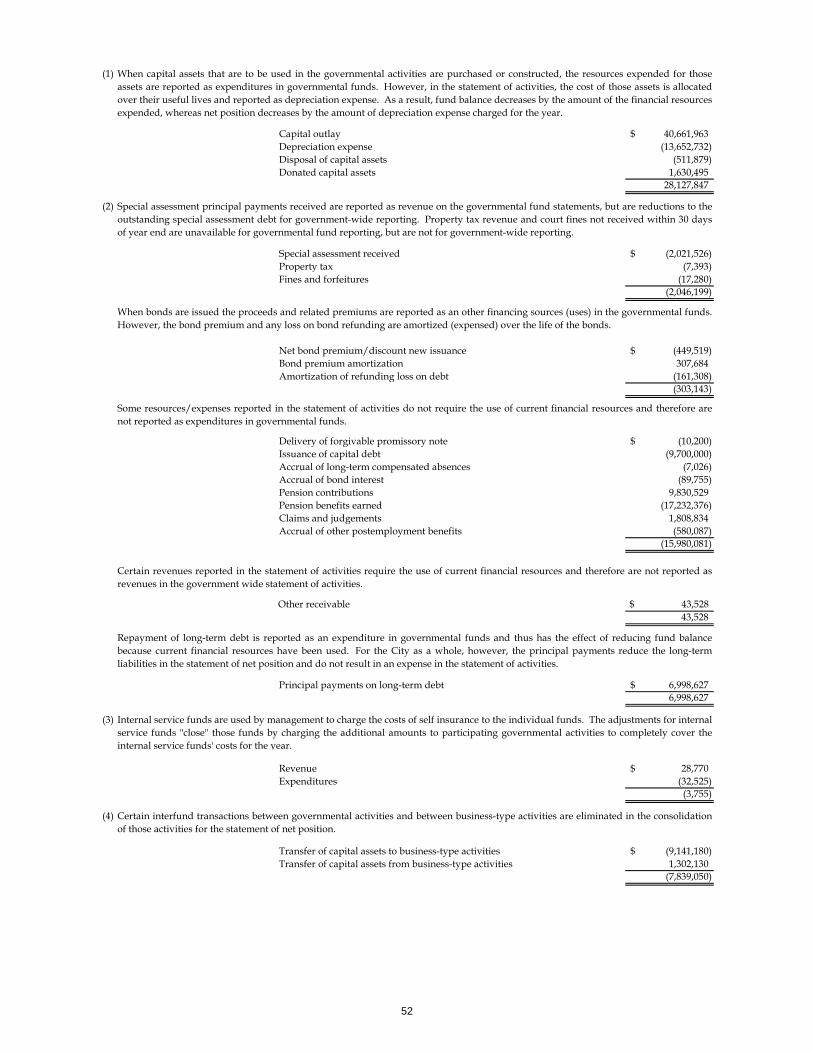
(1)
Capital outlay 40,661,963$ Depreciation expense (13,652,732) Disposal of capital assets (511,879) Donated capital assets 1,630,495
28,127,847
(2)
Special assessment received (2,021,526)$ Property tax (7,393) Fines and forfeitures (17,280)
(2,046,199)
Net bond premium/discount new issuance (449,519)$ Bond premium amortization 307,684 Amortization of refunding loss on debt (161,308)
(303,143)
Delivery of forgivable promissory note (10,200)$ Issuance of capital debt (9,700,000) Accrual of long-term compensated absences (7,026) Accrual of bond interest (89,755) Pension contributions 9,830,529 Pension benefits earned (17,232,376) Claims and judgements 1,808,834 Accrual of other postemployment benefits (580,087)
(15,980,081)
Other receivable $ 43,528 43,528
Principal payments on long-term debt 6,998,627$ 6,998,627
(3)
Revenue 28,770$ Expenditures (32,525)
(3,755)
(4)
Transfer of capital assets to business-type activities (9,141,180)$ Transfer of capital assets from business-type activities 1,302,130
(7,839,050)
Repayment of long-term debt is reported as an expenditure in governmental funds and thus has the effect of reducing fund balancebecause current financial resources have been used. For the City as a whole, however, the principal payments reduce the long-termliabilities in the statement of net position and do not result in an expense in the statement of activities.
Internal service funds are used by management to charge the costs of self insurance to the individual funds. The adjustments for internalservice funds "close" those funds by charging the additional amounts to participating governmental activities to completely cover theinternal service funds' costs for the year.
Certain interfund transactions between governmental activities and between business-type activities are eliminated in the consolidationof those activities for the statement of net position.
When capital assets that are to be used in the governmental activities are purchased or constructed, the resources expended for thoseassets are reported as expenditures in governmental funds. However, in the statement of activities, the cost of those assets is allocatedover their useful lives and reported as depreciation expense. As a result, fund balance decreases by the amount of the financial resourcesexpended, whereas net position decreases by the amount of depreciation expense charged for the year.
Special assessment principal payments received are reported as revenue on the governmental fund statements, but are reductions to theoutstanding special assessment debt for government-wide reporting. Property tax revenue and court fines not received within 30 daysof year end are unavailable for governmental fund reporting, but are not for government-wide reporting.
When bonds are issued the proceeds and related premiums are reported as an other financing sources (uses) in the governmental funds.However, the bond premium and any loss on bond refunding are amortized (expensed) over the life of the bonds.
Some resources/expenses reported in the statement of activities do not require the use of current financial resources and therefore arenot reported as expenditures in governmental funds.
Certain revenues reported in the statement of activities require the use of current financial resources and therefore are not reported asrevenues in the government wide statement of activities.
52
Fund Balance Classification Fund balances for governmental funds are reported in classifications that comprise a hierarchy based primarily on the extent to which the government is bound to honor constraints on the specific purposes for which amounts in those funds can be spent. The classifications of nonspendable, restricted, committed, assigned and unassigned designate the relative strength of the constraints placed on how the amounts can be spent. Classification of fund balances imposed by the reporting government, whether by administrative policy or legislative action of the City Council, are shown in aggregate on the government fund financial statements, but not on the proprietary statement of net position. Restricted net position on the government-wide financial statements reflects restrictions imposed by external sources. Nonspendable fund balance represents amounts that are nonspendable such as inventories and nonexpendable portion of permanent funds. Restricted fund balances represent constraints placed on the use of resources imposed externally by creditors, grantors, contributors, or laws and regulations of other governments. Resources imposed by constitutional provisions of enabling legislation that allows the ability to levy, charge, or mandate payment of resources are also classified as restricted. Committed fund balance includes amounts that can be used only for the specific purposes determined by adoption of a City ordinance by the City Council, the government’s highest level of decision-making authority. A formal action would also be required to modify or rescind an established commitment as related to the adopted City ordinance. Assigned fund balance amounts are intended to be used by the government for specific purposes but do not meet the criteria to be restricted or committed. Assigned fund balance is expressed by the direction of the City Council and budget committee as part of the annual budgeting process. Authority to assign amounts used for specific purposes is confirmed as part of the annual budgeting process, the City has no formal policy that establishes this practice. Unassigned fund balance represents the remaining amount that is not restricted, committed, nonspendable nor assigned in the general fund. Unassigned amounts are only reported in the general fund or as a negative amount in all other funds. Consideration is made that restricted amounts are reduced first, followed by assigned amounts, and then unassigned amounts when expenditures are incurred for purposes which both restricted and unrestricted fund balance is available. Also, committed, assigned, or unassigned amounts are considered to have been spent when an expenditure is incurred for purposes for which amounts in unrestricted fund balance classification could be used. Absent of a minimum fund balance policy, the City, through the budgeting process, establishes a minimum fund balance level to maintain as part of that process. A minimum balance of 15% is suggested in the general fund and a 10% fund balance is suggested for special revenue and enterprise funds. Deficit Fund Balance A deficit unassigned fund balance of $69,050 exists in the Capital Projects Fund. The deficit is a result of beginning construction of bonded projects prior to the receipt of proceeds. A loan from other funds, will be reported in the next period. A deficit unassigned fund balance of $1,018 exists in Other Governmental Funds for the Flagstaff Metropolitan Planning Organization (FMPO) due to the timing and receipt of other contributions on a cost reimbursement basis.
53

Governmental fund balances as of June 30, 2018 are as follows:
C. Change in Accounting Principle Net position as of July 1, 2017, has been restated as follows for the implementation of GASB Statement No. 75, Accounting and Financial Reporting for Postemployment Benefits Other Than Pensions (OPEB), as amended by GASB Statement No. 85, Omnibus 2017.
General Fund
Transportation Fund
Capital Projects Bond
Construction
Other Governmental
Funds
Total Governmental
FundsFund balances: Nonspendable: Perpetual care -$ -$ -$ 268,513$ 268,513$ Inventory/Prepaid 371,817 - - 49,924 421,741 Restricted for: Library branch services - - - 1,326,601 1,326,601 Library programs externally directed - - - 908,090 908,090 Court improvements and operations 216,852 - - - 216,852 Debt service - 3,629,083 - 9,340,531 12,969,614 Street improvements - 30,816,678 - 9,125,551 39,942,229 Transit - 4,944,964 - - 4,944,964 Public art - - - 840,899 840,899 Parks operations - - - 1,985,379 1,985,379 Economic Development - - - 1,127,039 1,127,039 Tourism - - - 1,852,278 1,852,278 Perpetual care - - - 28,813 28,813 Development fee projects 2,063,047 - - - 2,063,047 Other capital projects 58,745 3,558,964 5,905,934 6,876,428 16,400,071 Assigned to: Capital reserve 6,348,611 - - - 6,348,611 Real estate 531,197 - - - 531,197 Parking district - - - 613,109 613,109 Library services - - - 1,250,977 1,250,977 Unassigned: 27,458,215 - (69,050) (1,018) 27,388,147 Total fund balances 37,048,484$ 42,949,689$ 5,836,884$ 35,593,114$ 121,428,171$
Water & Environmental OtherGovernmental Business-Type Wastewater Services Stormwater Proprietary
Activities Activities Fund Fund Fund FundsNet position as previously reported at June 30, 2017 238,887,943$ 346,870,356$ 245,474,867$ 17,384,293$ 42,935,201$ 41,850,056$ Prior period adjustment -
Implementation of GASB 75:Net OPEB asset (measurement dateas of June 30, 2016) 879,657 - - - - - Net OPEB liability (measurement date as of June 30, 2016) (2,726,661) (708,994) (301,727) (223,297) (27,503) (156,467) Deferred outflows - Citycontributions made during fiscalyear 2017 125,943 29,869 13,088 9,863 1,262 5,656
Total prior period adjustment (1,721,061) (679,125) (288,639) (213,434) (26,241) (150,811) Net position as restated, July 1, 2017 237,166,882$ 346,191,231$ 245,186,228$ 17,170,859$ 42,908,960$ 41,699,245$
54

III. Stewardship, Compliance and Accountability A. Budgetary Information Budget Basis of Accounting The City's accounting records for general government operations (general, special revenue and debt service funds) are essentially maintained on a basis consistent with Generally Accepted Accounting Principles (GAAP) except for 60 days sales tax accrual, unrealized gain or loss on investments and allowance for doubtful accounts. Measurable revenues are recorded when they become available to finance expenditures in the current fiscal year. "Available" is defined as: collectible within the current period or soon enough thereafter to be used to pay liabilities of the current period. Expenditures, other than principal and interest on debt, are recognized in the accounting period in which the liability arises. State statute allows for encumbrances to be recognized for a 60-day period following the end of the prior fiscal year as uses of prior year appropriations. To ensure that appropriations do not lapse, divisions are directed to re-budget for all items delivered after June 30. For the enterprise funds, the annual budget is prepared on a basis that differs from GAAP because state law requires capital purchases and debt service payments to be budgeted as expenses, and bond proceeds and grants that are to be utilized are to be budgeted as revenues. The accounting and budgeting systems for the City are in accordance with Generally Accepted Accounting Principles (GAAP) format, with minimal variances between the two systems. Budget basis for enterprise funds differ primarily due to state laws. The major differences are as follows: • Encumbrances (contractual commitments) are considered the equivalent of expenditures.
Encumbrances at year-end for goods or services which are not received prior to the end of the fiscal year are cancelled.
• Fund balances reserved for inventory and bonded debt are not included in the budget. • Certain expenses, such as depreciation, compensated absences and landfill closure and post closure
accruals, are not included in the budget. • Enterprise funds budget capital expenditures and debt service payments as expenses. • Enterprise funds budget bond proceeds as revenues. The City will utilize a number of different fund types to segregate the financial activity within the City either due to regulatory reasons or as designated internally. The fund classifications are Governmental Funds, Proprietary Funds and Fiduciary Funds. Review and Approval Issues presented during the review and approval period include discussion topics of the Council during the various retreats. These retreats were held in January and February to give City staff the opportunity to present major discussion points to Council and the public. The goal is for Council to make policy decisions and direct staff in preparing the budget. This provides adequate time for the Council to gather input on major budget issues prior to preparation of the budget. The City Council holds Study Sessions in April. The Council reviews and discusses the issue papers included in the Budget Review Book as well as all personnel recommendations, capital equipment recommendations and the capital improvement plan. The Council arrives at a consensus for all decisions needed. The Study Sessions provide the opportunity for City management, divisions and the public to offer information and recommendations to the City Council. The proposed budget is presented to Council for tentative adoption on or before the third Tuesday in June. Two public hearings are held on the content of the budget. State law requires the operating budget to be all-inclusive. Therefore, the budget includes provisions for contingent revenues, e.g., passenger facility charges, and expenditures that cannot be accurately determined when the budget is adopted, e.g., grants.
55
The resolution adopting the annual budget requires Council authorization for any expenditure from contingencies, as well as transfer of budget authority between divisions. The City operates under the State Expenditure Limitation with a one-time adjustment to the base. The adjustment provided for an increase to the base limit to allow for the expenditure of funds resulting from the addition of a 2% Bed, Board and Beverage Tax. Flagstaff is not a Home Rule city. Alternative Home Rule Expenditure Control municipalities require voter approval every four years. The adopted budget reflects the total funds appropriated. Certain exclusions are allowed by the state (e.g., bond proceeds, debt service and grants) in computing the Expenditure Limitation and this total cannot be exceeded. Budget authority can be transferred between line items within a section. At year-end, division budgets are reviewed, and budget authority is transferred from contingencies by resolution, if between divisions, as necessary. Council can also amend total appropriations for a division during the year by resolution if there is a corresponding increase/decrease in another division so that the expenditure limitation is not exceeded. B. Excess of Expenditures over Appropriations Expenditure appropriations are adopted in the budget at the division level. For presentation purposes, we have elected to show any deficits at the division level within funds. As of June 30, 2018 there are no divisions with and excess of expenditures over appropriations.
IV. Detailed Notes on All Funds A. Deposits and Investments The City maintains a cash and investment pool that is available for use by all funds. Each fund type’s portion of this pool is displayed on the government-wide Statement of Net Position as “Cash and cash equivalents,” “Investments,” and “Restricted cash and investments.” Deposits At June 30, 2018, the carrying amount of the City’s deposits was $47,946,839 and the bank balance was $50,048,702. The $2,101,863 difference represents deposits in transit, outstanding checks, and other reconciling items at June 30, 2018. There is an additional $9,862,707 reported as restricted cash as it is held with paying or fiscal agent on June 30, 2018 for debt service payments due on July 1, 2018. Custodial Credit Risk Custodial credit risk is the risk that in the event of a bank failure, the government’s deposits may not be returned to it. Statutes and the City’s investment policy require collateral for demand deposits, certificates of deposit, and repurchase agreements at 102 percent of all deposits not covered by federal depository insurance. All investments are either registered in the City’s name or are held by a third party in the City’s name. All deposits were collateralized at June 30, 2018. Interest Rate Risk As a means of limiting its exposure to fair value losses arising from rising interest rates, the City’s investment policy matches maturities with cash flow dates, unless matched to a specific requirement the City may not invest more than 25 percent of the portfolio for a period greater than three years or any portion of the portfolio for a period greater than 10 years. At June 30, 2018, the City’s investments included the following:
56
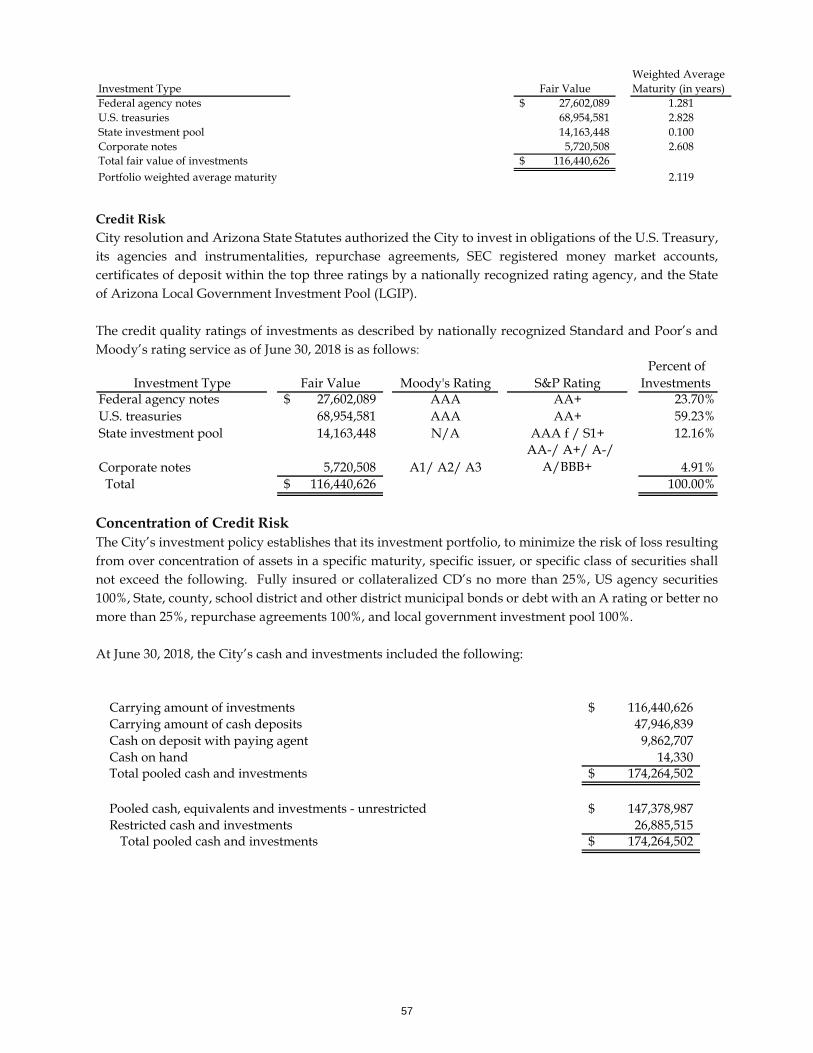
Credit Risk City resolution and Arizona State Statutes authorized the City to invest in obligations of the U.S. Treasury, its agencies and instrumentalities, repurchase agreements, SEC registered money market accounts, certificates of deposit within the top three ratings by a nationally recognized rating agency, and the State of Arizona Local Government Investment Pool (LGIP). The credit quality ratings of investments as described by nationally recognized Standard and Poor’s and Moody’s rating service as of June 30, 2018 is as follows:
Concentration of Credit Risk The City’s investment policy establishes that its investment portfolio, to minimize the risk of loss resulting from over concentration of assets in a specific maturity, specific issuer, or specific class of securities shall not exceed the following. Fully insured or collateralized CD’s no more than 25%, US agency securities 100%, State, county, school district and other district municipal bonds or debt with an A rating or better no more than 25%, repurchase agreements 100%, and local government investment pool 100%. At June 30, 2018, the City’s cash and investments included the following:
Weighted AverageInvestment Type Fair Value Maturity (in years)Federal agency notes 27,602,089$ 1.281U.S. treasuries 68,954,581 2.828State investment pool 14,163,448 0.100Corporate notes 5,720,508 2.608Total fair value of investments 116,440,626$ Portfolio weighted average maturity 2.119
Percent of Investment Type Fair Value Moody's Rating S&P Rating Investments
Federal agency notes 27,602,089$ AAA AA+ 23.70%U.S. treasuries 68,954,581 AAA AA+ 59.23%State investment pool 14,163,448 N/A AAA f / S1+ 12.16%
Corporate notes 5,720,508 A1/ A2/ A3 AA-/ A+/ A-/
A/BBB+ 4.91% Total 116,440,626$ 100.00%
Carrying amount of investments 116,440,626$ Carrying amount of cash deposits 47,946,839 Cash on deposit with paying agent 9,862,707 Cash on hand 14,330 Total pooled cash and investments 174,264,502$
Pooled cash, equivalents and investments - unrestricted 147,378,987$ Restricted cash and investments 26,885,515
Total pooled cash and investments 174,264,502$
57
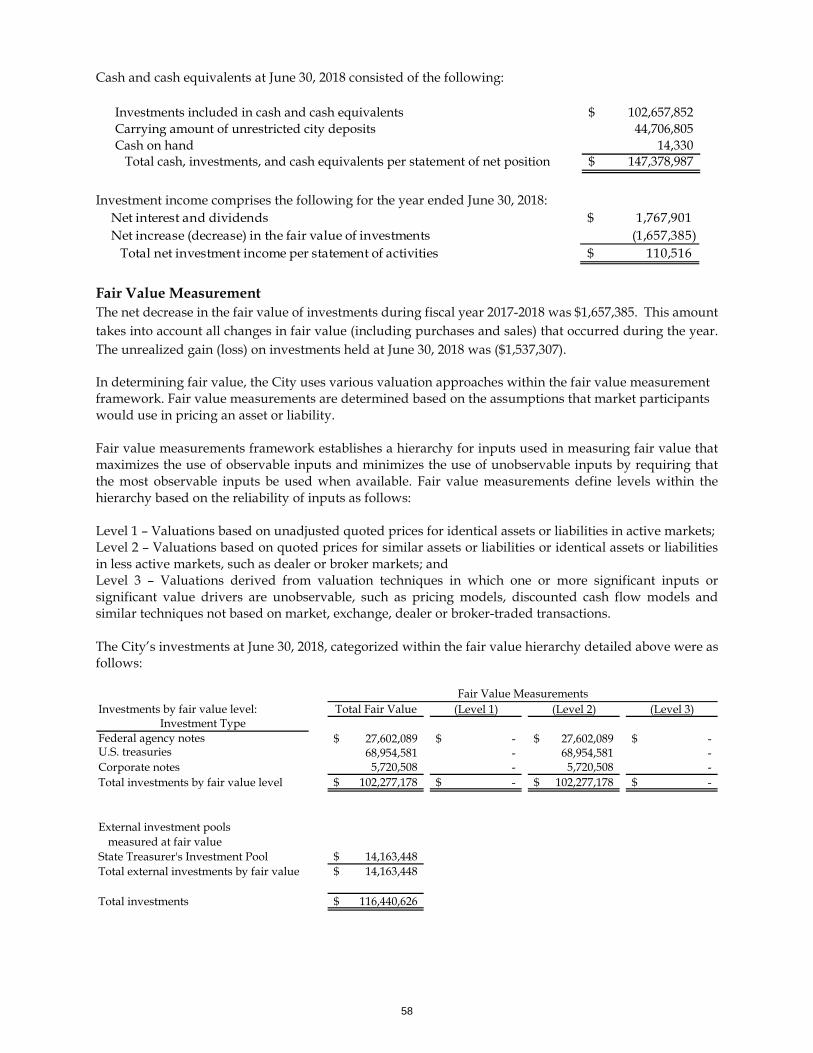
Cash and cash equivalents at June 30, 2018 consisted of the following:
Investment income comprises the following for the year ended June 30, 2018:
Fair Value Measurement The net decrease in the fair value of investments during fiscal year 2017-2018 was $1,657,385. This amount takes into account all changes in fair value (including purchases and sales) that occurred during the year. The unrealized gain (loss) on investments held at June 30, 2018 was ($1,537,307). In determining fair value, the City uses various valuation approaches within the fair value measurement framework. Fair value measurements are determined based on the assumptions that market participants would use in pricing an asset or liability. Fair value measurements framework establishes a hierarchy for inputs used in measuring fair value that maximizes the use of observable inputs and minimizes the use of unobservable inputs by requiring that the most observable inputs be used when available. Fair value measurements define levels within the hierarchy based on the reliability of inputs as follows: Level 1 – Valuations based on unadjusted quoted prices for identical assets or liabilities in active markets; Level 2 – Valuations based on quoted prices for similar assets or liabilities or identical assets or liabilities in less active markets, such as dealer or broker markets; and Level 3 – Valuations derived from valuation techniques in which one or more significant inputs or significant value drivers are unobservable, such as pricing models, discounted cash flow models and similar techniques not based on market, exchange, dealer or broker-traded transactions. The City’s investments at June 30, 2018, categorized within the fair value hierarchy detailed above were as follows:
Investments included in cash and cash equivalents 102,657,852$ Carrying amount of unrestricted city deposits 44,706,805 Cash on hand 14,330 Total cash, investments, and cash equivalents per statement of net position 147,378,987$
Net interest and dividends 1,767,901$ Net increase (decrease) in the fair value of investments (1,657,385)
Total net investment income per statement of activities 110,516$
Investments by fair value level: Total Fair Value (Level 1) (Level 2) (Level 3)Investment Type
Federal agency notes 27,602,089$ -$ 27,602,089$ -$ U.S. treasuries 68,954,581 - 68,954,581 - Corporate notes 5,720,508 - 5,720,508 - Total investments by fair value level 102,277,178$ -$ 102,277,178$ -$
External investment poolsmeasured at fair value
State Treasurer's Investment Pool 14,163,448$ Total external investments by fair value 14,163,448$
Total investments 116,440,626$
Fair Value Measurements
58
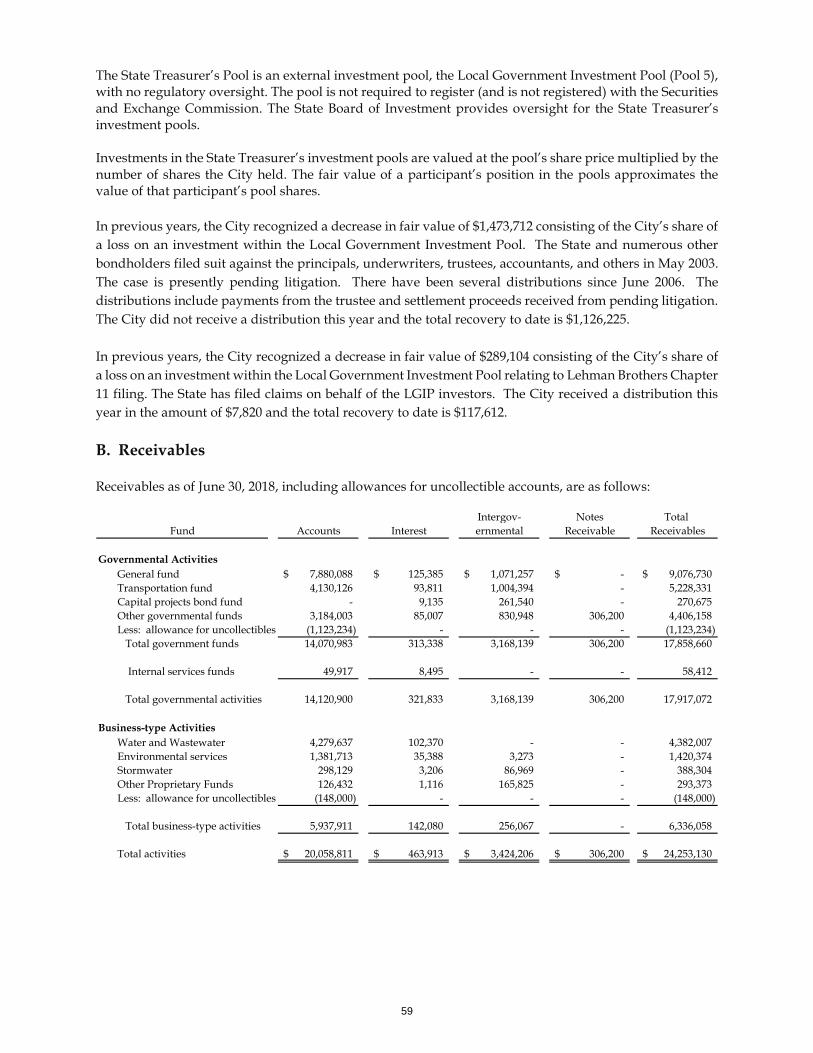
The State Treasurer’s Pool is an external investment pool, the Local Government Investment Pool (Pool 5), with no regulatory oversight. The pool is not required to register (and is not registered) with the Securities and Exchange Commission. The State Board of Investment provides oversight for the State Treasurer’s investment pools. Investments in the State Treasurer’s investment pools are valued at the pool’s share price multiplied by the number of shares the City held. The fair value of a participant’s position in the pools approximates the value of that participant’s pool shares. In previous years, the City recognized a decrease in fair value of $1,473,712 consisting of the City’s share of a loss on an investment within the Local Government Investment Pool. The State and numerous other bondholders filed suit against the principals, underwriters, trustees, accountants, and others in May 2003. The case is presently pending litigation. There have been several distributions since June 2006. The distributions include payments from the trustee and settlement proceeds received from pending litigation. The City did not receive a distribution this year and the total recovery to date is $1,126,225. In previous years, the City recognized a decrease in fair value of $289,104 consisting of the City’s share of a loss on an investment within the Local Government Investment Pool relating to Lehman Brothers Chapter 11 filing. The State has filed claims on behalf of the LGIP investors. The City received a distribution this year in the amount of $7,820 and the total recovery to date is $117,612. B. Receivables Receivables as of June 30, 2018, including allowances for uncollectible accounts, are as follows:
Intergov- Notes Total Accounts Interest ernmental Receivable Receivables
Governmental ActivitiesGeneral fund 7,880,088$ 125,385$ 1,071,257$ -$ 9,076,730$ Transportation fund 4,130,126 93,811 1,004,394 - 5,228,331 Capital projects bond fund - 9,135 261,540 - 270,675 Other governmental funds 3,184,003 85,007 830,948 306,200 4,406,158 Less: allowance for uncollectibles (1,123,234) - - - (1,123,234) Total government funds 14,070,983 313,338 3,168,139 306,200 17,858,660
Internal services funds 49,917 8,495 - - 58,412
Total governmental activities 14,120,900 321,833 3,168,139 306,200 17,917,072
Business-type ActivitiesWater and Wastewater 4,279,637 102,370 - - 4,382,007 Environmental services 1,381,713 35,388 3,273 - 1,420,374 Stormwater 298,129 3,206 86,969 - 388,304 Other Proprietary Funds 126,432 1,116 165,825 - 293,373 Less: allowance for uncollectibles (148,000) - - - (148,000)
Total business-type activities 5,937,911 142,080 256,067 - 6,336,058
Total activities 20,058,811$ 463,913$ 3,424,206$ 306,200$ 24,253,130$
Fund
59
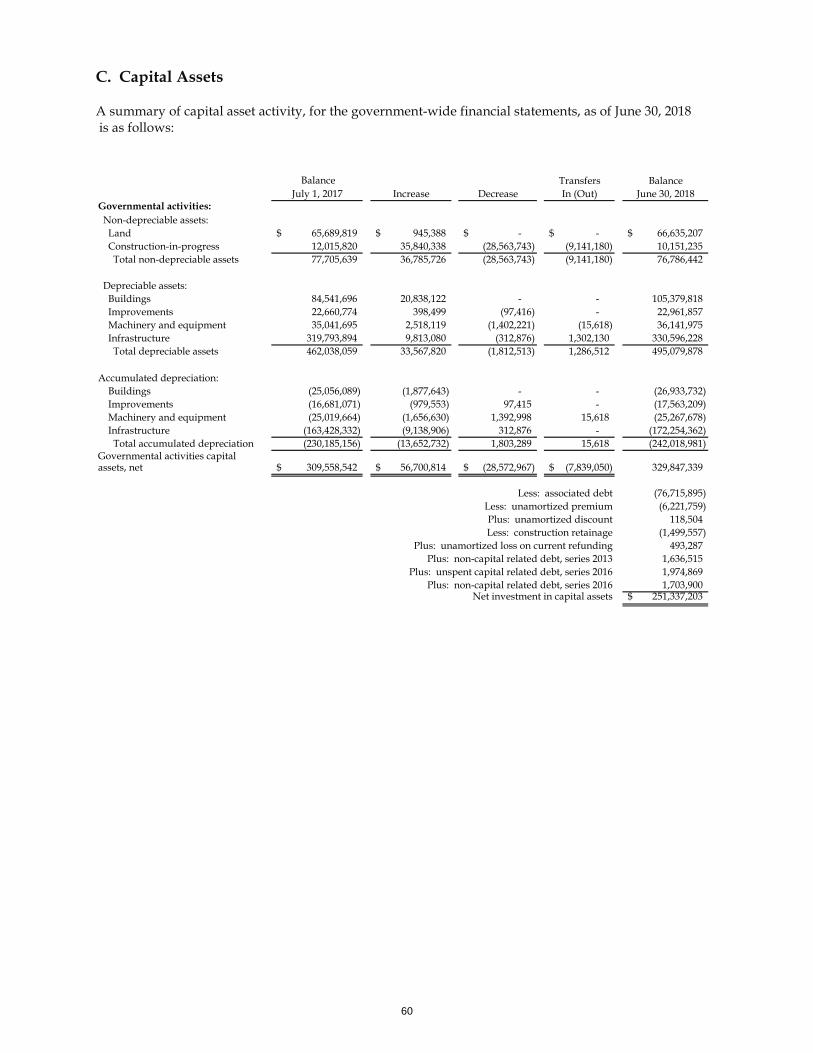
C. Capital Assets A summary of capital asset activity, for the government-wide financial statements, as of June 30, 2018 is as follows:
Balance Transfers BalanceJuly 1, 2017 Increase Decrease In (Out) June 30, 2018
Governmental activities: Non-depreciable assets: Land 65,689,819$ 945,388$ -$ -$ 66,635,207$ Construction-in-progress 12,015,820 35,840,338 (28,563,743) (9,141,180) 10,151,235 Total non-depreciable assets 77,705,639 36,785,726 (28,563,743) (9,141,180) 76,786,442
Depreciable assets: Buildings 84,541,696 20,838,122 - - 105,379,818 Improvements 22,660,774 398,499 (97,416) - 22,961,857 Machinery and equipment 35,041,695 2,518,119 (1,402,221) (15,618) 36,141,975 Infrastructure 319,793,894 9,813,080 (312,876) 1,302,130 330,596,228 Total depreciable assets 462,038,059 33,567,820 (1,812,513) 1,286,512 495,079,878 Accumulated depreciation: Buildings (25,056,089) (1,877,643) - - (26,933,732) Improvements (16,681,071) (979,553) 97,415 - (17,563,209) Machinery and equipment (25,019,664) (1,656,630) 1,392,998 15,618 (25,267,678) Infrastructure (163,428,332) (9,138,906) 312,876 - (172,254,362) Total accumulated depreciation (230,185,156) (13,652,732) 1,803,289 15,618 (242,018,981) Governmental activities capitalassets, net 309,558,542$ 56,700,814$ (28,572,967)$ (7,839,050)$ 329,847,339
Less: associated debt (76,715,895) Less: unamortized premium (6,221,759) Plus: unamortized discount 118,504 Less: construction retainage (1,499,557)
Plus: unamortized loss on current refunding 493,287 Plus: non-capital related debt, series 2013 1,636,515
Plus: unspent capital related debt, series 2016 1,974,869 Plus: non-capital related debt, series 2016 1,703,900
Net investment in capital assets 251,337,203$
60
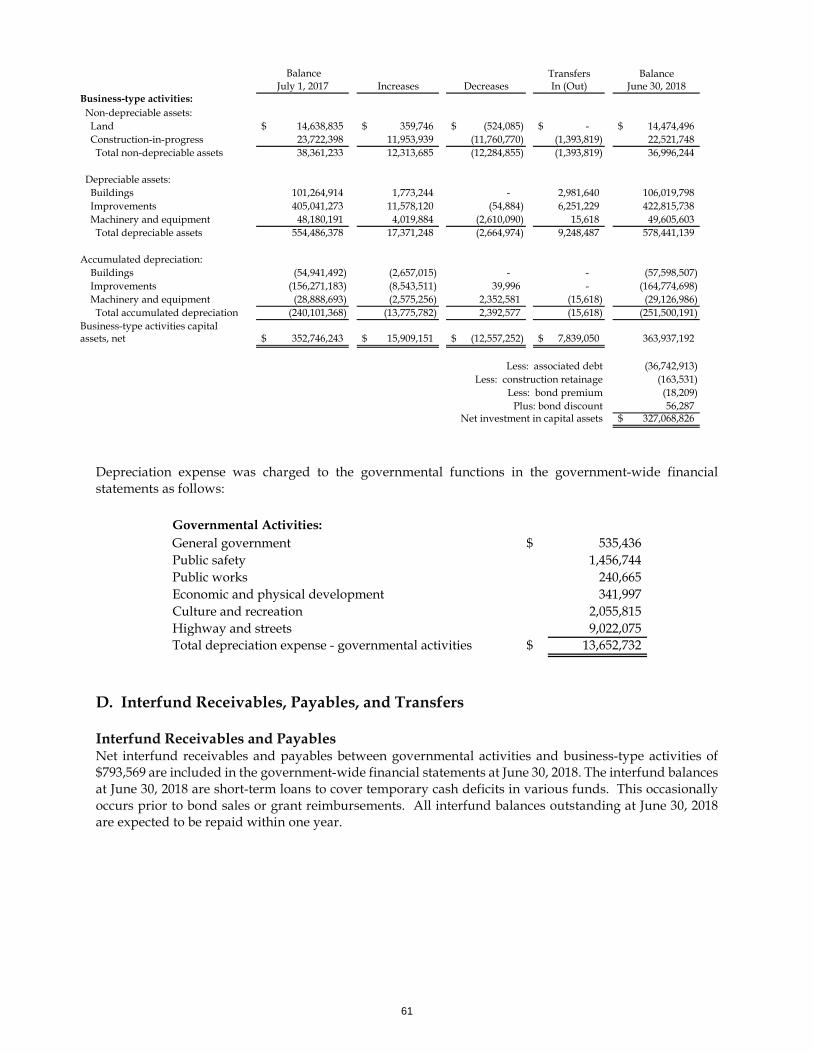
Depreciation expense was charged to the governmental functions in the government-wide financial statements as follows:
D. Interfund Receivables, Payables, and Transfers Interfund Receivables and Payables Net interfund receivables and payables between governmental activities and business-type activities of $793,569 are included in the government-wide financial statements at June 30, 2018. The interfund balances at June 30, 2018 are short-term loans to cover temporary cash deficits in various funds. This occasionally occurs prior to bond sales or grant reimbursements. All interfund balances outstanding at June 30, 2018 are expected to be repaid within one year.
Balance Transfers BalanceJuly 1, 2017 Increases Decreases In (Out) June 30, 2018
Business-type activities: Non-depreciable assets: Land 14,638,835$ 359,746$ (524,085)$ -$ 14,474,496$ Construction-in-progress 23,722,398 11,953,939 (11,760,770) (1,393,819) 22,521,748 Total non-depreciable assets 38,361,233 12,313,685 (12,284,855) (1,393,819) 36,996,244
Depreciable assets: Buildings 101,264,914 1,773,244 - 2,981,640 106,019,798 Improvements 405,041,273 11,578,120 (54,884) 6,251,229 422,815,738 Machinery and equipment 48,180,191 4,019,884 (2,610,090) 15,618 49,605,603 Total depreciable assets 554,486,378 17,371,248 (2,664,974) 9,248,487 578,441,139 Accumulated depreciation: Buildings (54,941,492) (2,657,015) - - (57,598,507) Improvements (156,271,183) (8,543,511) 39,996 - (164,774,698) Machinery and equipment (28,888,693) (2,575,256) 2,352,581 (15,618) (29,126,986) Total accumulated depreciation (240,101,368) (13,775,782) 2,392,577 (15,618) (251,500,191) Business-type activities capitalassets, net 352,746,243$ 15,909,151$ (12,557,252)$ 7,839,050$ 363,937,192
Less: associated debt (36,742,913) Less: construction retainage (163,531)
Less: bond premium (18,209) Plus: bond discount 56,287
Net investment in capital assets 327,068,826$
Governmental Activities:General government $ 535,436 Public safety 1,456,744 Public works 240,665 Economic and physical development 341,997 Culture and recreation 2,055,815 Highway and streets 9,022,075 Total depreciation expense - governmental activities $ 13,652,732
61
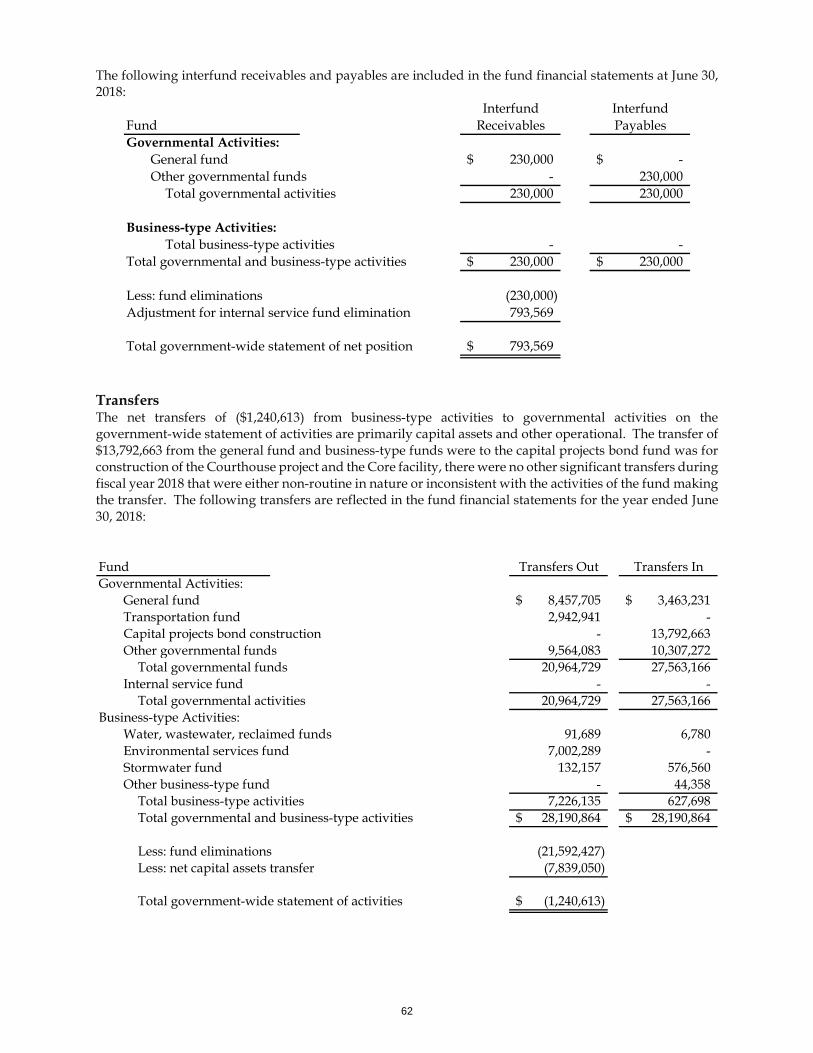
The following interfund receivables and payables are included in the fund financial statements at June 30, 2018:
Transfers The net transfers of ($1,240,613) from business-type activities to governmental activities on the government-wide statement of activities are primarily capital assets and other operational. The transfer of $13,792,663 from the general fund and business-type funds were to the capital projects bond fund was for construction of the Courthouse project and the Core facility, there were no other significant transfers during fiscal year 2018 that were either non-routine in nature or inconsistent with the activities of the fund making the transfer. The following transfers are reflected in the fund financial statements for the year ended June 30, 2018:
Interfund InterfundFund Receivables PayablesGovernmental Activities:
General fund 230,000$ -$ Other governmental funds - 230,000
Total governmental activities 230,000 230,000
Business-type Activities:Total business-type activities - -
Total governmental and business-type activities 230,000$ 230,000$
Less: fund eliminations (230,000) Adjustment for internal service fund elimination 793,569
Total government-wide statement of net position 793,569$
Fund Transfers Out Transfers InGovernmental Activities:
General fund 8,457,705$ 3,463,231$ Transportation fund 2,942,941 - Capital projects bond construction - 13,792,663 Other governmental funds 9,564,083 10,307,272
Total governmental funds 20,964,729 27,563,166 Internal service fund - -
Total governmental activities 20,964,729 27,563,166 Business-type Activities:
Water, wastewater, reclaimed funds 91,689 6,780 Environmental services fund 7,002,289 - Stormwater fund 132,157 576,560 Other business-type fund - 44,358
Total business-type activities 7,226,135 627,698 Total governmental and business-type activities 28,190,864$ 28,190,864$
Less: fund eliminations (21,592,427) Less: net capital assets transfer (7,839,050)
Total government-wide statement of activities (1,240,613)$
62
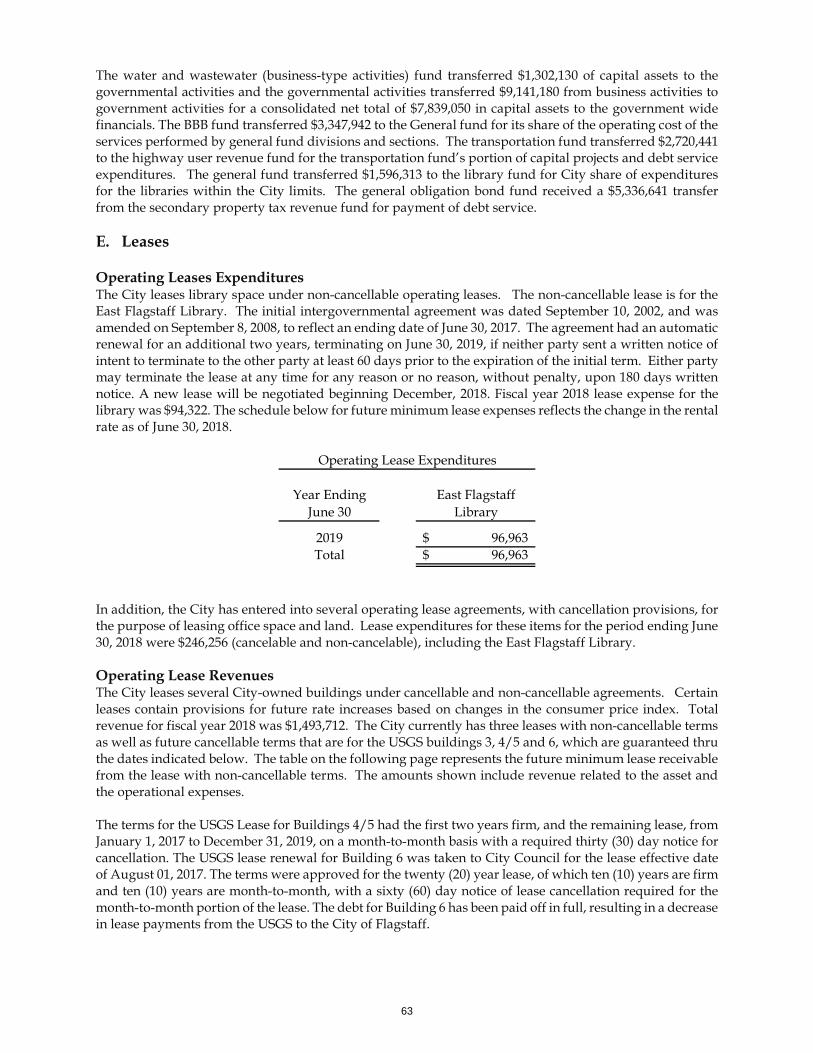
The water and wastewater (business-type activities) fund transferred $1,302,130 of capital assets to the governmental activities and the governmental activities transferred $9,141,180 from business activities to government activities for a consolidated net total of $7,839,050 in capital assets to the government wide financials. The BBB fund transferred $3,347,942 to the General fund for its share of the operating cost of the services performed by general fund divisions and sections. The transportation fund transferred $2,720,441 to the highway user revenue fund for the transportation fund’s portion of capital projects and debt service expenditures. The general fund transferred $1,596,313 to the library fund for City share of expenditures for the libraries within the City limits. The general obligation bond fund received a $5,336,641 transfer from the secondary property tax revenue fund for payment of debt service. E. Leases Operating Leases Expenditures The City leases library space under non-cancellable operating leases. The non-cancellable lease is for the East Flagstaff Library. The initial intergovernmental agreement was dated September 10, 2002, and was amended on September 8, 2008, to reflect an ending date of June 30, 2017. The agreement had an automatic renewal for an additional two years, terminating on June 30, 2019, if neither party sent a written notice of intent to terminate to the other party at least 60 days prior to the expiration of the initial term. Either party may terminate the lease at any time for any reason or no reason, without penalty, upon 180 days written notice. A new lease will be negotiated beginning December, 2018. Fiscal year 2018 lease expense for the library was $94,322. The schedule below for future minimum lease expenses reflects the change in the rental rate as of June 30, 2018.
In addition, the City has entered into several operating lease agreements, with cancellation provisions, for the purpose of leasing office space and land. Lease expenditures for these items for the period ending June 30, 2018 were $246,256 (cancelable and non-cancelable), including the East Flagstaff Library. Operating Lease Revenues The City leases several City-owned buildings under cancellable and non-cancellable agreements. Certain leases contain provisions for future rate increases based on changes in the consumer price index. Total revenue for fiscal year 2018 was $1,493,712. The City currently has three leases with non-cancellable terms as well as future cancellable terms that are for the USGS buildings 3, 4/5 and 6, which are guaranteed thru the dates indicated below. The table on the following page represents the future minimum lease receivable from the lease with non-cancellable terms. The amounts shown include revenue related to the asset and the operational expenses. The terms for the USGS Lease for Buildings 4/5 had the first two years firm, and the remaining lease, from January 1, 2017 to December 31, 2019, on a month-to-month basis with a required thirty (30) day notice for cancellation. The USGS lease renewal for Building 6 was taken to City Council for the lease effective date of August 01, 2017. The terms were approved for the twenty (20) year lease, of which ten (10) years are firm and ten (10) years are month-to-month, with a sixty (60) day notice of lease cancellation required for the month-to-month portion of the lease. The debt for Building 6 has been paid off in full, resulting in a decrease in lease payments from the USGS to the City of Flagstaff.
Year Ending East FlagstaffJune 30 Library
2019 96,963$ Total 96,963$
Operating Lease Expenditures
63
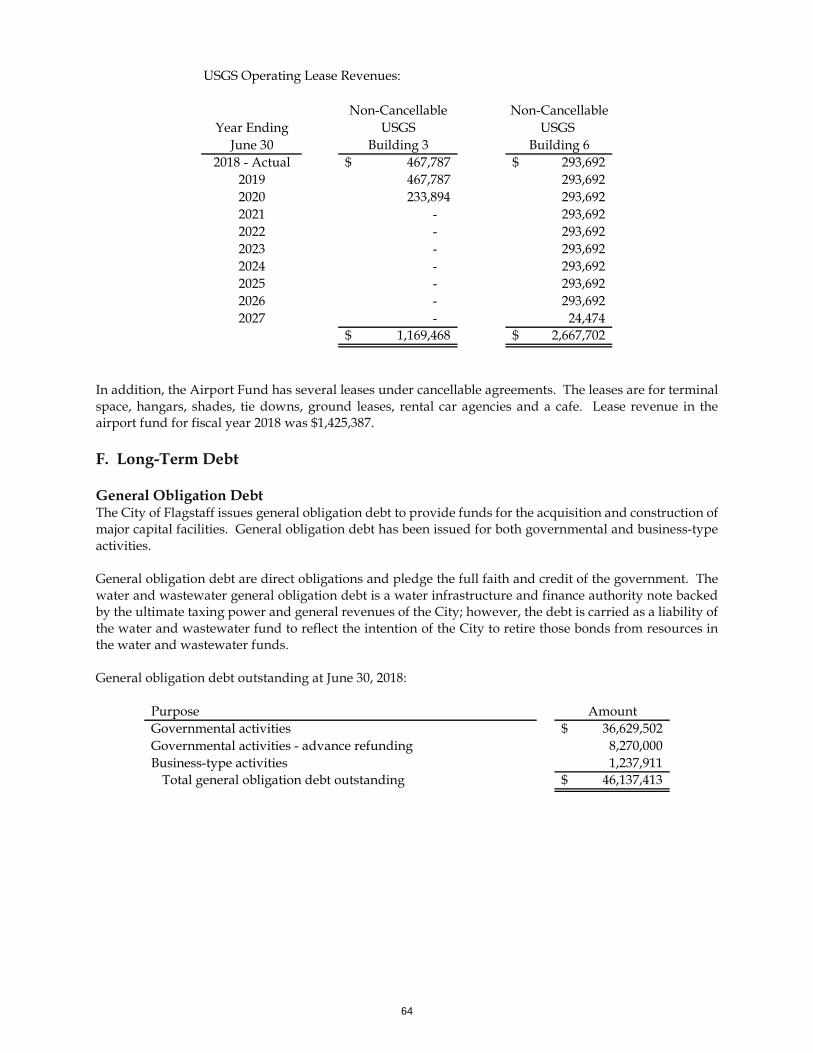
In addition, the Airport Fund has several leases under cancellable agreements. The leases are for terminal space, hangars, shades, tie downs, ground leases, rental car agencies and a cafe. Lease revenue in the airport fund for fiscal year 2018 was $1,425,387. F. Long-Term Debt General Obligation Debt The City of Flagstaff issues general obligation debt to provide funds for the acquisition and construction of major capital facilities. General obligation debt has been issued for both governmental and business-type activities. General obligation debt are direct obligations and pledge the full faith and credit of the government. The water and wastewater general obligation debt is a water infrastructure and finance authority note backed by the ultimate taxing power and general revenues of the City; however, the debt is carried as a liability of the water and wastewater fund to reflect the intention of the City to retire those bonds from resources in the water and wastewater funds. General obligation debt outstanding at June 30, 2018:
USGS Operating Lease Revenues:
Non-Cancellable Non-CancellableYear Ending USGS USGS
June 30 Building 3 Building 62018 - Actual 467,787$ 293,692$
2019 467,787 293,692 2020 233,894 293,692 2021 - 293,692 2022 - 293,692 2023 - 293,692 2024 - 293,692 2025 - 293,692 2026 - 293,692 2027 - 24,474
1,169,468$ 2,667,702$
AmountGovernmental activities 36,629,502$ Governmental activities - advance refunding 8,270,000 Business-type activities 1,237,911
Total general obligation debt outstanding 46,137,413$
Purpose
64
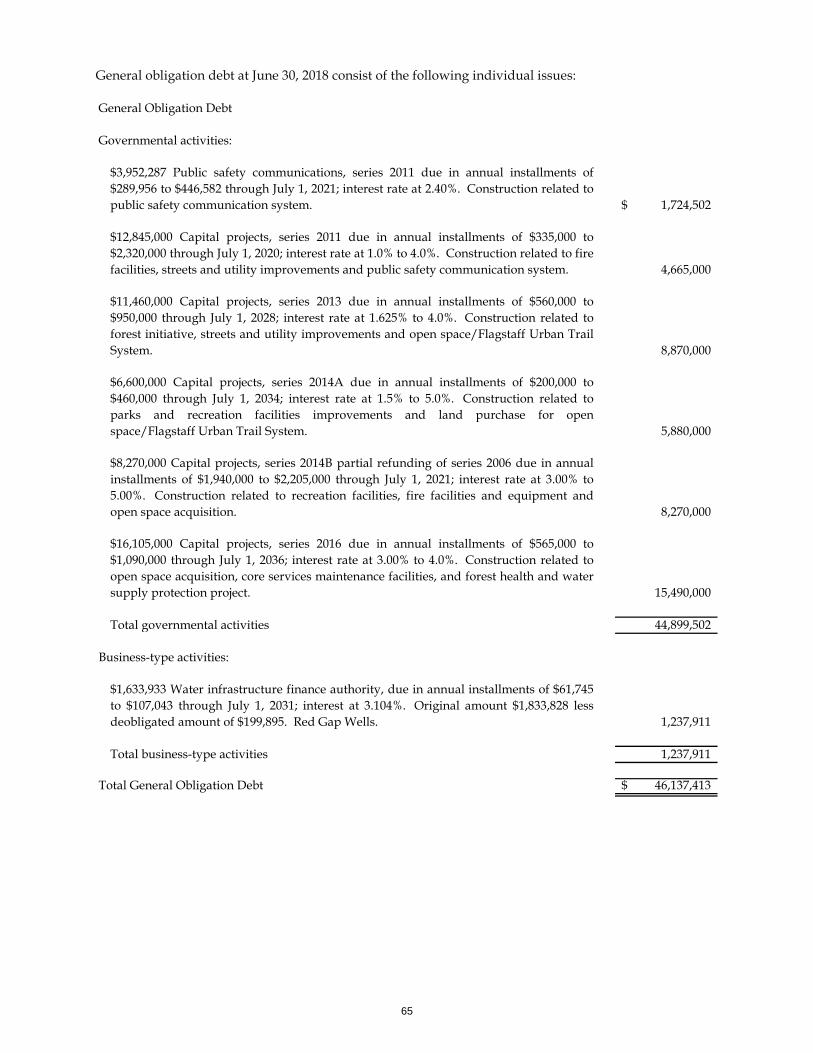
General obligation debt at June 30, 2018 consist of the following individual issues:
General Obligation Debt
Governmental activities:
1,724,502$
4,665,000
8,870,000
5,880,000
8,270,000
15,490,000
Total governmental activities 44,899,502
Business-type activities:
1,237,911
Total business-type activities 1,237,911
Total General Obligation Debt 46,137,413$
$8,270,000 Capital projects, series 2014B partial refunding of series 2006 due in annualinstallments of $1,940,000 to $2,205,000 through July 1, 2021; interest rate at 3.00% to5.00%. Construction related to recreation facilities, fire facilities and equipment andopen space acquisition.
$12,845,000 Capital projects, series 2011 due in annual installments of $335,000 to$2,320,000 through July 1, 2020; interest rate at 1.0% to 4.0%. Construction related to firefacilities, streets and utility improvements and public safety communication system.
$3,952,287 Public safety communications, series 2011 due in annual installments of$289,956 to $446,582 through July 1, 2021; interest rate at 2.40%. Construction related topublic safety communication system.
$16,105,000 Capital projects, series 2016 due in annual installments of $565,000 to$1,090,000 through July 1, 2036; interest rate at 3.00% to 4.0%. Construction related toopen space acquisition, core services maintenance facilities, and forest health and watersupply protection project.
$11,460,000 Capital projects, series 2013 due in annual installments of $560,000 to$950,000 through July 1, 2028; interest rate at 1.625% to 4.0%. Construction related toforest initiative, streets and utility improvements and open space/Flagstaff Urban TrailSystem.
$6,600,000 Capital projects, series 2014A due in annual installments of $200,000 to$460,000 through July 1, 2034; interest rate at 1.5% to 5.0%. Construction related toparks and recreation facilities improvements and land purchase for openspace/Flagstaff Urban Trail System.
$1,633,933 Water infrastructure finance authority, due in annual installments of $61,745to $107,043 through July 1, 2031; interest at 3.104%. Original amount $1,833,828 lessdeobligated amount of $199,895. Red Gap Wells.
65
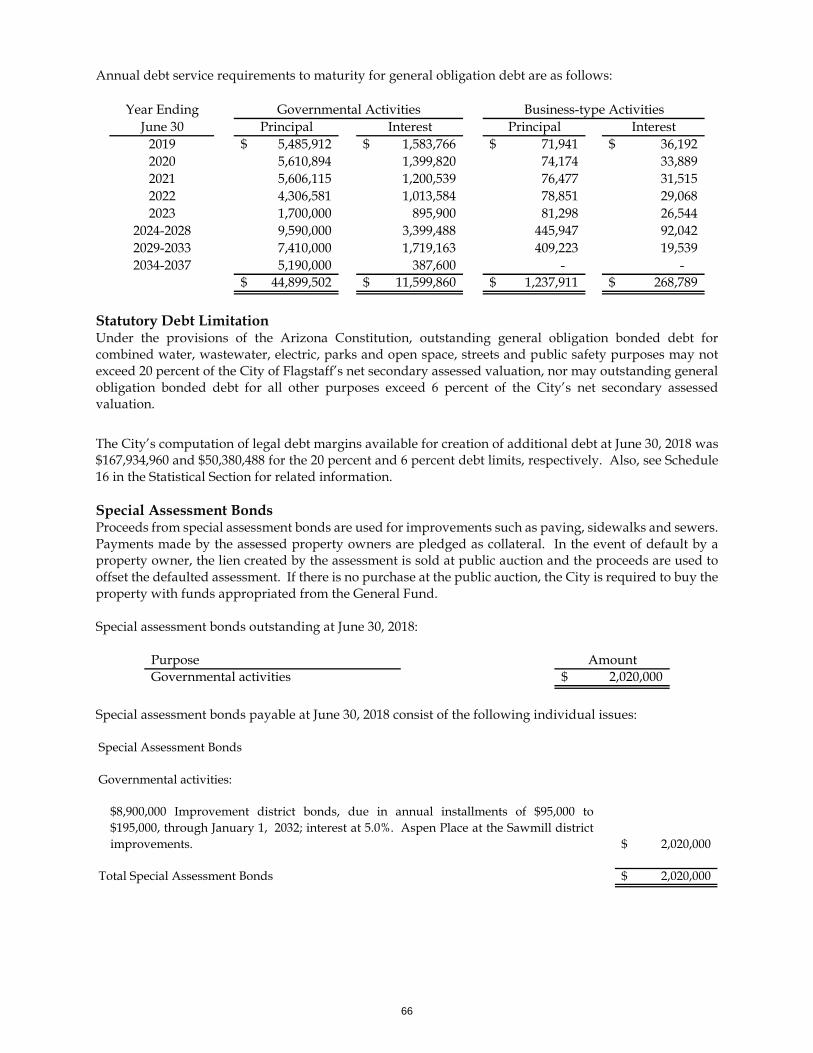
Annual debt service requirements to maturity for general obligation debt are as follows:
Statutory Debt Limitation Under the provisions of the Arizona Constitution, outstanding general obligation bonded debt for combined water, wastewater, electric, parks and open space, streets and public safety purposes may not exceed 20 percent of the City of Flagstaff’s net secondary assessed valuation, nor may outstanding general obligation bonded debt for all other purposes exceed 6 percent of the City’s net secondary assessed valuation. The City’s computation of legal debt margins available for creation of additional debt at June 30, 2018 was $167,934,960 and $50,380,488 for the 20 percent and 6 percent debt limits, respectively. Also, see Schedule 16 in the Statistical Section for related information. Special Assessment Bonds Proceeds from special assessment bonds are used for improvements such as paving, sidewalks and sewers. Payments made by the assessed property owners are pledged as collateral. In the event of default by a property owner, the lien created by the assessment is sold at public auction and the proceeds are used to offset the defaulted assessment. If there is no purchase at the public auction, the City is required to buy the property with funds appropriated from the General Fund. Special assessment bonds outstanding at June 30, 2018:
Special assessment bonds payable at June 30, 2018 consist of the following individual issues:
Year Ending Governmental Activities Business-type Activities June 30 Principal Interest Principal Interest
2019 5,485,912$ 1,583,766$ 71,941$ 36,192$ 2020 5,610,894 1,399,820 74,174 33,889 2021 5,606,115 1,200,539 76,477 31,515 2022 4,306,581 1,013,584 78,851 29,068 2023 1,700,000 895,900 81,298 26,544
2024-2028 9,590,000 3,399,488 445,947 92,042 2029-2033 7,410,000 1,719,163 409,223 19,539 2034-2037 5,190,000 387,600 - -
44,899,502$ 11,599,860$ 1,237,911$ 268,789$
Purpose AmountGovernmental activities 2,020,000$
Special Assessment Bonds
Governmental activities:
2,020,000$
Total Special Assessment Bonds 2,020,000$
$8,900,000 Improvement district bonds, due in annual installments of $95,000 to$195,000, through January 1, 2032; interest at 5.0%. Aspen Place at the Sawmill districtimprovements.
66
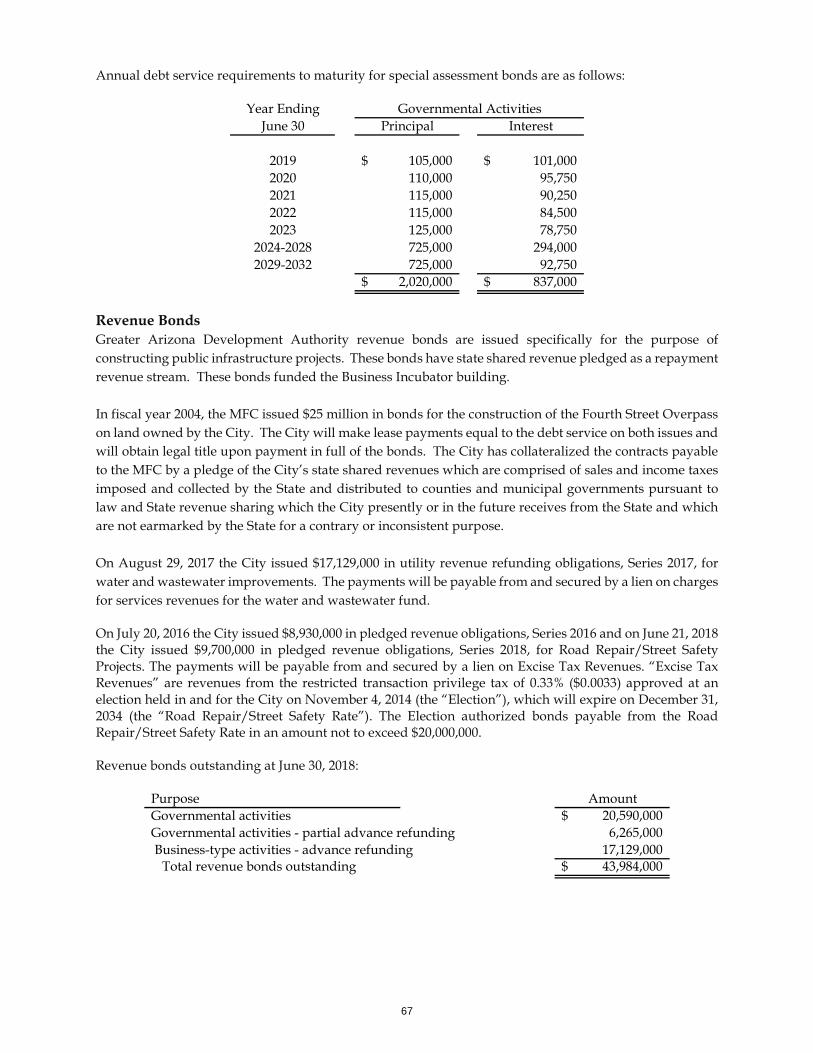
Annual debt service requirements to maturity for special assessment bonds are as follows:
Revenue Bonds Greater Arizona Development Authority revenue bonds are issued specifically for the purpose of constructing public infrastructure projects. These bonds have state shared revenue pledged as a repayment revenue stream. These bonds funded the Business Incubator building. In fiscal year 2004, the MFC issued $25 million in bonds for the construction of the Fourth Street Overpass on land owned by the City. The City will make lease payments equal to the debt service on both issues and will obtain legal title upon payment in full of the bonds. The City has collateralized the contracts payable to the MFC by a pledge of the City’s state shared revenues which are comprised of sales and income taxes imposed and collected by the State and distributed to counties and municipal governments pursuant to law and State revenue sharing which the City presently or in the future receives from the State and which are not earmarked by the State for a contrary or inconsistent purpose. On August 29, 2017 the City issued $17,129,000 in utility revenue refunding obligations, Series 2017, for water and wastewater improvements. The payments will be payable from and secured by a lien on charges for services revenues for the water and wastewater fund. On July 20, 2016 the City issued $8,930,000 in pledged revenue obligations, Series 2016 and on June 21, 2018 the City issued $9,700,000 in pledged revenue obligations, Series 2018, for Road Repair/Street Safety Projects. The payments will be payable from and secured by a lien on Excise Tax Revenues. “Excise Tax Revenues” are revenues from the restricted transaction privilege tax of 0.33% ($0.0033) approved at an election held in and for the City on November 4, 2014 (the “Election”), which will expire on December 31, 2034 (the “Road Repair/Street Safety Rate”). The Election authorized bonds payable from the Road Repair/Street Safety Rate in an amount not to exceed $20,000,000. Revenue bonds outstanding at June 30, 2018:
Year Ending Governmental Activities June 30 Principal Interest
2019 105,000$ 101,000$ 2020 110,000 95,750 2021 115,000 90,250 2022 115,000 84,500 2023 125,000 78,750
2024-2028 725,000 294,000 2029-2032 725,000 92,750
2,020,000$ 837,000$
Purpose AmountGovernmental activities 20,590,000$ Governmental activities - partial advance refunding 6,265,000 Business-type activities - advance refunding 17,129,000
Total revenue bonds outstanding 43,984,000$
67
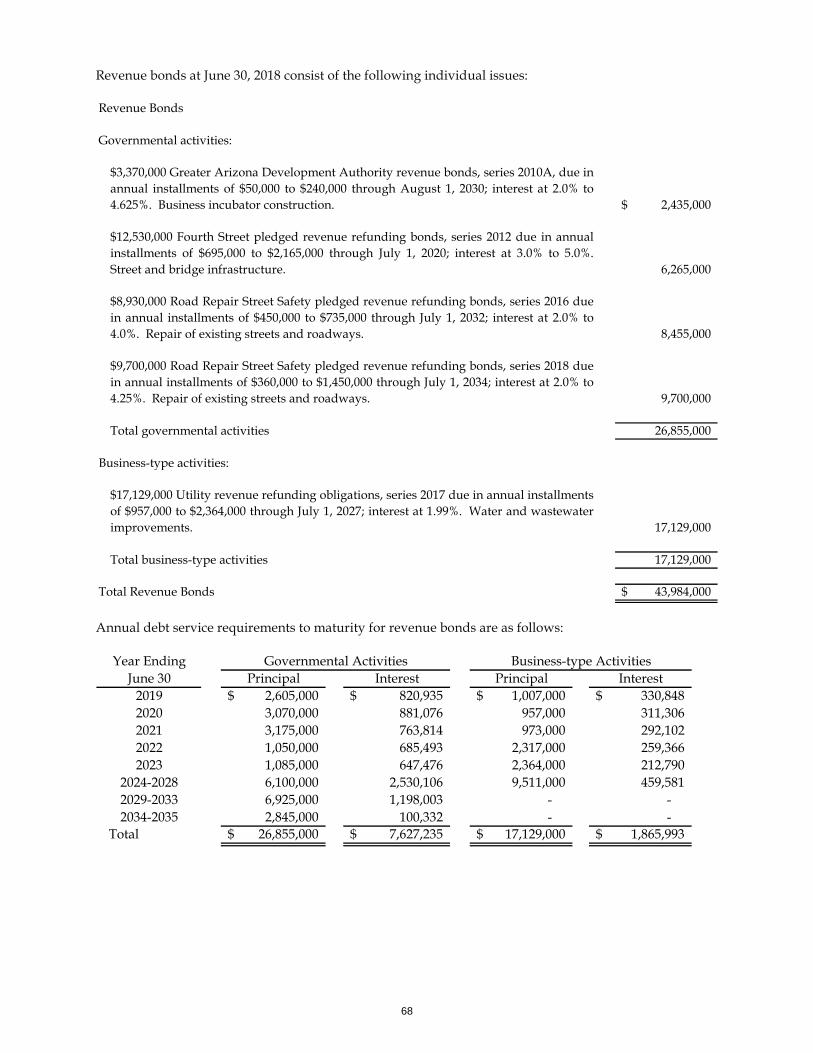
Revenue bonds at June 30, 2018 consist of the following individual issues:
Annual debt service requirements to maturity for revenue bonds are as follows:
Revenue Bonds
Governmental activities:
2,435,000$
6,265,000
8,455,000
9,700,000
Total governmental activities 26,855,000
Business-type activities:
17,129,000
Total business-type activities 17,129,000
Total Revenue Bonds 43,984,000$
$8,930,000 Road Repair Street Safety pledged revenue refunding bonds, series 2016 duein annual installments of $450,000 to $735,000 through July 1, 2032; interest at 2.0% to4.0%. Repair of existing streets and roadways.
$3,370,000 Greater Arizona Development Authority revenue bonds, series 2010A, due inannual installments of $50,000 to $240,000 through August 1, 2030; interest at 2.0% to4.625%. Business incubator construction.
$9,700,000 Road Repair Street Safety pledged revenue refunding bonds, series 2018 duein annual installments of $360,000 to $1,450,000 through July 1, 2034; interest at 2.0% to4.25%. Repair of existing streets and roadways.
$17,129,000 Utility revenue refunding obligations, series 2017 due in annual installmentsof $957,000 to $2,364,000 through July 1, 2027; interest at 1.99%. Water and wastewaterimprovements.
$12,530,000 Fourth Street pledged revenue refunding bonds, series 2012 due in annualinstallments of $695,000 to $2,165,000 through July 1, 2020; interest at 3.0% to 5.0%.Street and bridge infrastructure.
Year Ending Governmental Activities Business-type ActivitiesJune 30 Principal Interest Principal Interest
2019 2,605,000$ 820,935$ 1,007,000$ 330,848$ 2020 3,070,000 881,076 957,000 311,306 2021 3,175,000 763,814 973,000 292,102 2022 1,050,000 685,493 2,317,000 259,366 2023 1,085,000 647,476 2,364,000 212,790
2024-2028 6,100,000 2,530,106 9,511,000 459,581 2029-2033 6,925,000 1,198,003 - - 2034-2035 2,845,000 100,332 - -
Total 26,855,000$ 7,627,235$ 17,129,000$ 1,865,993$
68
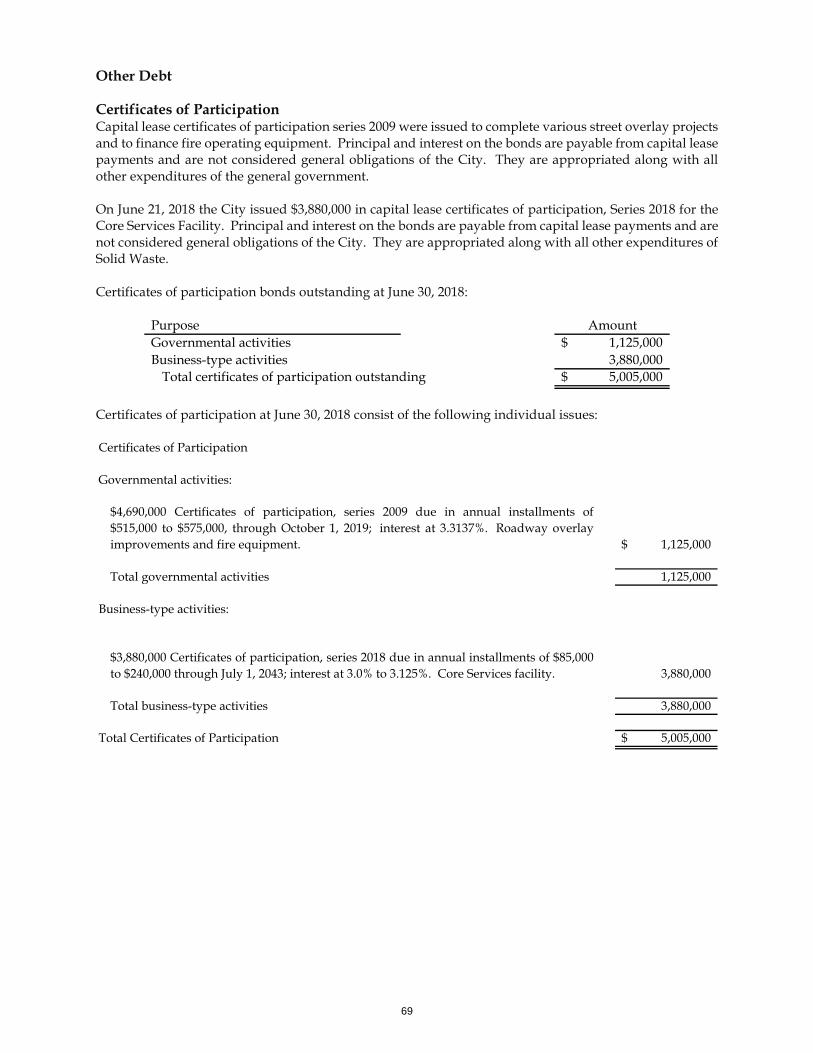
Other Debt Certificates of Participation Capital lease certificates of participation series 2009 were issued to complete various street overlay projects and to finance fire operating equipment. Principal and interest on the bonds are payable from capital lease payments and are not considered general obligations of the City. They are appropriated along with all other expenditures of the general government. On June 21, 2018 the City issued $3,880,000 in capital lease certificates of participation, Series 2018 for the Core Services Facility. Principal and interest on the bonds are payable from capital lease payments and are not considered general obligations of the City. They are appropriated along with all other expenditures of Solid Waste. Certificates of participation bonds outstanding at June 30, 2018:
Certificates of participation at June 30, 2018 consist of the following individual issues:
Purpose AmountGovernmental activities 1,125,000$ Business-type activities 3,880,000
Total certificates of participation outstanding 5,005,000$
Certificates of Participation
Governmental activities:
1,125,000$
Total governmental activities 1,125,000
Business-type activities:
3,880,000
Total business-type activities 3,880,000
Total Certificates of Participation 5,005,000$
$4,690,000 Certificates of participation, series 2009 due in annual installments of$515,000 to $575,000, through October 1, 2019; interest at 3.3137%. Roadway overlayimprovements and fire equipment.
$3,880,000 Certificates of participation, series 2018 due in annual installments of $85,000to $240,000 through July 1, 2043; interest at 3.0% to 3.125%. Core Services facility.
69
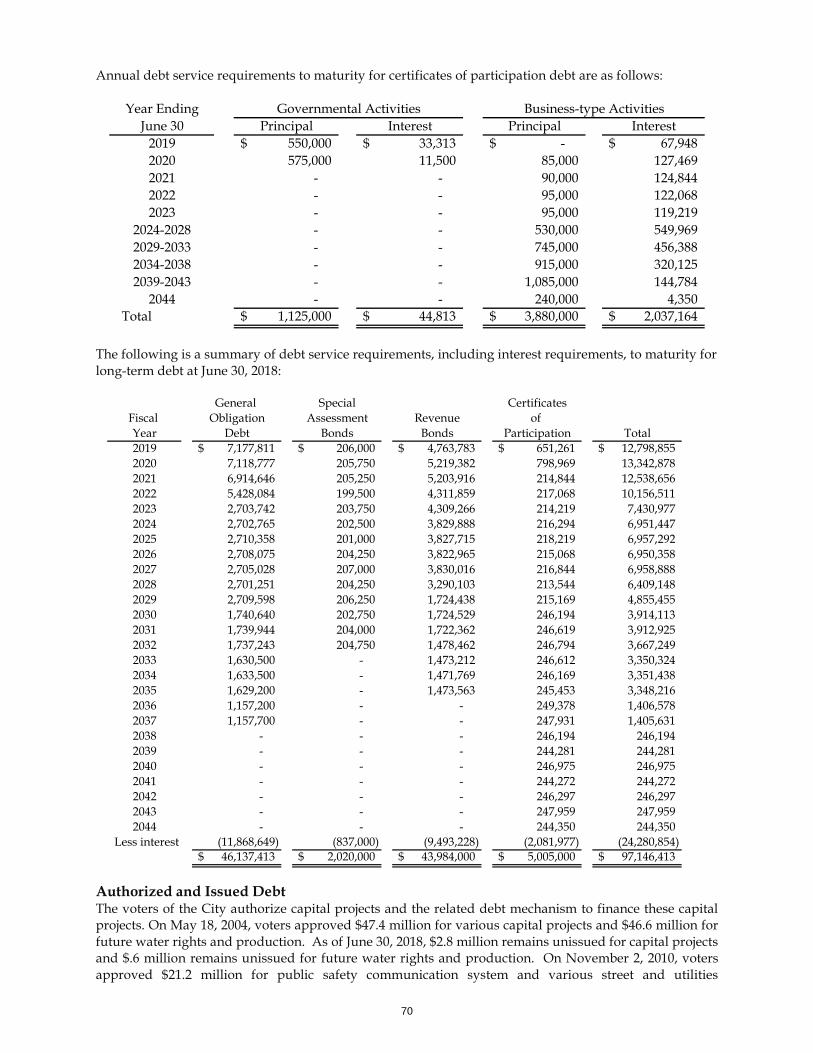
Annual debt service requirements to maturity for certificates of participation debt are as follows:
The following is a summary of debt service requirements, including interest requirements, to maturity for long-term debt at June 30, 2018:
Authorized and Issued Debt The voters of the City authorize capital projects and the related debt mechanism to finance these capital projects. On May 18, 2004, voters approved $47.4 million for various capital projects and $46.6 million for future water rights and production. As of June 30, 2018, $2.8 million remains unissued for capital projects and $.6 million remains unissued for future water rights and production. On November 2, 2010, voters approved $21.2 million for public safety communication system and various street and utilities
Year Ending Governmental Activities Business-type ActivitiesJune 30 Principal Interest Principal Interest
2019 550,000$ 33,313$ -$ 67,948$ 2020 575,000 11,500 85,000 127,469 2021 - - 90,000 124,844 2022 - - 95,000 122,068 2023 - - 95,000 119,219
2024-2028 - - 530,000 549,969 2029-2033 - - 745,000 456,388 2034-2038 - - 915,000 320,125 2039-2043 - - 1,085,000 144,784
2044 - - 240,000 4,350 Total 1,125,000$ 44,813$ 3,880,000$ 2,037,164$
General Special CertificatesFiscal Obligation Assessment Revenue of Year Debt Bonds Bonds Participation Total2019 7,177,811$ 206,000$ 4,763,783$ 651,261$ 12,798,855$ 2020 7,118,777 205,750 5,219,382 798,969 13,342,878 2021 6,914,646 205,250 5,203,916 214,844 12,538,656 2022 5,428,084 199,500 4,311,859 217,068 10,156,511 2023 2,703,742 203,750 4,309,266 214,219 7,430,977 2024 2,702,765 202,500 3,829,888 216,294 6,951,447 2025 2,710,358 201,000 3,827,715 218,219 6,957,292 2026 2,708,075 204,250 3,822,965 215,068 6,950,358 2027 2,705,028 207,000 3,830,016 216,844 6,958,888 2028 2,701,251 204,250 3,290,103 213,544 6,409,148 2029 2,709,598 206,250 1,724,438 215,169 4,855,455 2030 1,740,640 202,750 1,724,529 246,194 3,914,113 2031 1,739,944 204,000 1,722,362 246,619 3,912,925 2032 1,737,243 204,750 1,478,462 246,794 3,667,249 2033 1,630,500 - 1,473,212 246,612 3,350,324 2034 1,633,500 - 1,471,769 246,169 3,351,438 2035 1,629,200 - 1,473,563 245,453 3,348,216 2036 1,157,200 - - 249,378 1,406,578 2037 1,157,700 - - 247,931 1,405,631 2038 - - - 246,194 246,194 2039 - - - 244,281 244,281 2040 - - - 246,975 246,975 2041 - - - 244,272 244,272 2042 - - - 246,297 246,297 2043 - - - 247,959 247,959 2044 - - - 244,350 244,350
Less interest (11,868,649) (837,000) (9,493,228) (2,081,977) (24,280,854) 46,137,413$ 2,020,000$ 43,984,000$ 5,005,000$ 97,146,413$
70
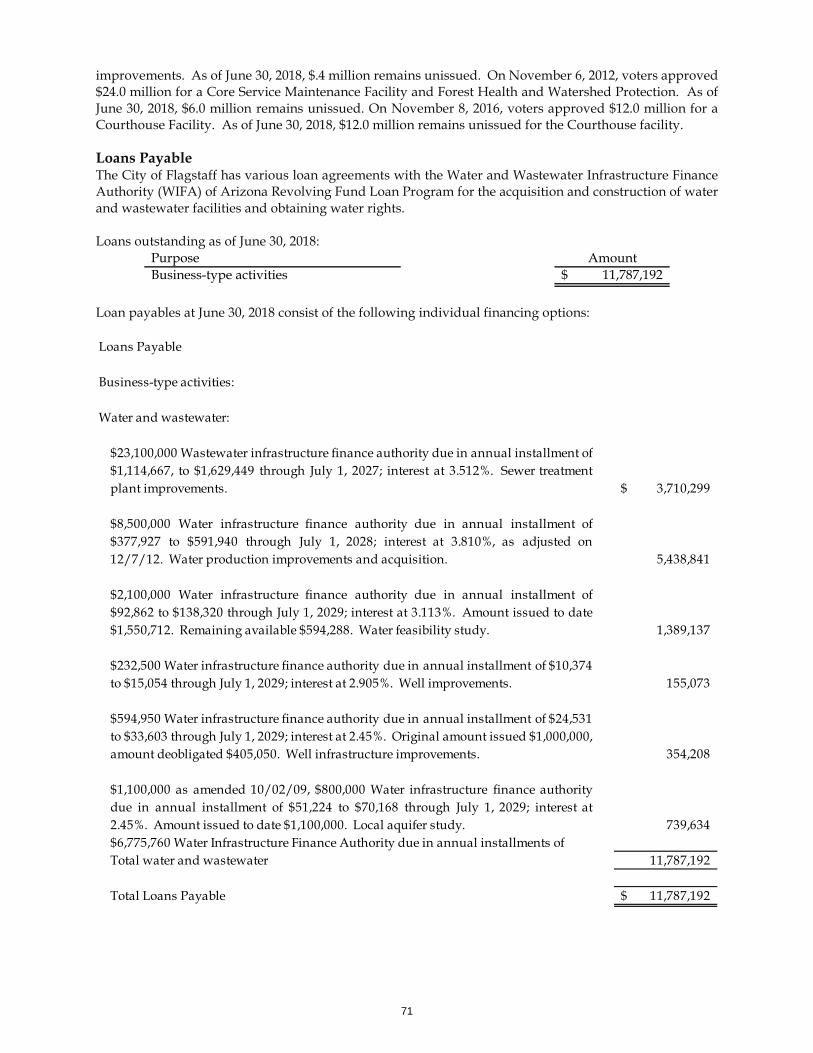
improvements. As of June 30, 2018, $.4 million remains unissued. On November 6, 2012, voters approved $24.0 million for a Core Service Maintenance Facility and Forest Health and Watershed Protection. As of June 30, 2018, $6.0 million remains unissued. On November 8, 2016, voters approved $12.0 million for a Courthouse Facility. As of June 30, 2018, $12.0 million remains unissued for the Courthouse facility. Loans Payable The City of Flagstaff has various loan agreements with the Water and Wastewater Infrastructure Finance Authority (WIFA) of Arizona Revolving Fund Loan Program for the acquisition and construction of water and wastewater facilities and obtaining water rights. Loans outstanding as of June 30, 2018:
Loan payables at June 30, 2018 consist of the following individual financing options:
Purpose AmountBusiness-type activities 11,787,192$
Loans Payable
Business-type activities:
Water and wastewater:
3,710,299$
5,438,841
1,389,137
155,073
354,208
739,634
Total water and wastewater 11,787,192
Total Loans Payable 11,787,192$
$6,775,760 Water Infrastructure Finance Authority due in annual installments of
$594,950 Water infrastructure finance authority due in annual installment of $24,531to $33,603 through July 1, 2029; interest at 2.45%. Original amount issued $1,000,000, amount deobligated $405,050. Well infrastructure improvements.
$1,100,000 as amended 10/02/09, $800,000 Water infrastructure finance authoritydue in annual installment of $51,224 to $70,168 through July 1, 2029; interest at2.45%. Amount issued to date $1,100,000. Local aquifer study.
$23,100,000 Wastewater infrastructure finance authority due in annual installment of $1,114,667, to $1,629,449 through July 1, 2027; interest at 3.512%. Sewer treatmentplant improvements.
$8,500,000 Water infrastructure finance authority due in annual installment of$377,927 to $591,940 through July 1, 2028; interest at 3.810%, as adjusted on12/7/12. Water production improvements and acquisition.
$2,100,000 Water infrastructure finance authority due in annual installment of$92,862 to $138,320 through July 1, 2029; interest at 3.113%. Amount issued to date$1,550,712. Remaining available $594,288. Water feasibility study.
$232,500 Water infrastructure finance authority due in annual installment of $10,374to $15,054 through July 1, 2029; interest at 2.905%. Well improvements.
71
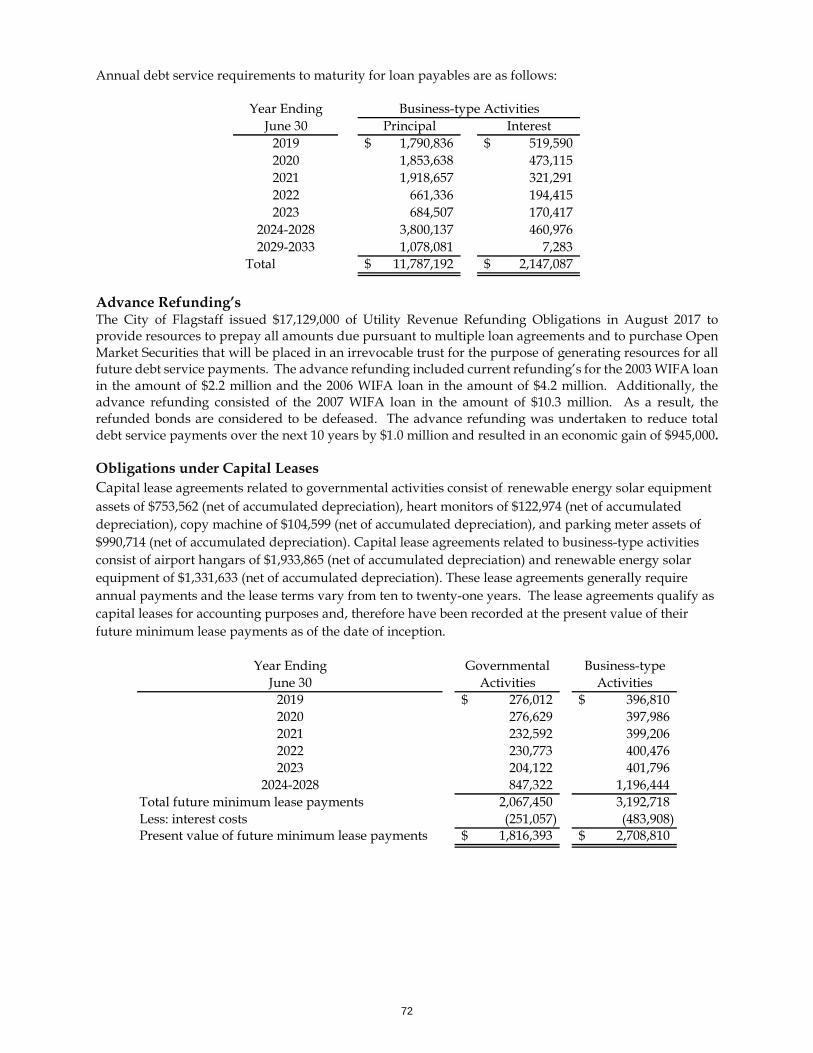
Annual debt service requirements to maturity for loan payables are as follows:
Advance Refunding’s The City of Flagstaff issued $17,129,000 of Utility Revenue Refunding Obligations in August 2017 to provide resources to prepay all amounts due pursuant to multiple loan agreements and to purchase Open Market Securities that will be placed in an irrevocable trust for the purpose of generating resources for all future debt service payments. The advance refunding included current refunding’s for the 2003 WIFA loan in the amount of $2.2 million and the 2006 WIFA loan in the amount of $4.2 million. Additionally, the advance refunding consisted of the 2007 WIFA loan in the amount of $10.3 million. As a result, the refunded bonds are considered to be defeased. The advance refunding was undertaken to reduce total debt service payments over the next 10 years by $1.0 million and resulted in an economic gain of $945,000. Obligations under Capital Leases Capital lease agreements related to governmental activities consist of renewable energy solar equipment assets of $753,562 (net of accumulated depreciation), heart monitors of $122,974 (net of accumulated depreciation), copy machine of $104,599 (net of accumulated depreciation), and parking meter assets of $990,714 (net of accumulated depreciation). Capital lease agreements related to business-type activities consist of airport hangars of $1,933,865 (net of accumulated depreciation) and renewable energy solar equipment of $1,331,633 (net of accumulated depreciation). These lease agreements generally require annual payments and the lease terms vary from ten to twenty-one years. The lease agreements qualify as capital leases for accounting purposes and, therefore have been recorded at the present value of their future minimum lease payments as of the date of inception.
Year Ending Business-type Activities June 30 Principal Interest
2019 1,790,836$ 519,590$ 2020 1,853,638 473,115 2021 1,918,657 321,291 2022 661,336 194,415 2023 684,507 170,417
2024-2028 3,800,137 460,976 2029-2033 1,078,081 7,283
Total 11,787,192$ 2,147,087$
Year Ending Governmental Business-typeJune 30 Activities Activities
2019 276,012$ 396,810$ 2020 276,629 397,986 2021 232,592 399,206 2022 230,773 400,476 2023 204,122 401,796
2024-2028 847,322 1,196,444 Total future minimum lease payments 2,067,450 3,192,718 Less: interest costs (251,057) (483,908) Present value of future minimum lease payments 1,816,393$ 2,708,810$
72
Pledged Revenues The City has pledged future water and wastewater utility revenues to repay Water Infrastructure Financing Authority loans issued during the period of 1992-2015. The various bonds were issued for the purchase or construction of various water or wastewater infrastructure including wells, water distribution lines, wastewater collection lines and treatment plant improvements. At June 30, 2018, $30,154,103 remains outstanding to be repaid by future water and wastewater revenues, if such revenues prove insufficient, the remainder will be repaid as a general obligation of the City. For the fiscal year ended June 30, 2018, net revenue available for service of this debt was $11,037,543. The debt principal and interest paid in fiscal year 2018 equal $3,190,945 (28.91% of available pledged net revenues). For additional information on pledged revenues related to revenue bonds, refer to Schedule 17 in the Statistical Section of this report. The City has pledged certain revenues for the repayment of $25,000,000 in Municipal Facility Corporation bonds issued in 2004. The bonds were issued to construct transportation infrastructure. The bonds have a senior lien on the 0.16% transportation sales tax and a secondary lien on the excise taxes and state shared revenues not specifically reserved by law or other regulation to be expended for other purposes. On March 21, 2012 a partial advance refunding of $12,530,000 was completed on the 2004 bonds and replaced with pledged revenue refunding bonds series 2012, holding the 2004 bonds senior. At June 30, 2018, $6,265,000 remains outstanding to be repaid by future revenues. For the fiscal year ended June 30, 2018, net revenues available for service of the debt were $33,215,273. The debt principal and interest paid in fiscal year 2018 was $2,213,775 (6.66% of available pledged net revenues). For additional information on pledged revenues for MFC transportation bonds, refer to Schedule 17 in the Statistical Section of this report. The City has pledged certain revenues for the repayment of $3,370,000 Greater Arizona Development Authority (GADA) revenue bonds issued in 2011 for the construction of a business incubator facility at the U.S. Geological Survey Campus. The bonds are secured by a pledge of the City’s state shared revenues not specifically reserved by law or other regulation to be expended for other purposes. At June 30, 2018, $2,435,000 remains outstanding to be repaid by future revenues. For the fiscal year ended June 30, 2018, net revenues available for the service of this debt were $13,256,213. The debt principal and interest paid in fiscal year 2018 was $249,288 (1.88% of available pledged net revenues). For additional information on pledged revenues for GADA revenue bonds, refer to Schedule 17 in the Statistical Section of this report. The City has pledged certain revenues for the repayment of $8,930,000 in Road Repair/Street Safety pledged revenue obligation bonds issued in 2016 and $9,700,000 issued in 2018. The bonds were issued to construct street improvements and the ongoing preservation of street conditions inside the City limit. The bonds have a senior lien on the 0.33% excise tax revenues. At June 30, 2018, $18,155,000 remains outstanding to be repaid by future revenues. For the fiscal year ended June 30, 2018, net revenues available for service of the debt were $6,445,644. The debt interest paid in fiscal year 2018 was $332,750 (5.16% of available pledged net revenues). For additional information on pledged revenues for the bonds, refer to Schedule 17 in the Statistical Section of this report.
73
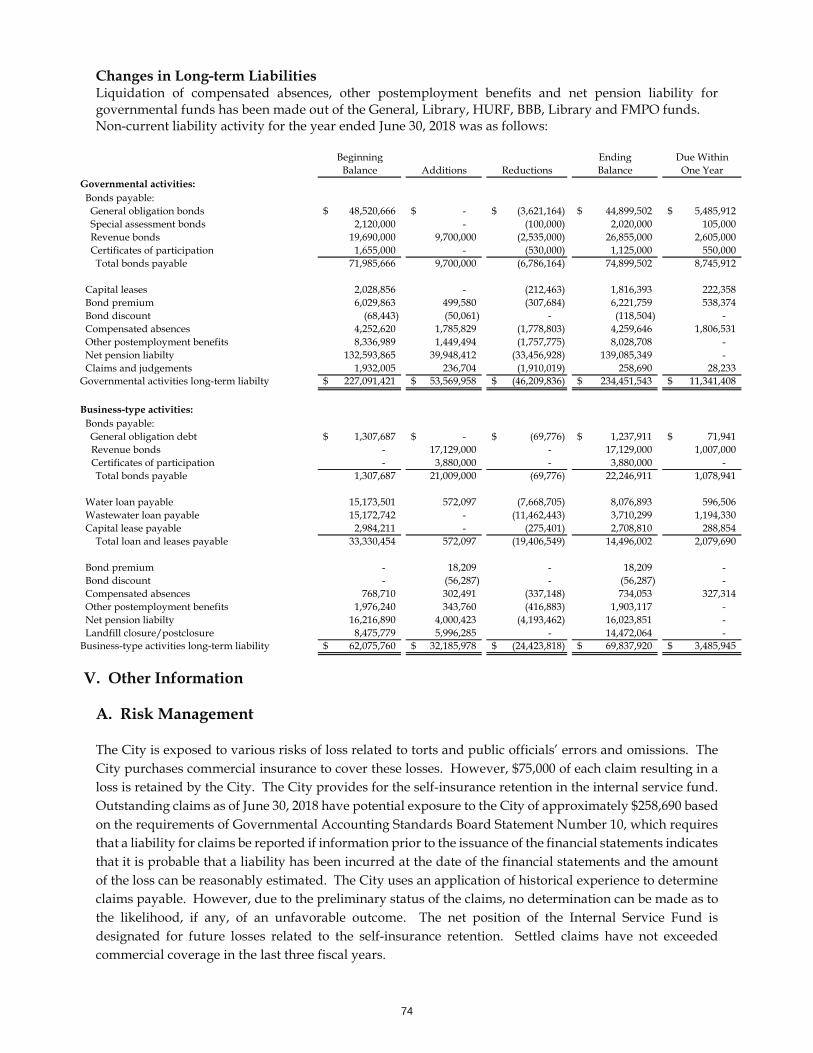
Changes in Long-term Liabilities Liquidation of compensated absences, other postemployment benefits and net pension liability for governmental funds has been made out of the General, Library, HURF, BBB, Library and FMPO funds. Non-current liability activity for the year ended June 30, 2018 was as follows:
V. Other Information
A. Risk Management The City is exposed to various risks of loss related to torts and public officials’ errors and omissions. The City purchases commercial insurance to cover these losses. However, $75,000 of each claim resulting in a loss is retained by the City. The City provides for the self-insurance retention in the internal service fund. Outstanding claims as of June 30, 2018 have potential exposure to the City of approximately $258,690 based on the requirements of Governmental Accounting Standards Board Statement Number 10, which requires that a liability for claims be reported if information prior to the issuance of the financial statements indicates that it is probable that a liability has been incurred at the date of the financial statements and the amount of the loss can be reasonably estimated. The City uses an application of historical experience to determine claims payable. However, due to the preliminary status of the claims, no determination can be made as to the likelihood, if any, of an unfavorable outcome. The net position of the Internal Service Fund is designated for future losses related to the self-insurance retention. Settled claims have not exceeded commercial coverage in the last three fiscal years.
Beginning Ending Due WithinBalance Additions Reductions Balance One Year
Governmental activities: Bonds payable: General obligation bonds 48,520,666$ -$ (3,621,164)$ 44,899,502$ 5,485,912$ Special assessment bonds 2,120,000 - (100,000) 2,020,000 105,000 Revenue bonds 19,690,000 9,700,000 (2,535,000) 26,855,000 2,605,000 Certificates of participation 1,655,000 - (530,000) 1,125,000 550,000 Total bonds payable 71,985,666 9,700,000 (6,786,164) 74,899,502 8,745,912
Capital leases 2,028,856 - (212,463) 1,816,393 222,358 Bond premium 6,029,863 499,580 (307,684) 6,221,759 538,374 Bond discount (68,443) (50,061) - (118,504) - Compensated absences 4,252,620 1,785,829 (1,778,803) 4,259,646 1,806,531 Other postemployment benefits 8,336,989 1,449,494 (1,757,775) 8,028,708 - Net pension liabilty 132,593,865 39,948,412 (33,456,928) 139,085,349 - Claims and judgements 1,932,005 236,704 (1,910,019) 258,690 28,233 Governmental activities long-term liabilty 227,091,421$ 53,569,958$ (46,209,836)$ 234,451,543$ 11,341,408$
Business-type activities: Bonds payable: General obligation debt 1,307,687$ -$ (69,776)$ 1,237,911$ 71,941$
Revenue bonds - 17,129,000 - 17,129,000 1,007,000 Certificates of participation - 3,880,000 - 3,880,000 -
Total bonds payable 1,307,687 21,009,000 (69,776) 22,246,911 1,078,941
Water loan payable 15,173,501 572,097 (7,668,705) 8,076,893 596,506 Wastewater loan payable 15,172,742 - (11,462,443) 3,710,299 1,194,330 Capital lease payable 2,984,211 - (275,401) 2,708,810 288,854 Total loan and leases payable 33,330,454 572,097 (19,406,549) 14,496,002 2,079,690
Bond premium - 18,209 - 18,209 - Bond discount - (56,287) - (56,287) - Compensated absences 768,710 302,491 (337,148) 734,053 327,314 Other postemployment benefits 1,976,240 343,760 (416,883) 1,903,117 - Net pension liabilty 16,216,890 4,000,423 (4,193,462) 16,023,851 - Landfill closure/postclosure 8,475,779 5,996,285 - 14,472,064 - Business-type activities long-term liability 62,075,760$ 32,185,978$ (24,423,818)$ 69,837,920$ 3,485,945$
74
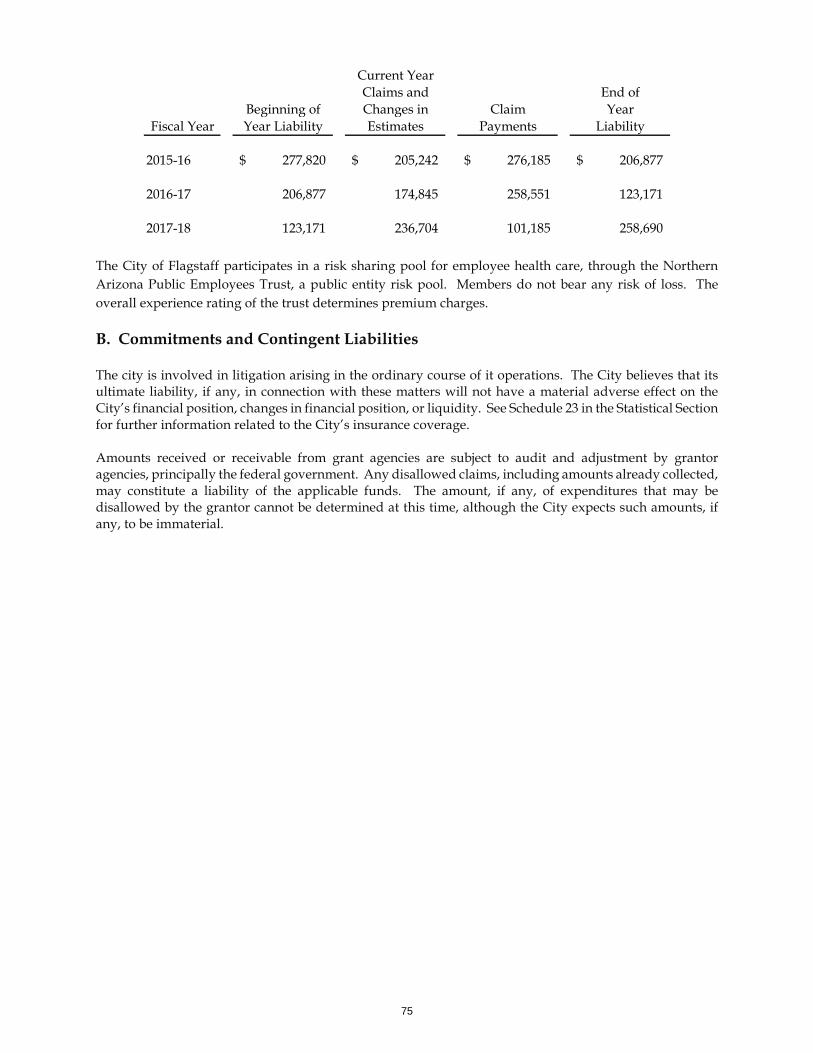
The City of Flagstaff participates in a risk sharing pool for employee health care, through the Northern Arizona Public Employees Trust, a public entity risk pool. Members do not bear any risk of loss. The overall experience rating of the trust determines premium charges. B. Commitments and Contingent Liabilities The city is involved in litigation arising in the ordinary course of it operations. The City believes that its ultimate liability, if any, in connection with these matters will not have a material adverse effect on the City’s financial position, changes in financial position, or liquidity. See Schedule 23 in the Statistical Section for further information related to the City’s insurance coverage. Amounts received or receivable from grant agencies are subject to audit and adjustment by grantor agencies, principally the federal government. Any disallowed claims, including amounts already collected, may constitute a liability of the applicable funds. The amount, if any, of expenditures that may be disallowed by the grantor cannot be determined at this time, although the City expects such amounts, if any, to be immaterial.
Current YearClaims and End of
Beginning of Changes in Claim YearFiscal Year Year Liability Estimates Payments Liability
2015-16 277,820$ 205,242$ 276,185$ 206,877$
2016-17 206,877 174,845 258,551 123,171
2017-18 123,171 236,704 101,185 258,690
75
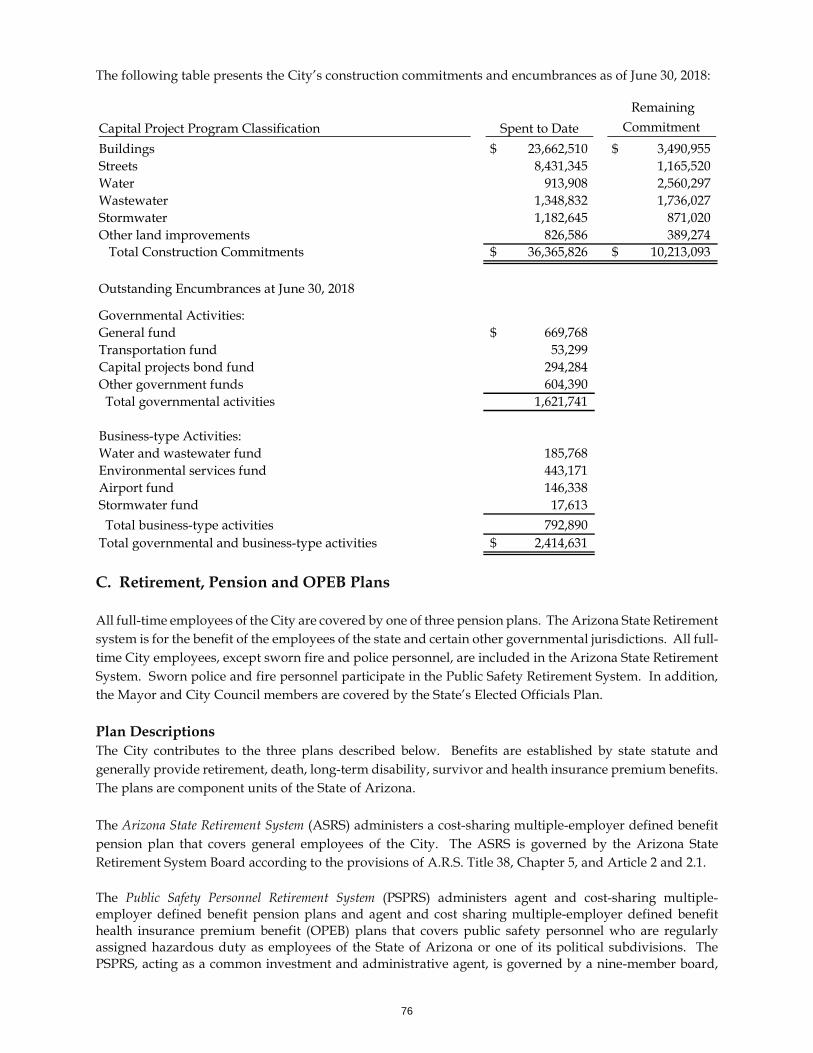
The following table presents the City’s construction commitments and encumbrances as of June 30, 2018:
C. Retirement, Pension and OPEB Plans All full-time employees of the City are covered by one of three pension plans. The Arizona State Retirement system is for the benefit of the employees of the state and certain other governmental jurisdictions. All full-time City employees, except sworn fire and police personnel, are included in the Arizona State Retirement System. Sworn police and fire personnel participate in the Public Safety Retirement System. In addition, the Mayor and City Council members are covered by the State’s Elected Officials Plan. Plan Descriptions The City contributes to the three plans described below. Benefits are established by state statute and generally provide retirement, death, long-term disability, survivor and health insurance premium benefits. The plans are component units of the State of Arizona. The Arizona State Retirement System (ASRS) administers a cost-sharing multiple-employer defined benefit pension plan that covers general employees of the City. The ASRS is governed by the Arizona State Retirement System Board according to the provisions of A.R.S. Title 38, Chapter 5, and Article 2 and 2.1. The Public Safety Personnel Retirement System (PSPRS) administers agent and cost-sharing multiple-employer defined benefit pension plans and agent and cost sharing multiple-employer defined benefit health insurance premium benefit (OPEB) plans that covers public safety personnel who are regularly assigned hazardous duty as employees of the State of Arizona or one of its political subdivisions. The PSPRS, acting as a common investment and administrative agent, is governed by a nine-member board,
Capital Project Program Classification Spent to Date Remaining
Commitment Buildings 23,662,510$ 3,490,955$ Streets 8,431,345 1,165,520 Water 913,908 2,560,297 Wastewater 1,348,832 1,736,027 Stormwater 1,182,645 871,020 Other land improvements 826,586 389,274 Total Construction Commitments 36,365,826$ 10,213,093$
Outstanding Encumbrances at June 30, 2018
Governmental Activities:General fund 669,768$ Transportation fund 53,299 Capital projects bond fund 294,284 Other government funds 604,390 Total governmental activities 1,621,741
Business-type Activities:Water and wastewater fund 185,768 Environmental services fund 443,171 Airport fund 146,338 Stormwater fund 17,613 Total business-type activities 792,890 Total governmental and business-type activities 2,414,631$
76
known as The Board of Trustees, and the participating local boards govern the PSPRS according to the provisions of A.R.S. Title 38, Chapter 5, Article 4. The Elected Officials Retirement Plan (EORP) is a cost-sharing multiple-employer defined benefit pension plan and a cost-sharing, multiple-employer defined benefit health insurance premium benefit (OPEB) plan that covers elected officials and judges of certain state and local governments who were members of the plan on December 31, 2013. This plan was closed to new members as of January 1, 2014. The EORP is governed by Board of Trustees of the PSPRS according to the provisions of A.S.R. Title 38, Chapter 5, and Article 3. Each plan issues a publicly available financial report that includes its financial statements and required supplementary information. A report can be obtained by writing or calling the applicable plan. ASRS PSPRS and EORP 3300 N. Central Ave. 3010 E. Camelback Rd. P.O. Box 33910 Suite 200 Phoenix, AZ 85067-3910 Phoenix, AZ 85016-4416 (602) 240-2200/ (800) 621-3778 (602) 255-5575 www.azasrs.gov www.psprs.com At June 30, 2018, the City reported the following aggregate amounts related to pensions and OPEB for all plans to which it contributes: Statement of Net Position and Statement of Activities as of June 30, 2018:
The City reported accrued employee benefits of $5,810 for governmental activities and $16,342 for business-type activities as related to outstanding pension contribution amounts payable to all pension plans for the year ended June 30, 2018. Several of the OPEB plans related to ASRS and PSPRS did not have significant financial impact and therefore were not reported. Arizona State Retirement System (ASRS) Funding Policy The Arizona State Legislature establishes and may amend active plan members' and the City's contribution rates.
Governmental Business-typeActivities Activities Total
Net OPEB Asset (1,056,849)$ -$ (1,056,849)$ Net OPEB liabilities 8,028,708 1,903,117 9,931,825 Net pension liabilities 139,085,349 16,023,851 155,109,200 Deferred outlfows of resources 28,058,385 2,588,677 30,647,062 Deferred inflows of resources (4,565,949) (1,224,876) (5,790,825) Pension /OPEB expense 18,088,311 1,091,232 19,179,543
77
Benefits Provided The ASRS provides retirement, health insurance premium supplement, long-term disability, and survivor benefits. State statute establishes benefits terms. Retirement benefits are calculated on the basis of age, average monthly compensation, and served credit as follows:
Retirement benefits for members who joined the ASRS prior to September 13, 2013, are subject to automatic cost-of-living adjustments based on excess investment earnings. Members with a membership date on or after September 13, 2013, are not eligible for cost-of-living adjustments. Survivor benefits are payable upon a members’ death. For retired members, the survivor benefit is determined by the retirement benefit option chosen. For all other members, the beneficiary is entitled to the members’ account balance that includes the members’ contribution and employer’s contributions, plus interest earned. Contributions For the year ended June 30, 2018, active ASRS members were required by statute to contribute at the actuarially determined rate of 11.5% (11.34% retirement and 0.16% long-term disability) of the members' annual covered payroll and the City was required by statute to contribute at the actuarially determined rate of 11.5% (10.9% retirement, 0.44% for health insurance premium, and 0.16% long-term disability) of the active members’ annual covered payroll. In addition, the City was required by statute to contribute at the actuarially determined rate of 9.49% (9.26% for retirement, 0.1% for health and 0.13% for long-term disability) of annual covered payroll of retired members who worked for the City in positions that would typically be filled by an employee who contributes to the ASRS. The City's contributions to ASRS for the years ended June 30, 2018, 2017 and 2016 were $3,721,811, $3,552,895, and $3,344,492 respectively, inclusive of Housing Authority. The City contribution for the current and two preceding years, all of which were equal to the required contributions, were as follows:
ASRS
Initial Membership Date: Before July 1, 2011 On or After July 1, 2011Years of service and age required to receive benefit Sum of years, and age equals 80 30 years, age 55
10 years, age 62 25 years, age 60
5 years, age 50* 10 years, age 62
Any years, age 65 5 years, age 50*
Any years, age 65
Final average salary is based on Highest 36 months of last 120 months Highest 60 months of last 120 months
Benefit percent per year of service 2.1% to 2.3% 2.1% to 2.3%
*With actuarially reduced benefits
Retirement6/30/2018 3,478,329$ 6/30/2017 3,357,591 6/30/2016 3,168,876
78
During fiscal year 2018, the City paid for ASRS pension and related OPEB contributions (health benefit) 74% from governmental funds and 26% from enterprise funds. Pension Liability At June 30, 2018, the City reported a liability of $48,706,334 for its proportionate share of the ASRS net pension liability. The net pension liability was measured as of June 30, 2017. The total pension liability used to calculate the net pension liability was determined using update procedures to roll forward the total pension liability from an actuarial valuation as of June 30, 2016, to the measurement date of June 30, 2017. The total pension liability as of June 30, 2017, reflects a change in actuarial assumption related to changes in loads for future potential permanent benefit increases. The City’s reported liability at June 30, 2018 decreased by $1,577,738 from the City’s prior year liability of $50,284,072 due to changes in the ASRS net pension liability and the City’s proportionate share of that liability. The ASRS publicly available financial report provided details on the change in the net pension liability. The City’s proportion of the net pension liability was based on the City’s actual contributions to the plan relative to the total of all participating employers’ contributions for the year ended June 30, 2017. The City’s proportion measured as June 30, 2017, was .3126%, which was an increase of .0011 from its proportion measured as of June 30, 2016, 0.3115%. Pension Expense and Deferred Outflows – Inflows of Resources For the year ended June 30, 2018, the City recognized pension expense of $2,240,115. At June 30, 2018, the City reported deferred outflows of resources and deferred inflows of resources related to pension from the following sources:
Deferred DeferredOutflows of Inflows ofResources Resources
Differences between expected and actual -$ (1,460,485)$ Changes of assumptions 2,115,428 (1,456,407)
349,678 -
807,000 (22,983)
3,478,329 -
Total 6,750,435$ (2,939,875)$
Net difference between projected and actual earnings on pension plan investmentsChanges in proportion and differences between city contributions and proportionate share of
City contributions subsequent to the measurement date
79
The $3,478,329 reported as deferred outflows of resources related to ASRS pensions resulting from City contributions subsequent to the measurement date will be recognized as a reduction of the net liability in the year ending June 30, 2019. Other amounts reported as deferred outflows of resources and deferred inflows of resources related to ASRS pensions will be recognized in pension expense as follows:
Actuarial Assumptions The significant actuarial assumptions used to measure the total pension liability are as follows:
Actuarial assumptions used in the June 30, 2016, valuation were based on the results of an actuarial experience study for the 5-year period ended June 30, 2012. The long-term expected rate of return on ASRS pension plan investments was determined to be 8.7 percent using a building-block method in which best-estimate ranges of expected future real rates of return (expected returns, net of pension plan investment expense and inflation) are developed for each major asset class. These ranges are combined to produce the long-term expected rate of return by weighting the expected future real rates of return by the target asset allocation percentage and by adding expected inflation. The target allocation and best estimates of arithmetic real rates of return for each major asset class are summarized in the following table:
Year ending June 30,2019 (1,351,872)$ 2020 2,196,525 2021 607,969 2022 (1,120,391)
332,231$
Actuarial valuation date June 30, 2016Actuarial roll forward date June 30, 2017Actuarial cost method Entry age normalInvestment rate of return 8%Projected salary increases 3-6.75% for pensionsInflation factor 3%Permanent benefit increase Included for pensionsMortality rates 1994 GAM Scale BB
ArithmeticTarget Real Rates
Asset Class Allocation of ReturnCommodities 2% 3.84%
Multi 5% 3.41%Real Estate 10% 4.25%
Fixed Income 25% 3.70%Equity 58% 6.73%
Total 100%
80
Discount Rate The discount rate used to measure the ASRS pension liability was 8 percent, which is less than the long-term expected rate of return of 8.7 percent. The projection of cash flows used to determine the discount rate assumed that contributions from participating employers will be made based on the actuarially determined rates as determined by the ASRS Board’s funding policy, which establishes the contractually required rate under Arizona statute. Based on those assumptions, the pension plan’s fiduciary net position was projected to be available to make all projected future benefit payments of current plan members. Therefore, the long-term expected rate of return on pension plan investments was applied to all periods of projected benefit payment to determine the total pension liability. Sensitivity of the City’s Proportionate Share of the ASRS Net Pension Liability to Changes in the Discount Rate The following table presents the City’s proportionate shares of the net pension liability calculated using the discount rate of 8 percent, as well as what the City’s proportionate share of the net pension liability would be if it were calculated using a discount rate that is 1 percentage point lower or 1 percentage point higher than the current rate:
Pension Plan Fiduciary Net Position Detailed information about the pension plan’s fiduciary net position is available in the separately issued ASRS financial report.
Public Safety Personnel Retirement System (PSPRS) Benefits Provided The PSPRS provide retirement, health insurance premium supplement, disability and survivor benefits. State statute established benefits terms. Retirement disability and survivor benefits are calculated based on age, average monthly compensation and service credit as follows:
Current1% Decrease Discount Rate 1% Increase
(7%) (8%) (9%)City's proportionate share of the net pension liability 62,515,425$ 48,706,334$ 37,167,655$
81
Retirement and survivor benefits are subject to automatic cost-of-living adjustments based on excess investment earnings. The adjustments are based on inflation for PSPRS. In addition, the legislature may enact permanent one-time benefit increases after a Joint Legislative Budget Committee analysis of the increase’s impact on the plan. PSPRS also provides temporary disability benefits of 50 percent of the members’ compensation for up to 12 months. Health insurance premium benefits are available to retired or disabled members with 5 years of credited service. The benefits are payable only with the respect to allowable health insurance premiums for which the member is responsible. Benefits range from $150 per month to $260 per month depending on the age of the members and dependents. Employees Covered by Benefit Terms At June 30, 2018, the following employees were covered by the agent pension plans’ benefit terms:
Contributions and Annual OPEB Cost State statutes establish the pension contrition requirements for active PSPRS employees. In accordance with state statutes, annual actuarial valuations determine employer contribution requirements for PSPRS pension and health insurance premium benefits. The combined active member and employer contribution rates are expected to finance the costs of benefits employees earn during the year, with an additional amount to finance any unfunded accrued liability. Benefit and contribution provisions are established by state law and may be amended only by the State of Arizona Legislature (A.R.S. Section 38-843).
PSPRSInitial Membership Date: Before January 1, 2012
On or after January 1, 2012 and before July 1, 2017
Years of service and age required to receive benefit
20 years of service, any age 25 years of service or 15 years of credited service, age 52.5
15 years of service, age 62
Final average salary is based on Highest 36 consecutive months of last 20 years Highest 60 consecutive months of last 20 years
Benefit percent Normal retirement 50% less 2.0% for each year of credited service
less than 20 years OR plus 2.0% to 2.5% for each year of credited service over 20 years, not to exceed 80%
1.5% to 2.5% per year of credited service, not to exceed 80%
Accidental disability
Catastrophic disability
Ordinary disability
Survivor benefit Retired members
Active members 80% to 100% of accidental disability retirement benefit or 100% of average monthly compensation if death was the result of injuries received on the job
90% for the first 60 months then reduced to either 62.5% or normal retirement, whichever is greater
Normal retirement calculated with actual years of credited service or 20 years of credited service, whichever is greater, multiplied by years of credited service (not to exceed 20 years) divided by 20 years
80% to 100% of retired member's pension benefit
50% or normal retirement, whichever is greater
Police Fire
72 88
31 15103 79206 182
PSPRS
Inactive employees or beneficiaries currently receiving benefits
Inactive employees entitled to but not yet receiving benefitsActive employeesTotal
82
Contribution rates for the year ended June 30, 2018, are indicated below. Rates are a percentage of active members’ annual covered payroll. In addition, the City was required by statute to contribute at the actuarially determined rate of 39.80 percent for the PSPRS Police and 58.40 percent for PSPRS Fire of annual covered payroll of retired members who worked for the City in positions that would typically be filled by an employee who contributes to the PSPRS. The City’s contributions to the plans for the year ended June 30, 2018, were:
During fiscal year 2018, the City paid for PSPRS pension and OPEB contributions for police with 100% general fund dollars and 95.5% from the general fund plus 4.5% from the airport fund as related to fire contributions. Net Pension/OPEB (Asset) Liability At June 30, 2018, the City reported net pension liability of $47,462,470 and $56,287,033 for police and fire respectively and a net asset for fire in the amount of $1,056,849 related to OPEB. The net asset and net liabilities were measured as of June 30, 2017, and the total liability used to calculate the net asset or liability was determined by an actuarial valuation as of that date. Actuarial Assumptions The total liabilities as of June 30, 2017, reflect changes of actuarial assumptions based on the results of an actuarial experience study for the 5-year period ended June 30, 2016, including decreasing the investment rate of return from 7.5 percent to 7.4 percent, decreasing the wage inflation from 4 percent to 3.5 percent, and updating mortality, withdrawal, disability and retirement assumptions. The total pension liabilities for PSPRS also reflect changes of benefit terms for legislation that changed benefit eligibility and multipliers for employees who became members on or after January 1, 2012, and before July 1, 2017, and a court decision that decreased the contribution rates for employees who became members before July 20, 2011. The court decision will also affect the PSPRS net pension liabilities measured as of June 30, 2018 because of refunds of excess member contributions. The change in the City’s PSPRS net pension liabilities as a result of the refunds is not known.
Active member - Pension City - Pension
City - Health Insurance Premium Benefit
PSPRS Police 7.65% to 11.65% 49.48% - 54.39% 0.26% - 0.34%PSPRS Fire 7.65% to 11.65% 68.08% - 75.11% 0% - 0.26%
Active member - Pension City - Pension
PSPRS Police 656,321$ 3,675,844$ PSPRS Fire 523,614 3,755,920
83
Actuarial assumptions used in the June 30, 2017, valuation was based on the results of an actuarial experience study for the 5-year period ended June 30, 2016.
The long-term expected rate of return on PSPRS plan investments was determined to be 7.40 percent using a building-block method in which best-estimated ranges of expected future real rates of return (expected returns, net of plan investment expenses and inflation) are developed for each major asset class. The target allocation and best estimates of geometric real rates of return for each major asset class are summarized in the following table:
Pension Discount Rates At June 30, 2017, the discount rate used to measure the PSPRS total pension/OPEB liabilities was 7.40 percent, which was a decrease of 0.1 from the discount rate used as of June 30, 2016. The projection of cash flows used to determine the discount rates assumed that plan member contributions will be made at the
Police Fire OPEB FireAmortization method Level percent-of-
pay closedLevel percent-of-pay closed
Level percent-of-pay closed
Remaining amortization period-UAL 22 years 22 years 21 yearsRemaining amortization period-excess 20 years 20 years 20 years
Asset valuation method 7-year smoothed market; 20% corridor
7-year smoothed market; 20% corridor
7-year smoothed market; 20% corridor
Actuarial assumptions Actuarial cost method Entry age normal Entry age normal Entry age normal Investment rate of return 7.40% 7.40% 7.85% Projected salary increases 3.5% to 7.5% 3.5% to 7.5% 4% to 8% Inflation 4.00% 2.50% 3.00%
Permanent benefit increase Included Included NA
Mortality rates RP-2000 table projected 2015
using projection scale AA
Health Care Trend rate NA NA NA
PSPRS
RP-2014 tables using Mp-2016 improvement scale with adjustments to match current
experience
PSPRS TargetAsset Class Allocation
Short term investments 2%Absolute return 2%Risk parity 4%Fixed income 5%Real assets 9%GTAA 10%Private equity 12%Real estate 10%Private Credit 16%Non-U.S. equity 14%U.S. equity 16%Total 100%
Long-Term ExpectedReal ArithmeticRate of Return
0.25%3.75%5.00%1.25%4.52%3.96%6.75%3.75%5.83%8.70%7.60%
84
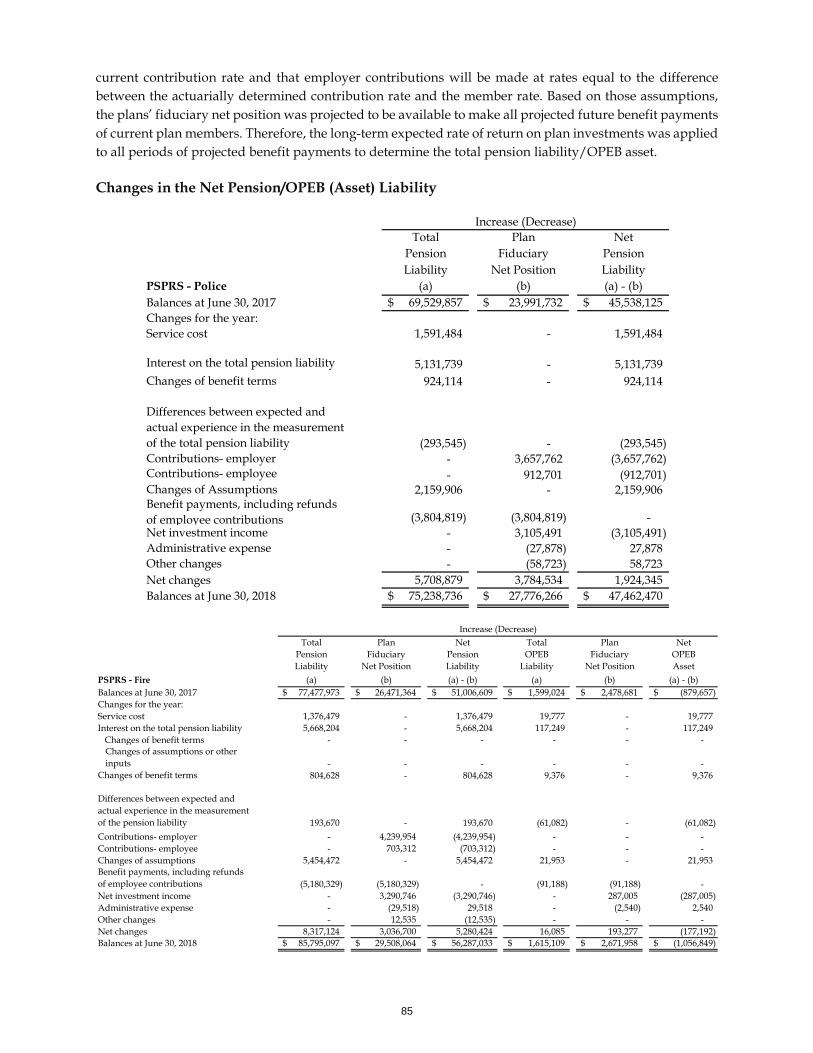
current contribution rate and that employer contributions will be made at rates equal to the difference between the actuarially determined contribution rate and the member rate. Based on those assumptions, the plans’ fiduciary net position was projected to be available to make all projected future benefit payments of current plan members. Therefore, the long-term expected rate of return on plan investments was applied to all periods of projected benefit payments to determine the total pension liability/OPEB asset. Changes in the Net Pension/OPEB (Asset) Liability
Total Plan NetPension Fiduciary PensionLiability Net Position Liability
PSPRS - Police (a) (b) (a) - (b)Balances at June 30, 2017 69,529,857$ 23,991,732$ 45,538,125$ Changes for the year:Service cost 1,591,484 - 1,591,484
Interest on the total pension liability 5,131,739 - 5,131,739 Changes of benefit terms 924,114 - 924,114
Differences between expected and actual experience in the measurement of the total pension liability (293,545) - (293,545) Contributions- employer - 3,657,762 (3,657,762) Contributions- employee - 912,701 (912,701) Changes of Assumptions 2,159,906 - 2,159,906 Benefit payments, including refunds of employee contributions (3,804,819) (3,804,819) - Net investment income - 3,105,491 (3,105,491) Administrative expense - (27,878) 27,878 Other changes - (58,723) 58,723 Net changes 5,708,879 3,784,534 1,924,345 Balances at June 30, 2018 75,238,736$ 27,776,266$ 47,462,470$
Increase (Decrease)
Total Plan Net Total Plan NetPension Fiduciary Pension OPEB Fiduciary OPEBLiability Net Position Liability Liability Net Position Asset
PSPRS - Fire (a) (b) (a) - (b) (a) (b) (a) - (b)Balances at June 30, 2017 77,477,973$ 26,471,364$ 51,006,609$ 1,599,024$ 2,478,681$ (879,657)$ Changes for the year:Service cost 1,376,479 - 1,376,479 19,777 - 19,777 Interest on the total pension liability 5,668,204 - 5,668,204 117,249 - 117,249 Changes of benefit terms - - - - - -
Changes of assumptions or other inputs - - - - - -
Changes of benefit terms 804,628 - 804,628 9,376 - 9,376
Differences between expected and actual experience in the measurement of the pension liability 193,670 - 193,670 (61,082) - (61,082) Contributions- employer - 4,239,954 (4,239,954) - - - Contributions- employee - 703,312 (703,312) - - - Changes of assumptions 5,454,472 - 5,454,472 21,953 - 21,953 Benefit payments, including refunds of employee contributions (5,180,329) (5,180,329) - (91,188) (91,188) - Net investment income - 3,290,746 (3,290,746) - 287,005 (287,005) Administrative expense - (29,518) 29,518 - (2,540) 2,540 Other changes - 12,535 (12,535) - - - Net changes 8,317,124 3,036,700 5,280,424 16,085 193,277 (177,192) Balances at June 30, 2018 85,795,097$ 29,508,064$ 56,287,033$ 1,615,109$ 2,671,958$ (1,056,849)$
Increase (Decrease)
85
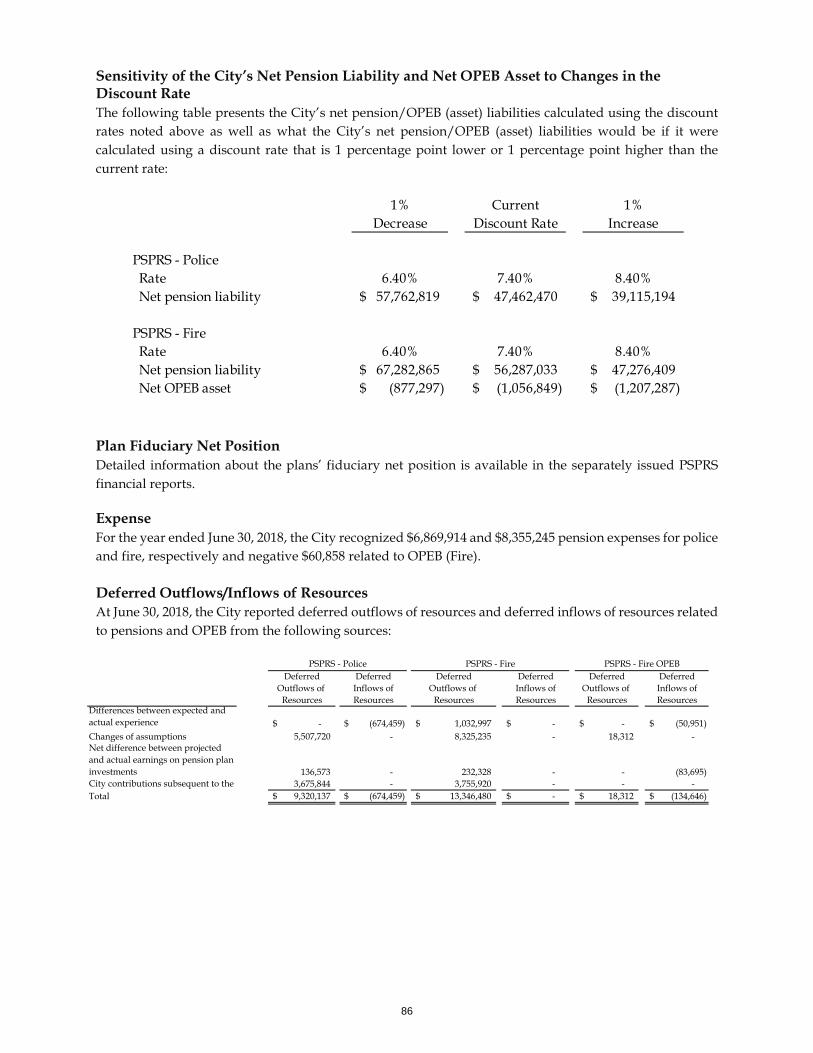
Sensitivity of the City’s Net Pension Liability and Net OPEB Asset to Changes in the Discount Rate The following table presents the City’s net pension/OPEB (asset) liabilities calculated using the discount rates noted above as well as what the City’s net pension/OPEB (asset) liabilities would be if it were calculated using a discount rate that is 1 percentage point lower or 1 percentage point higher than the current rate:
Plan Fiduciary Net Position Detailed information about the plans’ fiduciary net position is available in the separately issued PSPRS financial reports. Expense For the year ended June 30, 2018, the City recognized $6,869,914 and $8,355,245 pension expenses for police and fire, respectively and negative $60,858 related to OPEB (Fire). Deferred Outflows/Inflows of Resources At June 30, 2018, the City reported deferred outflows of resources and deferred inflows of resources related to pensions and OPEB from the following sources:
1% Current 1%Decrease Discount Rate Increase
PSPRS - Police Rate 6.40% 7.40% 8.40% Net pension liability 57,762,819$ 47,462,470$ 39,115,194$
PSPRS - Fire Rate 6.40% 7.40% 8.40% Net pension liability 67,282,865$ 56,287,033$ 47,276,409$ Net OPEB asset (877,297)$ (1,056,849)$ (1,207,287)$
Deferred Deferred Deferred Deferred Deferred DeferredOutflows of Inflows of Outflows of Inflows of Outflows of Inflows of
Resources Resources Resources Resources Resources ResourcesDifferences between expected and actual experience -$ (674,459)$ 1,032,997$ -$ -$ (50,951)$ Changes of assumptions 5,507,720 - 8,325,235 - 18,312 - Net difference between projected and actual earnings on pension plan investments 136,573 - 232,328 - - (83,695) City contributions subsequent to the 3,675,844 - 3,755,920 - - - Total 9,320,137$ (674,459)$ 13,346,480$ -$ 18,312$ (134,646)$
PSPRS - Police PSPRS - Fire PSPRS - Fire OPEB
86
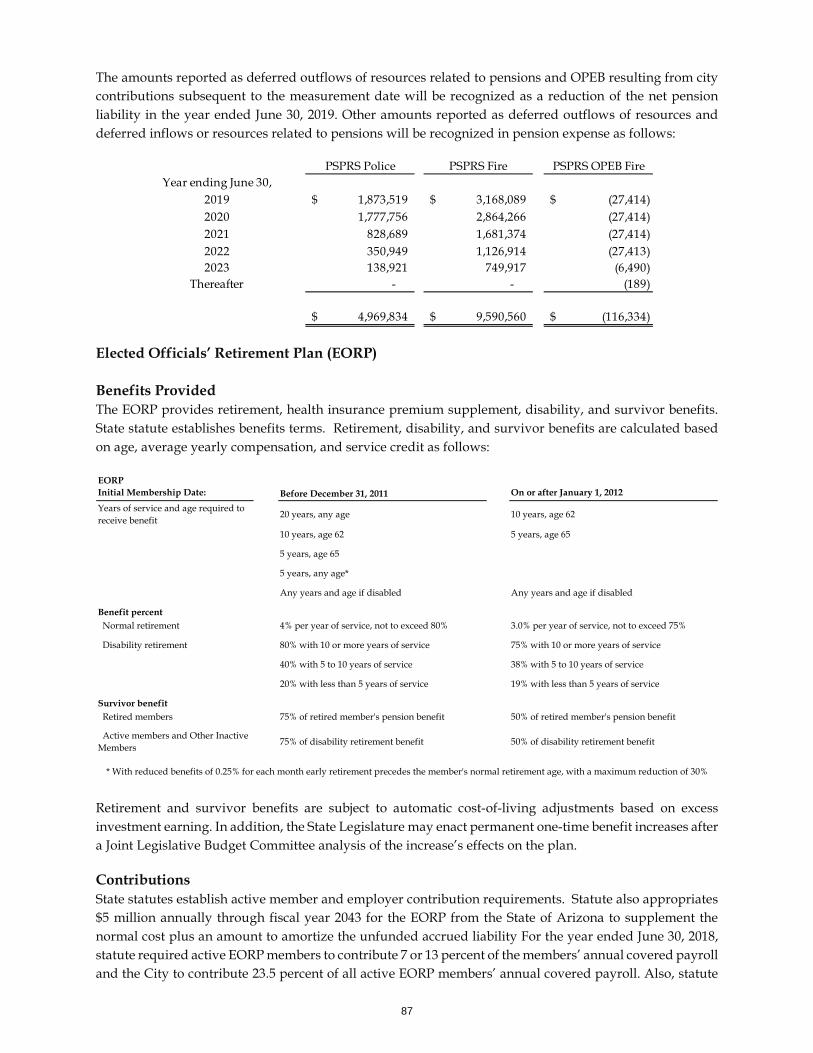
The amounts reported as deferred outflows of resources related to pensions and OPEB resulting from city contributions subsequent to the measurement date will be recognized as a reduction of the net pension liability in the year ended June 30, 2019. Other amounts reported as deferred outflows of resources and deferred inflows or resources related to pensions will be recognized in pension expense as follows:
Elected Officials’ Retirement Plan (EORP) Benefits Provided The EORP provides retirement, health insurance premium supplement, disability, and survivor benefits. State statute establishes benefits terms. Retirement, disability, and survivor benefits are calculated based on age, average yearly compensation, and service credit as follows:
Retirement and survivor benefits are subject to automatic cost-of-living adjustments based on excess investment earning. In addition, the State Legislature may enact permanent one-time benefit increases after a Joint Legislative Budget Committee analysis of the increase’s effects on the plan. Contributions State statutes establish active member and employer contribution requirements. Statute also appropriates $5 million annually through fiscal year 2043 for the EORP from the State of Arizona to supplement the normal cost plus an amount to amortize the unfunded accrued liability For the year ended June 30, 2018, statute required active EORP members to contribute 7 or 13 percent of the members’ annual covered payroll and the City to contribute 23.5 percent of all active EORP members’ annual covered payroll. Also, statute
PSPRS Police PSPRS Fire PSPRS OPEB FireYear ending June 30,
2019 1,873,519$ 3,168,089$ (27,414)$ 2020 1,777,756 2,864,266 (27,414) 2021 828,689 1,681,374 (27,414) 2022 350,949 1,126,914 (27,413) 2023 138,921 749,917 (6,490)
Thereafter - - (189)
4,969,834$ 9,590,560$ (116,334)$
EORP Initial Membership Date: Before December 31, 2011 On or after January 1, 2012
Years of service and age required to receive benefit 20 years, any age 10 years, age 62
10 years, age 62 5 years, age 65
5 years, age 65
5 years, any age*
Any years and age if disabled Any years and age if disabled
Benefit percent Normal retirement 4% per year of service, not to exceed 80% 3.0% per year of service, not to exceed 75%
Disability retirement 80% with 10 or more years of service 75% with 10 or more years of service
40% with 5 to 10 years of service 38% with 5 to 10 years of service
20% with less than 5 years of service 19% with less than 5 years of service
Survivor benefit Retired members 75% of retired member's pension benefit 50% of retired member's pension benefit
Active members and Other Inactive Members 75% of disability retirement benefit 50% of disability retirement benefit
* With reduced benefits of 0.25% for each month early retirement precedes the member's normal retirement age, with a maximum reduction of 30%
87
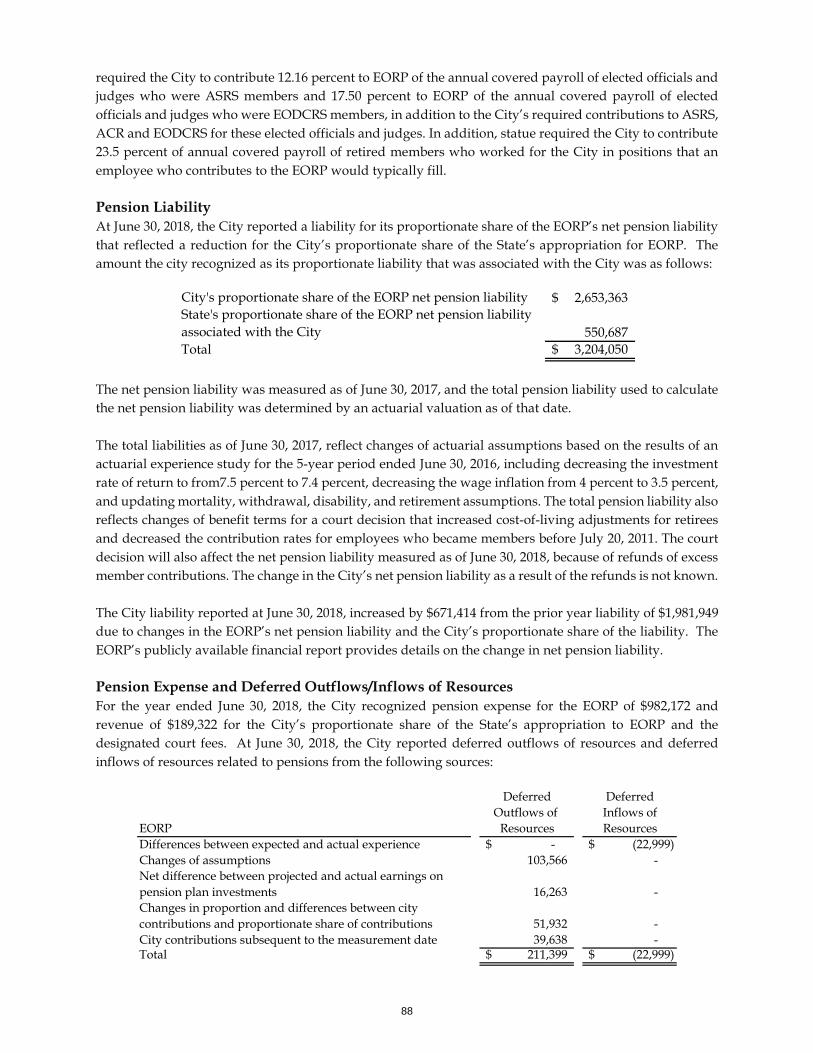
required the City to contribute 12.16 percent to EORP of the annual covered payroll of elected officials and judges who were ASRS members and 17.50 percent to EORP of the annual covered payroll of elected officials and judges who were EODCRS members, in addition to the City’s required contributions to ASRS, ACR and EODCRS for these elected officials and judges. In addition, statue required the City to contribute 23.5 percent of annual covered payroll of retired members who worked for the City in positions that an employee who contributes to the EORP would typically fill. Pension Liability At June 30, 2018, the City reported a liability for its proportionate share of the EORP’s net pension liability that reflected a reduction for the City’s proportionate share of the State’s appropriation for EORP. The amount the city recognized as its proportionate liability that was associated with the City was as follows:
The net pension liability was measured as of June 30, 2017, and the total pension liability used to calculate the net pension liability was determined by an actuarial valuation as of that date. The total liabilities as of June 30, 2017, reflect changes of actuarial assumptions based on the results of an actuarial experience study for the 5-year period ended June 30, 2016, including decreasing the investment rate of return to from7.5 percent to 7.4 percent, decreasing the wage inflation from 4 percent to 3.5 percent, and updating mortality, withdrawal, disability, and retirement assumptions. The total pension liability also reflects changes of benefit terms for a court decision that increased cost-of-living adjustments for retirees and decreased the contribution rates for employees who became members before July 20, 2011. The court decision will also affect the net pension liability measured as of June 30, 2018, because of refunds of excess member contributions. The change in the City’s net pension liability as a result of the refunds is not known. The City liability reported at June 30, 2018, increased by $671,414 from the prior year liability of $1,981,949 due to changes in the EORP’s net pension liability and the City’s proportionate share of the liability. The EORP’s publicly available financial report provides details on the change in net pension liability. Pension Expense and Deferred Outflows/Inflows of Resources For the year ended June 30, 2018, the City recognized pension expense for the EORP of $982,172 and revenue of $189,322 for the City’s proportionate share of the State’s appropriation to EORP and the designated court fees. At June 30, 2018, the City reported deferred outflows of resources and deferred inflows of resources related to pensions from the following sources:
City's proportionate share of the EORP net pension liability 2,653,363$ State's proportionate share of the EORP net pension liability associated with the City 550,687 Total 3,204,050$
Deferred DeferredOutflows of Inflows of
EORP Resources Resources-$ (22,999)$
Changes of assumptions 103,566 -
16,263 -
51,932 - 39,638 -
Total 211,399$ (22,999)$
Net difference between projected and actual earnings on pension plan investmentsChanges in proportion and differences between city contributions and proportionate share of contributionsCity contributions subsequent to the measurement date
Differences between expected and actual experience
88
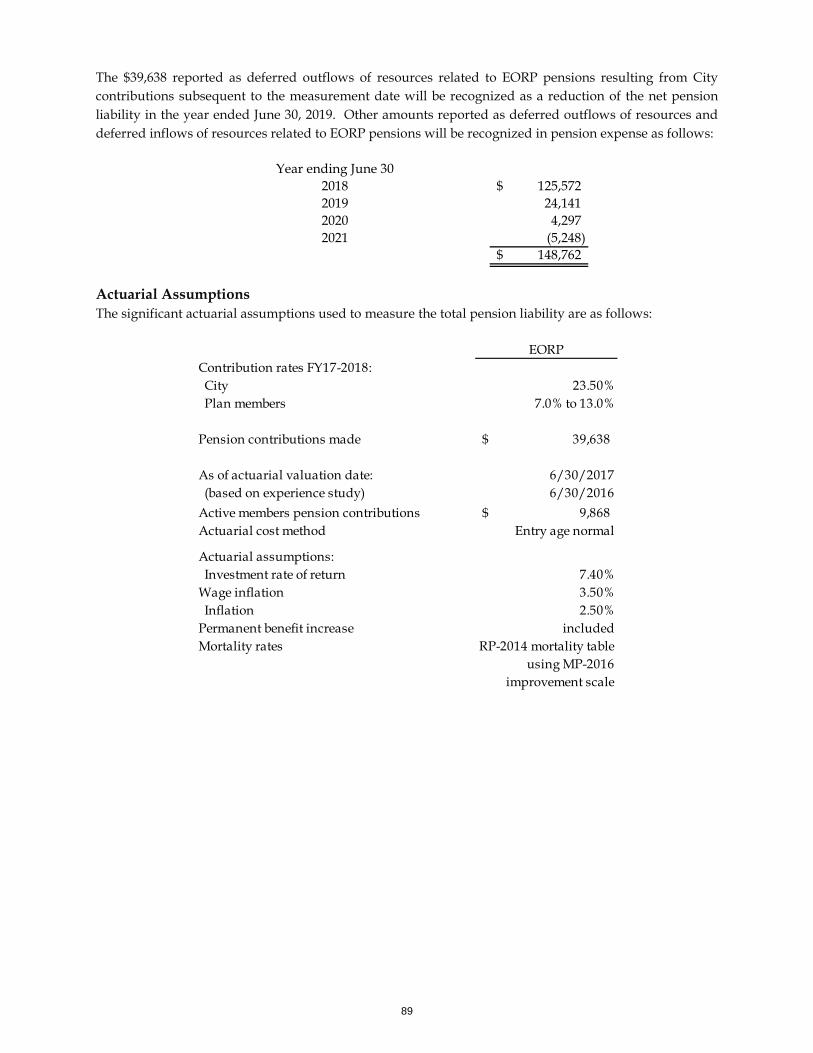
The $39,638 reported as deferred outflows of resources related to EORP pensions resulting from City contributions subsequent to the measurement date will be recognized as a reduction of the net pension liability in the year ended June 30, 2019. Other amounts reported as deferred outflows of resources and deferred inflows of resources related to EORP pensions will be recognized in pension expense as follows:
Actuarial Assumptions The significant actuarial assumptions used to measure the total pension liability are as follows:
Year ending June 302018 125,572$ 2019 24,141 2020 4,297 2021 (5,248)
148,762$
EORPContribution rates FY17-2018: City 23.50% Plan members 7.0% to 13.0%
Pension contributions made 39,638$
As of actuarial valuation date: 6/30/2017 (based on experience study) 6/30/2016Active members pension contributions 9,868$ Actuarial cost method Entry age normal
Actuarial assumptions: Investment rate of return 7.40%Wage inflation 3.50% Inflation 2.50%Permanent benefit increase includedMortality rates RP-2014 mortality table
using MP-2016 improvement scale
89
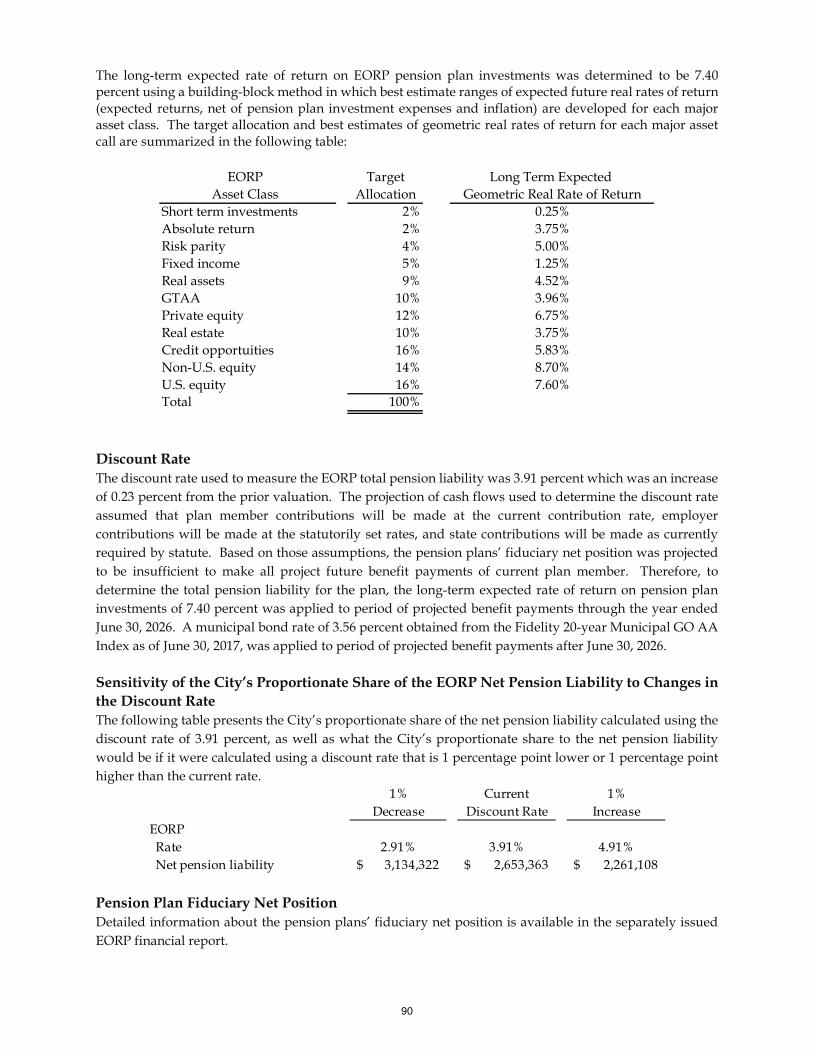
The long-term expected rate of return on EORP pension plan investments was determined to be 7.40 percent using a building-block method in which best estimate ranges of expected future real rates of return (expected returns, net of pension plan investment expenses and inflation) are developed for each major asset class. The target allocation and best estimates of geometric real rates of return for each major asset call are summarized in the following table:
Discount Rate The discount rate used to measure the EORP total pension liability was 3.91 percent which was an increase of 0.23 percent from the prior valuation. The projection of cash flows used to determine the discount rate assumed that plan member contributions will be made at the current contribution rate, employer contributions will be made at the statutorily set rates, and state contributions will be made as currently required by statute. Based on those assumptions, the pension plans’ fiduciary net position was projected to be insufficient to make all project future benefit payments of current plan member. Therefore, to determine the total pension liability for the plan, the long-term expected rate of return on pension plan investments of 7.40 percent was applied to period of projected benefit payments through the year ended June 30, 2026. A municipal bond rate of 3.56 percent obtained from the Fidelity 20-year Municipal GO AA Index as of June 30, 2017, was applied to period of projected benefit payments after June 30, 2026. Sensitivity of the City’s Proportionate Share of the EORP Net Pension Liability to Changes in the Discount Rate The following table presents the City’s proportionate share of the net pension liability calculated using the discount rate of 3.91 percent, as well as what the City’s proportionate share to the net pension liability would be if it were calculated using a discount rate that is 1 percentage point lower or 1 percentage point higher than the current rate.
Pension Plan Fiduciary Net Position Detailed information about the pension plans’ fiduciary net position is available in the separately issued EORP financial report.
EORP TargetAsset Class Allocation
Short term investments 2%Absolute return 2%Risk parity 4%Fixed income 5%Real assets 9%GTAA 10%Private equity 12%Real estate 10%Credit opportuities 16%Non-U.S. equity 14%U.S. equity 16%Total 100%
Long Term Expected Geometric Real Rate of Return
0.25%3.75%
3.75%5.83%8.70%7.60%
5.00%1.25%4.52%3.96%6.75%
1% Current 1%Decrease Discount Rate Increase
EORP Rate 2.91% 3.91% 4.91% Net pension liability 3,134,322$ 2,653,363$ 2,261,108$
90
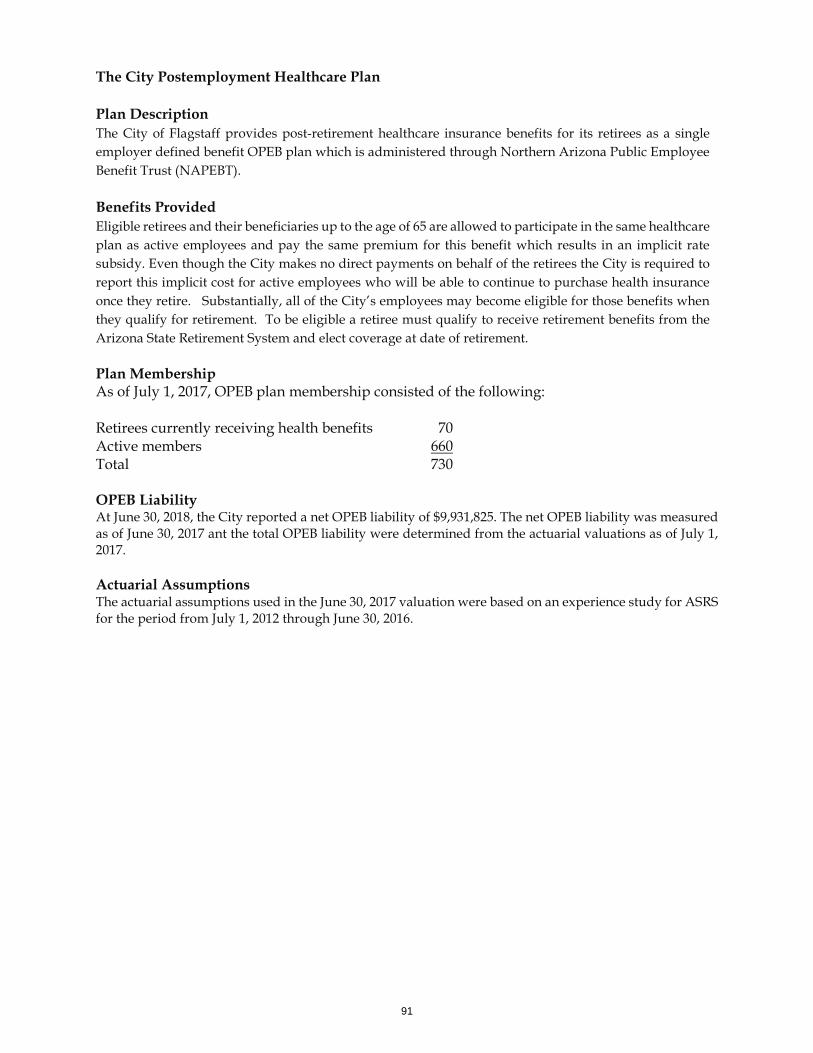
The City Postemployment Healthcare Plan Plan Description The City of Flagstaff provides post-retirement healthcare insurance benefits for its retirees as a single employer defined benefit OPEB plan which is administered through Northern Arizona Public Employee Benefit Trust (NAPEBT). Benefits Provided Eligible retirees and their beneficiaries up to the age of 65 are allowed to participate in the same healthcare plan as active employees and pay the same premium for this benefit which results in an implicit rate subsidy. Even though the City makes no direct payments on behalf of the retirees the City is required to report this implicit cost for active employees who will be able to continue to purchase health insurance once they retire. Substantially, all of the City’s employees may become eligible for those benefits when they qualify for retirement. To be eligible a retiree must qualify to receive retirement benefits from the Arizona State Retirement System and elect coverage at date of retirement. Plan Membership As of July 1, 2017, OPEB plan membership consisted of the following: Retirees currently receiving health benefits 70 Active members 660 Total 730 OPEB Liability At June 30, 2018, the City reported a net OPEB liability of $9,931,825. The net OPEB liability was measured as of June 30, 2017 ant the total OPEB liability were determined from the actuarial valuations as of July 1, 2017. Actuarial Assumptions The actuarial assumptions used in the June 30, 2017 valuation were based on an experience study for ASRS for the period from July 1, 2012 through June 30, 2016.
91
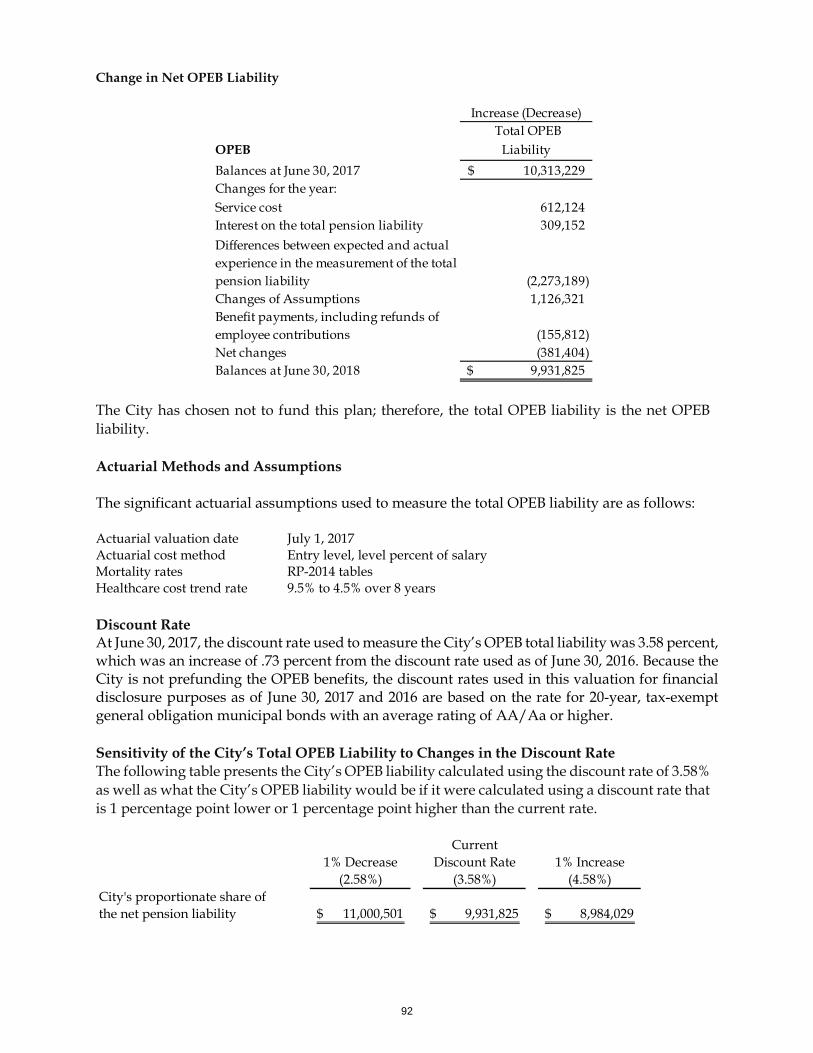
Change in Net OPEB Liability
The City has chosen not to fund this plan; therefore, the total OPEB liability is the net OPEB liability. Actuarial Methods and Assumptions The significant actuarial assumptions used to measure the total OPEB liability are as follows: Actuarial valuation date July 1, 2017 Actuarial cost method Entry level, level percent of salary Mortality rates RP-2014 tables Healthcare cost trend rate 9.5% to 4.5% over 8 years Discount Rate At June 30, 2017, the discount rate used to measure the City’s OPEB total liability was 3.58 percent, which was an increase of .73 percent from the discount rate used as of June 30, 2016. Because the City is not prefunding the OPEB benefits, the discount rates used in this valuation for financial disclosure purposes as of June 30, 2017 and 2016 are based on the rate for 20-year, tax-exempt general obligation municipal bonds with an average rating of AA/Aa or higher. Sensitivity of the City’s Total OPEB Liability to Changes in the Discount Rate The following table presents the City’s OPEB liability calculated using the discount rate of 3.58% as well as what the City’s OPEB liability would be if it were calculated using a discount rate that is 1 percentage point lower or 1 percentage point higher than the current rate.
OPEB Balances at June 30, 2017Changes for the year:
Net changesBalances at June 30, 2018
Increase (Decrease) Total OPEB
Liability10,313,229$
612,124 309,152
(2,273,189) 1,126,321
(155,812) (381,404)
9,931,825$
Service cost
Differences between expected and actual experience in the measurement of the total pension liability
Interest on the total pension liability
Changes of AssumptionsBenefit payments, including refunds of employee contributions
Current1% Decrease Discount Rate 1% Increase
(2.58%) (3.58%) (4.58%)City's proportionate share of the net pension liability 11,000,501$ 9,931,825$ 8,984,029$
92
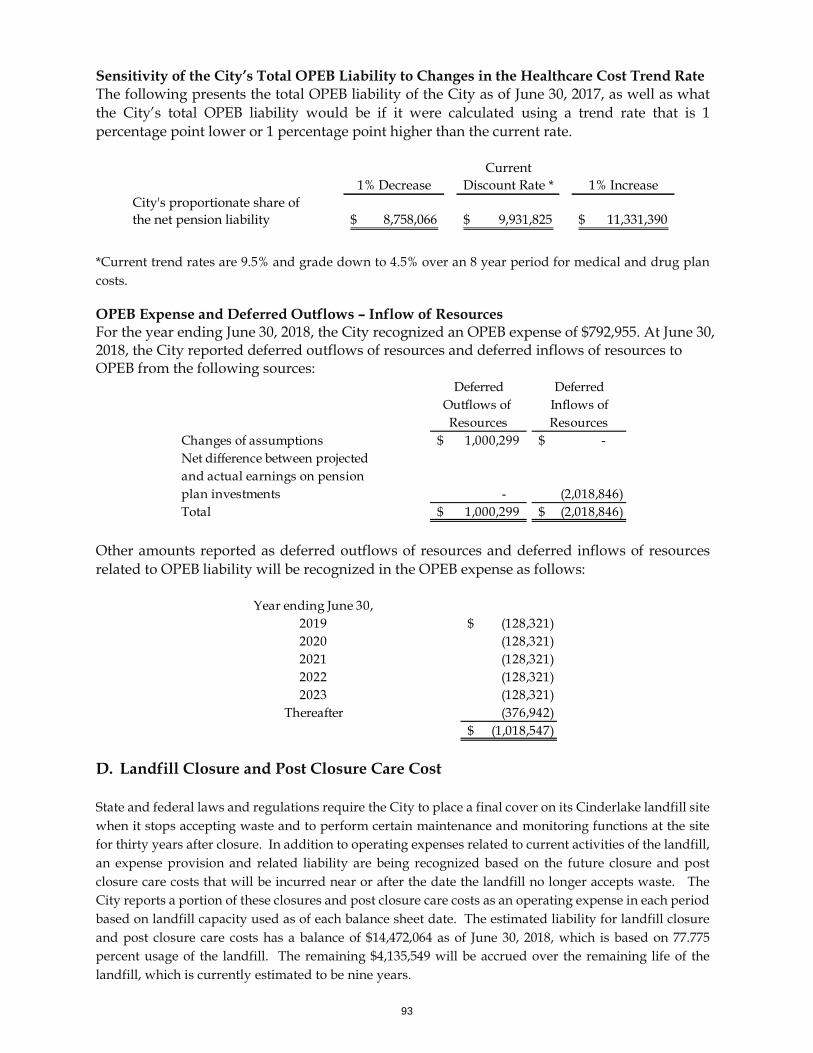
Sensitivity of the City’s Total OPEB Liability to Changes in the Healthcare Cost Trend Rate The following presents the total OPEB liability of the City as of June 30, 2017, as well as what the City’s total OPEB liability would be if it were calculated using a trend rate that is 1 percentage point lower or 1 percentage point higher than the current rate.
*Current trend rates are 9.5% and grade down to 4.5% over an 8 year period for medical and drug plan costs. OPEB Expense and Deferred Outflows – Inflow of Resources For the year ending June 30, 2018, the City recognized an OPEB expense of $792,955. At June 30, 2018, the City reported deferred outflows of resources and deferred inflows of resources to OPEB from the following sources:
Other amounts reported as deferred outflows of resources and deferred inflows of resources related to OPEB liability will be recognized in the OPEB expense as follows:
D. Landfill Closure and Post Closure Care Cost State and federal laws and regulations require the City to place a final cover on its Cinderlake landfill site when it stops accepting waste and to perform certain maintenance and monitoring functions at the site for thirty years after closure. In addition to operating expenses related to current activities of the landfill, an expense provision and related liability are being recognized based on the future closure and post closure care costs that will be incurred near or after the date the landfill no longer accepts waste. The City reports a portion of these closures and post closure care costs as an operating expense in each period based on landfill capacity used as of each balance sheet date. The estimated liability for landfill closure and post closure care costs has a balance of $14,472,064 as of June 30, 2018, which is based on 77.775 percent usage of the landfill. The remaining $4,135,549 will be accrued over the remaining life of the landfill, which is currently estimated to be nine years.
Current1% Decrease Discount Rate * 1% Increase
City's proportionate share of the net pension liability 8,758,066$ 9,931,825$ 11,331,390$
Deferred DeferredOutflows of Inflows ofResources Resources
Changes of assumptions 1,000,299$ -$ Net difference between projected and actual earnings on pension plan investments - (2,018,846) Total 1,000,299$ (2,018,846)$
Year ending June 30,2019 (128,321)$ 2020 (128,321) 2021 (128,321) 2022 (128,321) 2023 (128,321)
Thereafter (376,942) (1,018,547)$
93
The accrual for the closure and post closure care costs for fiscal year 2018 is $5,996,285. Based on current estimates for landfill closure and post closure care costs, the City is setting aside legally restricted funds to ensure sufficient funds will be available to meet these requirements. The City makes annual contributions to finance closure and post closure care costs; at June 30, 2018 the balance of the investments held for those purposes is $10,819,845. The investments are reported as restricted cash and investments in the City’s Environmental Service Fund, and are held by the State of Arizona Local Government Investment Pool. The estimated total current cost of the landfill closure and post closure care, $18,607,612, is based on the amount that would be paid if all equipment, facilities, and services required to care, monitor and maintain the landfill were acquired as of June 30, 2018. However, the actual cost of closure and post closure care may be higher or lower due to other factors such as; inflation, changes in technology, or changes in landfill laws and regulations. According to state and federal laws and regulations, the City must comply with the local government financial test requirements that assure the City can meet the cost of landfill closure, post-closure and corrective action when needed. The City, which has pledged its full faith and credit to meet state financial responsibility requirements, is in compliance with these requirements. In March of 1999, the City purchased 343.9 acres of land from the U.S. Forest Service. This land is adjacent to the existing landfill and will be used to open additional cells as needed. As these cells are utilized, additional liabilities for closure and post closure care requirements will be accrued. The City applied existing policy to the Environmental Services Fund increasing its’ expenditures as City residential and commercial collection programs are now charged for landfill fees. E. Tax Abatement The City enters into property tax abatement agreements with local businesses under the state of Arizona Government Property Lease Excise Tax (GPLETs). Under the law enacted in 1996, Arizona’s cities, towns, counties, and county stadium districts (government lessors) are allowed to lease property they own to private parties (lessees) for nongovernmental use and collect an excise tax. Because the property is owned by the City, it is exempt from property taxes. The abatements may be granted to any business located within or promising to relocate to the City to encourage continued provision of stable good paying employment opportunities for the City’s residents. The City believes that its efforts will perpetuate the City’s overall economic health and demonstrate the City’s attractiveness as a place to do business.
For the fiscal year ended June 30, 2018, the City abated assessed property taxes totaling $121,425 (net of $8,688 in lease payments) under this program including the following Government Property Lease Excise Tax (GPLET) abatement agreements:
A 1.6599 percent property tax abatement to Ralston Purina manufacturing. The 2017 abatement amounted to $77,317.
A 1.6599 percent property tax abatement to Joy Cone manufacturing. The 2017 abatement amounted to $44,108.
F. Subsequent Events On July 31, 2018, the City defeased the outstanding $2.02 million of Improvement district bonds for the Aspen Place at the Sawmill district improvements.
94
Required Supplementary Information
Page
Schedule of the City’s Proportional Share of the Net Pension Liability
Cost-Sharing Pension Plans 96
Schedule of the Changes in Net Pension Liability and Related Ratios
Agent Pension Plans – PSPRS Police 97
Agent Pension Plans – PSPRS Fire 98
Schedule of the Changes in Net OPEB Liability (Asset) and Related Ratios
PSPRS – Fire 99
City OPEB 100
Schedule of The City’s Pension / OPEB Contributions 101
Notes to the Required Supplementary Information 102
95
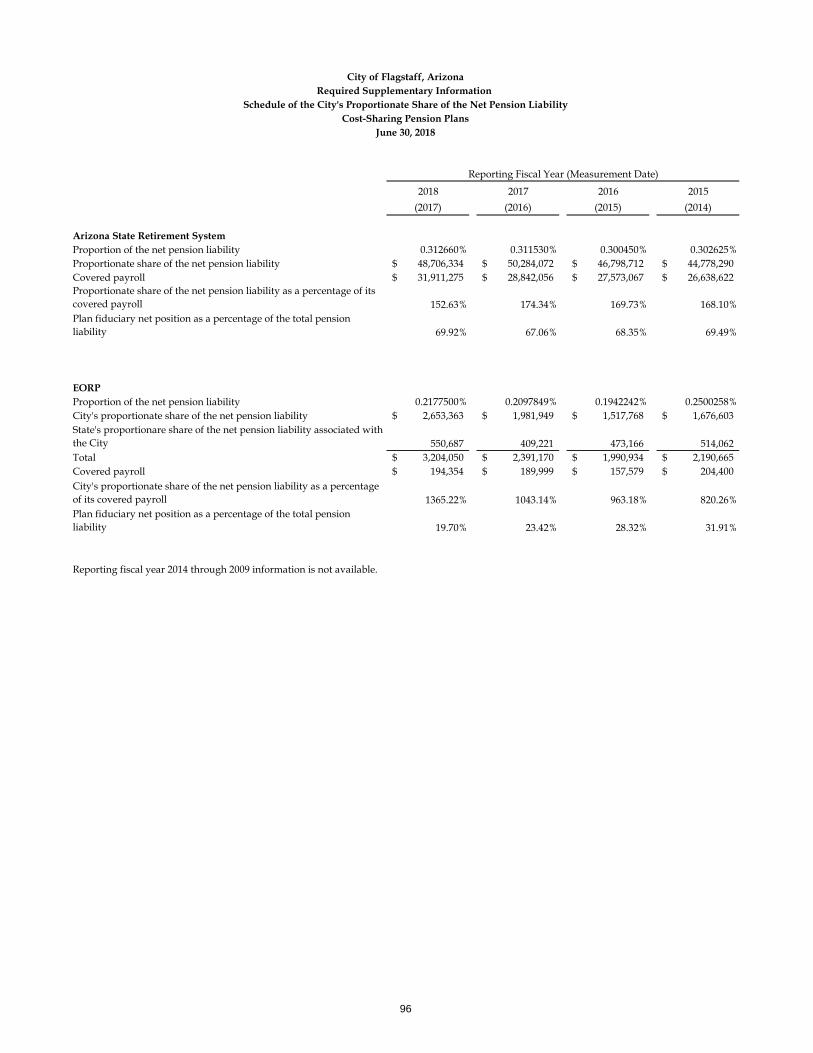
2018 2017 2016 2015(2017) (2016) (2015) (2014)
Arizona State Retirement SystemProportion of the net pension liability 0.312660% 0.311530% 0.300450% 0.302625%Proportionate share of the net pension liability 48,706,334$ 50,284,072$ 46,798,712$ 44,778,290$ Covered payroll 31,911,275$ 28,842,056$ 27,573,067$ 26,638,622$ Proportionate share of the net pension liability as a percentage of its covered payroll 152.63% 174.34% 169.73% 168.10%Plan fiduciary net position as a percentage of the total pension liability 69.92% 67.06% 68.35% 69.49%
EORPProportion of the net pension liability 0.2177500% 0.2097849% 0.1942242% 0.2500258%City's proportionate share of the net pension liability 2,653,363$ 1,981,949$ 1,517,768$ 1,676,603$ State's proportionare share of the net pension liability associated with the City 550,687 409,221 473,166 514,062 Total 3,204,050$ 2,391,170$ 1,990,934$ 2,190,665$ Covered payroll 194,354$ 189,999$ 157,579$ 204,400$ City's proportionate share of the net pension liability as a percentage of its covered payroll 1365.22% 1043.14% 963.18% 820.26%Plan fiduciary net position as a percentage of the total pension liability 19.70% 23.42% 28.32% 31.91%
Reporting fiscal year 2014 through 2009 information is not available.
Reporting Fiscal Year (Measurement Date)
City of Flagstaff, ArizonaRequired Supplementary Information
Schedule of the City's Proportionate Share of the Net Pension LiabilityCost-Sharing Pension Plans
June 30, 2018
96
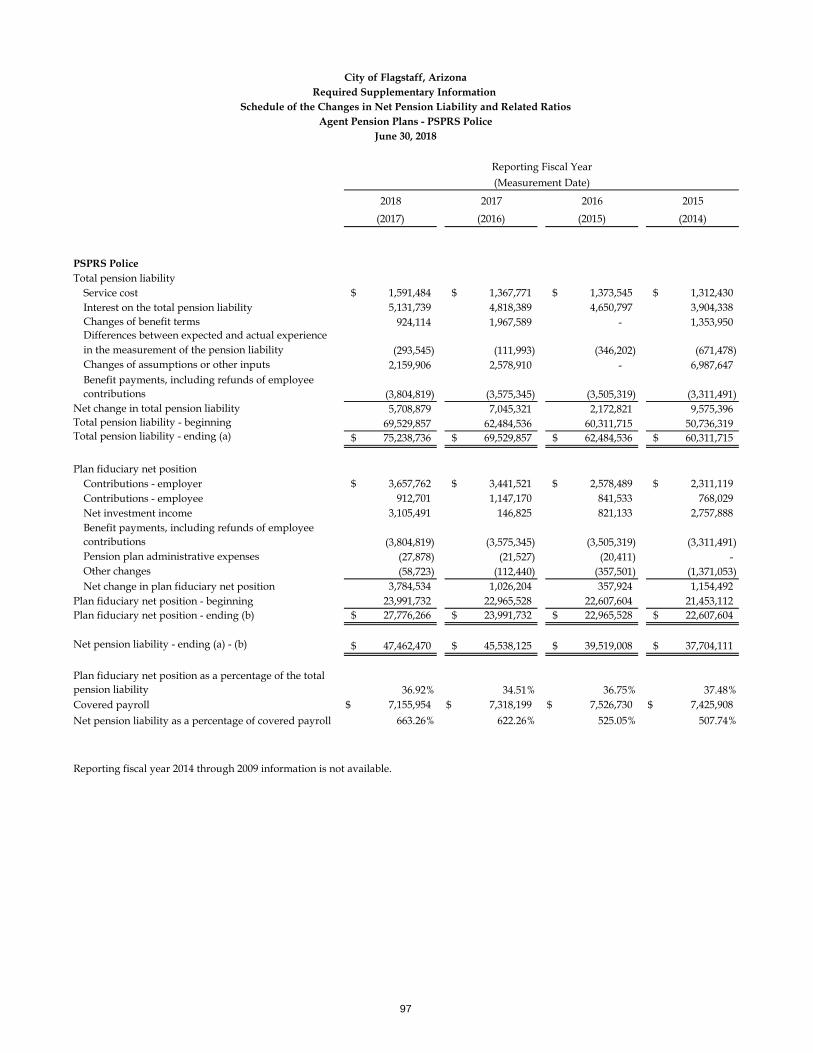
2018 2017 2016 2015(2017) (2016) (2015) (2014)
PSPRS PoliceTotal pension liability
Service cost 1,591,484$ 1,367,771$ 1,373,545$ 1,312,430$ Interest on the total pension liability 5,131,739 4,818,389 4,650,797 3,904,338 Changes of benefit terms 924,114 1,967,589 - 1,353,950 Differences between expected and actual experience in the measurement of the pension liability (293,545) (111,993) (346,202) (671,478) Changes of assumptions or other inputs 2,159,906 2,578,910 - 6,987,647 Benefit payments, including refunds of employee contributions (3,804,819) (3,575,345) (3,505,319) (3,311,491)
5,708,879 7,045,321 2,172,821 9,575,39669,529,857 62,484,536 60,311,715 50,736,31975,238,736$ 69,529,857$ 62,484,536$ 60,311,715$
Net change in total pension liability Total pension liability - beginning Total pension liability - ending (a)
Plan fiduciary net positionContributions - employer 3,657,762$ 3,441,521$ 2,578,489$ 2,311,119$ Contributions - employee 912,701 1,147,170 841,533 768,029 Net investment income 3,105,491 146,825 821,133 2,757,888Benefit payments, including refunds of employee contributions (3,804,819) (3,575,345) (3,505,319) (3,311,491)Pension plan administrative expenses (27,878) (21,527) (20,411) -Other changes (58,723) (112,440) (357,501) (1,371,053)Net change in plan fiduciary net position 3,784,534 1,026,204 357,924 1,154,492
Plan fiduciary net position - beginning 23,991,732 22,965,528 22,607,604 21,453,112Plan fiduciary net position - ending (b) 27,776,266$ 23,991,732$ 22,965,528$ 22,607,604$
Net pension liability - ending (a) - (b) 47,462,470$ 45,538,125$ 39,519,008$ 37,704,111$
Plan fiduciary net position as a percentage of the total pension liability 36.92% 34.51% 36.75% 37.48%Covered payroll 7,155,954$ 7,318,199$ 7,526,730$ 7,425,908$ Net pension liability as a percentage of covered payroll 663.26% 622.26% 525.05% 507.74%
Reporting fiscal year 2014 through 2009 information is not available.
(Measurement Date)
City of Flagstaff, ArizonaRequired Supplementary Information
Schedule of the Changes in Net Pension Liability and Related RatiosAgent Pension Plans - PSPRS Police
June 30, 2018
Reporting Fiscal Year
97

2018 2017 2016 2015(2017) (2016) (2015) (2014)
PSPRS FireTotal pension liability
Service cost 1,376,479$ 1,107,145$ 973,454$ 950,445$ Interest on the total pension liability 5,668,204 5,356,440 5,239,671 4,390,766 Changes of benefit terms 804,628 2,064,045 - 1,553,904
Differences between expected and actual experience in the measurement of the pension liability 193,670 669,848 52,497 1,431,974Changes of assumptions or other inputs 5,454,472 2,647,110 - 7,269,797Benefit payments, including refunds of employee contributions (5,180,329) (4,095,893) (5,594,036) (3,994,598)
8,317,124 7,748,695 671,586 11,602,28877,477,973 69,729,278 69,057,692 57,455,40485,795,097$ 77,477,973$ 69,729,278$ 69,057,692$
Net change in total pension liability Total pension liability - beginning Total pension liability - ending (a)
Plan fiduciary net positionContributions - employer 4,239,954$ 3,952,628$ 2,418,742$ 2,030,211$ Contributions - employee 703,312 669,429 732,850 525,878 Net investment income 3,290,746 160,712 963,491 3,407,667Benefit payments, including refunds of employee contributions (5,180,329) (4,095,893) (5,594,036) (3,994,598)Pension plan administrative expenses (29,518) (23,526) (23,873) -Other changes 12,535 (27,936) 48,864 (1,831,071)
Net change in plan fiduciary net position 3,036,700 635,414 (1,453,962) 138,087Plan fiduciary net position - beginning 26,471,364 25,835,950 27,289,912 27,151,825 Plan fiduciary net position - ending (b) 29,508,064$ 26,471,364$ 25,835,950$ 27,289,912$
Net pension liability - ending (a) - (b) 56,287,033$ 51,006,609$ 43,893,328$ 41,767,780$
Plan fiduciary net position as a percentage of the total pension liability 34.39% 34.17% 37.05% 39.52%Covered payroll 5,650,572$ 5,491,792$ 4,847,679$ 4,788,197$ Net pension liability as a percentage of covered payroll 996.13% 928.78% 905.45% 872.31%
Reporting fiscal year 2014 through 2009 information is not available.
(Measurement Date)
City of Flagstaff, ArizonaRequired Supplementary Information
Schedule of the Changes in Net Pension Liability and Related RatiosAgent Pension Plans - PSPRS Fire
June 30, 2018
Reporting Fiscal Year
98
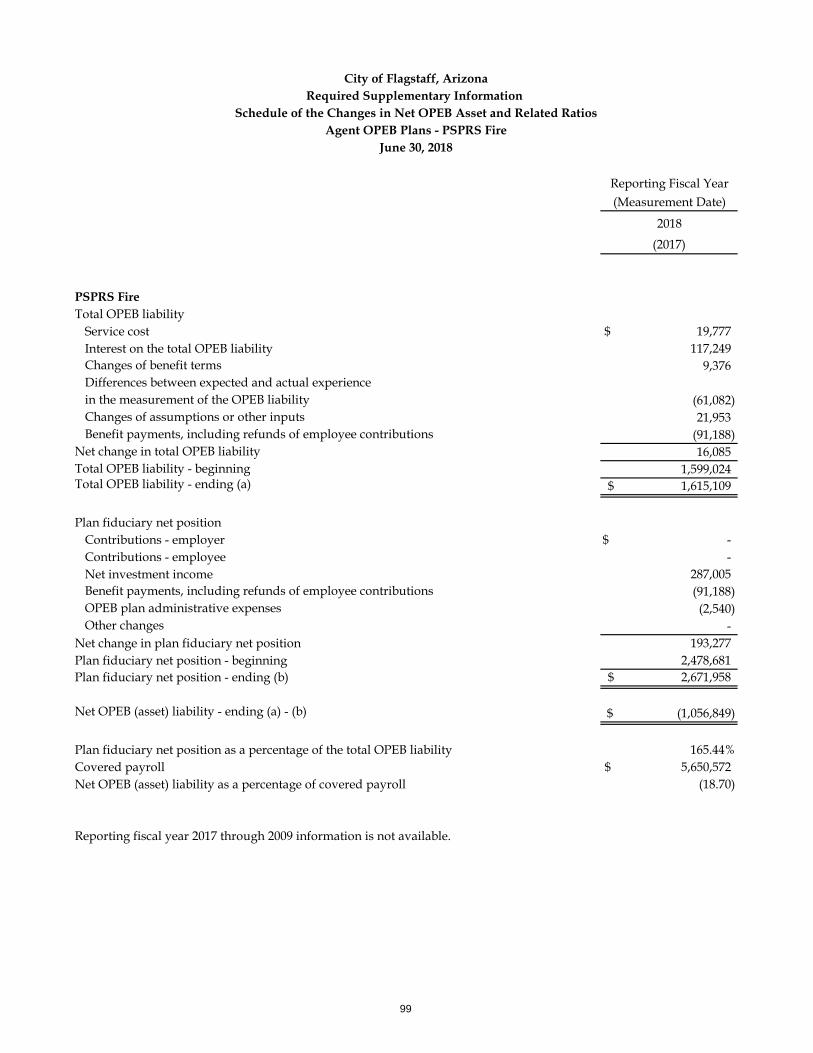
Reporting Fiscal Year(Measurement Date)
2018(2017)
PSPRS FireTotal OPEB liability
Service cost 19,777$ Interest on the total OPEB liability 117,249 Changes of benefit terms 9,376Differences between expected and actual experience in the measurement of the OPEB liability (61,082)Changes of assumptions or other inputs 21,953Benefit payments, including refunds of employee contributions (91,188)
Net change in total OPEB liability 16,085Total OPEB liability - beginning 1,599,024Total OPEB liability - ending (a) 1,615,109$
Plan fiduciary net positionContributions - employer -$ Contributions - employee - Net investment income 287,005Benefit payments, including refunds of employee contributions (91,188)OPEB plan administrative expenses (2,540)Other changes -
Net change in plan fiduciary net position 193,277Plan fiduciary net position - beginning 2,478,681 Plan fiduciary net position - ending (b) 2,671,958$
Net OPEB (asset) liability - ending (a) - (b) (1,056,849)$
Plan fiduciary net position as a percentage of the total OPEB liability 165.44%Covered payroll 5,650,572$ Net OPEB (asset) liability as a percentage of covered payroll (18.70)
Reporting fiscal year 2017 through 2009 information is not available.
City of Flagstaff, ArizonaRequired Supplementary Information
Schedule of the Changes in Net OPEB Asset and Related RatiosAgent OPEB Plans - PSPRS Fire
June 30, 2018
99
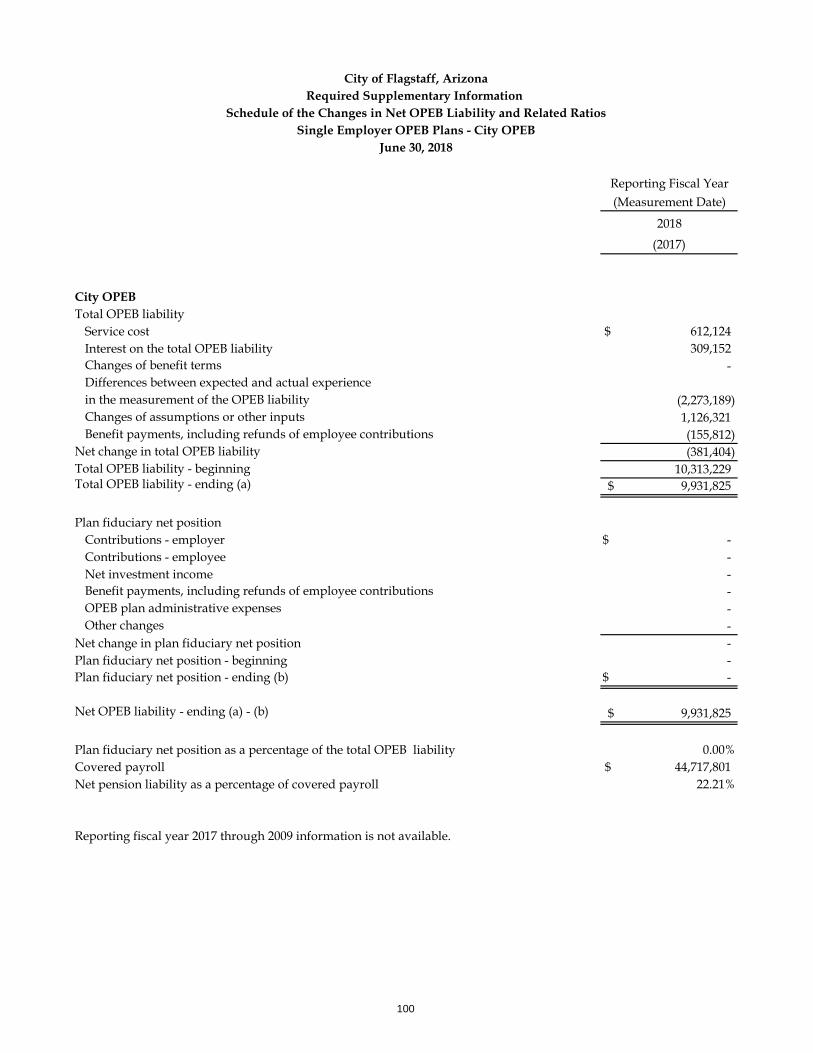
Reporting Fiscal Year(Measurement Date)
2018(2017)
City OPEBTotal OPEB liability
Service cost 612,124$ Interest on the total OPEB liability 309,152 Changes of benefit terms -Differences between expected and actual experience in the measurement of the OPEB liability (2,273,189)Changes of assumptions or other inputs 1,126,321Benefit payments, including refunds of employee contributions (155,812)
Net change in total OPEB liability (381,404)Total OPEB liability - beginning 10,313,229Total OPEB liability - ending (a) 9,931,825$
Plan fiduciary net positionContributions - employer -$ Contributions - employee - Net investment income -Benefit payments, including refunds of employee contributions -OPEB plan administrative expenses -Other changes -
Net change in plan fiduciary net position -Plan fiduciary net position - beginning - Plan fiduciary net position - ending (b) -$
Net OPEB liability - ending (a) - (b) 9,931,825$
Plan fiduciary net position as a percentage of the total OPEB liability 0.00%Covered payroll 44,717,801$ Net pension liability as a percentage of covered payroll 22.21%
Reporting fiscal year 2017 through 2009 information is not available.
City of Flagstaff, ArizonaRequired Supplementary Information
Schedule of the Changes in Net OPEB Liability and Related RatiosSingle Employer OPEB Plans - City OPEB
June 30, 2018
100
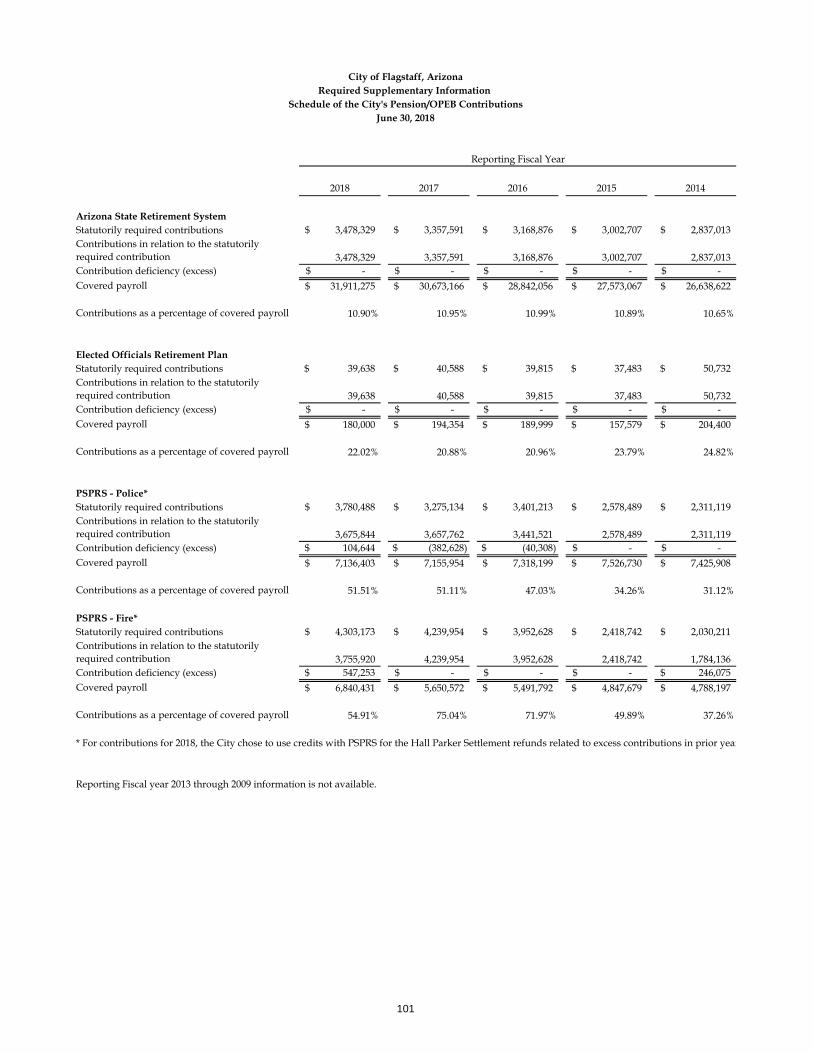
2018 2017 2016 2015 2014 Arizona State Retirement SystemStatutorily required contributions 3,478,329$ 3,357,591$ 3,168,876$ 3,002,707$ 2,837,013$ Contributions in relation to the statutorily required contribution 3,478,329 3,357,591 3,168,876 3,002,707 2,837,013 Contribution deficiency (excess) -$ -$ -$ -$ -$ Covered payroll 31,911,275$ 30,673,166$ 28,842,056$ 27,573,067$ 26,638,622$
Contributions as a percentage of covered payroll 10.90% 10.95% 10.99% 10.89% 10.65%
Elected Officials Retirement PlanStatutorily required contributions 39,638$ 40,588$ 39,815$ 37,483$ 50,732$ Contributions in relation to the statutorily required contribution 39,638 40,588 39,815 37,483 50,732 Contribution deficiency (excess) -$ -$ -$ -$ -$ Covered payroll 180,000$ 194,354$ 189,999$ 157,579$ 204,400$
Contributions as a percentage of covered payroll 22.02% 20.88% 20.96% 23.79% 24.82%
PSPRS - Police*Statutorily required contributions 3,780,488$ 3,275,134$ 3,401,213$ 2,578,489$ 2,311,119$ Contributions in relation to the statutorily required contribution 3,675,844 3,657,762 3,441,521 2,578,489 2,311,119 Contribution deficiency (excess) 104,644$ (382,628)$ (40,308)$ -$ -$ Covered payroll 7,136,403$ 7,155,954$ 7,318,199$ 7,526,730$ 7,425,908$
Contributions as a percentage of covered payroll 51.51% 51.11% 47.03% 34.26% 31.12%
PSPRS - Fire*Statutorily required contributions 4,303,173$ 4,239,954$ 3,952,628$ 2,418,742$ 2,030,211$ Contributions in relation to the statutorily required contribution 3,755,920 4,239,954 3,952,628 2,418,742 1,784,136 Contribution deficiency (excess) 547,253$ -$ -$ -$ 246,075$ Covered payroll 6,840,431$ 5,650,572$ 5,491,792$ 4,847,679$ 4,788,197$
Contributions as a percentage of covered payroll 54.91% 75.04% 71.97% 49.89% 37.26%
* For contributions for 2018, the City chose to use credits with PSPRS for the Hall Parker Settlement refunds related to excess contributions in prior year
Reporting Fiscal year 2013 through 2009 information is not available.
City of Flagstaff, ArizonaRequired Supplementary Information
Schedule of the City's Pension/OPEB ContributionsJune 30, 2018
Reporting Fiscal Year
101
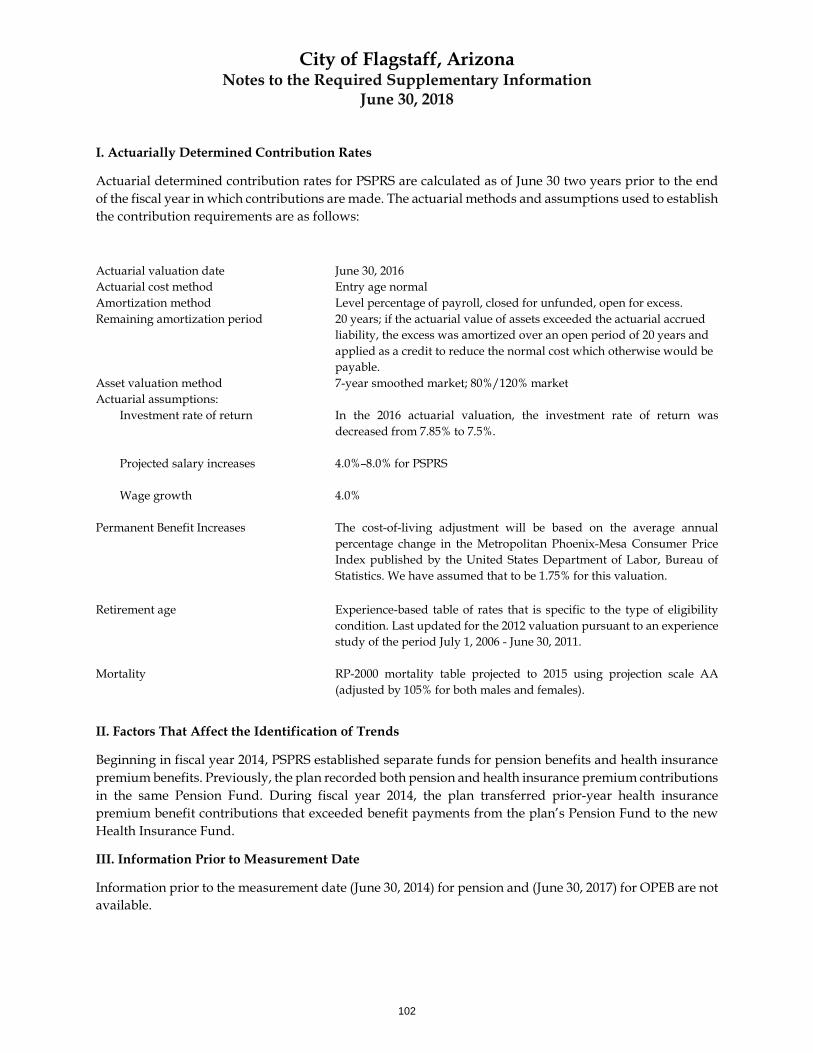
City of Flagstaff, Arizona Notes to the Required Supplementary Information
June 30, 2018
I. Actuarially Determined Contribution Rates
Actuarial determined contribution rates for PSPRS are calculated as of June 30 two years prior to the end of the fiscal year in which contributions are made. The actuarial methods and assumptions used to establish the contribution requirements are as follows:
Actuarial valuation date June 30, 2016 Actuarial cost method Entry age normal Amortization method Level percentage of payroll, closed for unfunded, open for excess. Remaining amortization period 20 years; if the actuarial value of assets exceeded the actuarial accrued
liability, the excess was amortized over an open period of 20 years and applied as a credit to reduce the normal cost which otherwise would be payable.
Asset valuation method 7-year smoothed market; 80%/120% marketActuarial assumptions:
Investment rate of return In the 2016 actuarial valuation, the investment rate of return was decreased from 7.85% to 7.5%.
Projected salary increases 4.0%–8.0% for PSPRS
Wage growth 4.0%
Permanent Benefit Increases The cost-of-living adjustment will be based on the average annual percentage change in the Metropolitan Phoenix-Mesa Consumer Price Index published by the United States Department of Labor, Bureau of Statistics. We have assumed that to be 1.75% for this valuation.
Retirement age Experience-based table of rates that is specific to the type of eligibility condition. Last updated for the 2012 valuation pursuant to an experience study of the period July 1, 2006 - June 30, 2011.
Mortality RP-2000 mortality table projected to 2015 using projection scale AA (adjusted by 105% for both males and females).
II. Factors That Affect the Identification of Trends
Beginning in fiscal year 2014, PSPRS established separate funds for pension benefits and health insurance premium benefits. Previously, the plan recorded both pension and health insurance premium contributions in the same Pension Fund. During fiscal year 2014, the plan transferred prior-year health insurance premium benefit contributions that exceeded benefit payments from the plan’s Pension Fund to the new Health Insurance Fund.
III. Information Prior to Measurement Date
Information prior to the measurement date (June 30, 2014) for pension and (June 30, 2017) for OPEB are not available.
102
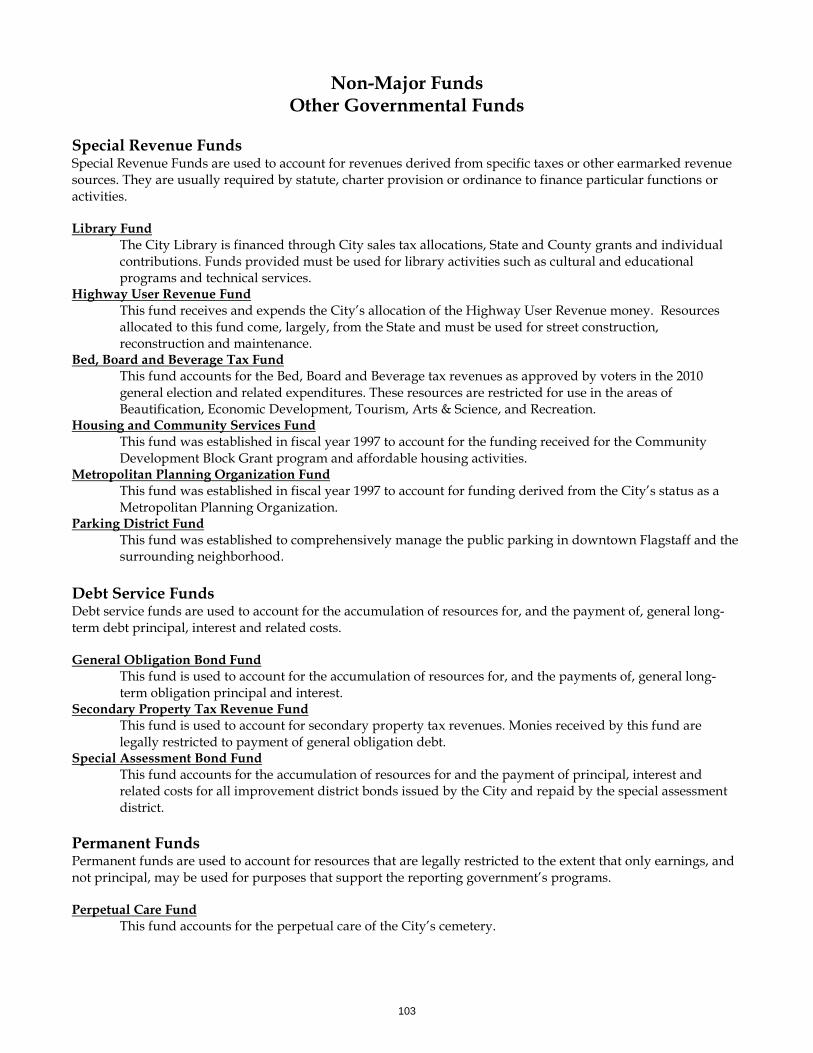
Non-Major Funds Other Governmental Funds
Special Revenue Funds Special Revenue Funds are used to account for revenues derived from specific taxes or other earmarked revenue sources. They are usually required by statute, charter provision or ordinance to finance particular functions or activities.
Library Fund The City Library is financed through City sales tax allocations, State and County grants and individual contributions. Funds provided must be used for library activities such as cultural and educational programs and technical services.
Highway User Revenue Fund This fund receives and expends the City’s allocation of the Highway User Revenue money. Resources allocated to this fund come, largely, from the State and must be used for street construction, reconstruction and maintenance.
Bed, Board and Beverage Tax Fund This fund accounts for the Bed, Board and Beverage tax revenues as approved by voters in the 2010 general election and related expenditures. These resources are restricted for use in the areas of Beautification, Economic Development, Tourism, Arts & Science, and Recreation.
Housing and Community Services Fund This fund was established in fiscal year 1997 to account for the funding received for the Community Development Block Grant program and affordable housing activities.
Metropolitan Planning Organization Fund This fund was established in fiscal year 1997 to account for funding derived from the City’s status as a Metropolitan Planning Organization.
Parking District Fund This fund was established to comprehensively manage the public parking in downtown Flagstaff and the surrounding neighborhood.
Debt Service Funds Debt service funds are used to account for the accumulation of resources for, and the payment of, general long-term debt principal, interest and related costs.
General Obligation Bond Fund This fund is used to account for the accumulation of resources for, and the payments of, general long-term obligation principal and interest.
Secondary Property Tax Revenue Fund This fund is used to account for secondary property tax revenues. Monies received by this fund are legally restricted to payment of general obligation debt.
Special Assessment Bond Fund This fund accounts for the accumulation of resources for and the payment of principal, interest and related costs for all improvement district bonds issued by the City and repaid by the special assessment district.
Permanent Funds Permanent funds are used to account for resources that are legally restricted to the extent that only earnings, and not principal, may be used for purposes that support the reporting government’s programs.
Perpetual Care Fund This fund accounts for the perpetual care of the City’s cemetery.
103
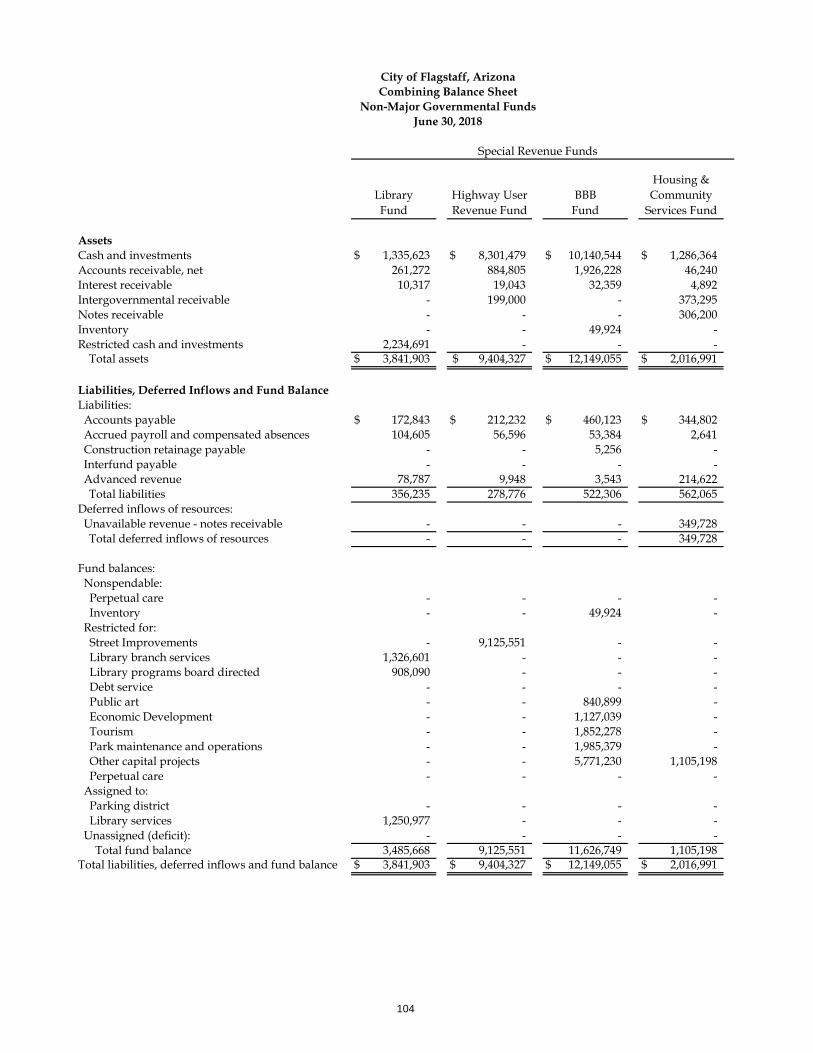
Library Fund
Highway User Revenue Fund
BBB Fund
Housing & Community
Services Fund AssetsCash and investments 1,335,623$ 8,301,479$ 10,140,544$ 1,286,364$ Accounts receivable, net 261,272 884,805 1,926,228 46,240Interest receivable 10,317 19,043 32,359 4,892Intergovernmental receivable - 199,000 - 373,295Notes receivable - - - 306,200Inventory - - 49,924 -Restricted cash and investments 2,234,691 - - -
Total assets 3,841,903$ 9,404,327$ 12,149,055$ 2,016,991$
Liabilities, Deferred Inflows and Fund BalanceLiabilities: Accounts payable 172,843$ 212,232$ 460,123$ 344,802$ Accrued payroll and compensated absences 104,605 56,596 53,384 2,641 Construction retainage payable - - 5,256 - Interfund payable - - - - Advanced revenue 78,787 9,948 3,543 214,622
Total liabilities 356,235 278,776 522,306 562,065Deferred inflows of resources: Unavailable revenue - notes receivable - - - 349,728
Total deferred inflows of resources - - - 349,728
Fund balances: Nonspendable: Perpetual care - - - - Inventory - - 49,924 - Restricted for: Street Improvements - 9,125,551 - - Library branch services 1,326,601 - - - Library programs board directed 908,090 - - - Debt service - - - - Public art - - 840,899 - Economic Development - - 1,127,039 - Tourism - - 1,852,278 - Park maintenance and operations - - 1,985,379 - Other capital projects - - 5,771,230 1,105,198 Perpetual care - - - - Assigned to: Parking district - - - - Library services 1,250,977 - - - Unassigned (deficit): - - - - Total fund balance 3,485,668 9,125,551 11,626,749 1,105,198Total liabilities, deferred inflows and fund balance 3,841,903$ 9,404,327$ 12,149,055$ 2,016,991$
City of Flagstaff, ArizonaCombining Balance Sheet
Non-Major Governmental FundsJune 30, 2018
Special Revenue Funds
104
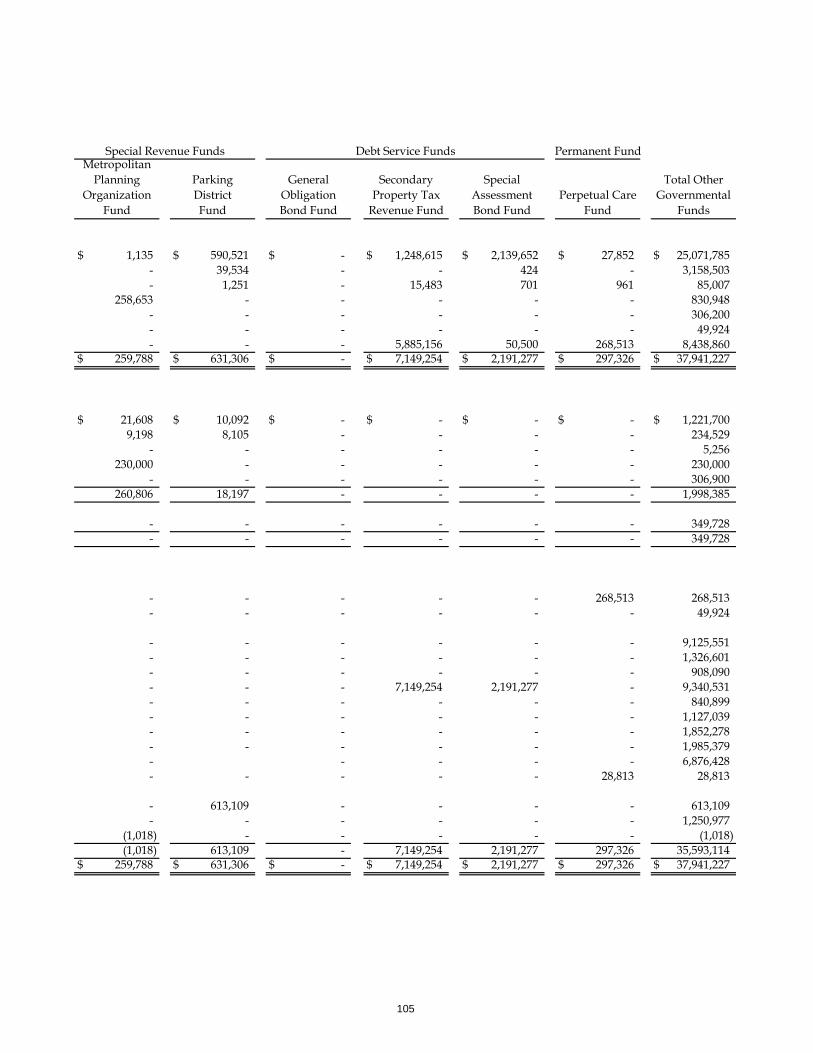
Permanent FundMetropolitan
Planning Organization
Fund
Parking DistrictFund
General Obligation Bond Fund
Secondary Property Tax
Revenue Fund
Special Assessment Bond Fund
Perpetual CareFund
Total Other Governmental
Funds
1,135$ 590,521$ -$ 1,248,615$ 2,139,652$ 27,852$ 25,071,785$ - 39,534 - - 424 - 3,158,503 - 1,251 - 15,483 701 961 85,007
258,653 - - - - - 830,948 - - - - - - 306,200 - - - - - - 49,924 - - - 5,885,156 50,500 268,513 8,438,860
259,788$ 631,306$ -$ 7,149,254$ 2,191,277$ 297,326$ 37,941,227$
21,608$ 10,092$ -$ -$ -$ -$ 1,221,700$ 9,198 8,105 - - - - 234,529
- - - - - - 5,256230,000 - - - - - 230,000
- - - - - - 306,900260,806 18,197 - - - - 1,998,385
- - - - - - 349,728- - - - - - 349,728
- - - - - 268,513 268,513- - - - - - 49,924
- - - - - - 9,125,551- - - - - - 1,326,601- - - - - - 908,090- - - 7,149,254 2,191,277 - 9,340,531- - - - - - 840,899- - - - - - 1,127,039- - - - - - 1,852,278- - - - - - 1,985,379- - - - - 6,876,428- - - - - 28,813 28,813
- 613,109 - - - - 613,109- - - - - - 1,250,977
(1,018) - - - - - (1,018)(1,018) 613,109 - 7,149,254 2,191,277 297,326 35,593,114
259,788$ 631,306$ -$ 7,149,254$ 2,191,277$ 297,326$ 37,941,227$
Debt Service Funds
Special Revenue Funds
105
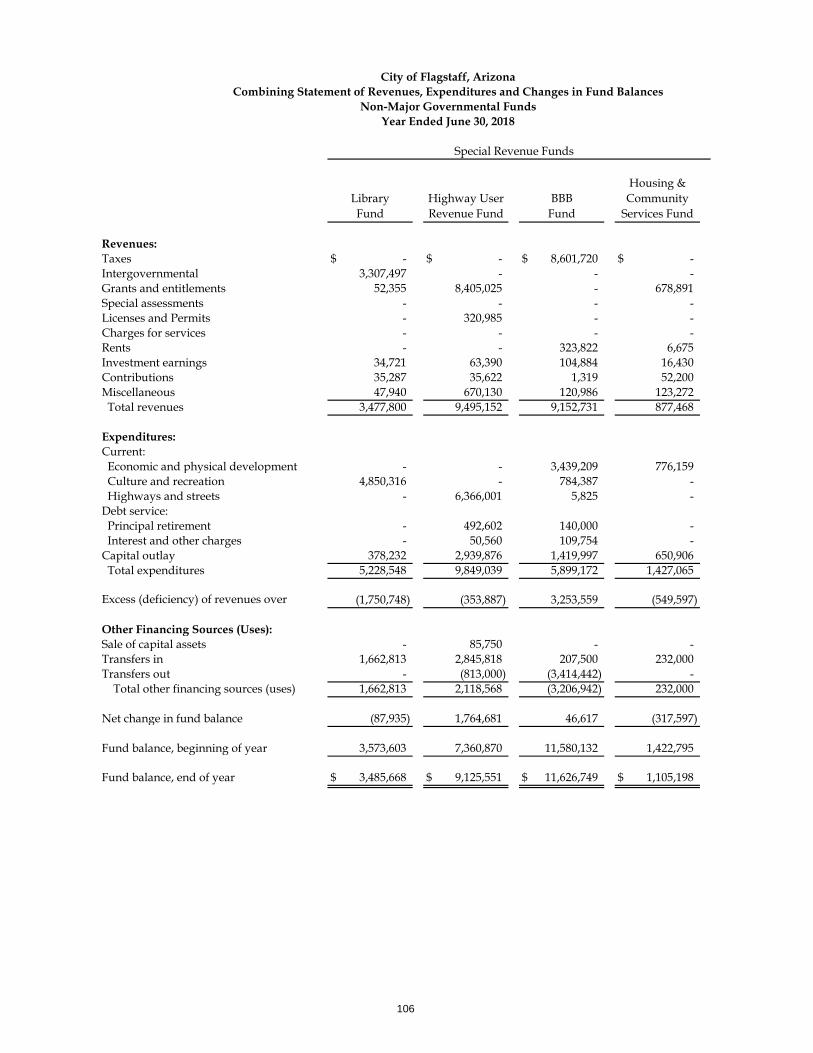
Library Fund
Highway User Revenue Fund
BBB Fund
Housing & Community
Services Fund
Revenues:Taxes -$ -$ 8,601,720$ -$ Intergovernmental 3,307,497 - - -Grants and entitlements 52,355 8,405,025 - 678,891Special assessments - - - -Licenses and Permits - 320,985 - -Charges for services - - - -Rents - - 323,822 6,675Investment earnings 34,721 63,390 104,884 16,430Contributions 35,287 35,622 1,319 52,200Miscellaneous 47,940 670,130 120,986 123,272 Total revenues 3,477,800 9,495,152 9,152,731 877,468
Expenditures:Current: Economic and physical development - - 3,439,209 776,159 Culture and recreation 4,850,316 - 784,387 - Highways and streets - 6,366,001 5,825 -Debt service: Principal retirement - 492,602 140,000 - Interest and other charges - 50,560 109,754 -Capital outlay 378,232 2,939,876 1,419,997 650,906 Total expenditures 5,228,548 9,849,039 5,899,172 1,427,065
Excess (deficiency) of revenues over (1,750,748) (353,887) 3,253,559 (549,597)
Other Financing Sources (Uses):Sale of capital assets - 85,750 - -Transfers in 1,662,813 2,845,818 207,500 232,000Transfers out - (813,000) (3,414,442) - Total other financing sources (uses) 1,662,813 2,118,568 (3,206,942) 232,000
Net change in fund balance (87,935) 1,764,681 46,617 (317,597)
Fund balance, beginning of year 3,573,603 7,360,870 11,580,132 1,422,795
Fund balance, end of year 3,485,668$ 9,125,551$ 11,626,749$ 1,105,198$
City of Flagstaff, ArizonaCombining Statement of Revenues, Expenditures and Changes in Fund Balances
Non-Major Governmental FundsYear Ended June 30, 2018
Special Revenue Funds
106
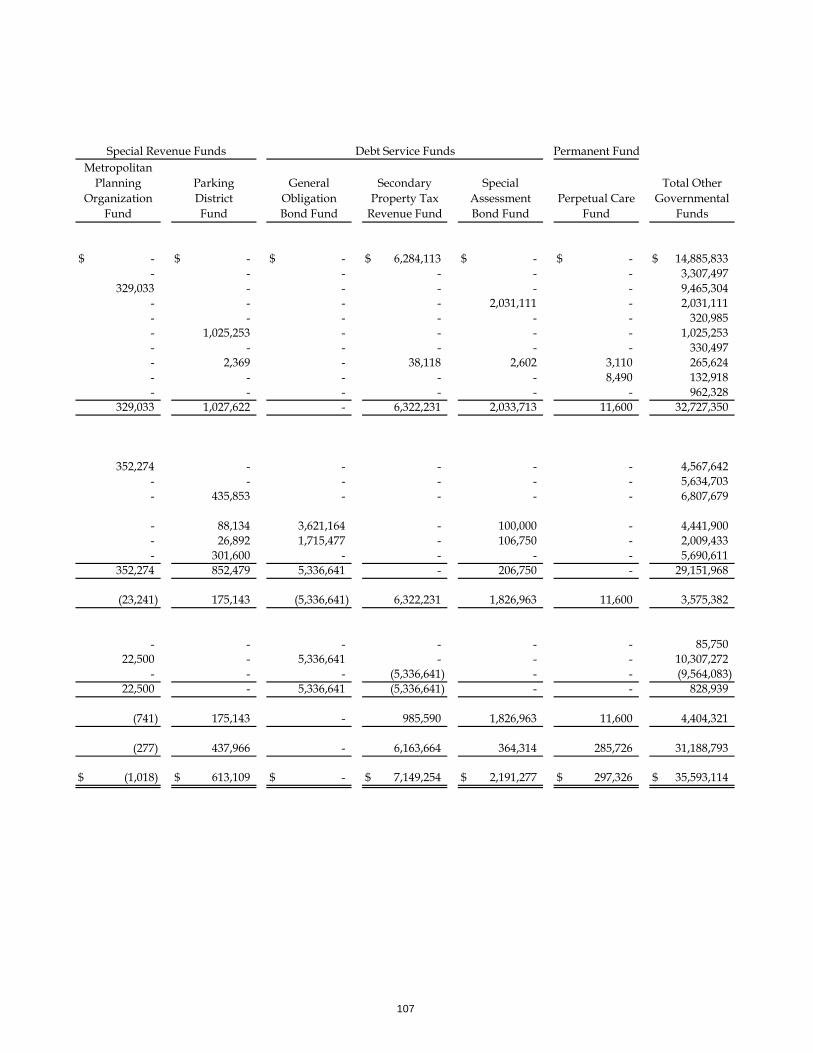
Permanent FundMetropolitan
Planning Organization
Fund
Parking DistrictFund
General Obligation Bond Fund
Secondary Property Tax
Revenue Fund
Special Assessment Bond Fund
Perpetual CareFund
Total Other Governmental
Funds
-$ -$ -$ 6,284,113$ -$ -$ 14,885,833$ - - - - - - 3,307,497
329,033 - - - - - 9,465,304- - - - 2,031,111 - 2,031,111- - - - - - 320,985- 1,025,253 - - - - 1,025,253- - - - - - 330,497- 2,369 - 38,118 2,602 3,110 265,624- - - - - 8,490 132,918- - - - - - 962,328
329,033 1,027,622 - 6,322,231 2,033,713 11,600 32,727,350
352,274 - - - - - 4,567,642- - - - - - 5,634,703- 435,853 - - - - 6,807,679
- 88,134 3,621,164 - 100,000 - 4,441,900- 26,892 1,715,477 - 106,750 - 2,009,433- 301,600 - - - - 5,690,611
352,274 852,479 5,336,641 - 206,750 - 29,151,968
(23,241) 175,143 (5,336,641) 6,322,231 1,826,963 11,600 3,575,382
- - - - - - 85,75022,500 - 5,336,641 - - - 10,307,272
- - - (5,336,641) - - (9,564,083)22,500 - 5,336,641 (5,336,641) - - 828,939
(741) 175,143 - 985,590 1,826,963 11,600 4,404,321
(277) 437,966 - 6,163,664 364,314 285,726 31,188,793
(1,018)$ 613,109$ -$ 7,149,254$ 2,191,277$ 297,326$ 35,593,114$
Debt Service FundsSpecial Revenue Funds
107
Non-Major Funds Other Proprietary Funds
Enterprise Fund Enterprise Funds are used to account for operations that provide services to the general public for a fee. Housing Authority Fund
This fund accounts for low income rental assistance along with federal housing programs such as low income public housing and voucher programs that enhance this funds ability to provide services.
Airport Fund
This fund accounts for the construction, operations and maintenance of the City airport.
108
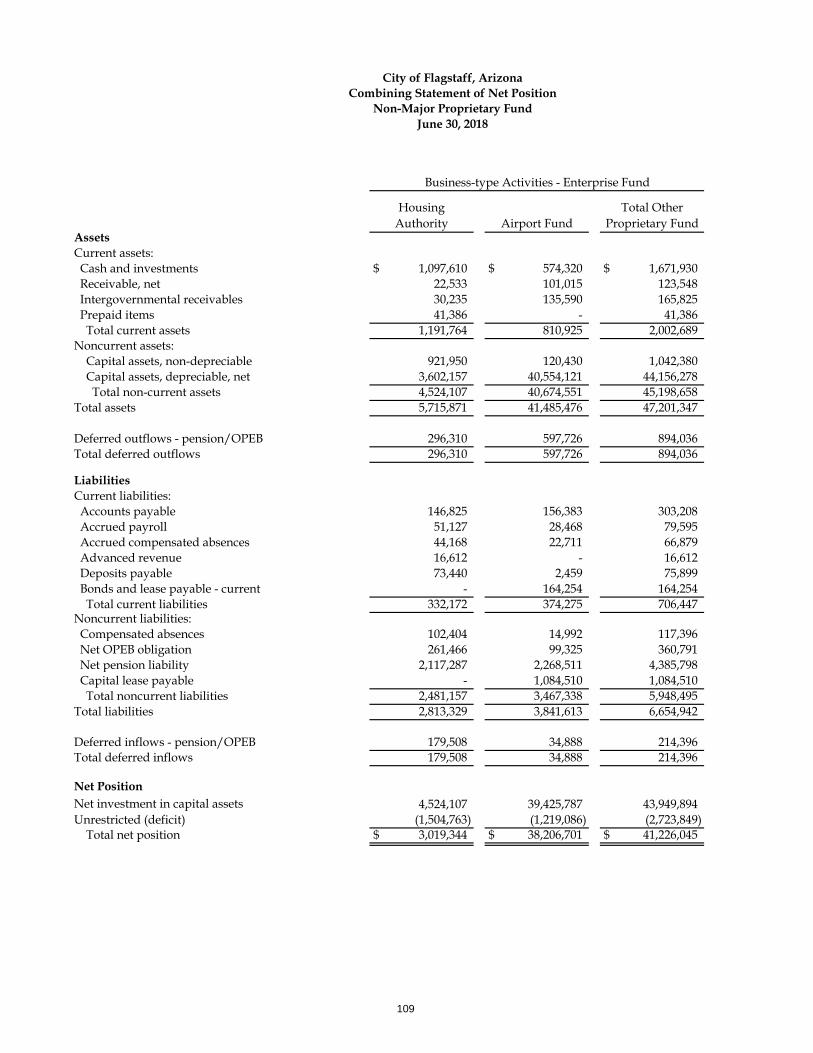
Housing Authority Airport Fund
Total Other Proprietary Fund
AssetsCurrent assets: Cash and investments 1,097,610$ 574,320$ 1,671,930$ Receivable, net 22,533 101,015 123,548 Intergovernmental receivables 30,235 135,590 165,825 Prepaid items 41,386 - 41,386 Total current assets 1,191,764 810,925 2,002,689Noncurrent assets: Capital assets, non-depreciable 921,950 120,430 1,042,380 Capital assets, depreciable, net 3,602,157 40,554,121 44,156,278 Total non-current assets 4,524,107 40,674,551 45,198,658Total assets 5,715,871 41,485,476 47,201,347
Deferred outflows - pension/OPEB 296,310 597,726 894,036Total deferred outflows 296,310 597,726 894,036
LiabilitiesCurrent liabilities: Accounts payable 146,825 156,383 303,208 Accrued payroll 51,127 28,468 79,595 Accrued compensated absences 44,168 22,711 66,879 Advanced revenue 16,612 - 16,612 Deposits payable 73,440 2,459 75,899 Bonds and lease payable - current - 164,254 164,254 Total current liabilities 332,172 374,275 706,447Noncurrent liabilities: Compensated absences 102,404 14,992 117,396 Net OPEB obligation 261,466 99,325 360,791 Net pension liability 2,117,287 2,268,511 4,385,798 Capital lease payable - 1,084,510 1,084,510 Total noncurrent liabilities 2,481,157 3,467,338 5,948,495Total liabilities 2,813,329 3,841,613 6,654,942
Deferred inflows - pension/OPEB 179,508 34,888 214,396Total deferred inflows 179,508 34,888 214,396
Net PositionNet investment in capital assets 4,524,107 39,425,787 43,949,894Unrestricted (deficit) (1,504,763) (1,219,086) (2,723,849) Total net position 3,019,344$ 38,206,701$ 41,226,045$
Business-type Activities - Enterprise Fund
City of Flagstaff, ArizonaCombining Statement of Net Position
Non-Major Proprietary FundJune 30, 2018
109
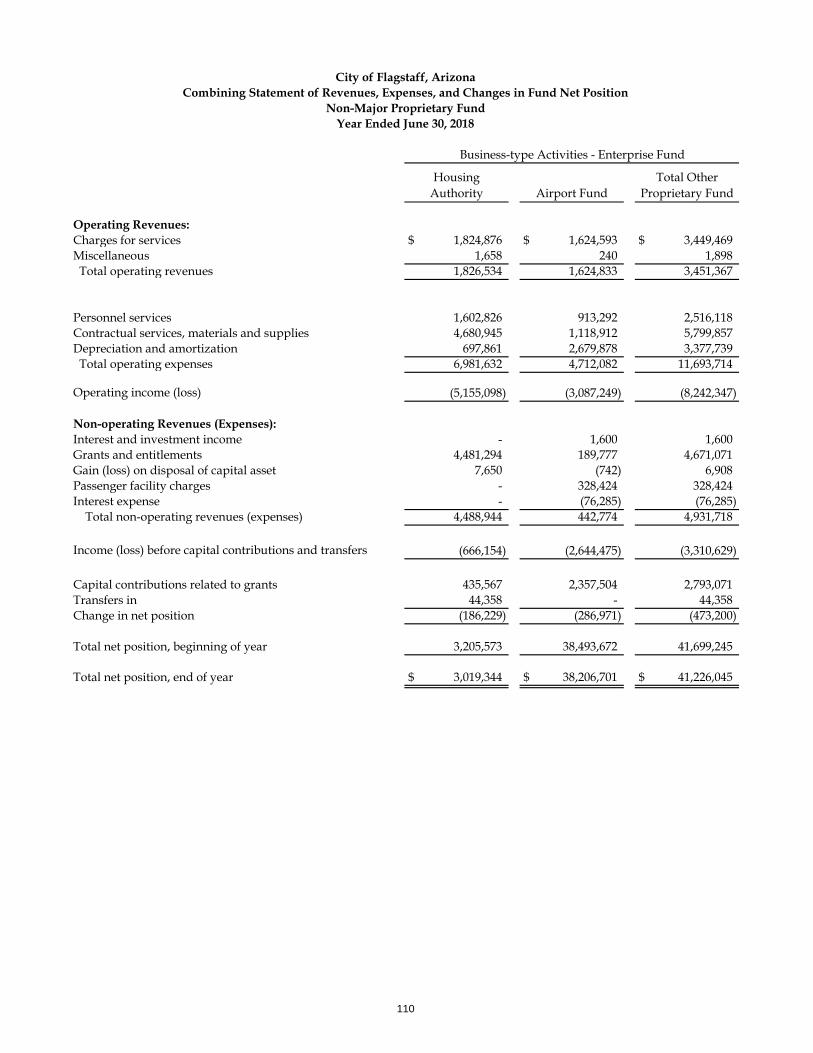
Housing Authority Airport Fund
Total Other Proprietary Fund
Operating Revenues:Charges for services 1,824,876$ 1,624,593$ 3,449,469$ Miscellaneous 1,658 240 1,898 Total operating revenues 1,826,534 1,624,833 3,451,367
Personnel services 1,602,826 913,292 2,516,118Contractual services, materials and supplies 4,680,945 1,118,912 5,799,857Depreciation and amortization 697,861 2,679,878 3,377,739 Total operating expenses 6,981,632 4,712,082 11,693,714
Operating income (loss) (5,155,098) (3,087,249) (8,242,347)
Non-operating Revenues (Expenses):Interest and investment income - 1,600 1,600Grants and entitlements 4,481,294 189,777 4,671,071Gain (loss) on disposal of capital asset 7,650 (742) 6,908Passenger facility charges - 328,424 328,424Interest expense - (76,285) (76,285) Total non-operating revenues (expenses) 4,488,944 442,774 4,931,718
Income (loss) before capital contributions and transfers (666,154) (2,644,475) (3,310,629)
Capital contributions related to grants 435,567 2,357,504 2,793,071Transfers in 44,358 - 44,358Change in net position (186,229) (286,971) (473,200)
Total net position, beginning of year 3,205,573 38,493,672 41,699,245
Total net position, end of year 3,019,344$ 38,206,701$ 41,226,045$
Business-type Activities - Enterprise Fund
City of Flagstaff, ArizonaCombining Statement of Revenues, Expenses, and Changes in Fund Net Position
Non-Major Proprietary FundYear Ended June 30, 2018
110
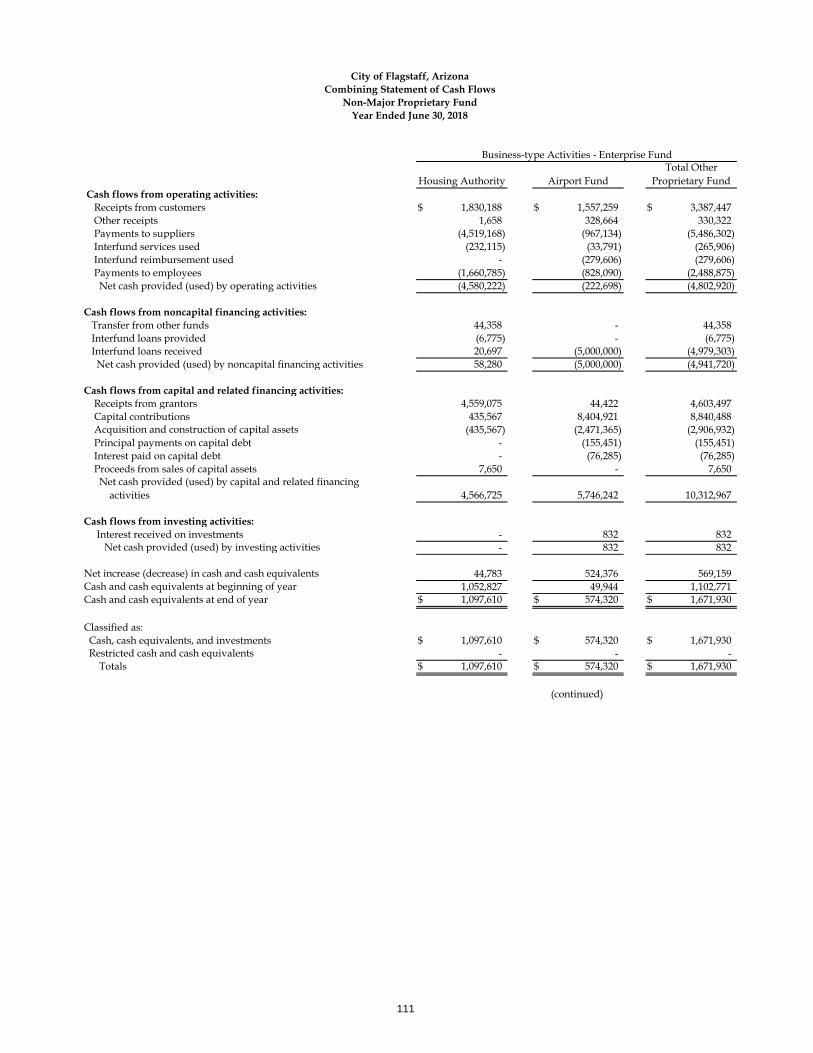
Housing Authority Airport FundTotal Other
Proprietary Fund Cash flows from operating activities: Receipts from customers 1,830,188$ 1,557,259$ 3,387,447$ Other receipts 1,658 328,664 330,322 Payments to suppliers (4,519,168) (967,134) (5,486,302) Interfund services used (232,115) (33,791) (265,906) Interfund reimbursement used - (279,606) (279,606) Payments to employees (1,660,785) (828,090) (2,488,875) Net cash provided (used) by operating activities (4,580,222) (222,698) (4,802,920)
Cash flows from noncapital financing activities: Transfer from other funds 44,358 - 44,358 Interfund loans provided (6,775) - (6,775) Interfund loans received 20,697 (5,000,000) (4,979,303) Net cash provided (used) by noncapital financing activities 58,280 (5,000,000) (4,941,720)
Cash flows from capital and related financing activities: Receipts from grantors 4,559,075 44,422 4,603,497 Capital contributions 435,567 8,404,921 8,840,488 Acquisition and construction of capital assets (435,567) (2,471,365) (2,906,932) Principal payments on capital debt - (155,451) (155,451) Interest paid on capital debt - (76,285) (76,285) Proceeds from sales of capital assets 7,650 - 7,650 Net cash provided (used) by capital and related financing activities 4,566,725 5,746,242 10,312,967
Cash flows from investing activities: Interest received on investments - 832 832 Net cash provided (used) by investing activities - 832 832
Net increase (decrease) in cash and cash equivalents 44,783 524,376 569,159Cash and cash equivalents at beginning of year 1,052,827 49,944 1,102,771Cash and cash equivalents at end of year 1,097,610$ 574,320$ 1,671,930$
Classified as: Cash, cash equivalents, and investments 1,097,610$ 574,320$ 1,671,930$ Restricted cash and cash equivalents - - - Totals 1,097,610$ 574,320$ 1,671,930$
Year Ended June 30, 2018
(continued)
City of Flagstaff, ArizonaCombining Statement of Cash Flows
Non-Major Proprietary Fund
Business-type Activities - Enterprise Fund
111
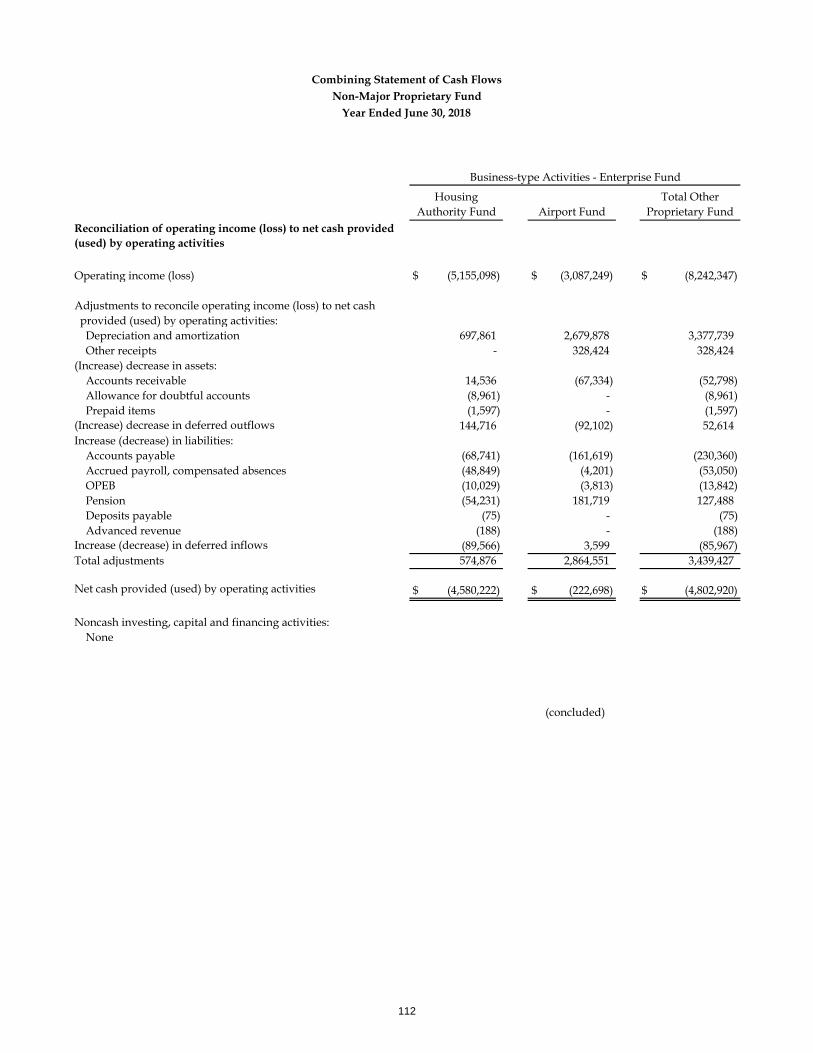
Housing Authority Fund Airport Fund
Total Other Proprietary Fund
Reconciliation of operating income (loss) to net cash provided (used) by operating activities
Operating income (loss) (5,155,098)$ (3,087,249)$ (8,242,347)$
Adjustments to reconcile operating income (loss) to net cash provided (used) by operating activities: Depreciation and amortization 697,861 2,679,878 3,377,739 Other receipts - 328,424 328,424(Increase) decrease in assets: Accounts receivable 14,536 (67,334) (52,798) Allowance for doubtful accounts (8,961) - (8,961) Prepaid items (1,597) - (1,597)(Increase) decrease in deferred outflows 144,716 (92,102) 52,614Increase (decrease) in liabilities: Accounts payable (68,741) (161,619) (230,360) Accrued payroll, compensated absences (48,849) (4,201) (53,050) OPEB (10,029) (3,813) (13,842) Pension (54,231) 181,719 127,488 Deposits payable (75) - (75) Advanced revenue (188) - (188)Increase (decrease) in deferred inflows (89,566) 3,599 (85,967)Total adjustments 574,876 2,864,551 3,439,427
Net cash provided (used) by operating activities (4,580,222)$ (222,698)$ (4,802,920)$
Noncash investing, capital and financing activities: None
(concluded)
Combining Statement of Cash FlowsNon-Major Proprietary Fund
Year Ended June 30, 2018
Business-type Activities - Enterprise Fund
112
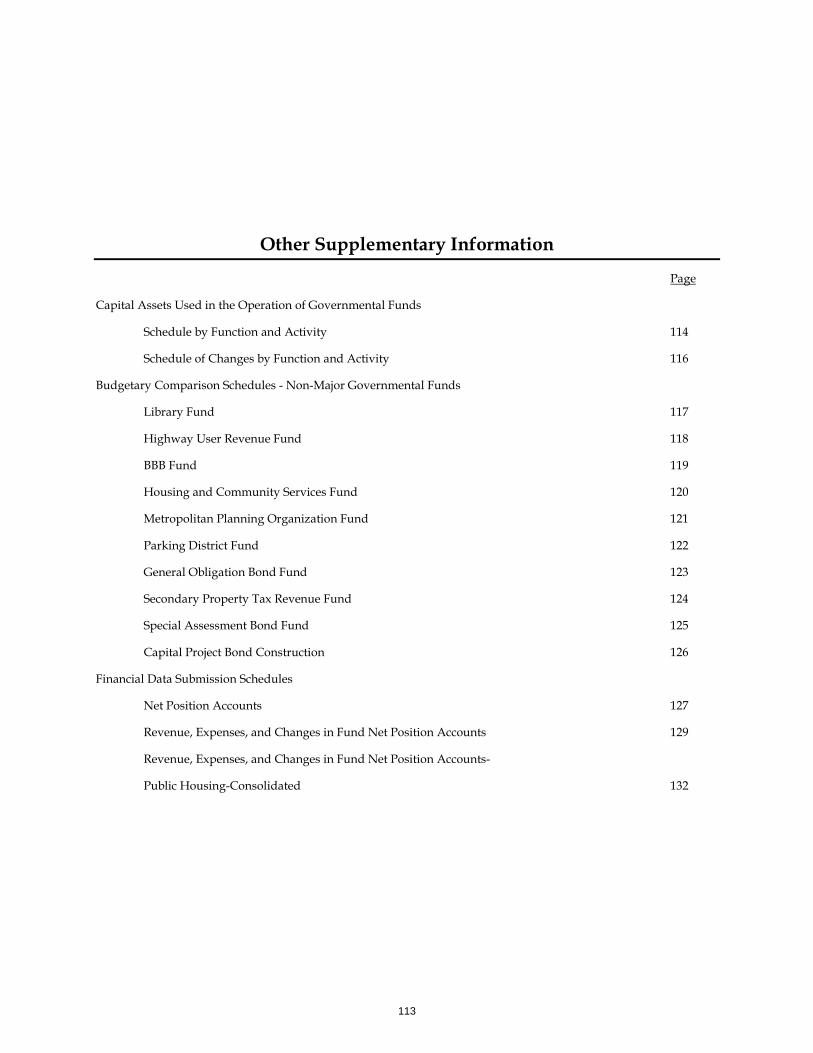
Other Supplementary Information
Page
Capital Assets Used in the Operation of Governmental Funds
Schedule by Function and Activity 114
Schedule of Changes by Function and Activity 116
Budgetary Comparison Schedules - Non-Major Governmental Funds
Library Fund 117
Highway User Revenue Fund 118
BBB Fund 119
Housing and Community Services Fund 120
Metropolitan Planning Organization Fund 121
Parking District Fund 122
General Obligation Bond Fund 123
Secondary Property Tax Revenue Fund 124
Special Assessment Bond Fund 125
Capital Project Bond Construction 126
Financial Data Submission Schedules
Net Position Accounts 127
Revenue, Expenses, and Changes in Fund Net Position Accounts 129
Revenue, Expenses, and Changes in Fund Net Position Accounts-
Public Housing-Consolidated 132
113
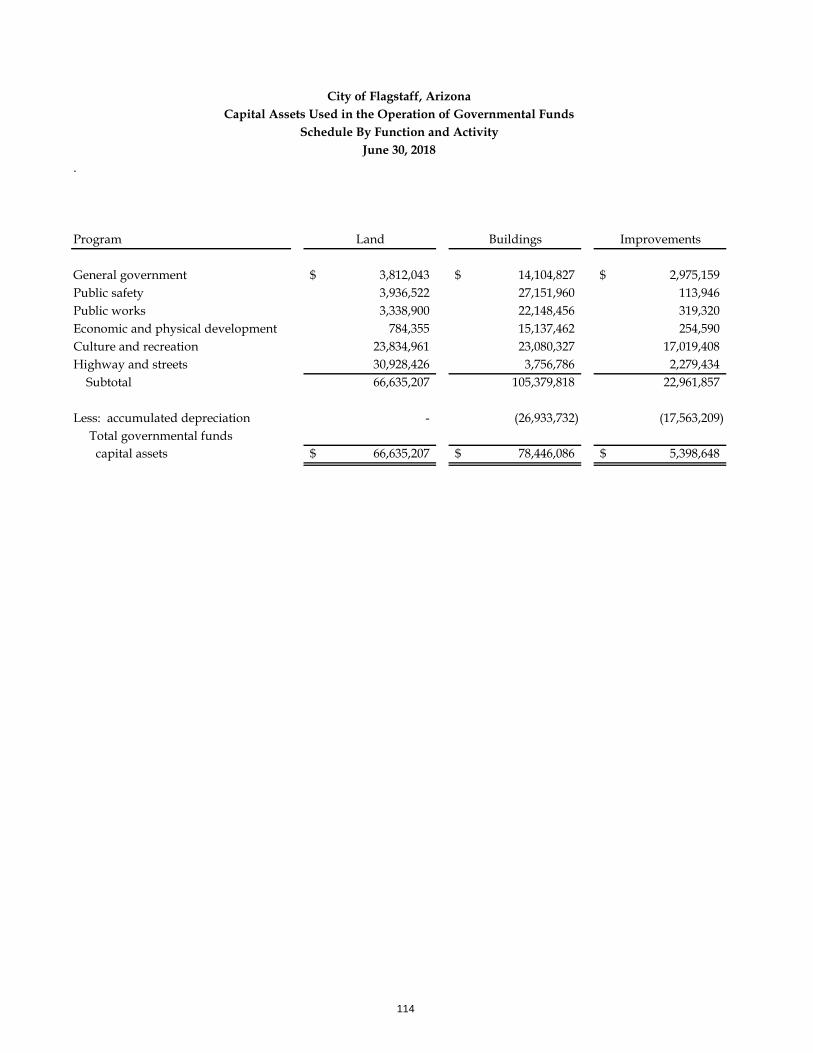
.
Program Land Buildings Improvements
General government 3,812,043$ 14,104,827$ 2,975,159$ Public safety 3,936,522 27,151,960 113,946 Public works 3,338,900 22,148,456 319,320 Economic and physical development 784,355 15,137,462 254,590 Culture and recreation 23,834,961 23,080,327 17,019,408 Highway and streets 30,928,426 3,756,786 2,279,434 Subtotal 66,635,207 105,379,818 22,961,857
Less: accumulated depreciation - (26,933,732) (17,563,209) Total governmental funds capital assets 66,635,207$ 78,446,086$ 5,398,648$
City of Flagstaff, ArizonaCapital Assets Used in the Operation of Governmental Funds
Schedule By Function and ActivityJune 30, 2018
114
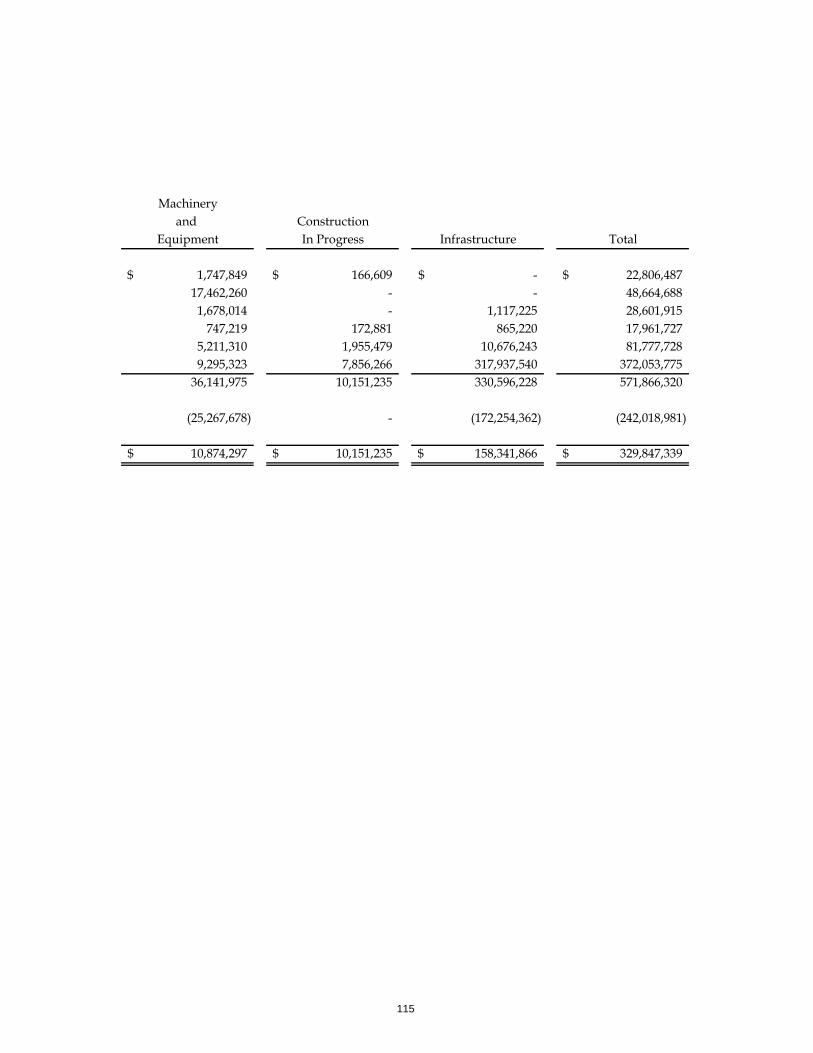
Machineryand Construction
Equipment In Progress Infrastructure Total
1,747,849$ 166,609$ -$ 22,806,487$ 17,462,260 - - 48,664,688 1,678,014 - 1,117,225 28,601,915
747,219 172,881 865,220 17,961,727 5,211,310 1,955,479 10,676,243 81,777,728 9,295,323 7,856,266 317,937,540 372,053,775
36,141,975 10,151,235 330,596,228 571,866,320
(25,267,678) - (172,254,362) (242,018,981)
10,874,297$ 10,151,235$ 158,341,866$ 329,847,339$
115
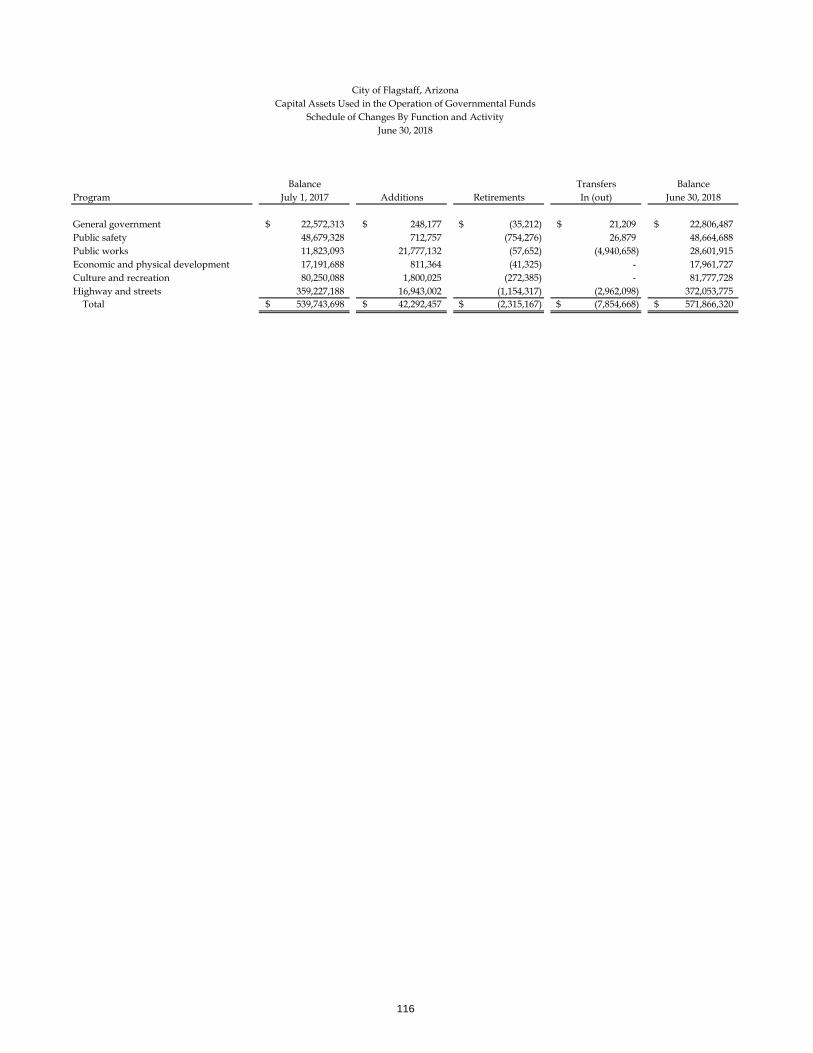
Balance Transfers BalanceProgram July 1, 2017 Additions Retirements In (out) June 30, 2018
General government 22,572,313$ 248,177$ (35,212)$ 21,209$ 22,806,487$ Public safety 48,679,328 712,757 (754,276) 26,879 48,664,688 Public works 11,823,093 21,777,132 (57,652) (4,940,658) 28,601,915 Economic and physical development 17,191,688 811,364 (41,325) - 17,961,727 Culture and recreation 80,250,088 1,800,025 (272,385) - 81,777,728 Highway and streets 359,227,188 16,943,002 (1,154,317) (2,962,098) 372,053,775 Total 539,743,698$ 42,292,457$ (2,315,167)$ (7,854,668)$ 571,866,320$
City of Flagstaff, ArizonaCapital Assets Used in the Operation of Governmental Funds
Schedule of Changes By Function and ActivityJune 30, 2018
116
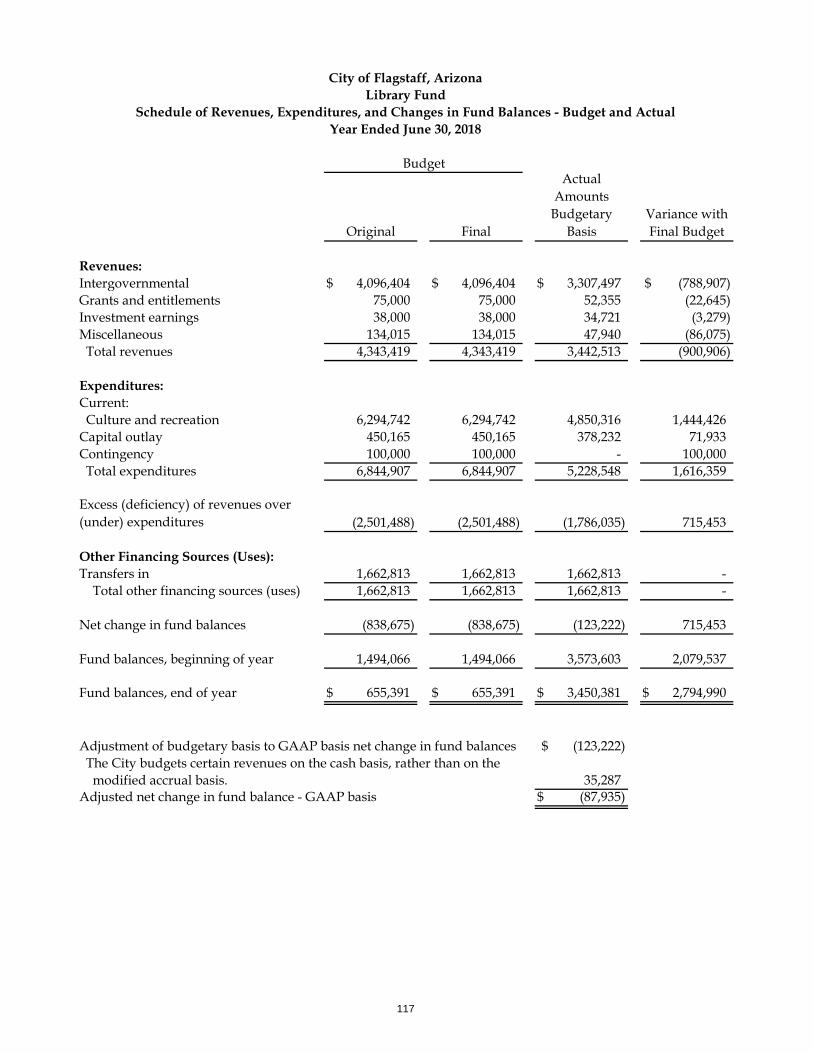
Original Final
Actual Amounts
Budgetary Basis
Variance with Final Budget
Revenues:Intergovernmental 4,096,404$ 4,096,404$ 3,307,497$ (788,907)$ Grants and entitlements 75,000 75,000 52,355 (22,645)Investment earnings 38,000 38,000 34,721 (3,279)Miscellaneous 134,015 134,015 47,940 (86,075) Total revenues 4,343,419 4,343,419 3,442,513 (900,906)
Expenditures:Current: Culture and recreation 6,294,742 6,294,742 4,850,316 1,444,426Capital outlay 450,165 450,165 378,232 71,933Contingency 100,000 100,000 - 100,000 Total expenditures 6,844,907 6,844,907 5,228,548 1,616,359
Excess (deficiency) of revenues over (under) expenditures (2,501,488) (2,501,488) (1,786,035) 715,453
Other Financing Sources (Uses):Transfers in 1,662,813 1,662,813 1,662,813 - Total other financing sources (uses) 1,662,813 1,662,813 1,662,813 -
Net change in fund balances (838,675) (838,675) (123,222) 715,453
Fund balances, beginning of year 1,494,066 1,494,066 3,573,603 2,079,537
Fund balances, end of year 655,391$ 655,391$ 3,450,381$ 2,794,990$
Adjustment of budgetary basis to GAAP basis net change in fund balances (123,222)$ The City budgets certain revenues on the cash basis, rather than on the modified accrual basis. 35,287 Adjusted net change in fund balance - GAAP basis (87,935)$
Budget
City of Flagstaff, ArizonaLibrary Fund
Schedule of Revenues, Expenditures, and Changes in Fund Balances - Budget and ActualYear Ended June 30, 2018
117
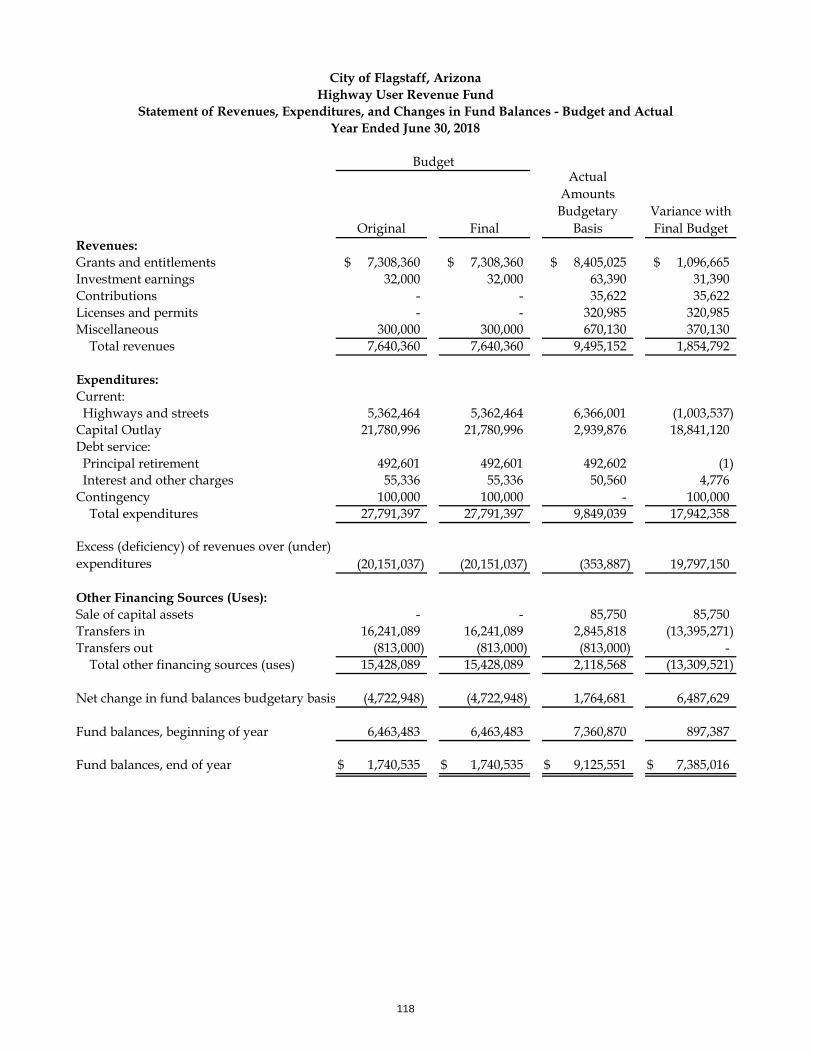
Original Final
Actual Amounts Budgetary
BasisVariance with Final Budget
Revenues:Grants and entitlements 7,308,360$ 7,308,360$ 8,405,025$ 1,096,665$ Investment earnings 32,000 32,000 63,390 31,390Contributions - - 35,622 35,622Licenses and permits - - 320,985 320,985Miscellaneous 300,000 300,000 670,130 370,130 Total revenues 7,640,360 7,640,360 9,495,152 1,854,792
Expenditures:Current: Highways and streets 5,362,464 5,362,464 6,366,001 (1,003,537)Capital Outlay 21,780,996 21,780,996 2,939,876 18,841,120Debt service: Principal retirement 492,601 492,601 492,602 (1) Interest and other charges 55,336 55,336 50,560 4,776Contingency 100,000 100,000 - 100,000 Total expenditures 27,791,397 27,791,397 9,849,039 17,942,358
Excess (deficiency) of revenues over (under) expenditures (20,151,037) (20,151,037) (353,887) 19,797,150
Other Financing Sources (Uses):Sale of capital assets - - 85,750 85,750Transfers in 16,241,089 16,241,089 2,845,818 (13,395,271)Transfers out (813,000) (813,000) (813,000) - Total other financing sources (uses) 15,428,089 15,428,089 2,118,568 (13,309,521)
Net change in fund balances budgetary basis (4,722,948) (4,722,948) 1,764,681 6,487,629
Fund balances, beginning of year 6,463,483 6,463,483 7,360,870 897,387
Fund balances, end of year 1,740,535$ 1,740,535$ 9,125,551$ 7,385,016$
Budget
City of Flagstaff, ArizonaHighway User Revenue Fund
Statement of Revenues, Expenditures, and Changes in Fund Balances - Budget and ActualYear Ended June 30, 2018
118
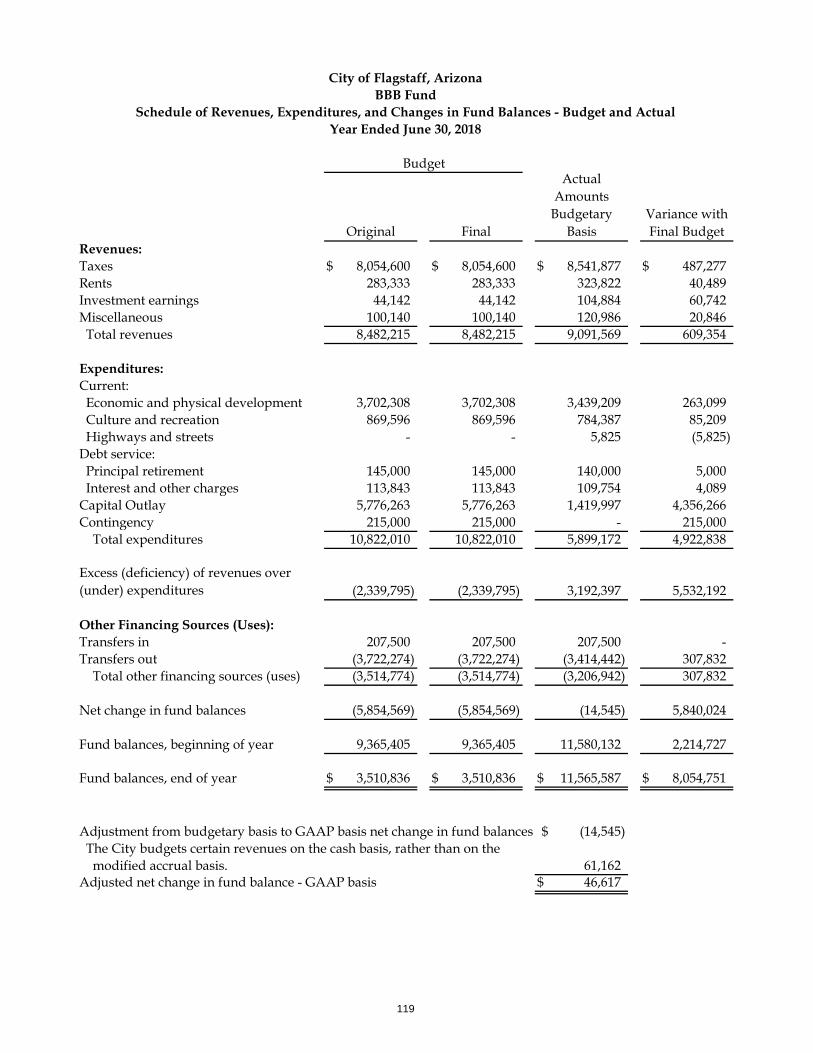
Original Final
Actual Amounts
Budgetary Basis
Variance with Final Budget
Revenues:Taxes 8,054,600$ 8,054,600$ 8,541,877$ 487,277$ Rents 283,333 283,333 323,822 40,489Investment earnings 44,142 44,142 104,884 60,742Miscellaneous 100,140 100,140 120,986 20,846 Total revenues 8,482,215 8,482,215 9,091,569 609,354
Expenditures:Current: Economic and physical development 3,702,308 3,702,308 3,439,209 263,099 Culture and recreation 869,596 869,596 784,387 85,209 Highways and streets - - 5,825 (5,825)Debt service: Principal retirement 145,000 145,000 140,000 5,000 Interest and other charges 113,843 113,843 109,754 4,089Capital Outlay 5,776,263 5,776,263 1,419,997 4,356,266Contingency 215,000 215,000 - 215,000 Total expenditures 10,822,010 10,822,010 5,899,172 4,922,838
Excess (deficiency) of revenues over (under) expenditures (2,339,795) (2,339,795) 3,192,397 5,532,192
Other Financing Sources (Uses):Transfers in 207,500 207,500 207,500 -Transfers out (3,722,274) (3,722,274) (3,414,442) 307,832 Total other financing sources (uses) (3,514,774) (3,514,774) (3,206,942) 307,832
Net change in fund balances (5,854,569) (5,854,569) (14,545) 5,840,024
Fund balances, beginning of year 9,365,405 9,365,405 11,580,132 2,214,727
Fund balances, end of year 3,510,836$ 3,510,836$ 11,565,587$ 8,054,751$
Adjustment from budgetary basis to GAAP basis net change in fund balances (14,545)$ The City budgets certain revenues on the cash basis, rather than on the modified accrual basis. 61,162 Adjusted net change in fund balance - GAAP basis 46,617$
Budget
City of Flagstaff, ArizonaBBB Fund
Schedule of Revenues, Expenditures, and Changes in Fund Balances - Budget and ActualYear Ended June 30, 2018
119
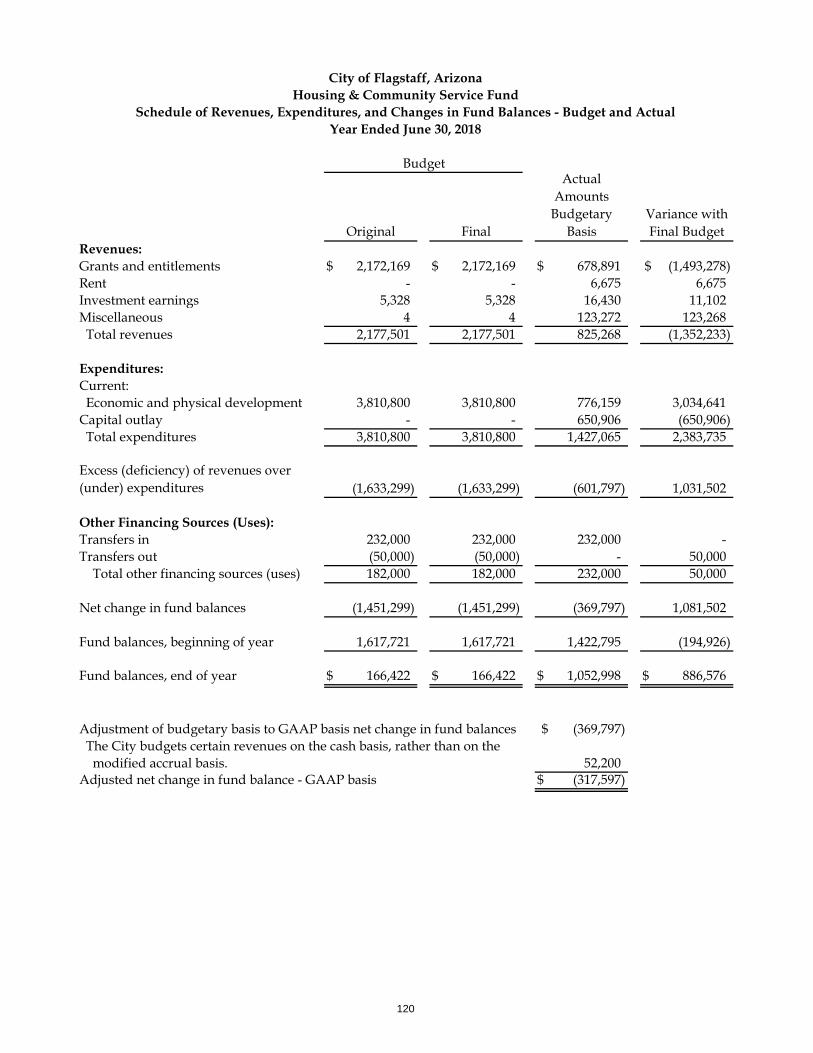
Original Final
Actual Amounts
Budgetary Basis
Variance with Final Budget
Revenues:Grants and entitlements 2,172,169$ 2,172,169$ 678,891$ (1,493,278)$ Rent - - 6,675 6,675Investment earnings 5,328 5,328 16,430 11,102Miscellaneous 4 4 123,272 123,268 Total revenues 2,177,501 2,177,501 825,268 (1,352,233)
Expenditures:Current: Economic and physical development 3,810,800 3,810,800 776,159 3,034,641Capital outlay - - 650,906 (650,906) Total expenditures 3,810,800 3,810,800 1,427,065 2,383,735
Excess (deficiency) of revenues over (under) expenditures (1,633,299) (1,633,299) (601,797) 1,031,502
Other Financing Sources (Uses):Transfers in 232,000 232,000 232,000 -Transfers out (50,000) (50,000) - 50,000 Total other financing sources (uses) 182,000 182,000 232,000 50,000
Net change in fund balances (1,451,299) (1,451,299) (369,797) 1,081,502
Fund balances, beginning of year 1,617,721 1,617,721 1,422,795 (194,926)
Fund balances, end of year 166,422$ 166,422$ 1,052,998$ 886,576$
Adjustment of budgetary basis to GAAP basis net change in fund balances (369,797)$ The City budgets certain revenues on the cash basis, rather than on the modified accrual basis. 52,200 Adjusted net change in fund balance - GAAP basis (317,597)$
Budget
City of Flagstaff, ArizonaHousing & Community Service Fund
Schedule of Revenues, Expenditures, and Changes in Fund Balances - Budget and ActualYear Ended June 30, 2018
120
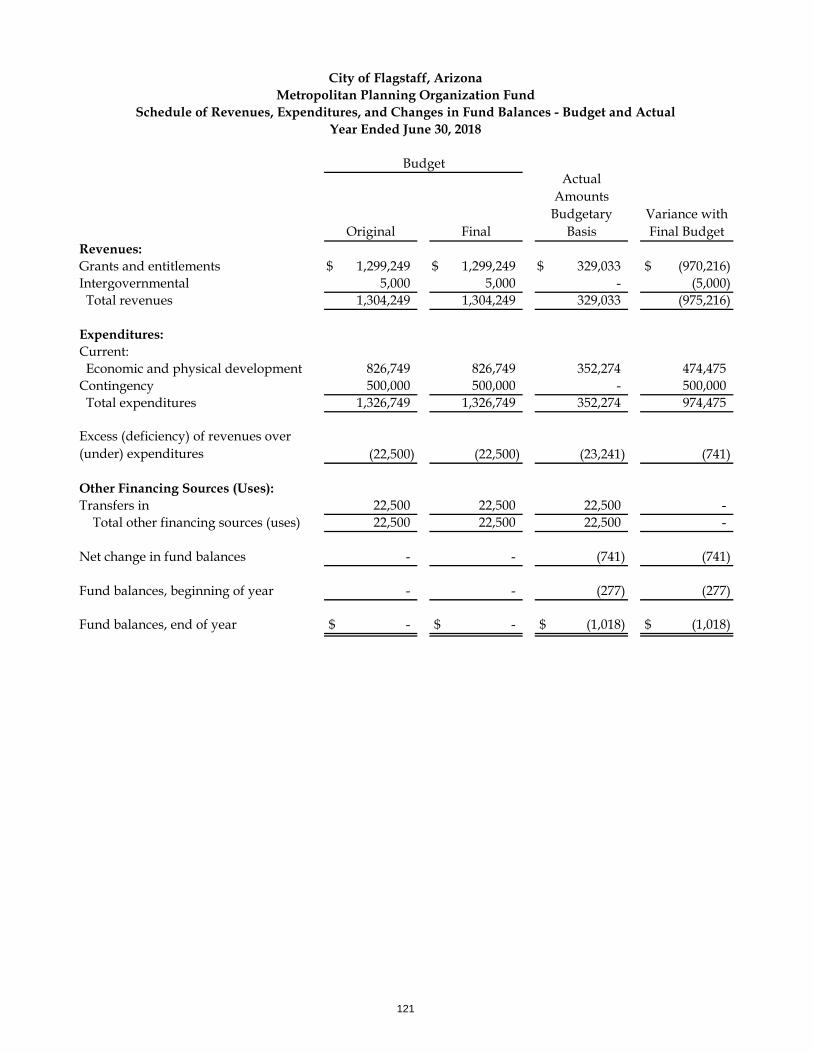
Original Final
Actual Amounts
Budgetary Basis
Variance with Final Budget
Revenues:Grants and entitlements 1,299,249$ 1,299,249$ 329,033$ (970,216)$ Intergovernmental 5,000 5,000 - (5,000) Total revenues 1,304,249 1,304,249 329,033 (975,216)
Expenditures:Current: Economic and physical development 826,749 826,749 352,274 474,475Contingency 500,000 500,000 - 500,000 Total expenditures 1,326,749 1,326,749 352,274 974,475
Excess (deficiency) of revenues over (under) expenditures (22,500) (22,500) (23,241) (741)
Other Financing Sources (Uses):Transfers in 22,500 22,500 22,500 - Total other financing sources (uses) 22,500 22,500 22,500 -
Net change in fund balances - - (741) (741)
Fund balances, beginning of year - - (277) (277)
Fund balances, end of year -$ -$ (1,018)$ (1,018)$
Budget
City of Flagstaff, ArizonaMetropolitan Planning Organization Fund
Schedule of Revenues, Expenditures, and Changes in Fund Balances - Budget and ActualYear Ended June 30, 2018
121
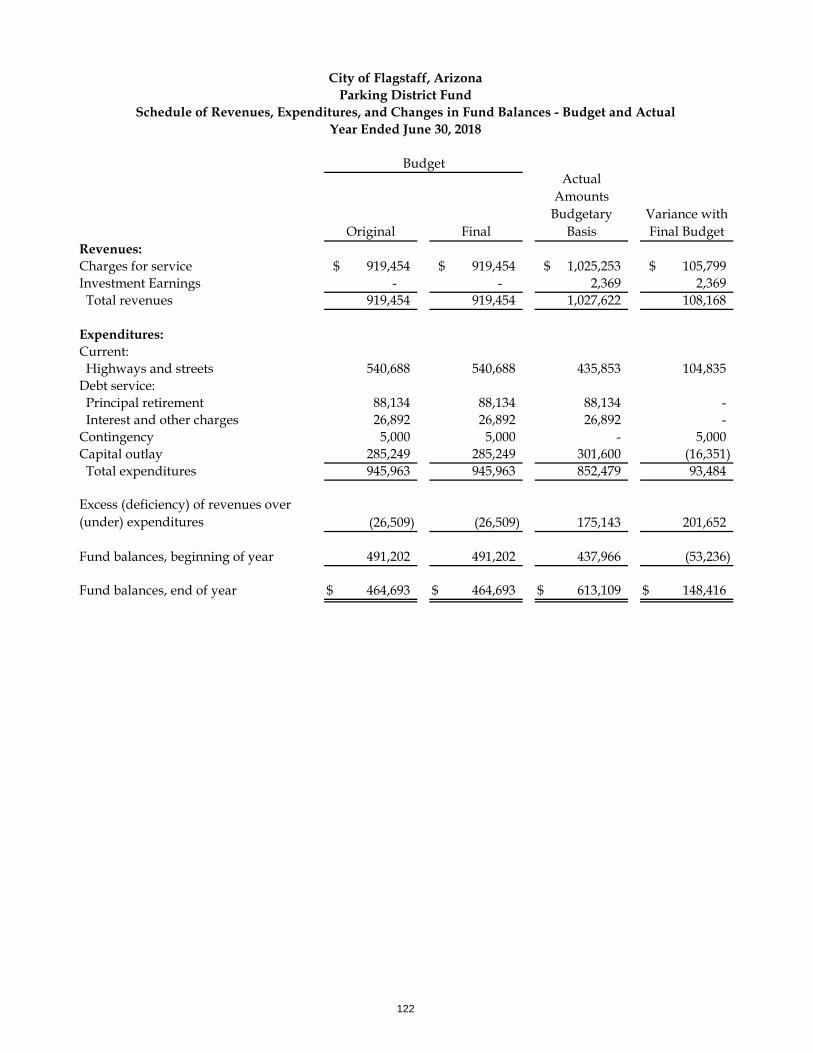
Original Final
Actual Amounts
Budgetary Basis
Variance with Final Budget
Revenues:Charges for service 919,454$ 919,454$ 1,025,253$ 105,799$ Investment Earnings - - 2,369 2,369 Total revenues 919,454 919,454 1,027,622 108,168
Expenditures:Current: Highways and streets 540,688 540,688 435,853 104,835Debt service: Principal retirement 88,134 88,134 88,134 - Interest and other charges 26,892 26,892 26,892 -Contingency 5,000 5,000 - 5,000Capital outlay 285,249 285,249 301,600 (16,351) Total expenditures 945,963 945,963 852,479 93,484
Excess (deficiency) of revenues over (under) expenditures (26,509) (26,509) 175,143 201,652
Fund balances, beginning of year 491,202 491,202 437,966 (53,236)
Fund balances, end of year 464,693$ 464,693$ 613,109$ 148,416$
Budget
City of Flagstaff, ArizonaParking District Fund
Schedule of Revenues, Expenditures, and Changes in Fund Balances - Budget and ActualYear Ended June 30, 2018
122
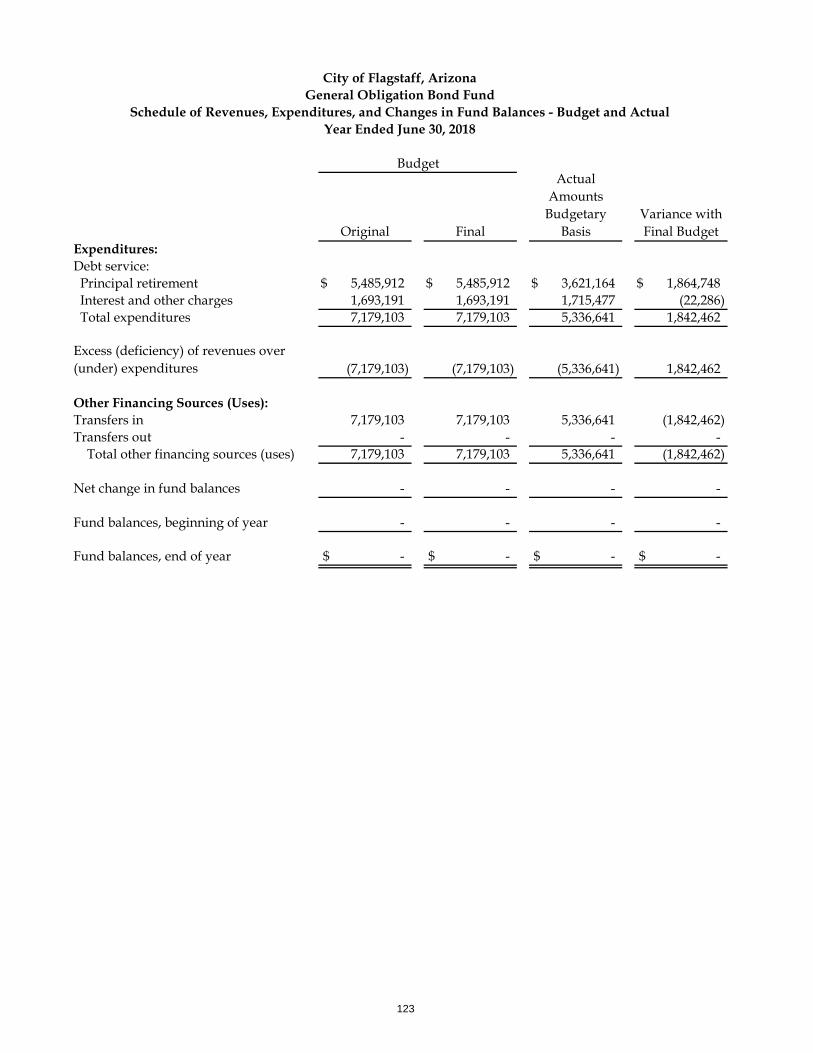
Original Final
Actual Amounts
Budgetary Basis
Variance with Final Budget
Expenditures:Debt service: Principal retirement 5,485,912$ 5,485,912$ 3,621,164$ 1,864,748$ Interest and other charges 1,693,191 1,693,191 1,715,477 (22,286) Total expenditures 7,179,103 7,179,103 5,336,641 1,842,462
Excess (deficiency) of revenues over (under) expenditures (7,179,103) (7,179,103) (5,336,641) 1,842,462
Other Financing Sources (Uses):Transfers in 7,179,103 7,179,103 5,336,641 (1,842,462)Transfers out - - - - Total other financing sources (uses) 7,179,103 7,179,103 5,336,641 (1,842,462)
Net change in fund balances - - - -
Fund balances, beginning of year - - - -
Fund balances, end of year -$ -$ -$ -$
Budget
City of Flagstaff, ArizonaGeneral Obligation Bond Fund
Schedule of Revenues, Expenditures, and Changes in Fund Balances - Budget and ActualYear Ended June 30, 2018
123
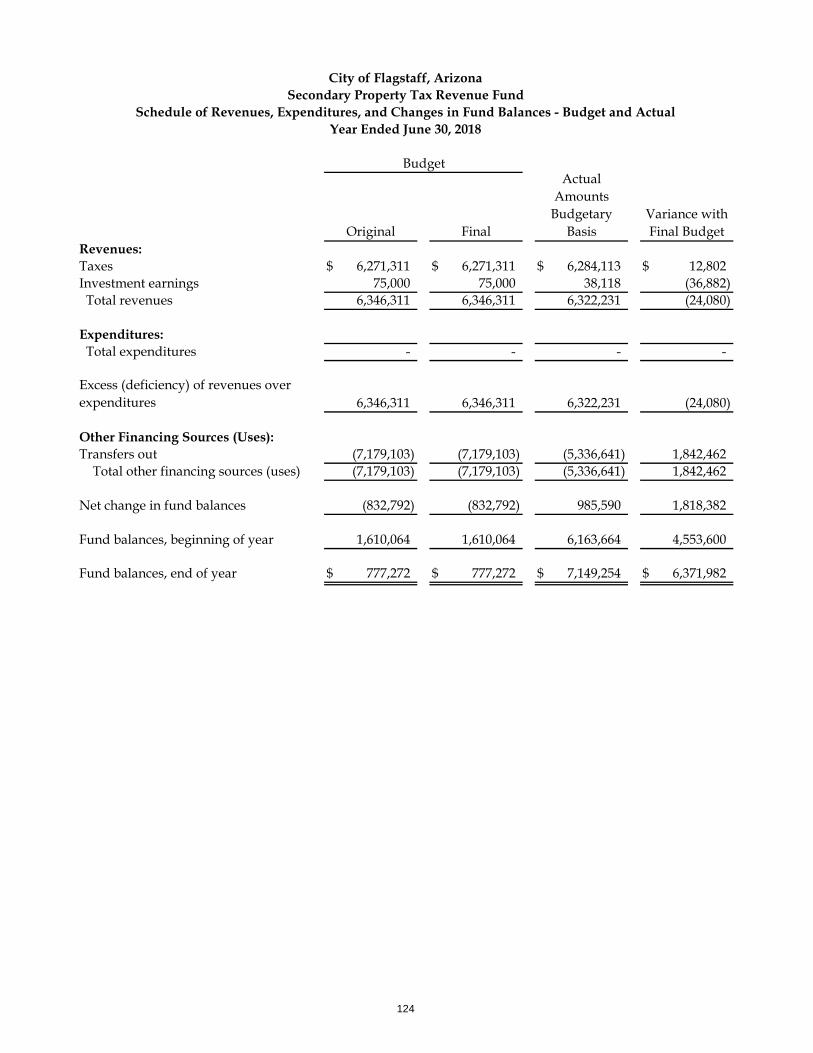
Original Final
Actual Amounts
Budgetary Basis
Variance with Final Budget
Revenues:Taxes 6,271,311$ 6,271,311$ 6,284,113$ 12,802$ Investment earnings 75,000 75,000 38,118 (36,882) Total revenues 6,346,311 6,346,311 6,322,231 (24,080)
Expenditures: Total expenditures - - - -
Excess (deficiency) of revenues over expenditures 6,346,311 6,346,311 6,322,231 (24,080)
Other Financing Sources (Uses):Transfers out (7,179,103) (7,179,103) (5,336,641) 1,842,462 Total other financing sources (uses) (7,179,103) (7,179,103) (5,336,641) 1,842,462
Net change in fund balances (832,792) (832,792) 985,590 1,818,382
Fund balances, beginning of year 1,610,064 1,610,064 6,163,664 4,553,600
Fund balances, end of year 777,272$ 777,272$ 7,149,254$ 6,371,982$
Budget
City of Flagstaff, ArizonaSecondary Property Tax Revenue Fund
Schedule of Revenues, Expenditures, and Changes in Fund Balances - Budget and ActualYear Ended June 30, 2018
124
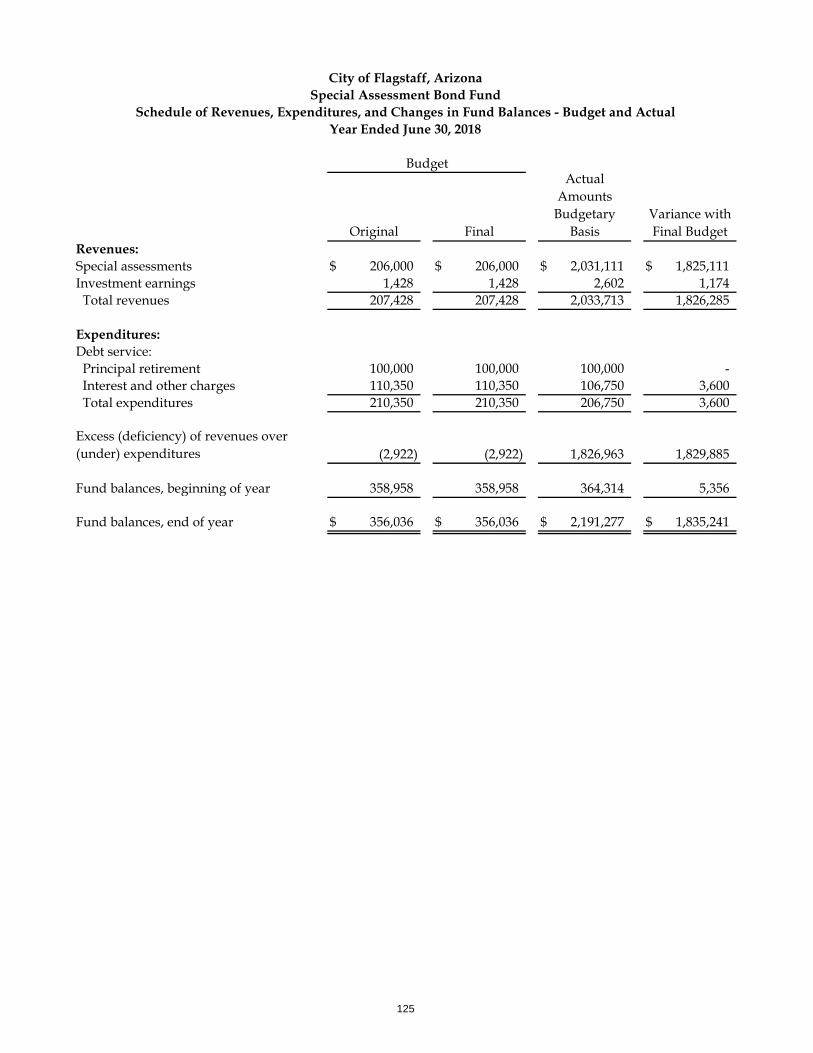
Original Final
Actual Amounts
Budgetary Basis
Variance with Final Budget
Revenues:Special assessments 206,000$ 206,000$ 2,031,111$ 1,825,111$ Investment earnings 1,428 1,428 2,602 1,174 Total revenues 207,428 207,428 2,033,713 1,826,285
Expenditures:Debt service: Principal retirement 100,000 100,000 100,000 - Interest and other charges 110,350 110,350 106,750 3,600 Total expenditures 210,350 210,350 206,750 3,600
Excess (deficiency) of revenues over (under) expenditures (2,922) (2,922) 1,826,963 1,829,885
Fund balances, beginning of year 358,958 358,958 364,314 5,356
Fund balances, end of year 356,036$ 356,036$ 2,191,277$ 1,835,241$
Budget
City of Flagstaff, ArizonaSpecial Assessment Bond Fund
Schedule of Revenues, Expenditures, and Changes in Fund Balances - Budget and ActualYear Ended June 30, 2018
125
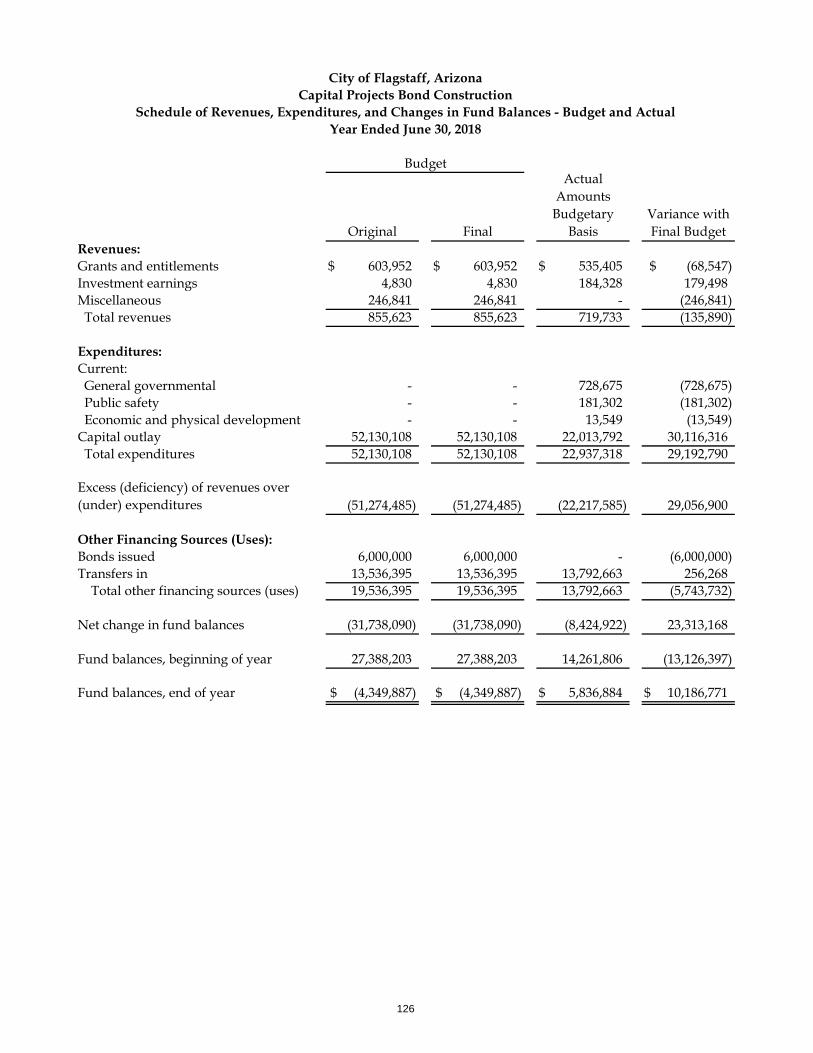
Original Final
Actual Amounts
Budgetary Basis
Variance with Final Budget
Revenues:Grants and entitlements 603,952$ 603,952$ 535,405$ (68,547)$ Investment earnings 4,830 4,830 184,328 179,498 Miscellaneous 246,841 246,841 - (246,841) Total revenues 855,623 855,623 719,733 (135,890)
Expenditures:Current: General governmental - - 728,675 (728,675) Public safety - - 181,302 (181,302) Economic and physical development - - 13,549 (13,549) Capital outlay 52,130,108 52,130,108 22,013,792 30,116,316 Total expenditures 52,130,108 52,130,108 22,937,318 29,192,790
Excess (deficiency) of revenues over (under) expenditures (51,274,485) (51,274,485) (22,217,585) 29,056,900
Other Financing Sources (Uses):Bonds issued 6,000,000 6,000,000 - (6,000,000)Transfers in 13,536,395 13,536,395 13,792,663 256,268 Total other financing sources (uses) 19,536,395 19,536,395 13,792,663 (5,743,732)
Net change in fund balances (31,738,090) (31,738,090) (8,424,922) 23,313,168
Fund balances, beginning of year 27,388,203 27,388,203 14,261,806 (13,126,397)
Fund balances, end of year (4,349,887)$ (4,349,887)$ 5,836,884$ 10,186,771$
Budget
City of Flagstaff, ArizonaCapital Projects Bond Construction
Schedule of Revenues, Expenditures, and Changes in Fund Balances - Budget and ActualYear Ended June 30, 2018
126
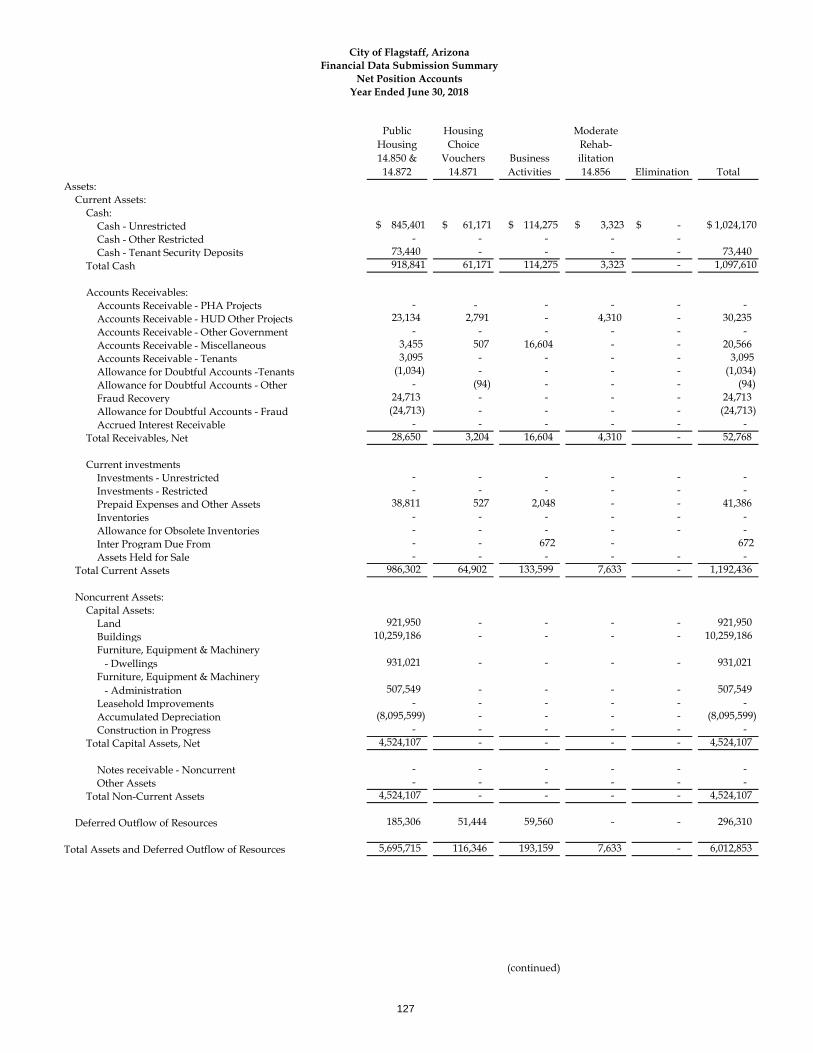
Public Housing14.850 &
14.872
Housing Choice
Vouchers14.871
Business Activities
Moderate Rehab-ilitation14.856 Elimination Total
Assets: Current Assets:
Cash: Cash - Unrestricted $ 845,401 $ 61,171 $ 114,275 $ 3,323 $ - $ 1,024,170 Cash - Other Restricted - - - - - Cash - Tenant Security Deposits 73,440 - - - - 73,440
Total Cash 918,841 61,171 114,275 3,323 - 1,097,610
Accounts Receivables: Accounts Receivable - PHA Projects - - - - - - Accounts Receivable - HUD Other Projects 23,134 2,791 - 4,310 - 30,235 Accounts Receivable - Other Government - - - - - - Accounts Receivable - Miscellaneous 3,455 507 16,604 - - 20,566 Accounts Receivable - Tenants 3,095 - - - - 3,095 Allowance for Doubtful Accounts -Tenants (1,034) - - - - (1,034) Allowance for Doubtful Accounts - Other - (94) - - - (94) Fraud Recovery 24,713 - - - - 24,713 Allowance for Doubtful Accounts - Fraud (24,713) - - - - (24,713) Accrued Interest Receivable - - - - - -
Total Receivables, Net 28,650 3,204 16,604 4,310 - 52,768
Current investments Investments - Unrestricted - - - - - - Investments - Restricted - - - - - - Prepaid Expenses and Other Assets 38,811 527 2,048 - - 41,386 Inventories - - - - - - Allowance for Obsolete Inventories - - - - - - Inter Program Due From - - 672 - 672 Assets Held for Sale - - - - - -
Total Current Assets 986,302 64,902 133,599 7,633 - 1,192,436
Noncurrent Assets: Capital Assets:
Land 921,950 - - - - 921,950 Buildings 10,259,186 - - - - 10,259,186 Furniture, Equipment & Machinery
- Dwellings 931,021 - - - - 931,021 Furniture, Equipment & Machinery
- Administration 507,549 - - - - 507,549 Leasehold Improvements - - - - - - Accumulated Depreciation (8,095,599) - - - - (8,095,599) Construction in Progress - - - - - -
Total Capital Assets, Net 4,524,107 - - - - 4,524,107
Notes receivable - Noncurrent - - - - - - Other Assets - - - - - -
Total Non-Current Assets 4,524,107 - - - - 4,524,107
Deferred Outflow of Resources 185,306 51,444 59,560 - - 296,310
Total Assets and Deferred Outflow of Resources 5,695,715 116,346 193,159 7,633 - 6,012,853
Year Ended June 30, 2018
City of Flagstaff, ArizonaFinancial Data Submission Summary
Net Position Accounts
(continued)
127
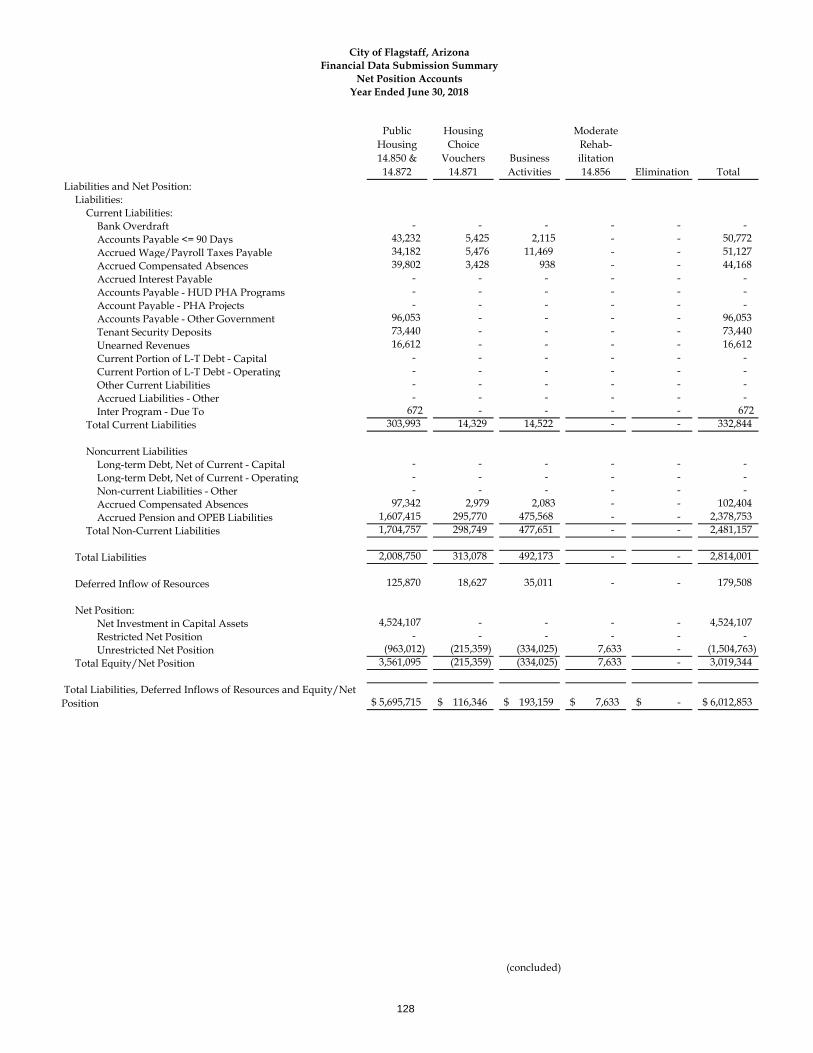
Public Housing14.850 &
14.872
Housing Choice
Vouchers14.871
Business Activities
Moderate Rehab-ilitation14.856 Elimination Total
Year Ended June 30, 2018
City of Flagstaff, ArizonaFinancial Data Submission Summary
Net Position Accounts
Liabilities and Net Position: Liabilities:
Current Liabilities: Bank Overdraft - - - - - - Accounts Payable <= 90 Days 43,232 5,425 2,115 - - 50,772 Accrued Wage/Payroll Taxes Payable 34,182 5,476 11,469 - - 51,127 Accrued Compensated Absences 39,802 3,428 938 - - 44,168 Accrued Interest Payable - - - - - - Accounts Payable - HUD PHA Programs - - - - - - Account Payable - PHA Projects - - - - - - Accounts Payable - Other Government 96,053 - - - - 96,053 Tenant Security Deposits 73,440 - - - - 73,440 Unearned Revenues 16,612 - - - - 16,612 Current Portion of L-T Debt - Capital - - - - - - Current Portion of L-T Debt - Operating - - - - - - Other Current Liabilities - - - - - - Accrued Liabilities - Other - - - - - - Inter Program - Due To 672 - - - - 672
Total Current Liabilities 303,993 14,329 14,522 - - 332,844
Noncurrent Liabilities Long-term Debt, Net of Current - Capital - - - - - - Long-term Debt, Net of Current - Operating - - - - - - Non-current Liabilities - Other - - - - - - Accrued Compensated Absences 97,342 2,979 2,083 - - 102,404 Accrued Pension and OPEB Liabilities 1,607,415 295,770 475,568 - - 2,378,753
Total Non-Current Liabilities 1,704,757 298,749 477,651 - - 2,481,157
Total Liabilities 2,008,750 313,078 492,173 - - 2,814,001
Deferred Inflow of Resources 125,870 18,627 35,011 - - 179,508
Net Position: Net Investment in Capital Assets 4,524,107 - - - - 4,524,107 Restricted Net Position - - - - - - Unrestricted Net Position (963,012) (215,359) (334,025) 7,633 - (1,504,763)
Total Equity/Net Position 3,561,095 (215,359) (334,025) 7,633 - 3,019,344
Total Liabilities, Deferred Inflows of Resources and Equity/Net Position $ 5,695,715 $ 116,346 $ 193,159 $ 7,633 $ - $ 6,012,853
(concluded)
128
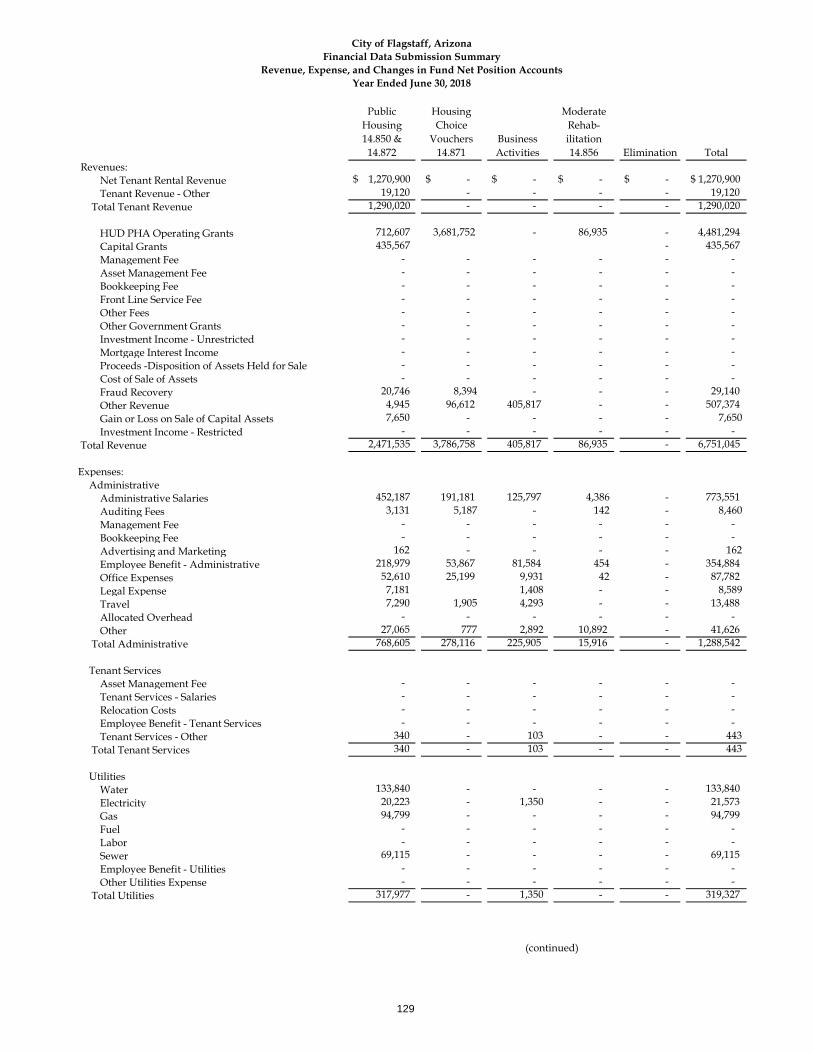
Public Housing14.850 &
14.872
Housing Choice
Vouchers14.871
Business Activities
Moderate Rehab-ilitation14.856 Elimination Total
Revenues: Net Tenant Rental Revenue $ 1,270,900 $ - $ - $ - $ - $ 1,270,900 Tenant Revenue - Other 19,120 - - - - 19,120
Total Tenant Revenue 1,290,020 - - - - 1,290,020
HUD PHA Operating Grants 712,607 3,681,752 - 86,935 - 4,481,294 Capital Grants 435,567 - 435,567 Management Fee - - - - - -Asset Management Fee - - - - - -Bookkeeping Fee - - - - - -Front Line Service Fee - - - - - -Other Fees - - - - - -Other Government Grants - - - - - -Investment Income - Unrestricted - - - - - -Mortgage Interest Income - - - - - -Proceeds -Disposition of Assets Held for Sale - - - - - -Cost of Sale of Assets - - - - - -Fraud Recovery 20,746 8,394 - - - 29,140 Other Revenue 4,945 96,612 405,817 - - 507,374 Gain or Loss on Sale of Capital Assets 7,650 - - - - 7,650 Investment Income - Restricted - - - - - -
Total Revenue 2,471,535 3,786,758 405,817 86,935 - 6,751,045
Expenses:Administrative
Administrative Salaries 452,187 191,181 125,797 4,386 - 773,551 Auditing Fees 3,131 5,187 - 142 - 8,460 Management Fee - - - - - -Bookkeeping Fee - - - - - -Advertising and Marketing 162 - - - - 162 Employee Benefit - Administrative 218,979 53,867 81,584 454 - 354,884 Office Expenses 52,610 25,199 9,931 42 - 87,782 Legal Expense 7,181 1,408 - - 8,589 Travel 7,290 1,905 4,293 - - 13,488 Allocated Overhead - - - - - - Other 27,065 777 2,892 10,892 - 41,626
Total Administrative 768,605 278,116 225,905 15,916 - 1,288,542
Tenant ServicesAsset Management Fee - - - - - - Tenant Services - Salaries - - - - - - Relocation Costs - - - - - - Employee Benefit - Tenant Services - - - - - - Tenant Services - Other 340 - 103 - - 443
Total Tenant Services 340 - 103 - - 443
UtilitiesWater 133,840 - - - - 133,840 Electricity 20,223 - 1,350 - - 21,573 Gas 94,799 - - - - 94,799 Fuel - - - - - - Labor - - - - - - Sewer 69,115 - - - - 69,115 Employee Benefit - Utilities - - - - - - Other Utilities Expense - - - - - -
Total Utilities 317,977 - 1,350 - - 319,327
Revenue, Expense, and Changes in Fund Net Position AccountsYear Ended June 30, 2018
City of Flagstaff, ArizonaFinancial Data Submission Summary
(continued)
129
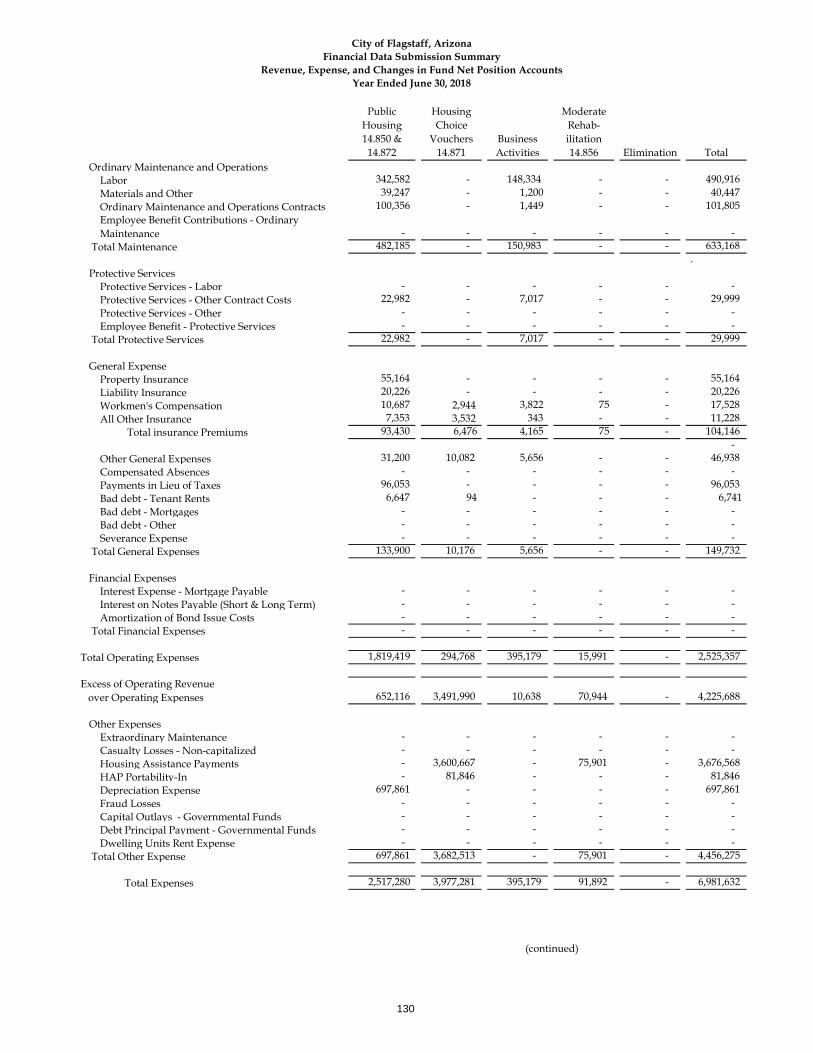
Public Housing14.850 &
14.872
Housing Choice
Vouchers14.871
Business Activities
Moderate Rehab-ilitation14.856 Elimination Total
Revenue, Expense, and Changes in Fund Net Position AccountsYear Ended June 30, 2018
City of Flagstaff, ArizonaFinancial Data Submission Summary
Ordinary Maintenance and OperationsLabor 342,582 - 148,334 - - 490,916 Materials and Other 39,247 - 1,200 - - 40,447 Ordinary Maintenance and Operations Contracts 100,356 - 1,449 - - 101,805 Employee Benefit Contributions - Ordinary Maintenance - - - - - -
Total Maintenance 482,185 - 150,983 - - 633,168 .
Protective ServicesProtective Services - Labor - - - - - - Protective Services - Other Contract Costs 22,982 - 7,017 - - 29,999 Protective Services - Other - - - - - - Employee Benefit - Protective Services - - - - - -
Total Protective Services 22,982 - 7,017 - - 29,999
General ExpenseProperty Insurance 55,164 - - - - 55,164 Liability Insurance 20,226 - - - - 20,226 Workmen's Compensation 10,687 2,944 3,822 75 - 17,528 All Other Insurance 7,353 3,532 343 - - 11,228
Total insurance Premiums 93,430 6,476 4,165 75 - 104,146 - Other General Expenses 31,200 10,082 5,656 - - 46,938 Compensated Absences - - - - - - Payments in Lieu of Taxes 96,053 - - - - 96,053 Bad debt - Tenant Rents 6,647 94 - - - 6,741 Bad debt - Mortgages - - - - - - Bad debt - Other - - - - - - Severance Expense - - - - - -
Total General Expenses 133,900 10,176 5,656 - - 149,732
Financial ExpensesInterest Expense - Mortgage Payable - - - - - - Interest on Notes Payable (Short & Long Term) - - - - - - Amortization of Bond Issue Costs - - - - - -
Total Financial Expenses - - - - - -
Total Operating Expenses 1,819,419 294,768 395,179 15,991 - 2,525,357
Excess of Operating Revenue over Operating Expenses 652,116 3,491,990 10,638 70,944 - 4,225,688
Other ExpensesExtraordinary Maintenance - - - - - - Casualty Losses - Non-capitalized - - - - - - Housing Assistance Payments - 3,600,667 - 75,901 - 3,676,568 HAP Portability-In - 81,846 - - - 81,846 Depreciation Expense 697,861 - - - - 697,861 Fraud Losses - - - - - - Capital Outlays - Governmental Funds - - - - - - Debt Principal Payment - Governmental Funds - - - - - - Dwelling Units Rent Expense - - - - - -
Total Other Expense 697,861 3,682,513 - 75,901 - 4,456,275
Total Expenses 2,517,280 3,977,281 395,179 91,892 - 6,981,632
(continued)
130
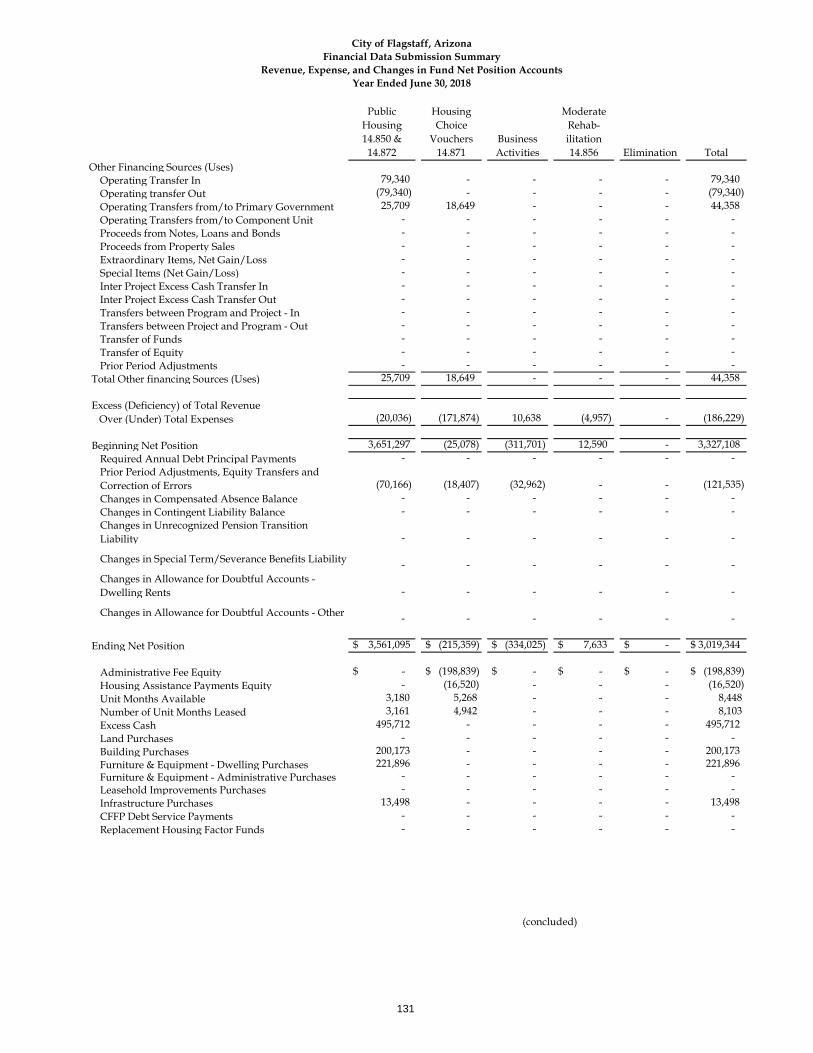
Public Housing14.850 &
14.872
Housing Choice
Vouchers14.871
Business Activities
Moderate Rehab-ilitation14.856 Elimination Total
Revenue, Expense, and Changes in Fund Net Position AccountsYear Ended June 30, 2018
City of Flagstaff, ArizonaFinancial Data Submission Summary
Other Financing Sources (Uses) Operating Transfer In 79,340 - - - - 79,340 Operating transfer Out (79,340) - - - - (79,340)Operating Transfers from/to Primary Government 25,709 18,649 - - - 44,358 Operating Transfers from/to Component Unit - - - - - - Proceeds from Notes, Loans and Bonds - - - - - - Proceeds from Property Sales - - - - - - Extraordinary Items, Net Gain/Loss - - - - - - Special Items (Net Gain/Loss) - - - - - - Inter Project Excess Cash Transfer In - - - - - - Inter Project Excess Cash Transfer Out - - - - - - Transfers between Program and Project - In - - - - - - Transfers between Project and Program - Out - - - - - - Transfer of Funds - - - - - - Transfer of Equity - - - - - - Prior Period Adjustments - - - - - -
Total Other financing Sources (Uses) 25,709 18,649 - - - 44,358
Excess (Deficiency) of Total Revenue Over (Under) Total Expenses (20,036) (171,874) 10,638 (4,957) - (186,229)
Beginning Net Position 3,651,297 (25,078) (311,701) 12,590 - 3,327,108
Required Annual Debt Principal Payments - - - - - - Prior Period Adjustments, Equity Transfers and Correction of Errors (70,166) (18,407) (32,962) - - (121,535)Changes in Compensated Absence Balance - - - - - - Changes in Contingent Liability Balance - - - - - - Changes in Unrecognized Pension Transition Liability - - - - - -
Changes in Special Term/Severance Benefits Liability - - - - - - Changes in Allowance for Doubtful Accounts - Dwelling Rents - - - - - -
Changes in Allowance for Doubtful Accounts - Other - - - - - -
Ending Net Position $ 3,561,095 $ (215,359) $ (334,025) $ 7,633 $ - $ 3,019,344
Administrative Fee Equity $ - $ (198,839) $ - $ - $ - $ (198,839)Housing Assistance Payments Equity - (16,520) - - - (16,520)Unit Months Available 3,180 5,268 - - - 8,448 Number of Unit Months Leased 3,161 4,942 - - - 8,103 Excess Cash 495,712 - - - - 495,712 Land Purchases - - - - - - Building Purchases 200,173 - - - - 200,173 Furniture & Equipment - Dwelling Purchases 221,896 - - - - 221,896 Furniture & Equipment - Administrative Purchases - - - - - - Leasehold Improvements Purchases - - - - - - Infrastructure Purchases 13,498 - - - - 13,498 CFFP Debt Service Payments - - - - - - Replacement Housing Factor Funds - - - - - -
(concluded)
131
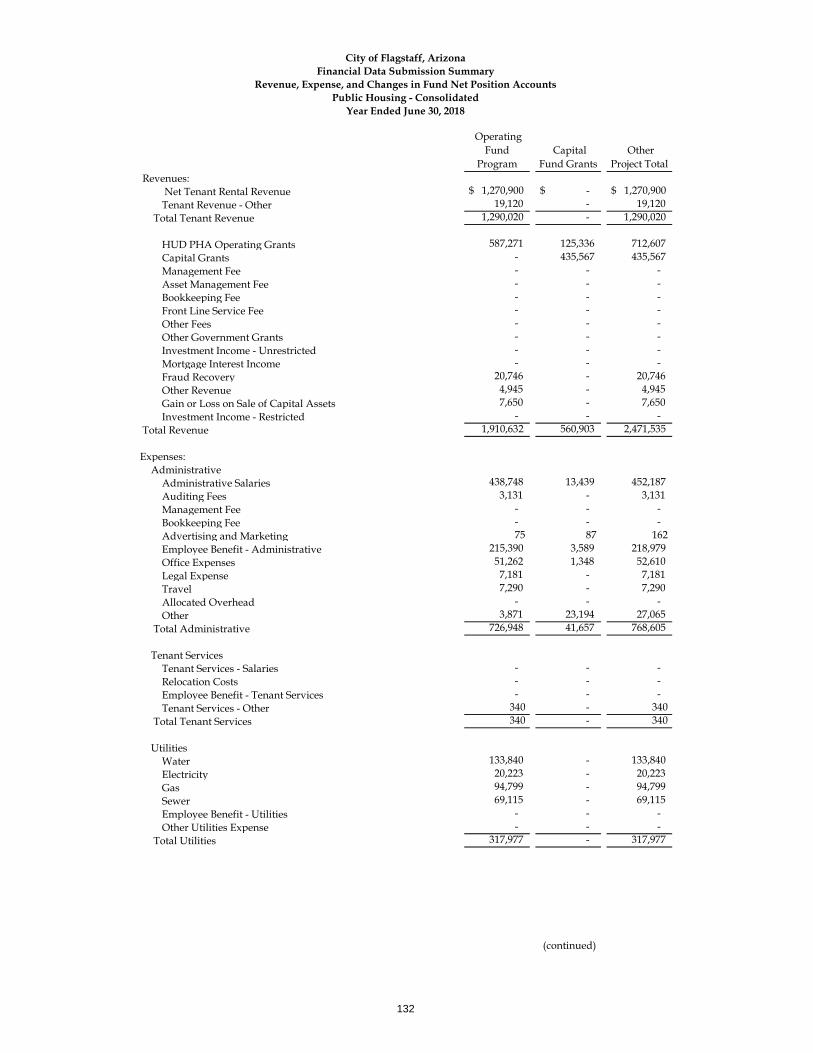
Operating Fund
Program Capital
Fund Grants Other
Project Total Revenues:
Net Tenant Rental Revenue $ 1,270,900 $ - $ 1,270,900 Tenant Revenue - Other 19,120 - 19,120
Total Tenant Revenue 1,290,020 - 1,290,020
HUD PHA Operating Grants 587,271 125,336 712,607 Capital Grants - 435,567 435,567 Management Fee - - - Asset Management Fee - - - Bookkeeping Fee - - - Front Line Service Fee - - - Other Fees - - - Other Government Grants - - - Investment Income - Unrestricted - - - Mortgage Interest Income - - - Fraud Recovery 20,746 - 20,746 Other Revenue 4,945 - 4,945 Gain or Loss on Sale of Capital Assets 7,650 - 7,650 Investment Income - Restricted - - -
Total Revenue 1,910,632 560,903 2,471,535
Expenses:Administrative
Administrative Salaries 438,748 13,439 452,187 Auditing Fees 3,131 - 3,131 Management Fee - - - Bookkeeping Fee - - - Advertising and Marketing 75 87 162 Employee Benefit - Administrative 215,390 3,589 218,979 Office Expenses 51,262 1,348 52,610 Legal Expense 7,181 - 7,181 Travel 7,290 - 7,290 Allocated Overhead - - -Other 3,871 23,194 27,065
Total Administrative 726,948 41,657 768,605
Tenant ServicesTenant Services - Salaries - - - Relocation Costs - - - Employee Benefit - Tenant Services - - - Tenant Services - Other 340 - 340
Total Tenant Services 340 - 340
UtilitiesWater 133,840 - 133,840 Electricity 20,223 - 20,223 Gas 94,799 - 94,799 Sewer 69,115 - 69,115 Employee Benefit - Utilities - - - Other Utilities Expense - - -
Total Utilities 317,977 - 317,977
(continued)
City of Flagstaff, ArizonaFinancial Data Submission Summary
Revenue, Expense, and Changes in Fund Net Position Accounts
Year Ended June 30, 2018Public Housing - Consolidated
132
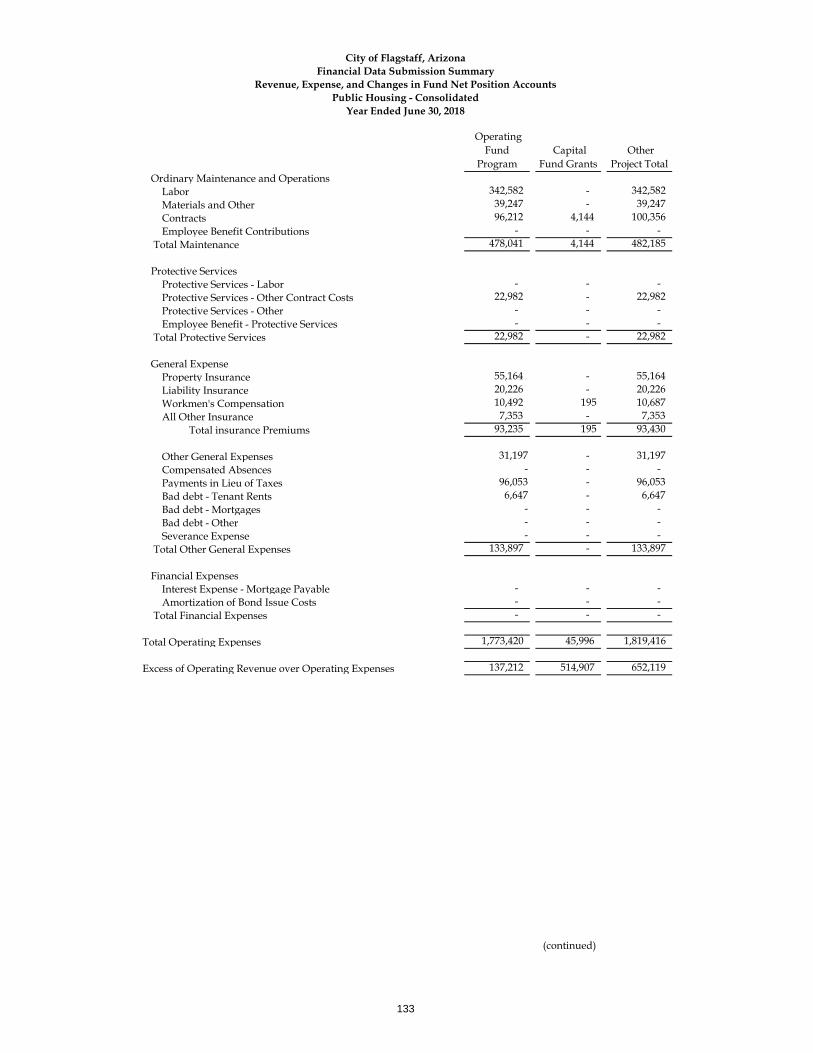
Operating Fund
Program Capital
Fund Grants Other
Project Total
City of Flagstaff, ArizonaFinancial Data Submission Summary
Revenue, Expense, and Changes in Fund Net Position Accounts
Year Ended June 30, 2018Public Housing - Consolidated
Ordinary Maintenance and OperationsLabor 342,582 - 342,582 Materials and Other 39,247 - 39,247 Contracts 96,212 4,144 100,356 Employee Benefit Contributions - - -
Total Maintenance 478,041 4,144 482,185
Protective ServicesProtective Services - Labor - - - Protective Services - Other Contract Costs 22,982 - 22,982 Protective Services - Other - - - Employee Benefit - Protective Services - - -
Total Protective Services 22,982 - 22,982
General ExpenseProperty Insurance 55,164 - 55,164 Liability Insurance 20,226 - 20,226 Workmen's Compensation 10,492 195 10,687 All Other Insurance 7,353 - 7,353
Total insurance Premiums 93,235 195 93,430 Other General Expenses 31,197 - 31,197 Compensated Absences - - - Payments in Lieu of Taxes 96,053 - 96,053 Bad debt - Tenant Rents 6,647 - 6,647 Bad debt - Mortgages - - - Bad debt - Other - - - Severance Expense - - -
Total Other General Expenses 133,897 - 133,897
Financial ExpensesInterest Expense - Mortgage Payable - - - Amortization of Bond Issue Costs - - -
Total Financial Expenses - - -
Total Operating Expenses 1,773,420 45,996 1,819,416
Excess of Operating Revenue over Operating Expenses 137,212 514,907 652,119
(continued)
133
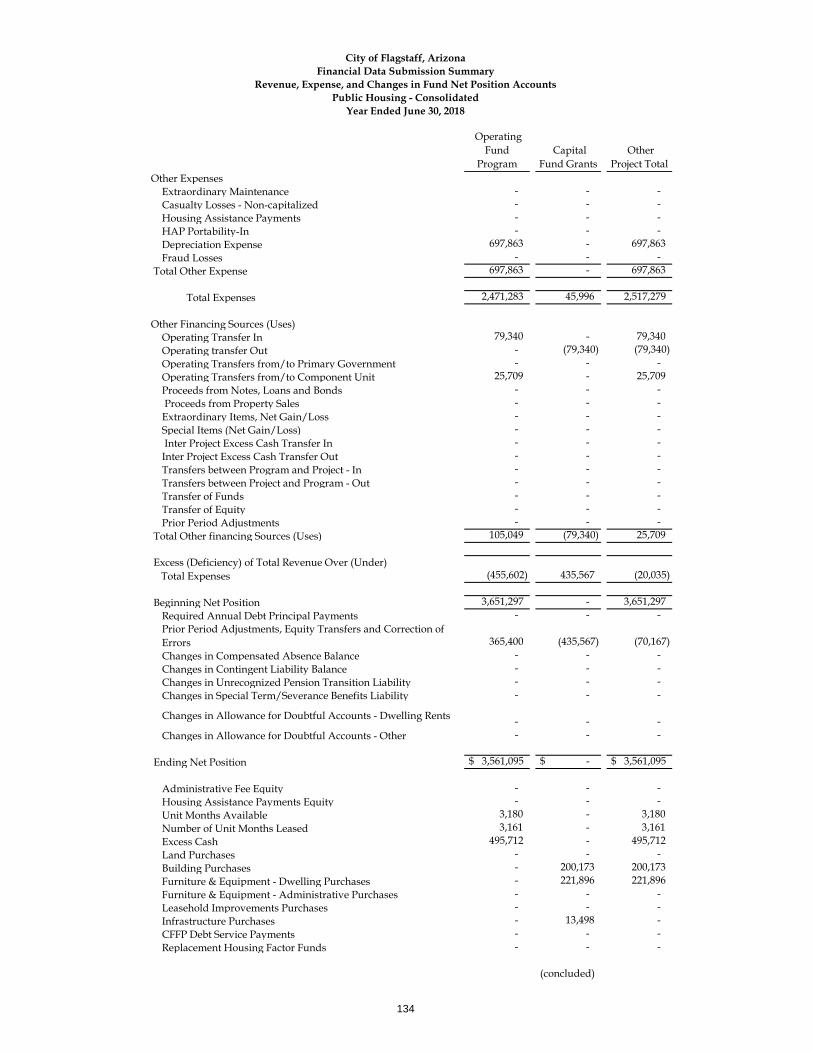
Operating Fund
Program Capital
Fund Grants Other
Project Total
City of Flagstaff, ArizonaFinancial Data Submission Summary
Revenue, Expense, and Changes in Fund Net Position Accounts
Year Ended June 30, 2018Public Housing - Consolidated
Other ExpensesExtraordinary Maintenance - - - Casualty Losses - Non-capitalized - - - Housing Assistance Payments - - - HAP Portability-In - - - Depreciation Expense 697,863 - 697,863 Fraud Losses - - -
Total Other Expense 697,863 - 697,863
Total Expenses 2,471,283 45,996 2,517,279
Other Financing Sources (Uses) Operating Transfer In 79,340 - 79,340 Operating transfer Out - (79,340) (79,340)Operating Transfers from/to Primary Government - - - Operating Transfers from/to Component Unit 25,709 - 25,709 Proceeds from Notes, Loans and Bonds - - - Proceeds from Property Sales - - - Extraordinary Items, Net Gain/Loss - - - Special Items (Net Gain/Loss) - - - Inter Project Excess Cash Transfer In - - - Inter Project Excess Cash Transfer Out - - - Transfers between Program and Project - In - - - Transfers between Project and Program - Out - - - Transfer of Funds - - - Transfer of Equity - - - Prior Period Adjustments - - -
Total Other financing Sources (Uses) 105,049 (79,340) 25,709
Excess (Deficiency) of Total Revenue Over (Under) Total Expenses (455,602) 435,567 (20,035)
Beginning Net Position 3,651,297 - 3,651,297
Required Annual Debt Principal Payments - - - Prior Period Adjustments, Equity Transfers and Correction of Errors 365,400 (435,567) (70,167)Changes in Compensated Absence Balance - - - Changes in Contingent Liability Balance - - - Changes in Unrecognized Pension Transition Liability - - - Changes in Special Term/Severance Benefits Liability - - -
Changes in Allowance for Doubtful Accounts - Dwelling Rents - - - Changes in Allowance for Doubtful Accounts - Other - - -
Ending Net Position $ 3,561,095 $ - $ 3,561,095
Administrative Fee Equity - - - Housing Assistance Payments Equity - - - Unit Months Available 3,180 - 3,180 Number of Unit Months Leased 3,161 - 3,161 Excess Cash 495,712 - 495,712 Land Purchases - - - Building Purchases - 200,173 200,173 Furniture & Equipment - Dwelling Purchases - 221,896 221,896 Furniture & Equipment - Administrative Purchases - - - Leasehold Improvements Purchases - - - Infrastructure Purchases - 13,498 - CFFP Debt Service Payments - - - Replacement Housing Factor Funds - - -
(concluded)
134
Statistical Section
This part of the City of Flagstaff's comprehensive annual financial report presents detailed information as a context for understanding what the information in the financial statements, note disclosures, and required supplementary information says about the city's overall financial health.
Page
Financial Trends 136
These schedules contain trend information to help the reader understand how the City’s financial performance and well-being have changed over time.
Revenue Capacity 143
These schedules contain information to help the reader assess the City's most significant local revenue source, sales tax.
Debt Capacity 149
These schedules present information to help the reader assess the affordability of the City's current levels of outstanding debt and the City's ability to issue additional debt in the future.
Demographic and Economic Information 160
These schedules offer demographic and economic indicators to help the reader understand the environment within which the City's financial activities take place.
Operating Information 162
These schedules contain service and infrastructure data to help the reader understand how the information in the City's financial report relates to the services the City provides and the activities it performs.
Sources: Unless otherwise noted, the information in these schedules is derived from the comprehensive annual financial reports for the relevant year.
Contents:
135
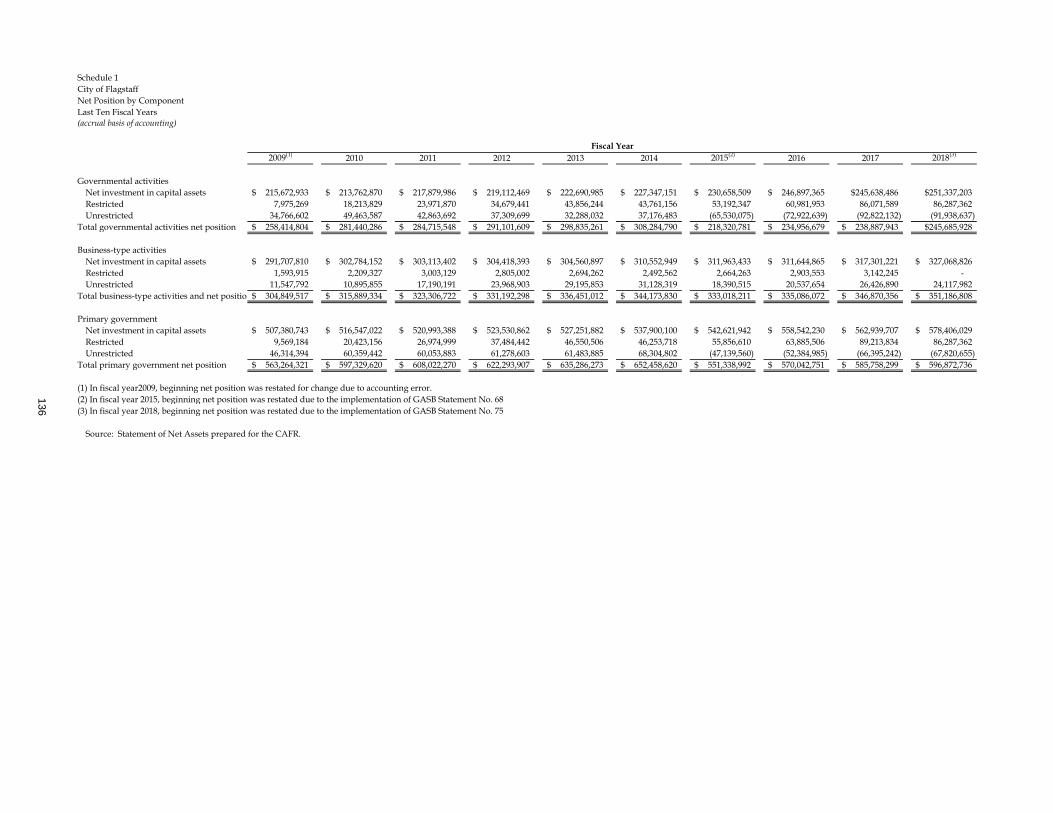
Schedule 1City of FlagstaffNet Position by ComponentLast Ten Fiscal Years(accrual basis of accounting)
2009(1) 2010 2011 2012 2013 2014 2015(2) 2016 2017 2018(3)
Governmental activitiesNet investment in capital assets 215,672,933$ 213,762,870$ 217,879,986$ 219,112,469$ 222,690,985$ 227,347,151$ 230,658,509$ 246,897,365$ $245,638,486 $251,337,203Restricted 7,975,269 18,213,829 23,971,870 34,679,441 43,856,244 43,761,156 53,192,347 60,981,953 86,071,589 86,287,362 Unrestricted 34,766,602 49,463,587 42,863,692 37,309,699 32,288,032 37,176,483 (65,530,075) (72,922,639) (92,822,132) (91,938,637)
Total governmental activities net position 258,414,804$ 281,440,286$ 284,715,548$ 291,101,609$ 298,835,261$ 308,284,790$ 218,320,781$ 234,956,679$ 238,887,943$ $245,685,928
Business-type activitiesNet investment in capital assets 291,707,810$ 302,784,152$ 303,113,402$ 304,418,393$ 304,560,897$ 310,552,949$ 311,963,433$ 311,644,865$ 317,301,221$ 327,068,826$ Restricted 1,593,915 2,209,327 3,003,129 2,805,002 2,694,262 2,492,562 2,664,263 2,903,553 3,142,245 - Unrestricted 11,547,792 10,895,855 17,190,191 23,968,903 29,195,853 31,128,319 18,390,515 20,537,654 26,426,890 24,117,982
Total business-type activities and net position 304,849,517$ 315,889,334$ 323,306,722$ 331,192,298$ 336,451,012$ 344,173,830$ 333,018,211$ 335,086,072$ 346,870,356$ 351,186,808$
Primary governmentNet investment in capital assets 507,380,743$ 516,547,022$ 520,993,388$ 523,530,862$ 527,251,882$ 537,900,100$ 542,621,942$ 558,542,230$ 562,939,707$ 578,406,029$ Restricted 9,569,184 20,423,156 26,974,999 37,484,442 46,550,506 46,253,718 55,856,610 63,885,506 89,213,834 86,287,362 Unrestricted 46,314,394 60,359,442 60,053,883 61,278,603 61,483,885 68,304,802 (47,139,560) (52,384,985) (66,395,242) (67,820,655)
Total primary government net position 563,264,321$ 597,329,620$ 608,022,270$ 622,293,907$ 635,286,273$ 652,458,620$ 551,338,992$ 570,042,751$ 585,758,299$ 596,872,736$
(1) In fiscal year2009, beginning net position was restated for change due to accounting error.(2) In fiscal year 2015, beginning net position was restated due to the implementation of GASB Statement No. 68(3) In fiscal year 2018, beginning net position was restated due to the implementation of GASB Statement No. 75
Source: Statement of Net Assets prepared for the CAFR.
Fiscal Year
136

137
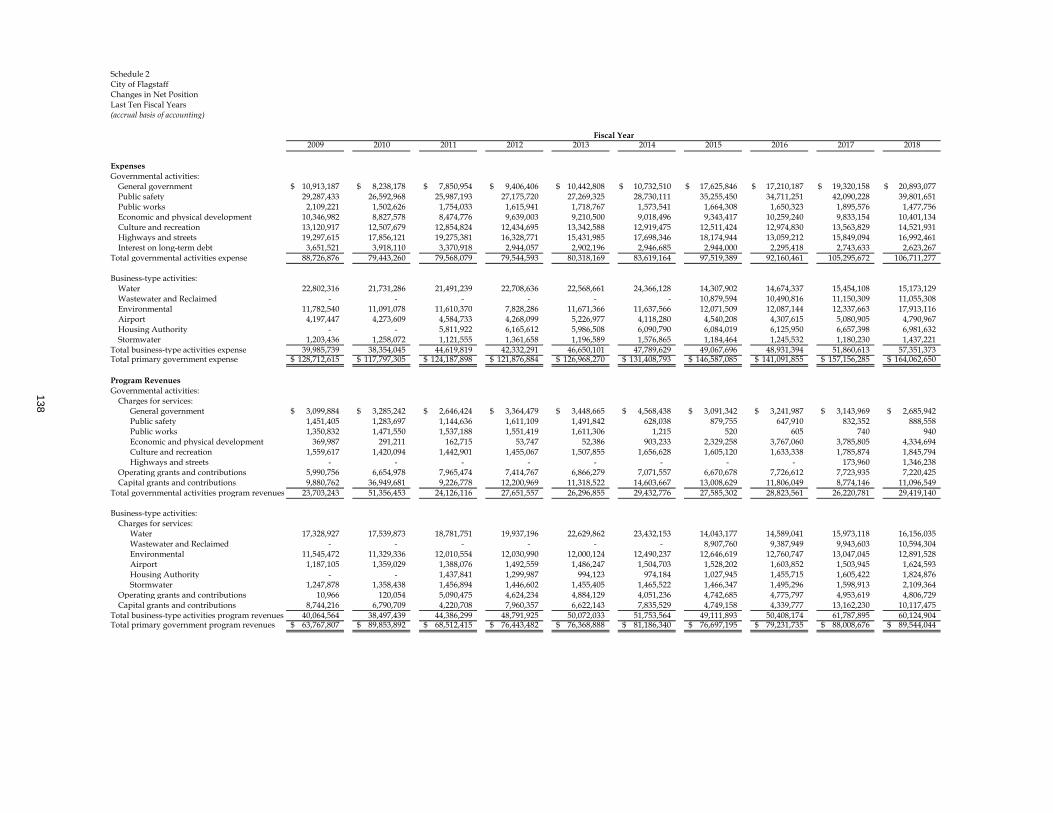
Schedule 2City of FlagstaffChanges in Net PositionLast Ten Fiscal Years(accrual basis of accounting)
2009 2010 2011 2012 2013 2014 2015 2016 2017 2018
ExpensesGovernmental activities:
General government 10,913,187$ 8,238,178$ 7,850,954$ 9,406,406$ 10,442,808$ 10,732,510$ 17,625,846$ 17,210,187$ 19,320,158$ 20,893,077$ Public safety 29,287,433 26,592,968 25,987,193 27,175,720 27,269,325 28,730,111 35,255,450 34,711,251 42,090,228 39,801,651Public works 2,109,221 1,502,626 1,754,033 1,615,941 1,718,767 1,573,541 1,664,308 1,650,323 1,895,576 1,477,756Economic and physical development 10,346,982 8,827,578 8,474,776 9,639,003 9,210,500 9,018,496 9,343,417 10,259,240 9,833,154 10,401,134Culture and recreation 13,120,917 12,507,679 12,854,824 12,434,695 13,342,588 12,919,475 12,511,424 12,974,830 13,563,829 14,521,931Highways and streets 19,297,615 17,856,121 19,275,381 16,328,771 15,431,985 17,698,346 18,174,944 13,059,212 15,849,094 16,992,461Interest on long-term debt 3,651,521 3,918,110 3,370,918 2,944,057 2,902,196 2,946,685 2,944,000 2,295,418 2,743,633 2,623,267
Total governmental activities expense 88,726,876 79,443,260 79,568,079 79,544,593 80,318,169 83,619,164 97,519,389 92,160,461 105,295,672 106,711,277
Business-type activities:Water 22,802,316 21,731,286 21,491,239 22,708,636 22,568,661 24,366,128 14,307,902 14,674,337 15,454,108 15,173,129Wastewater and Reclaimed - - - - - - 10,879,594 10,490,816 11,150,309 11,055,308Environmental 11,782,540 11,091,078 11,610,370 7,828,286 11,671,366 11,637,566 12,071,509 12,087,144 12,337,663 17,913,116Airport 4,197,447 4,273,609 4,584,733 4,268,099 5,226,977 4,118,280 4,540,208 4,307,615 5,080,905 4,790,967
- - 5,811,922 6,165,612 5,986,508 6,090,790 6,084,019 6,125,950 6,657,398 6,981,632Stormwater 1,203,436 1,258,072 1,121,555 1,361,658 1,196,589 1,576,865 1,184,464 1,245,532 1,180,230 1,437,221
Total business-type activities expense 39,985,739 38,354,045 44,619,819 42,332,291 46,650,101 47,789,629 49,067,696 48,931,394 51,860,613 57,351,373 Total primary government expense 128,712,615$ 117,797,305$ 124,187,898$ 121,876,884$ 126,968,270$ 131,408,793$ 146,587,085$ 141,091,855$ 157,156,285$ 164,062,650$
Program RevenuesGovernmental activities:
Charges for services:General government 3,099,884$ 3,285,242$ 2,646,424$ 3,364,479$ 3,448,665$ 4,568,438$ 3,091,342$ 3,241,987$ 3,143,969$ 2,685,942$ Public safety 1,451,405 1,283,697 1,144,636 1,611,109 1,491,842 628,038 879,755 647,910 832,352 888,558 Public works 1,350,832 1,471,550 1,537,188 1,551,419 1,611,306 1,215 520 605 740 940 Economic and physical development 369,987 291,211 162,715 53,747 52,386 903,233 2,329,258 3,767,060 3,785,805 4,334,694 Culture and recreation 1,559,617 1,420,094 1,442,901 1,455,067 1,507,855 1,656,628 1,605,120 1,633,338 1,785,874 1,845,794 Highways and streets - - - - - - - - 173,960 1,346,238
Operating grants and contributions 5,990,756 6,654,978 7,965,474 7,414,767 6,866,279 7,071,557 6,670,678 7,726,612 7,723,935 7,220,425 Capital grants and contributions 9,880,762 36,949,681 9,226,778 12,200,969 11,318,522 14,603,667 13,008,629 11,806,049 8,774,146 11,096,549
Total governmental activities program revenues 23,703,243 51,356,453 24,126,116 27,651,557 26,296,855 29,432,776 27,585,302 28,823,561 26,220,781 29,419,140
Business-type activities:Charges for services:
Water 17,328,927 17,539,873 18,781,751 19,937,196 22,629,862 23,432,153 14,043,177 14,589,041 15,973,118 16,156,035Wastewater and Reclaimed - - - - - - 8,907,760 9,387,949 9,943,603 10,594,304Environmental 11,545,472 11,329,336 12,010,554 12,030,990 12,000,124 12,490,237 12,646,619 12,760,747 13,047,045 12,891,528Airport 1,187,105 1,359,029 1,388,076 1,492,559 1,486,247 1,504,703 1,528,202 1,603,852 1,503,945 1,624,593Housing Authority - - 1,437,841 1,299,987 994,123 974,184 1,027,945 1,455,715 1,605,422 1,824,876Stormwater 1,247,878 1,358,438 1,456,894 1,446,602 1,455,405 1,465,522 1,466,347 1,495,296 1,598,913 2,109,364
Operating grants and contributions 10,966 120,054 5,090,475 4,624,234 4,884,129 4,051,236 4,742,685 4,775,797 4,953,619 4,806,729Capital grants and contributions 8,744,216 6,790,709 4,220,708 7,960,357 6,622,143 7,835,529 4,749,158 4,339,777 13,162,230 10,117,475
Total business-type activities program revenues 40,064,564 38,497,439 44,386,299 48,791,925 50,072,033 51,753,564 49,111,893 50,408,174 61,787,895 60,124,904 Total primary government program revenues 63,767,807$ 89,853,892$ 68,512,415$ 76,443,482$ 76,368,888$ 81,186,340$ 76,697,195$ 79,231,735$ 88,008,676$ 89,544,044$
Housing Authority
Fiscal Year
138
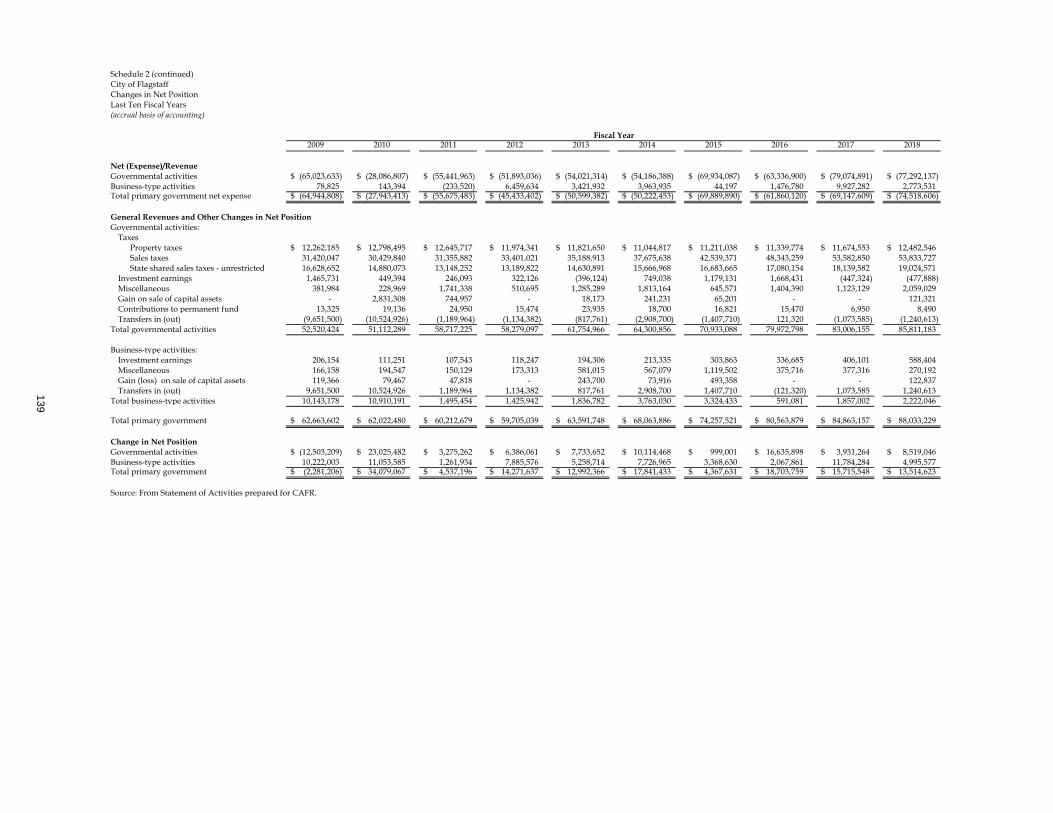
Schedule 2 (continued)City of FlagstaffChanges in Net PositionLast Ten Fiscal Years(accrual basis of accounting)
2009 2010 2011 2012 2013 2014 2015 2016 2017 2018
Net (Expense)/RevenueGovernmental activities (65,023,633)$ (28,086,807)$ (55,441,963)$ (51,893,036)$ (54,021,314)$ (54,186,388)$ (69,934,087)$ (63,336,900)$ (79,074,891)$ (77,292,137)$ Business-type activities 78,825 143,394 (233,520) 6,459,634 3,421,932 3,963,935 44,197 1,476,780 9,927,282 2,773,531 Total primary government net expense (64,944,808)$ (27,943,413)$ (55,675,483)$ (45,433,402)$ (50,599,382)$ (50,222,453)$ (69,889,890)$ (61,860,120)$ (69,147,609)$ (74,518,606)$
General Revenues and Other Changes in Net PositionGovernmental activities:
TaxesProperty taxes 12,262,185$ 12,798,495$ 12,645,717$ 11,974,341$ 11,821,650$ 11,044,817$ 11,211,038$ 11,339,774$ 11,674,553$ 12,482,546$ Sales taxes 31,420,047 30,429,840 31,355,882 33,401,021 35,188,913 37,675,638 42,539,371 48,343,259 53,582,850 53,833,727 State shared sales taxes - unrestricted 16,628,652 14,880,073 13,148,252 13,189,822 14,630,891 15,666,968 16,683,665 17,080,154 18,139,582 19,024,571
Investment earnings 1,465,731 449,394 246,093 322,126 (396,124) 749,038 1,179,131 1,668,431 (447,324) (477,888) Miscellaneous 381,984 228,969 1,741,338 510,695 1,285,289 1,813,164 645,571 1,404,390 1,123,129 2,059,029 Gain on sale of capital assets - 2,831,308 744,957 - 18,173 241,231 65,201 - - 121,321 Contributions to permanent fund 13,325 19,136 24,950 15,474 23,935 18,700 16,821 15,470 6,950 8,490 Transfers in (out) (9,651,500) (10,524,926) (1,189,964) (1,134,382) (817,761) (2,908,700) (1,407,710) 121,320 (1,073,585) (1,240,613)
Total governmental activities 52,520,424 51,112,289 58,717,225 58,279,097 61,754,966 64,300,856 70,933,088 79,972,798 83,006,155 85,811,183
Business-type activities:Investment earnings 206,154 111,251 107,543 118,247 194,306 213,335 303,863 336,685 406,101 588,404 Miscellaneous 166,158 194,547 150,129 173,313 581,015 567,079 1,119,502 375,716 377,316 270,192 Gain (loss) on sale of capital assets 119,366 79,467 47,818 - 243,700 73,916 493,358 - - 122,837 Transfers in (out) 9,651,500 10,524,926 1,189,964 1,134,382 817,761 2,908,700 1,407,710 (121,320) 1,073,585 1,240,613
Total business-type activities 10,143,178 10,910,191 1,495,454 1,425,942 1,836,782 3,763,030 3,324,433 591,081 1,857,002 2,222,046
Total primary government 62,663,602$ 62,022,480$ 60,212,679$ 59,705,039$ 63,591,748$ 68,063,886$ 74,257,521$ 80,563,879$ 84,863,157$ 88,033,229$
Change in Net PositionGovernmental activities (12,503,209)$ 23,025,482$ 3,275,262$ 6,386,061$ 7,733,652$ 10,114,468$ 999,001$ 16,635,898$ 3,931,264$ 8,519,046$ Business-type activities 10,222,003 11,053,585 1,261,934 7,885,576 5,258,714 7,726,965 3,368,630 2,067,861 11,784,284 4,995,577 Total primary government (2,281,206)$ 34,079,067$ 4,537,196$ 14,271,637$ 12,992,366$ 17,841,433$ 4,367,631$ 18,703,759$ 15,715,548$ 13,514,623$
Source: From Statement of Activities prepared for CAFR.
Fiscal Year
139
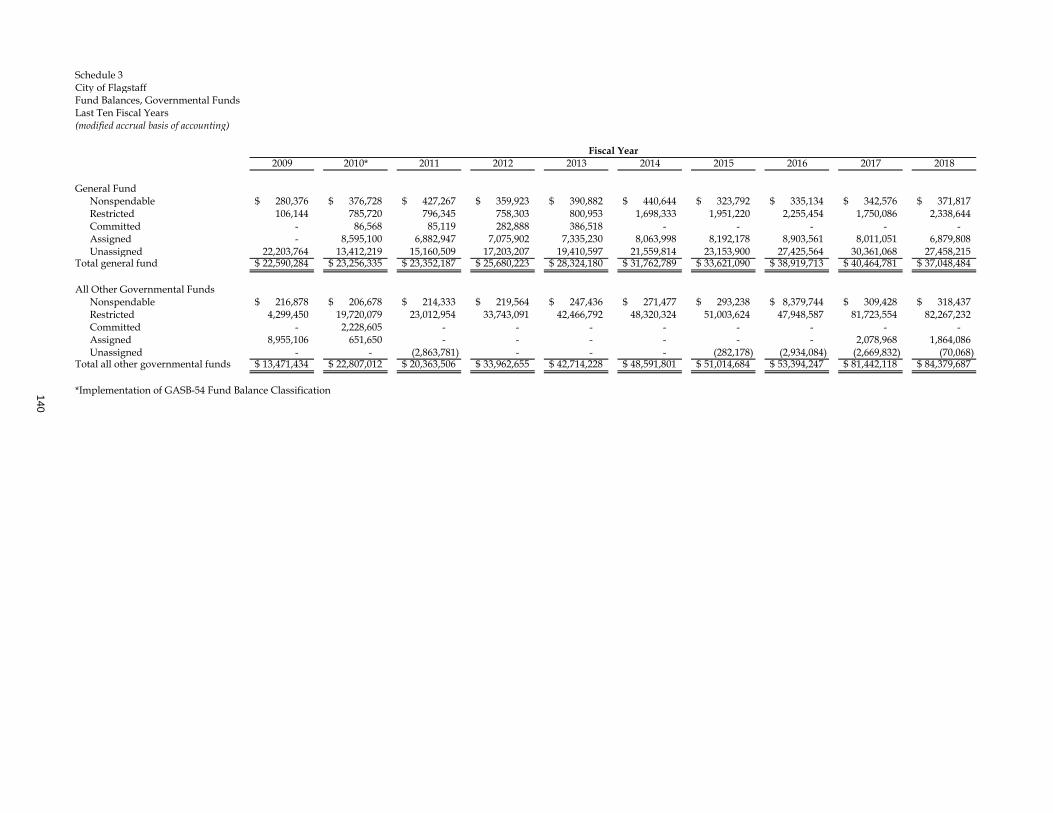
Schedule 3City of FlagstaffFund Balances, Governmental FundsLast Ten Fiscal Years(modified accrual basis of accounting)
2009 2010* 2011 2012 2013 2014 2015 2016 2017 2018
General FundNonspendable 280,376$ 376,728$ 427,267$ 359,923$ 390,882$ 440,644$ 323,792$ 335,134$ 342,576$ 371,817$ Restricted 106,144 785,720 796,345 758,303 800,953 1,698,333 1,951,220 2,255,454 1,750,086 2,338,644 Committed - 86,568 85,119 282,888 386,518 - - - - - Assigned - 8,595,100 6,882,947 7,075,902 7,335,230 8,063,998 8,192,178 8,903,561 8,011,051 6,879,808 Unassigned 22,203,764 13,412,219 15,160,509 17,203,207 19,410,597 21,559,814 23,153,900 27,425,564 30,361,068 27,458,215
Total general fund 22,590,284$ 23,256,335$ 23,352,187$ 25,680,223$ 28,324,180$ 31,762,789$ 33,621,090$ 38,919,713$ 40,464,781$ 37,048,484$
All Other Governmental FundsNonspendable 216,878$ 206,678$ 214,333$ 219,564$ 247,436$ 271,477$ 293,238$ 8,379,744$ 309,428$ 318,437$ Restricted 4,299,450 19,720,079 23,012,954 33,743,091 42,466,792 48,320,324 51,003,624 47,948,587 81,723,554 82,267,232 Committed - 2,228,605 - - - - - - - - Assigned 8,955,106 651,650 - - - - - - 2,078,968 1,864,086
- - (2,863,781) - - - (282,178) (2,934,084) (2,669,832) (70,068) Total all other governmental funds 13,471,434$ 22,807,012$ 20,363,506$ 33,962,655$ 42,714,228$ 48,591,801$ 51,014,684$ 53,394,247$ 81,442,118$ 84,379,687$
*Implementation of GASB-54 Fund Balance Classification
Unassigned
Fiscal Year
140

Schedule 4City of FlagstaffChanges in Fund Balances, Governmental FundsLast Ten Fiscal Years(modified accrual basis of accounting)
2009 2010 2011 2012 2013 2014 2015 2016 2017 2018
Revenues:Taxes 43,555,388$ 43,200,268$ 43,799,128$ 45,577,128$ 47,084,446$ 48,806,758$ 53,725,196$ 59,711,556$ 65,263,433$ 66,323,666$ Intergovernmental 21,364,739 19,450,213 17,488,021 17,230,696 18,713,646 19,584,399 20,549,000 21,355,708 22,504,605 23,382,237 Grants and entitlements 9,609,508 11,172,862 10,583,483 9,721,569 11,369,392 15,313,742 13,483,604 11,023,491 10,850,138 11,536,639 Charges for services 3,324,838 3,057,423 2,926,237 3,220,137 3,237,728 2,894,898 2,986,151 4,747,237 3,454,567 4,470,735 Special assessments 2,382 1,510,217 701,447 8,286,453 722,733 2,734,095 1,857,884 2,916,164 202,243 2,031,111 Licenses and permits 1,377,580 1,441,874 739,040 1,681,874 1,656,135 1,952,731 1,866,792 3,153,135 3,013,367 3,794,725 Fines and forfeitures 1,517,558 1,636,157 1,673,306 1,601,044 1,540,989 1,428,401 1,389,663 1,524,856 1,430,686 1,350,689 Rents 1,421,772 1,588,214 1,617,912 1,605,166 1,667,562 1,651,032 1,660,635 1,696,070 1,805,457 1,493,712 Investment earnings 1,366,931 413,594 224,363 296,241 (429,656) 722,878 1,145,686 1,636,650 (476,690) (506,658) Contributions 1,328,524 544,393 166,417 390,253 252,377 541,340 368,057 1,962,364 869,484 634,077 Miscellaneous 381,984 228,969 1,719,608 492,971 1,261,507 1,813,164 645,571 1,404,390 1,123,129 2,015,501
Total revenues 85,251,204 84,244,184 81,638,962 90,103,532 87,076,859 97,443,438 99,678,239 111,131,621 110,040,419 116,526,434
Expenditures:General governmental 9,848,252 7,926,726 7,113,922 7,453,963 8,480,086 9,041,946 14,974,692 14,561,513 16,652,590 19,536,579 Public safety 27,374,083 25,159,777 24,476,615 25,301,495 25,099,149 26,567,511 27,583,880 30,074,183 30,849,989 32,472,034 Public works 1,645,703 1,360,447 1,299,027 1,146,692 1,219,324 1,031,983 1,216,083 1,207,776 1,472,485 1,254,865 Economic and physical development 9,991,927 8,601,808 8,202,024 8,584,826 8,296,367 8,212,772 8,506,794 9,530,781 8,989,673 10,136,274 Culture and recreation 12,158,087 10,615,754 10,782,848 10,576,877 11,292,517 11,446,096 11,029,832 11,441,848 11,854,511 12,629,499 Highways and streets 11,187,402 9,313,158 10,612,033 9,593,074 9,039,032 10,621,311 8,035,221 5,916,632 8,443,609 7,504,589 Debt service:
Principal retirement 5,034,991 6,065,522 6,761,179 13,654,681 6,175,303 8,287,457 8,313,298 12,980,269 14,154,904 6,998,627 Interest and other charges 3,750,657 3,996,963 3,451,706 3,346,253 2,902,196 3,126,469 2,798,182 2,520,596 2,534,621 2,679,888
Capital outlay 30,796,072 12,446,280 11,785,480 11,951,834 16,656,392 24,062,755 16,944,654 16,090,690 14,002,895 40,661,963 Total expenditures 111,787,174 85,486,435 84,484,834 91,609,695 89,160,366 102,398,300 99,402,636 104,324,288 108,955,277 133,874,318
Excess of revenues over (under) expenditures (26,535,970) (1,242,251) (2,845,872) (1,506,163) (2,083,507) (4,954,862) 275,603 6,807,333 1,085,142 (17,347,884)
Other Financing Sources (Uses):Proceeds of refunding bonds - - - 13,924,136 - 8,270,000 - - - - Issuance of capital debt 109,352 8,330,000 - 16,797,287 12,474,557 6,600,000 - 204,956 26,168,531 9,700,000 Payment to bond refunding escrow agent - - - (15,394,336) - (9,382,710) - - - - Bond premium - 58,370 - 2,264,386 542,689 1,317,667 - - 3,500,813 449,519 Insurance recoveries - 1,920,000 1,058,985 - - - - - - - Sale of capital assets 63,894 1,084,211 45,655 43,890 49,750 727,996 3,013,051 5,325 - 121,200 Transfers in 21,626,308 15,224,243 13,661,630 14,872,935 12,870,788 12,102,855 17,376,813 15,891,921 22,308,323 27,563,166 Transfers out (23,359,573) (18,525,100) (14,268,052) (15,074,950) (12,458,747) (11,659,441) (16,384,283) (15,231,349) (23,469,870) (20,964,729)
Total other financing sources (uses) (1,560,019) 8,091,724 498,218 17,433,348 13,479,037 7,976,367 4,005,581 870,853 28,507,797 16,869,156
Net change in fund balances (28,095,989)$ 6,849,473$ (2,347,654)$ 15,927,185$ 11,395,530$ 3,021,505$ 4,281,184$ 7,678,186$ 29,592,939$ (478,728)$
Debt service as a percentage ofnon capital expenditures 10.85% 13.78% 14.05% 21.34% 12.52% 14.57% 13.48% 17.57% 17.58% 10.38%
Fiscal Year
141
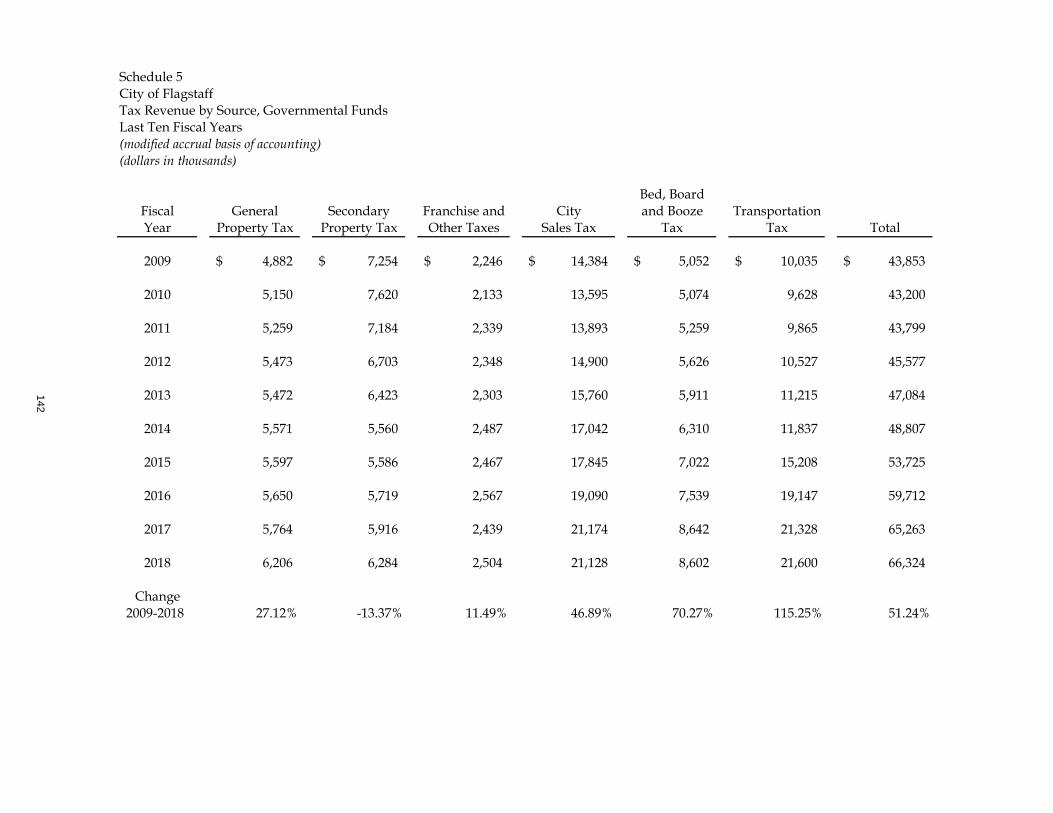
Schedule 5City of FlagstaffTax Revenue by Source, Governmental FundsLast Ten Fiscal Years(modified accrual basis of accounting)(dollars in thousands)
Bed, BoardFiscal General Secondary Franchise and City and Booze TransportationYear Property Tax Property Tax Other Taxes Sales Tax Tax Tax Total
2009 4,882$ 7,254$ 2,246$ 14,384$ 5,052$ 10,035$ 43,853$
2010 5,150 7,620 2,133 13,595 5,074 9,628 43,200
2011 5,259 7,184 2,339 13,893 5,259 9,865 43,799
2012 5,473 6,703 2,348 14,900 5,626 10,527 45,577
2013 5,472 6,423 2,303 15,760 5,911 11,215 47,084
2014 5,571 5,560 2,487 17,042 6,310 11,837 48,807
2015 5,597 5,586 2,467 17,845 7,022 15,208 53,725
2016 5,650 5,719 2,567 19,090 7,539 19,147 59,712
2017 5,764 5,916 2,439 21,174 8,642 21,328 65,263
2018 6,206 6,284 2,504 21,128 8,602 21,600 66,324
Change 2009-2018 27.12% -13.37% 11.49% 46.89% 70.27% 115.25% 51.24%
142
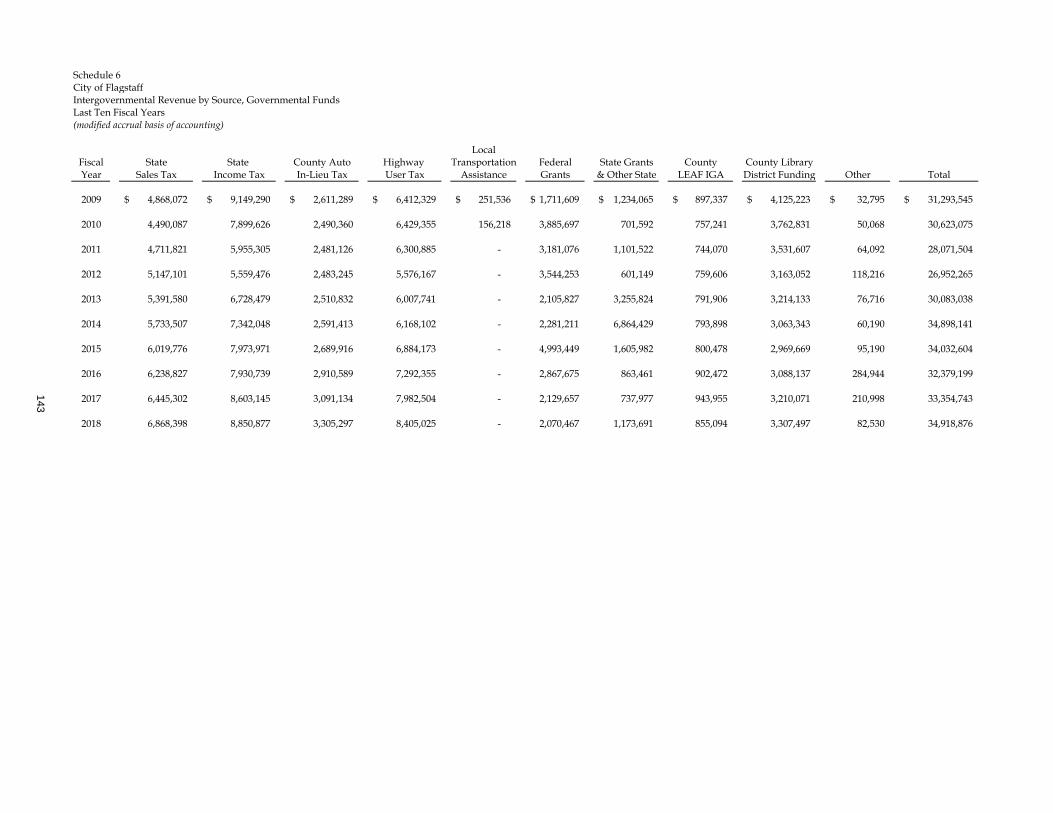
Schedule 6City of FlagstaffIntergovernmental Revenue by Source, Governmental FundsLast Ten Fiscal Years(modified accrual basis of accounting)
LocalFiscal State State County Auto Highway Transportation Federal State Grants County County LibraryYear Sales Tax Income Tax In-Lieu Tax User Tax Assistance Grants & Other State LEAF IGA District Funding Other Total
2009 4,868,072$ 9,149,290$ 2,611,289$ 6,412,329$ 251,536$ 1,711,609$ 1,234,065$ 897,337$ 4,125,223$ 32,795$ 31,293,545$
2010 4,490,087 7,899,626 2,490,360 6,429,355 156,218 3,885,697 701,592 757,241 3,762,831 50,068 30,623,075
2011 4,711,821 5,955,305 2,481,126 6,300,885 - 3,181,076 1,101,522 744,070 3,531,607 64,092 28,071,504
2012 5,147,101 5,559,476 2,483,245 5,576,167 - 3,544,253 601,149 759,606 3,163,052 118,216 26,952,265
2013 5,391,580 6,728,479 2,510,832 6,007,741 - 2,105,827 3,255,824 791,906 3,214,133 76,716 30,083,038
2014 5,733,507 7,342,048 2,591,413 6,168,102 - 2,281,211 6,864,429 793,898 3,063,343 60,190 34,898,141
2015 6,019,776 7,973,971 2,689,916 6,884,173 - 4,993,449 1,605,982 800,478 2,969,669 95,190 34,032,604
2016 6,238,827 7,930,739 2,910,589 7,292,355 - 2,867,675 863,461 902,472 3,088,137 284,944 32,379,199
2017 6,445,302 8,603,145 3,091,134 7,982,504 - 2,129,657 737,977 943,955 3,210,071 210,998 33,354,743
2018 6,868,398 8,850,877 3,305,297 8,405,025 - 2,070,467 1,173,691 855,094 3,307,497 82,530 34,918,876
143
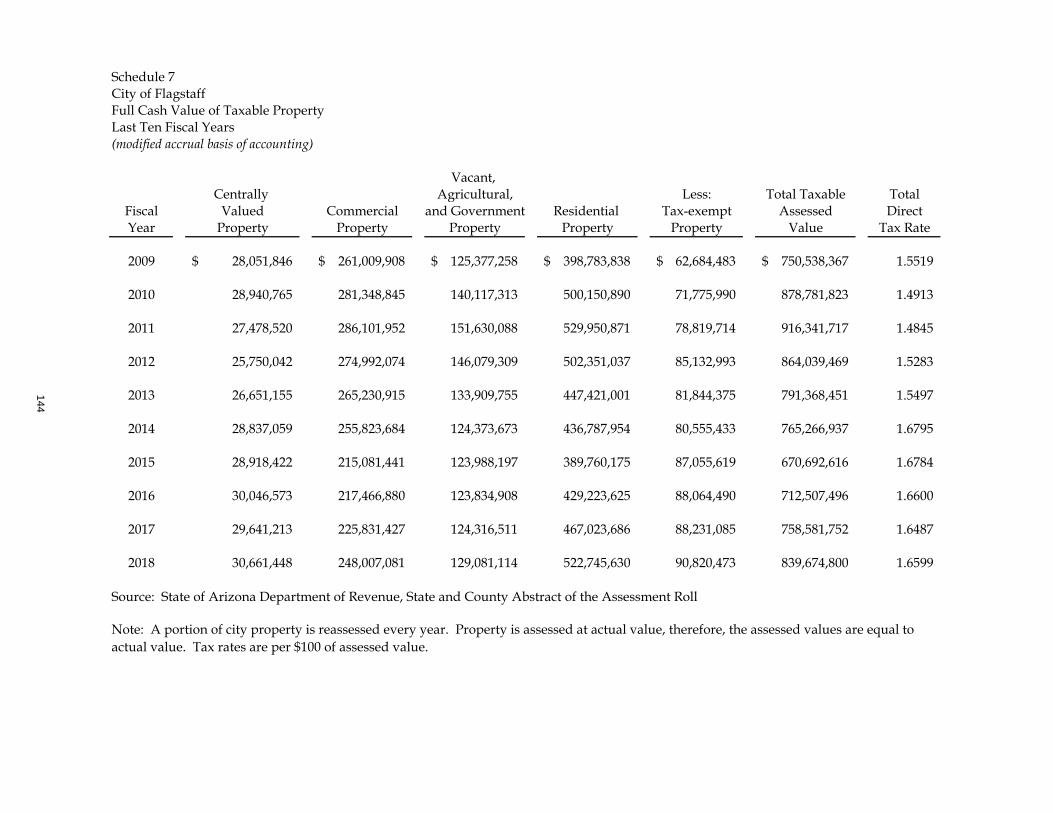
Schedule 7City of FlagstaffFull Cash Value of Taxable PropertyLast Ten Fiscal Years(modified accrual basis of accounting)
Vacant, Centrally Agricultural, Less: Total Taxable Total
Fiscal Valued Commercial and Government Residential Tax-exempt Assessed DirectYear Property Property Property Property Property Value Tax Rate
2009 28,051,846$ 261,009,908$ 125,377,258$ 398,783,838$ 62,684,483$ 750,538,367$ 1.5519
2010 28,940,765 281,348,845 140,117,313 500,150,890 71,775,990 878,781,823 1.4913
2011 27,478,520 286,101,952 151,630,088 529,950,871 78,819,714 916,341,717 1.4845
2012 25,750,042 274,992,074 146,079,309 502,351,037 85,132,993 864,039,469 1.5283
2013 26,651,155 265,230,915 133,909,755 447,421,001 81,844,375 791,368,451 1.5497
2014 28,837,059 255,823,684 124,373,673 436,787,954 80,555,433 765,266,937 1.6795
2015 28,918,422 215,081,441 123,988,197 389,760,175 87,055,619 670,692,616 1.6784
2016 30,046,573 217,466,880 123,834,908 429,223,625 88,064,490 712,507,496 1.6600
2017 29,641,213 225,831,427 124,316,511 467,023,686 88,231,085 758,581,752 1.6487
2018 30,661,448 248,007,081 129,081,114 522,745,630 90,820,473 839,674,800 1.6599
Source: State of Arizona Department of Revenue, State and County Abstract of the Assessment Roll
Note: A portion of city property is reassessed every year. Property is assessed at actual value, therefore, the assessed values are equal to actual value. Tax rates are per $100 of assessed value.
144
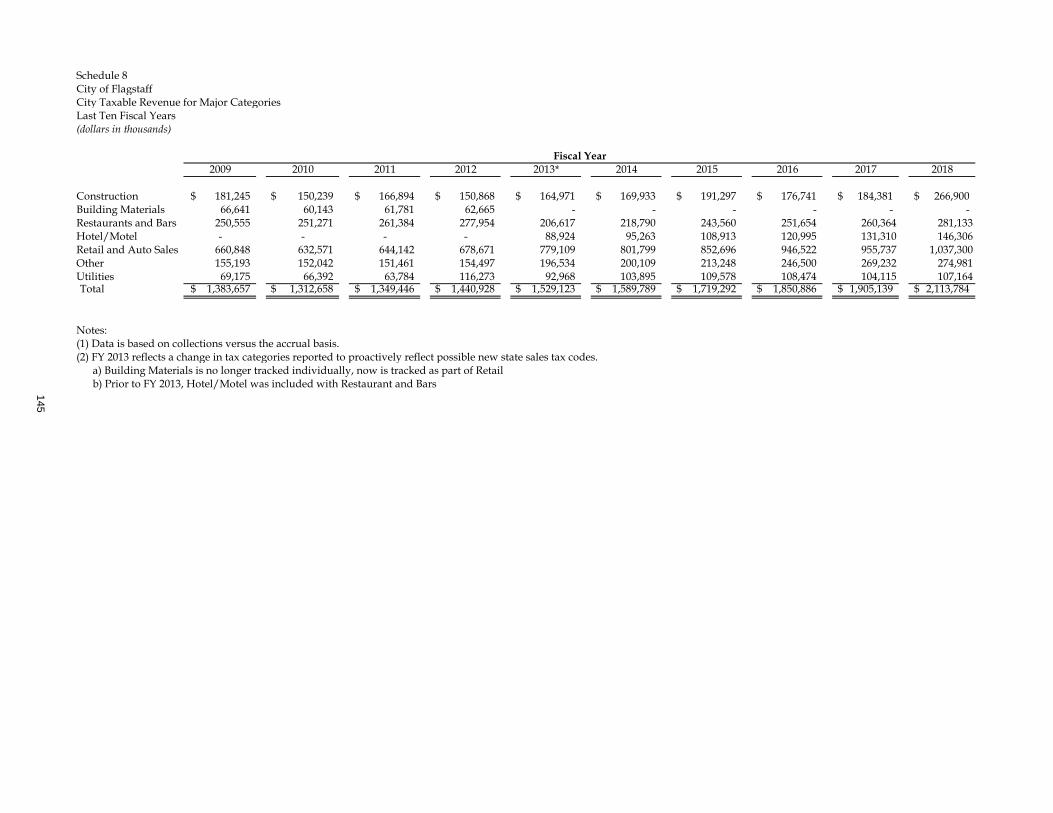
Schedule 8City of FlagstaffCity Taxable Revenue for Major CategoriesLast Ten Fiscal Years(dollars in thousands)
2009 2010 2011 2012 2013* 2014 2015 2016 2017 2018
Construction 181,245$ 150,239$ 166,894$ 150,868$ 164,971$ 169,933$ 191,297$ 176,741$ 184,381$ 266,900$ Building Materials 66,641 60,143 61,781 62,665 - - - - - - Restaurants and Bars 250,555 251,271 261,384 277,954 206,617 218,790 243,560 251,654 260,364 281,133Hotel/Motel - - - - 88,924 95,263 108,913 120,995 131,310 146,306Retail and Auto Sales 660,848 632,571 644,142 678,671 779,109 801,799 852,696 946,522 955,737 1,037,300Other 155,193 152,042 151,461 154,497 196,534 200,109 213,248 246,500 269,232 274,981Utilities 69,175 66,392 63,784 116,273 92,968 103,895 109,578 108,474 104,115 107,164Total 1,383,657$ 1,312,658$ 1,349,446$ 1,440,928$ 1,529,123$ 1,589,789$ 1,719,292$ 1,850,886$ 1,905,139$ 2,113,784$
Notes: (1) Data is based on collections versus the accrual basis.(2) FY 2013 reflects a change in tax categories reported to proactively reflect possible new state sales tax codes. a) Building Materials is no longer tracked individually, now is tracked as part of Retail b) Prior to FY 2013, Hotel/Motel was included with Restaurant and Bars
Fiscal Year
145
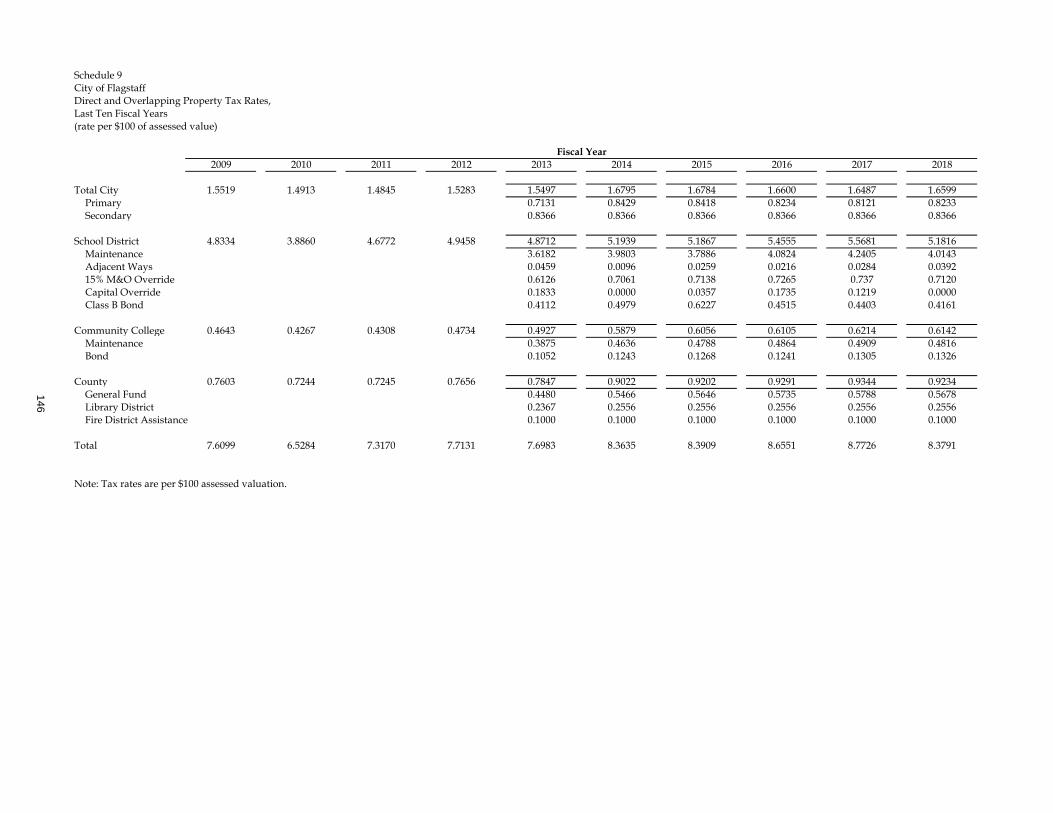
Schedule 9City of FlagstaffDirect and Overlapping Property Tax Rates,Last Ten Fiscal Years(rate per $100 of assessed value)
2009 2010 2011 2012 2013 2014 2015 2016 2017 2018
Total City 1.5519 1.4913 1.4845 1.5283 1.5497 1.6795 1.6784 1.6600 1.6487 1.6599Primary 0.7131 0.8429 0.8418 0.8234 0.8121 0.8233Secondary 0.8366 0.8366 0.8366 0.8366 0.8366 0.8366
School District 4.8334 3.8860 4.6772 4.9458 4.8712 5.1939 5.1867 5.4555 5.5681 5.1816Maintenance 3.6182 3.9803 3.7886 4.0824 4.2405 4.0143Adjacent Ways 0.0459 0.0096 0.0259 0.0216 0.0284 0.039215% M&O Override 0.6126 0.7061 0.7138 0.7265 0.737 0.7120Capital Override 0.1833 0.0000 0.0357 0.1735 0.1219 0.0000Class B Bond 0.4112 0.4979 0.6227 0.4515 0.4403 0.4161
Community College 0.4643 0.4267 0.4308 0.4734 0.4927 0.5879 0.6056 0.6105 0.6214 0.6142Maintenance 0.3875 0.4636 0.4788 0.4864 0.4909 0.4816Bond 0.1052 0.1243 0.1268 0.1241 0.1305 0.1326
County 0.7603 0.7244 0.7245 0.7656 0.7847 0.9022 0.9202 0.9291 0.9344 0.9234General Fund 0.4480 0.5466 0.5646 0.5735 0.5788 0.5678Library District 0.2367 0.2556 0.2556 0.2556 0.2556 0.2556Fire District Assistance 0.1000 0.1000 0.1000 0.1000 0.1000 0.1000
Total 7.6099 6.5284 7.3170 7.7131 7.6983 8.3635 8.3909 8.6551 8.7726 8.3791
Note: Tax rates are per $100 assessed valuation.
Fiscal Year
146
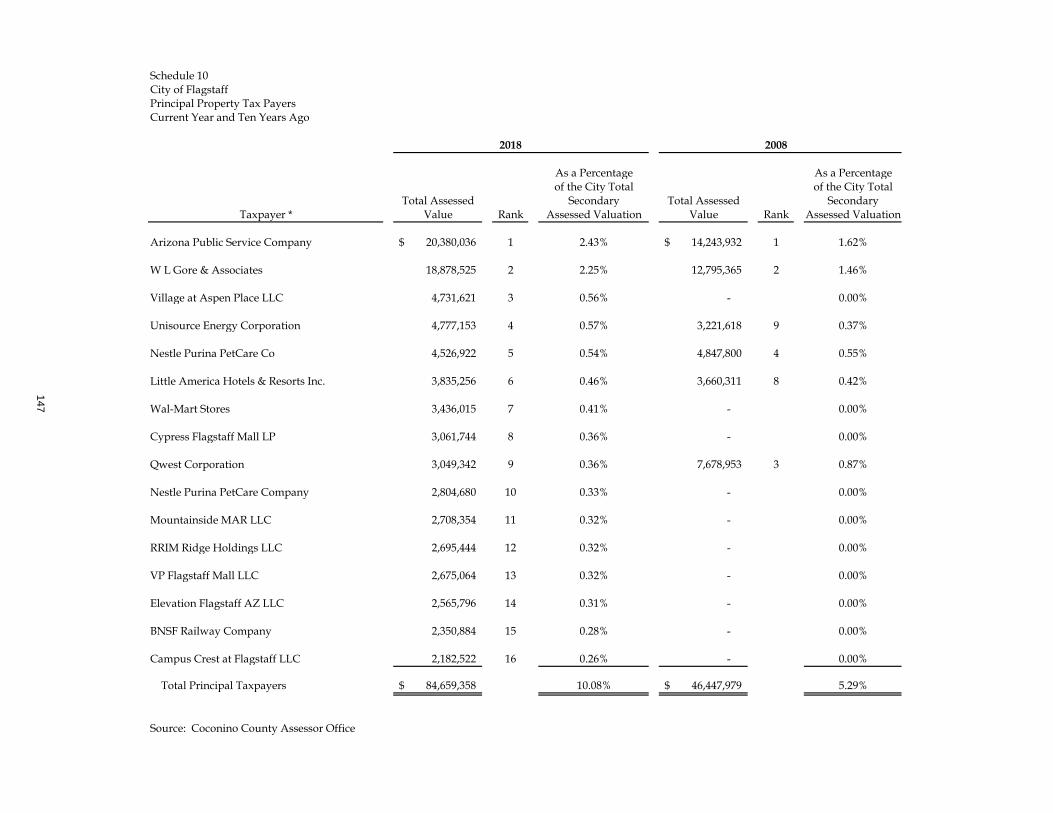
Schedule 10City of FlagstaffPrincipal Property Tax PayersCurrent Year and Ten Years Ago
2018 2008
As a Percentage As a Percentageof the City Total of the City Total
Total Assessed Secondary Total Assessed SecondaryTaxpayer * Value Rank Assessed Valuation Value Rank Assessed Valuation
Arizona Public Service Company 20,380,036$ 1 2.43% 14,243,932$ 1 1.62%
W L Gore & Associates 18,878,525 2 2.25% 12,795,365 2 1.46%
Village at Aspen Place LLC 4,731,621 3 0.56% - 0.00%
Unisource Energy Corporation 4,777,153 4 0.57% 3,221,618 9 0.37%
Nestle Purina PetCare Co 4,526,922 5 0.54% 4,847,800 4 0.55%
Little America Hotels & Resorts Inc. 3,835,256 6 0.46% 3,660,311 8 0.42%
Wal-Mart Stores 3,436,015 7 0.41% - 0.00%
Cypress Flagstaff Mall LP 3,061,744 8 0.36% - 0.00%
Qwest Corporation 3,049,342 9 0.36% 7,678,953 3 0.87%
Nestle Purina PetCare Company 2,804,680 10 0.33% - 0.00%
Mountainside MAR LLC 2,708,354 11 0.32% - 0.00%
RRIM Ridge Holdings LLC 2,695,444 12 0.32% - 0.00%
VP Flagstaff Mall LLC 2,675,064 13 0.32% - 0.00%
Elevation Flagstaff AZ LLC 2,565,796 14 0.31% - 0.00%
BNSF Railway Company 2,350,884 15 0.28% - 0.00%
Campus Crest at Flagstaff LLC 2,182,522 16 0.26% - 0.00%
Total Principal Taxpayers 84,659,358$ 10.08% 46,447,979$ 5.29%
Source: Coconino County Assessor Office
147
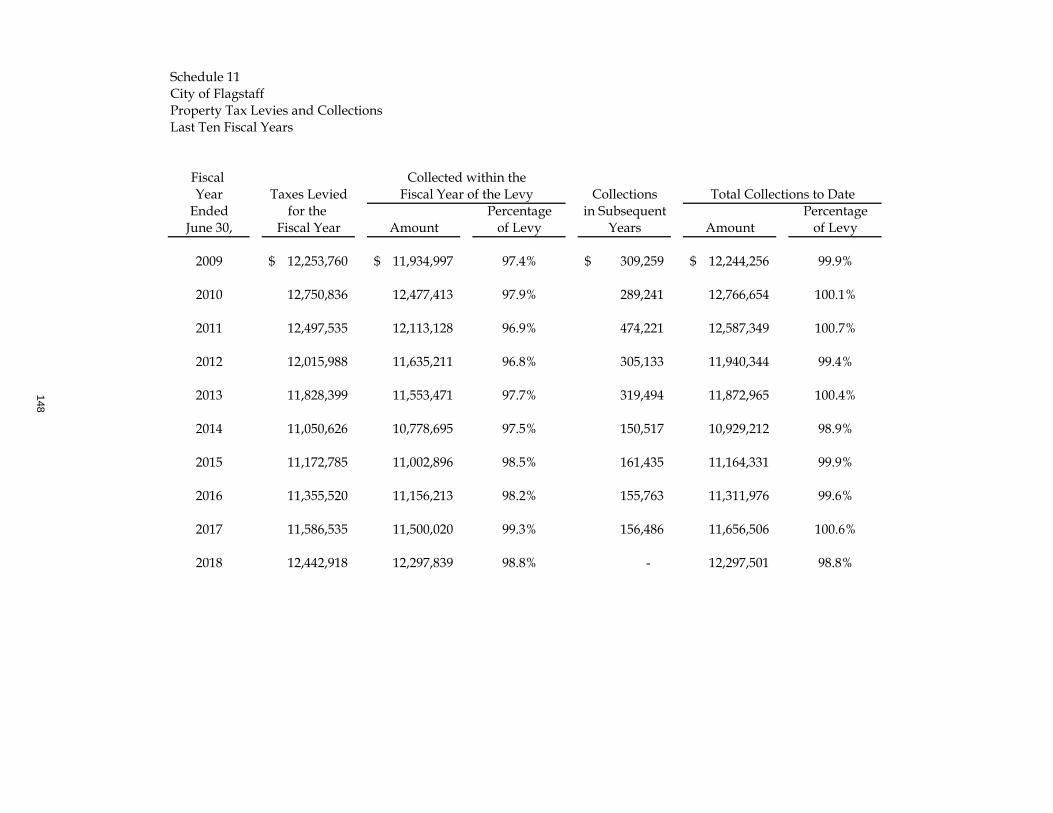
Schedule 11City of FlagstaffProperty Tax Levies and CollectionsLast Ten Fiscal Years
Fiscal Collected within theYear Taxes Levied Fiscal Year of the Levy Collections Total Collections to Date
Ended for the Percentage in Subsequent PercentageJune 30, Fiscal Year Amount of Levy Years Amount of Levy
2009 12,253,760$ 11,934,997$ 97.4% 309,259$ 12,244,256$ 99.9%
2010 12,750,836 12,477,413 97.9% 289,241 12,766,654 100.1%
2011 12,497,535 12,113,128 96.9% 474,221 12,587,349 100.7%
2012 12,015,988 11,635,211 96.8% 305,133 11,940,344 99.4%
2013 11,828,399 11,553,471 97.7% 319,494 11,872,965 100.4%
2014 11,050,626 10,778,695 97.5% 150,517 10,929,212 98.9%
2015 11,172,785 11,002,896 98.5% 161,435 11,164,331 99.9%
2016 11,355,520 11,156,213 98.2% 155,763 11,311,976 99.6%
2017 11,586,535 11,500,020 99.3% 156,486 11,656,506 100.6%
2018 12,442,918 12,297,839 98.8% - 12,297,501 98.8%
148
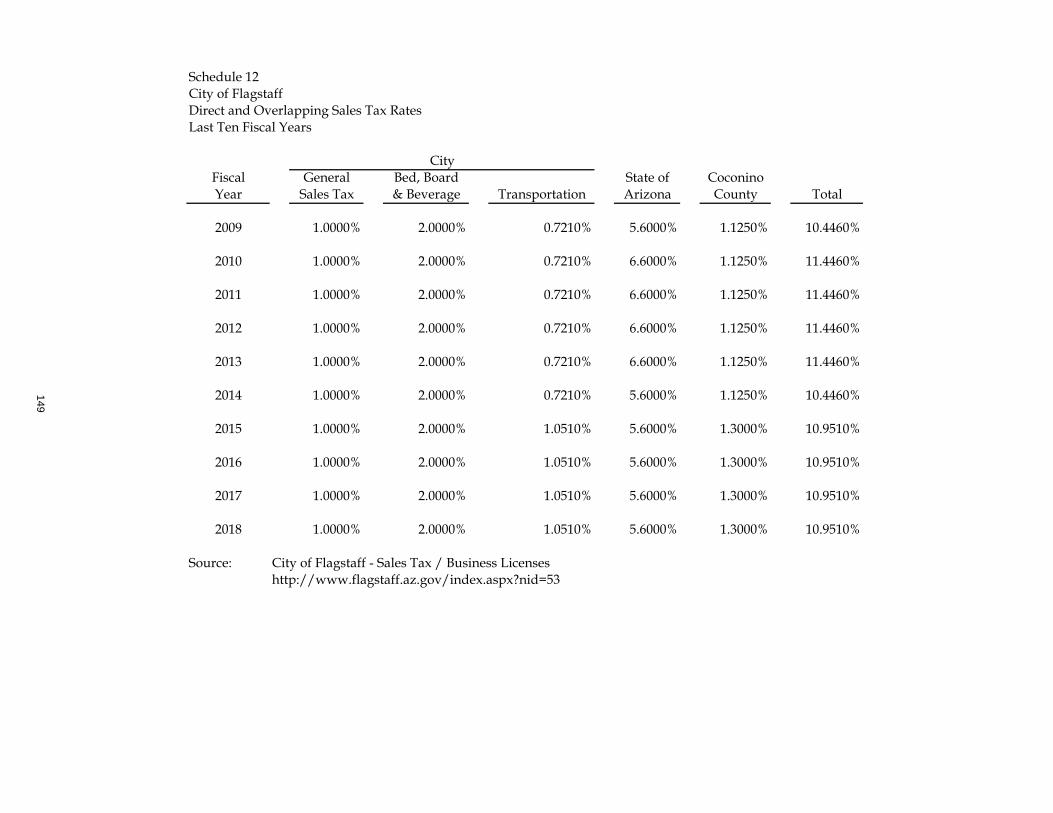
Schedule 12City of FlagstaffDirect and Overlapping Sales Tax RatesLast Ten Fiscal Years
CityFiscal General Bed, Board State of CoconinoYear Sales Tax & Beverage Transportation Arizona County Total
2009 1.0000% 2.0000% 0.7210% 5.6000% 1.1250% 10.4460%
2010 1.0000% 2.0000% 0.7210% 6.6000% 1.1250% 11.4460%
2011 1.0000% 2.0000% 0.7210% 6.6000% 1.1250% 11.4460%
2012 1.0000% 2.0000% 0.7210% 6.6000% 1.1250% 11.4460%
2013 1.0000% 2.0000% 0.7210% 6.6000% 1.1250% 11.4460%
2014 1.0000% 2.0000% 0.7210% 5.6000% 1.1250% 10.4460%
2015 1.0000% 2.0000% 1.0510% 5.6000% 1.3000% 10.9510%
2016 1.0000% 2.0000% 1.0510% 5.6000% 1.3000% 10.9510%
2017 1.0000% 2.0000% 1.0510% 5.6000% 1.3000% 10.9510%
2018 1.0000% 2.0000% 1.0510% 5.6000% 1.3000% 10.9510%
Source: City of Flagstaff - Sales Tax / Business Licenseshttp://www.flagstaff.az.gov/index.aspx?nid=53
149
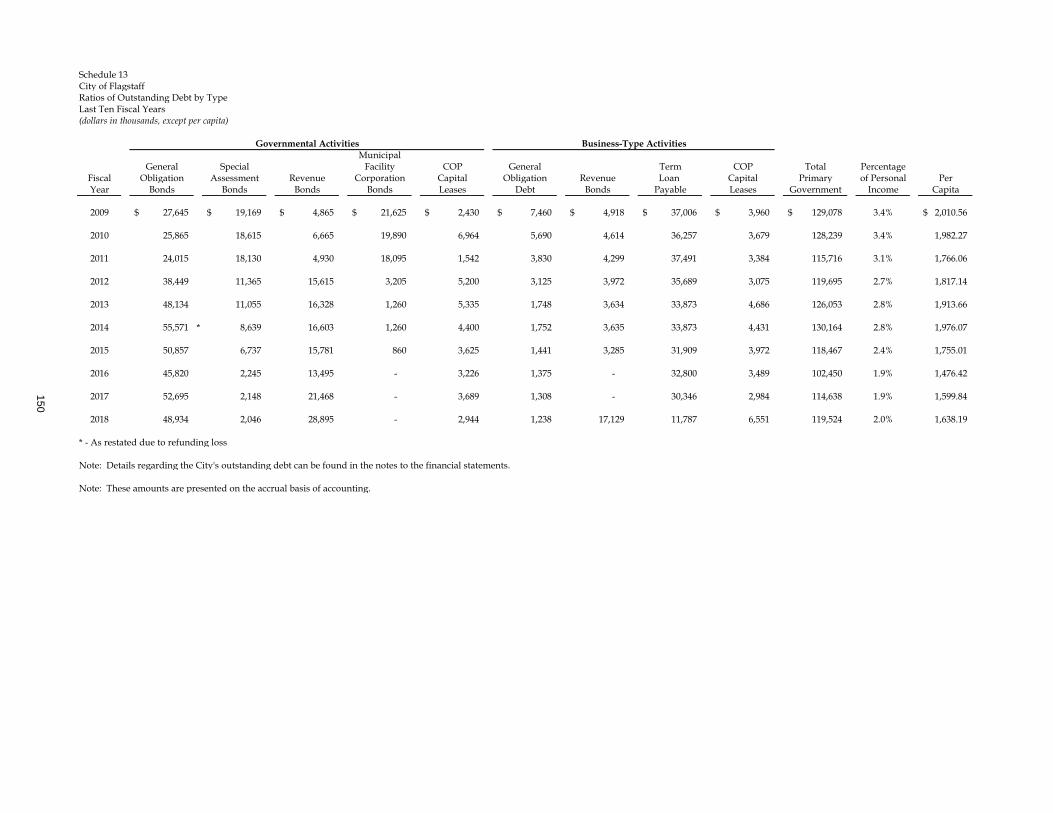
Schedule 13City of FlagstaffRatios of Outstanding Debt by TypeLast Ten Fiscal Years(dollars in thousands, except per capita)
Governmental Activities Business-Type ActivitiesMunicipal
General Special Facility COP General Term COP Total PercentageFiscal Obligation Assessment Revenue Corporation Capital Obligation Revenue Loan Capital Primary of Personal PerYear Bonds Bonds Bonds Bonds Leases Debt Bonds Payable Leases Government Income Capita
2009 27,645$ 19,169$ 4,865$ 21,625$ 2,430$ 7,460$ 4,918$ 37,006$ 3,960$ 129,078$ 3.4% 2,010.56$
2010 25,865 18,615 6,665 19,890 6,964 5,690 4,614 36,257 3,679 128,239 3.4% 1,982.27
2011 24,015 18,130 4,930 18,095 1,542 3,830 4,299 37,491 3,384 115,716 3.1% 1,766.06
2012 38,449 11,365 15,615 3,205 5,200 3,125 3,972 35,689 3,075 119,695 2.7% 1,817.14
2013 48,134 11,055 16,328 1,260 5,335 1,748 3,634 33,873 4,686 126,053 2.8% 1,913.66
2014 55,571 * 8,639 16,603 1,260 4,400 1,752 3,635 33,873 4,431 130,164 2.8% 1,976.07
2015 50,857 6,737 15,781 860 3,625 1,441 3,285 31,909 3,972 118,467 2.4% 1,755.01
2016 45,820 2,245 13,495 - 3,226 1,375 - 32,800 3,489 102,450 1.9% 1,476.42
2017 52,695 2,148 21,468 - 3,689 1,308 - 30,346 2,984 114,638 1.9% 1,599.84
2018 48,934 2,046 28,895 - 2,944 1,238 17,129 11,787 6,551 119,524 2.0% 1,638.19
* - As restated due to refunding loss
Note: Details regarding the City's outstanding debt can be found in the notes to the financial statements.
Note: These amounts are presented on the accrual basis of accounting.
150
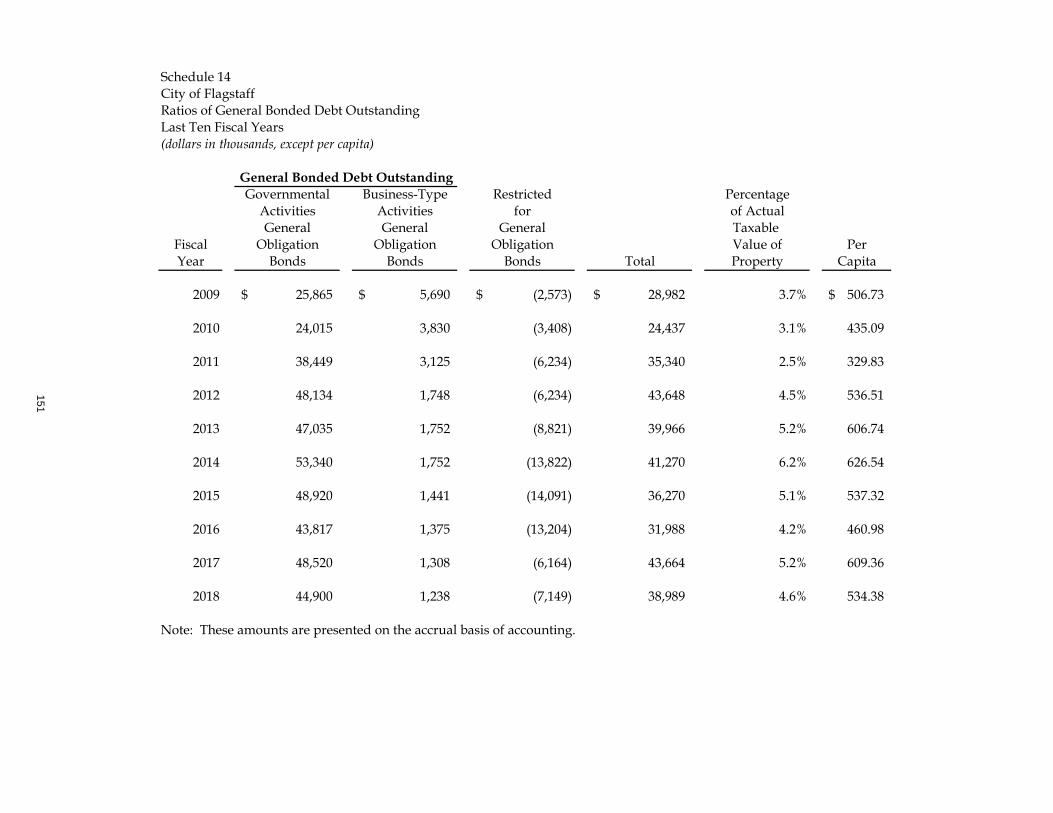
Schedule 14City of FlagstaffRatios of General Bonded Debt OutstandingLast Ten Fiscal Years(dollars in thousands, except per capita)
Governmental Business-Type Restricted PercentageActivities Activities for of ActualGeneral General General Taxable
Fiscal Obligation Obligation Obligation Value of PerYear Bonds Bonds Bonds Total Property Capita
2009 25,865$ 5,690$ (2,573)$ 28,982$ 3.7% 506.73$
2010 24,015 3,830 (3,408) 24,437 3.1% 435.09
2011 38,449 3,125 (6,234) 35,340 2.5% 329.83
2012 48,134 1,748 (6,234) 43,648 4.5% 536.51
2013 47,035 1,752 (8,821) 39,966 5.2% 606.74
2014 53,340 1,752 (13,822) 41,270 6.2% 626.54
2015 48,920 1,441 (14,091) 36,270 5.1% 537.32
2016 43,817 1,375 (13,204) 31,988 4.2% 460.98
2017 48,520 1,308 (6,164) 43,664 5.2% 609.36
2018 44,900 1,238 (7,149) 38,989 4.6% 534.38
Note: These amounts are presented on the accrual basis of accounting.
General Bonded Debt Outstanding
151
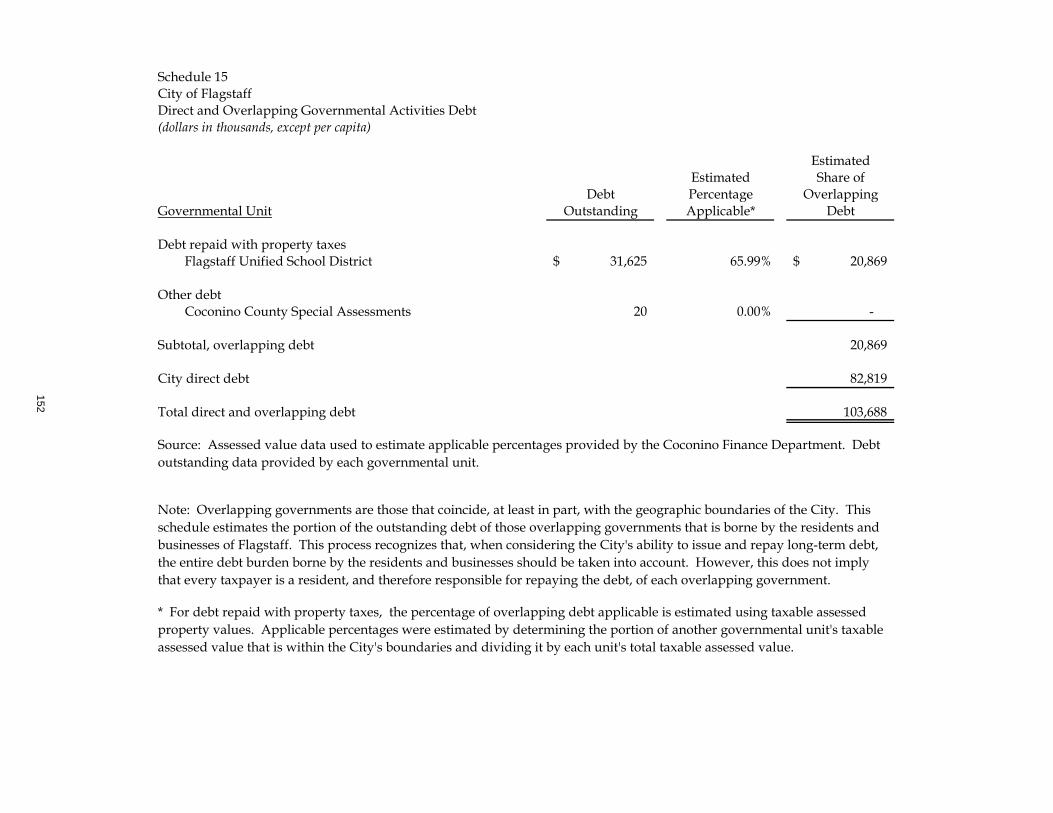
Schedule 15City of FlagstaffDirect and Overlapping Governmental Activities Debt(dollars in thousands, except per capita)
EstimatedEstimated Share of
Debt Percentage OverlappingGovernmental Unit Outstanding Applicable* Debt
Debt repaid with property taxesFlagstaff Unified School District 31,625$ 65.99% 20,869$
Other debtCoconino County Special Assessments 20 0.00% -
Subtotal, overlapping debt 20,869
City direct debt 82,819
Total direct and overlapping debt 103,688
Source: Assessed value data used to estimate applicable percentages provided by the Coconino Finance Department. Debt outstanding data provided by each governmental unit.
Note: Overlapping governments are those that coincide, at least in part, with the geographic boundaries of the City. This schedule estimates the portion of the outstanding debt of those overlapping governments that is borne by the residents and businesses of Flagstaff. This process recognizes that, when considering the City's ability to issue and repay long-term debt, the entire debt burden borne by the residents and businesses should be taken into account. However, this does not imply that every taxpayer is a resident, and therefore responsible for repaying the debt, of each overlapping government.
* For debt repaid with property taxes, the percentage of overlapping debt applicable is estimated using taxable assessedproperty values. Applicable percentages were estimated by determining the portion of another governmental unit's taxableassessed value that is within the City's boundaries and dividing it by each unit's total taxable assessed value.
152
153
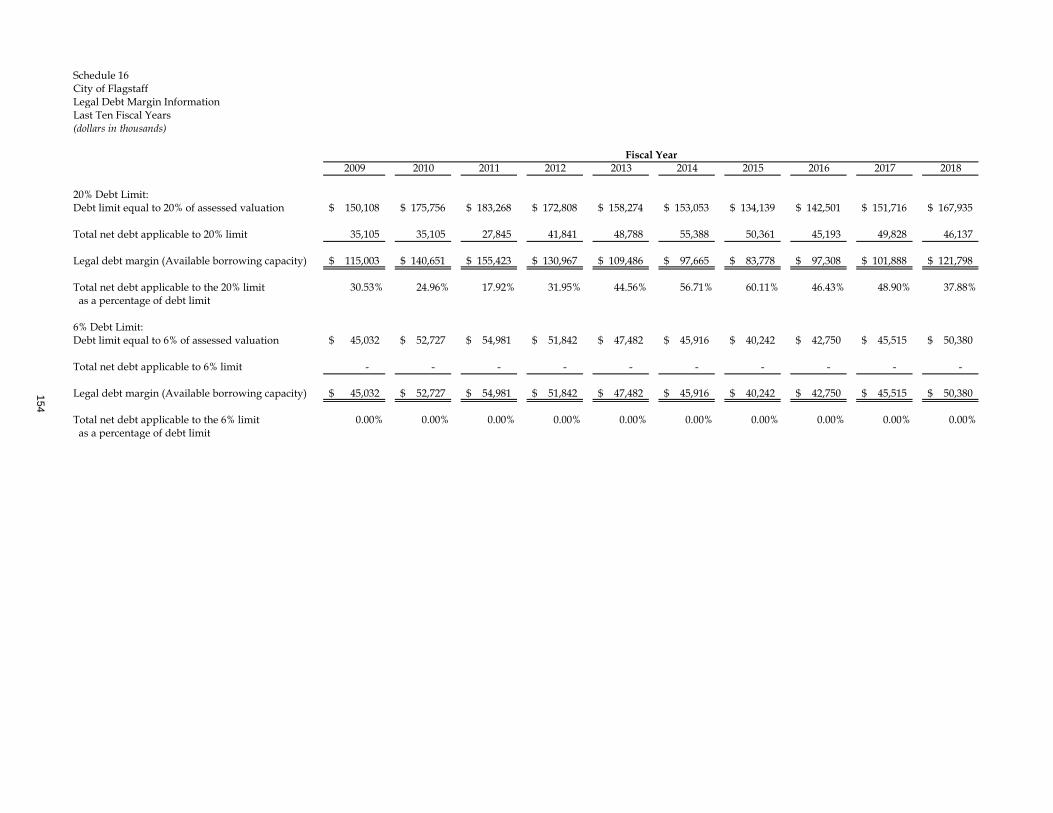
Schedule 16City of FlagstaffLegal Debt Margin InformationLast Ten Fiscal Years(dollars in thousands)
2009 2010 2011 2012 2013 2014 2015 2016 2017 2018
20% Debt Limit:150,108$ 175,756$ 183,268$ 172,808$ 158,274$ 153,053$ 134,139$ 142,501$ 151,716$ 167,935$
Total net debt applicable to 20% limit 35,105 35,105 27,845 41,841 48,788 55,388 50,361 45,193 49,828 46,137
115,003$ 140,651$ 155,423$ 130,967$ 109,486$ 97,665$ 83,778$ 97,308$ 101,888$ 121,798$
Total net debt applicable to the 20% limit 30.53% 24.96% 17.92% 31.95% 44.56% 56.71% 60.11% 46.43% 48.90% 37.88% as a percentage of debt limit
6% Debt Limit:45,032$ 52,727$ 54,981$ 51,842$ 47,482$ 45,916$ 40,242$ 42,750$ 45,515$ 50,380$
Total net debt applicable to 6% limit - - - - - - - - - -
45,032$ 52,727$ 54,981$ 51,842$ 47,482$ 45,916$ 40,242$ 42,750$ 45,515$ 50,380$
Total net debt applicable to the 6% limit 0.00% 0.00% 0.00% 0.00% 0.00% 0.00% 0.00% 0.00% 0.00% 0.00% as a percentage of debt limit
Debt limit equal to 6% of assessed valuation
Legal debt margin (Available borrowing capacity)
Debt limit equal to 20% of assessed valuation
Legal debt margin (Available borrowing capacity)
Fiscal Year
154
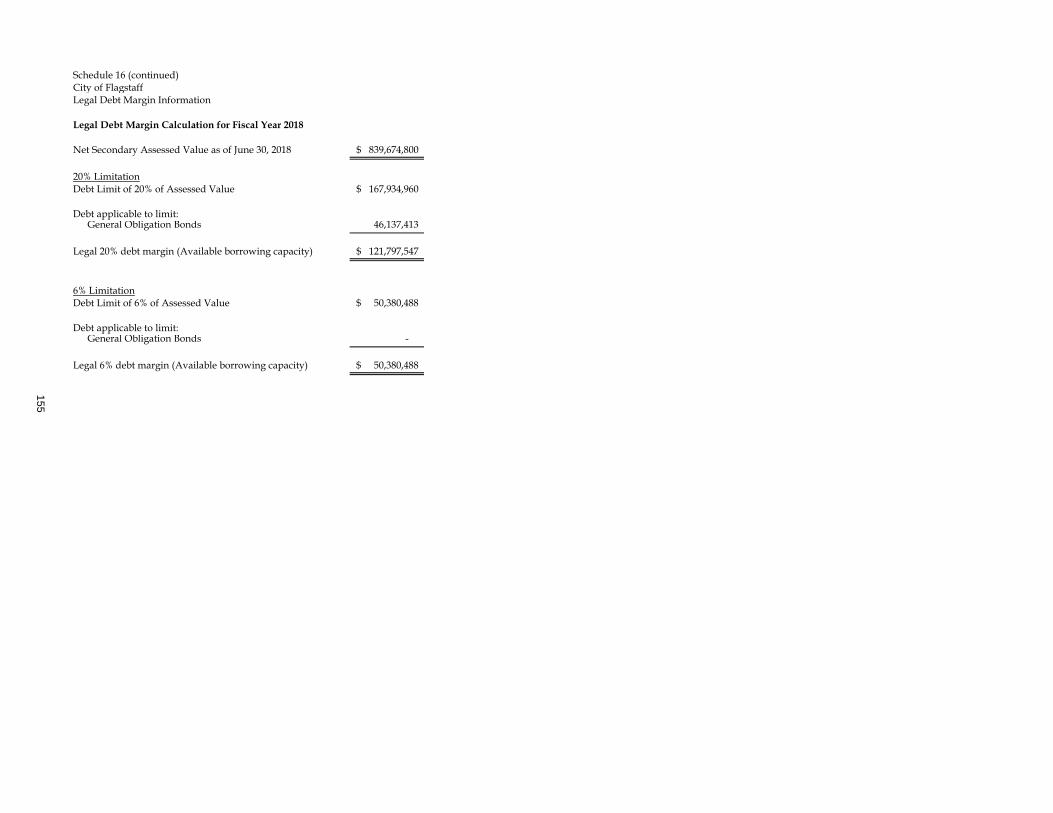
Schedule 16 (continued)City of FlagstaffLegal Debt Margin Information
Legal Debt Margin Calculation for Fiscal Year 2018
Net Secondary Assessed Value as of June 30, 2018 839,674,800$
20% LimitationDebt Limit of 20% of Assessed Value 167,934,960$
Debt applicable to limit:General Obligation Bonds 46,137,413
Legal 20% debt margin (Available borrowing capacity) 121,797,547$
6% LimitationDebt Limit of 6% of Assessed Value 50,380,488$
Debt applicable to limit:General Obligation Bonds -
Legal 6% debt margin (Available borrowing capacity) 50,380,488$
155
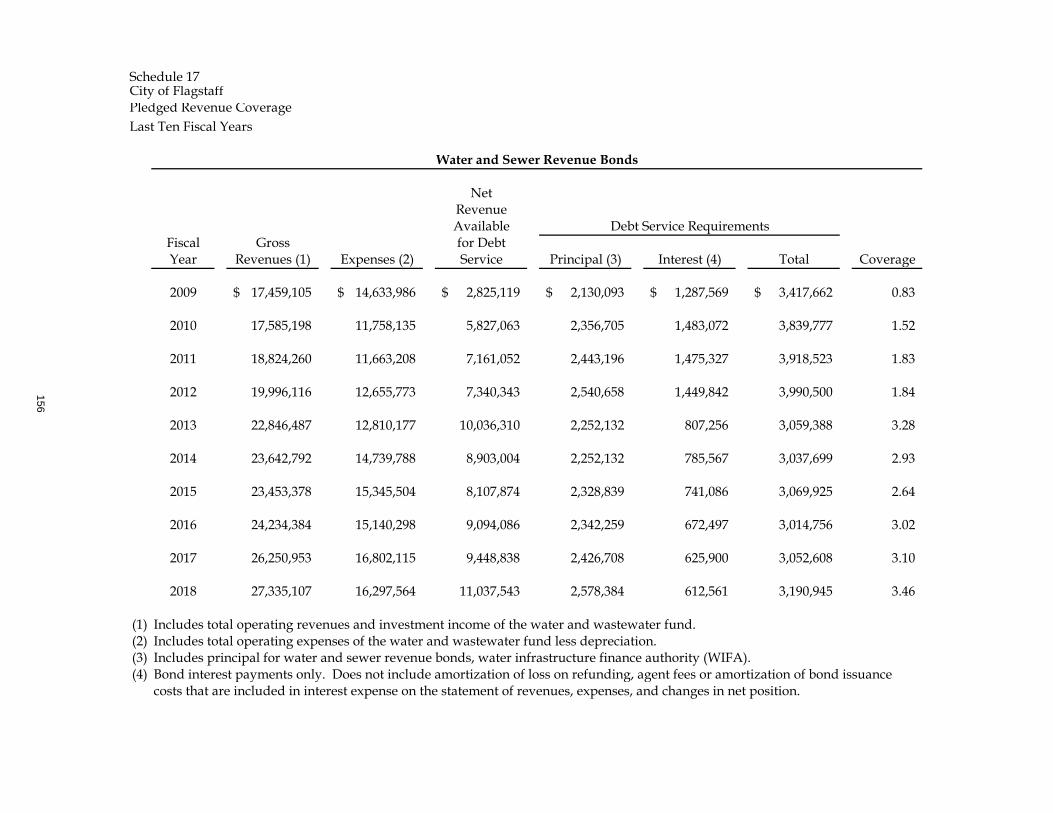
Schedule 17City of FlagstaffPledged Revenue CoverageLast Ten Fiscal Years
NetRevenueAvailable
Fiscal Gross for DebtYear Revenues (1) Expenses (2) Service Principal (3) Interest (4) Total Coverage
2009 17,459,105$ 14,633,986$ 2,825,119$ 2,130,093$ 1,287,569$ 3,417,662$ 0.83
2010 17,585,198 11,758,135 5,827,063 2,356,705 1,483,072 3,839,777 1.52
2011 18,824,260 11,663,208 7,161,052 2,443,196 1,475,327 3,918,523 1.83
2012 19,996,116 12,655,773 7,340,343 2,540,658 1,449,842 3,990,500 1.84
2013 22,846,487 12,810,177 10,036,310 2,252,132 807,256 3,059,388 3.28
2014 23,642,792 14,739,788 8,903,004 2,252,132 785,567 3,037,699 2.93
2015 23,453,378 15,345,504 8,107,874 2,328,839 741,086 3,069,925 2.64
2016 24,234,384 15,140,298 9,094,086 2,342,259 672,497 3,014,756 3.02
2017 26,250,953 16,802,115 9,448,838 2,426,708 625,900 3,052,608 3.10
2018 27,335,107 16,297,564 11,037,543 2,578,384 612,561 3,190,945 3.46
(1) Includes total operating revenues and investment income of the water and wastewater fund.(2) Includes total operating expenses of the water and wastewater fund less depreciation.(3) Includes principal for water and sewer revenue bonds, water infrastructure finance authority (WIFA).(4) Bond interest payments only. Does not include amortization of loss on refunding, agent fees or amortization of bond issuance
costs that are included in interest expense on the statement of revenues, expenses, and changes in net position.
Debt Service Requirements
Water and Sewer Revenue Bonds
156
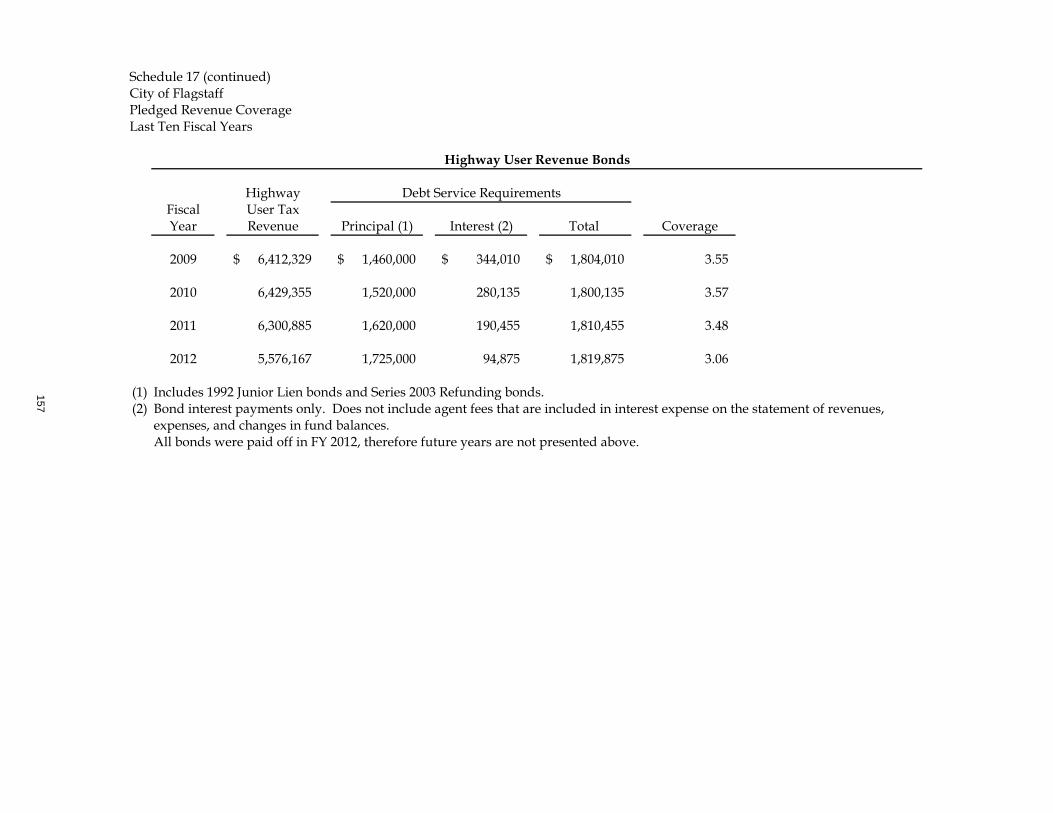
Schedule 17 (continued)City of FlagstaffPledged Revenue CoverageLast Ten Fiscal Years
Highway Debt Service RequirementsFiscal User TaxYear Revenue Principal (1) Interest (2) Total Coverage
2009 6,412,329$ 1,460,000$ 344,010$ 1,804,010$ 3.55
2010 6,429,355 1,520,000 280,135 1,800,135 3.57
2011 6,300,885 1,620,000 190,455 1,810,455 3.48
2012 5,576,167 1,725,000 94,875 1,819,875 3.06
(1) Includes 1992 Junior Lien bonds and Series 2003 Refunding bonds.(2) Bond interest payments only. Does not include agent fees that are included in interest expense on the statement of revenues,
expenses, and changes in fund balances.All bonds were paid off in FY 2012, therefore future years are not presented above.
Highway User Revenue Bonds
157
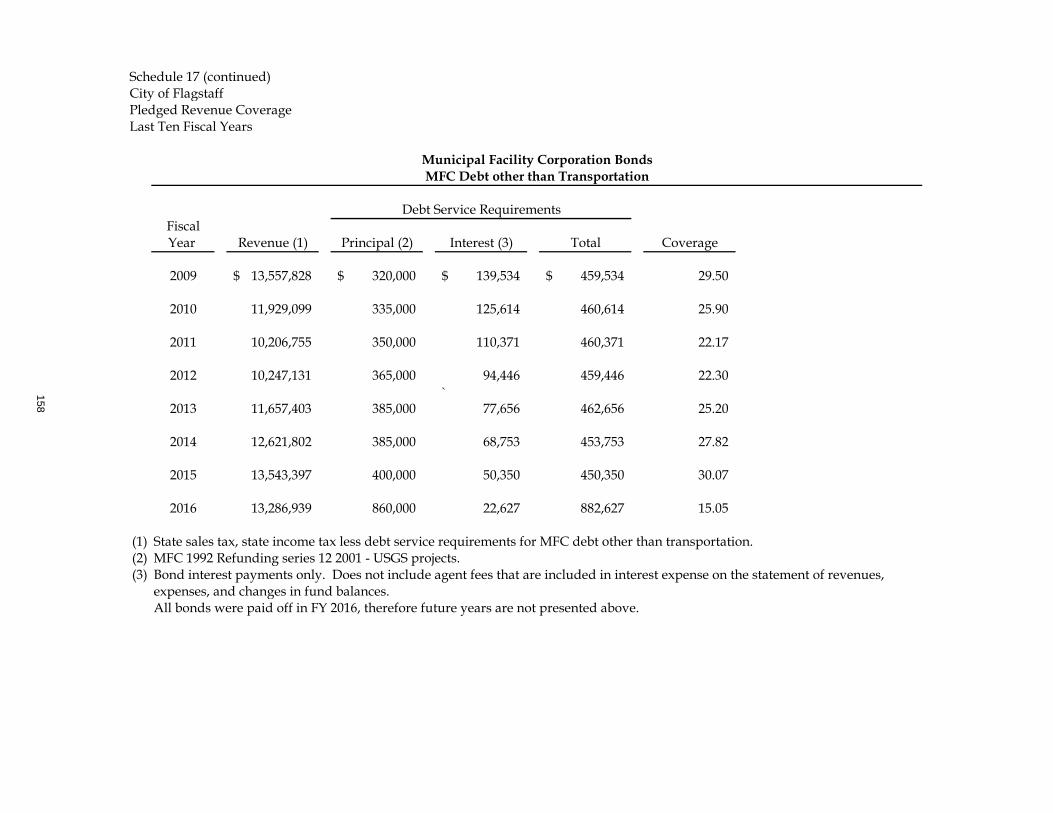
Schedule 17 (continued)City of FlagstaffPledged Revenue CoverageLast Ten Fiscal Years
Debt Service RequirementsFiscalYear Revenue (1) Principal (2) Interest (3) Total Coverage
2009 13,557,828$ 320,000$ 139,534$ 459,534$ 29.50
2010 11,929,099 335,000 125,614 460,614 25.90
2011 10,206,755 350,000 110,371 460,371 22.17
2012 10,247,131 365,000 94,446 459,446 22.30 `
2013 11,657,403 385,000 77,656 462,656 25.20
2014 12,621,802 385,000 68,753 453,753 27.82
2015 13,543,397 400,000 50,350 450,350 30.07
2016 13,286,939 860,000 22,627 882,627 15.05
(1) State sales tax, state income tax less debt service requirements for MFC debt other than transportation.(2) MFC 1992 Refunding series 12 2001 - USGS projects.(3) Bond interest payments only. Does not include agent fees that are included in interest expense on the statement of revenues,
expenses, and changes in fund balances.All bonds were paid off in FY 2016, therefore future years are not presented above.
Municipal Facility Corporation BondsMFC Debt other than Transportation
158
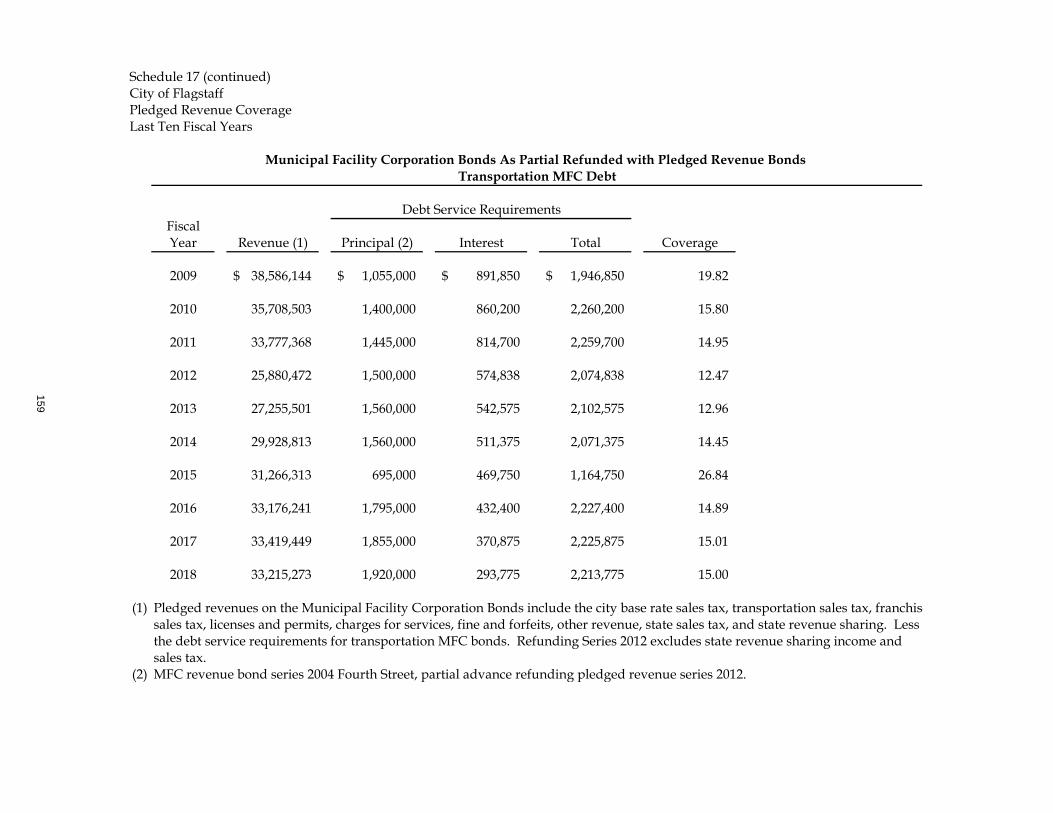
Schedule 17 (continued)City of FlagstaffPledged Revenue CoverageLast Ten Fiscal Years
Debt Service RequirementsFiscalYear Revenue (1) Principal (2) Interest Total Coverage
2009 38,586,144$ 1,055,000$ 891,850$ 1,946,850$ 19.82
2010 35,708,503 1,400,000 860,200 2,260,200 15.80
2011 33,777,368 1,445,000 814,700 2,259,700 14.95
2012 25,880,472 1,500,000 574,838 2,074,838 12.47
2013 27,255,501 1,560,000 542,575 2,102,575 12.96
2014 29,928,813 1,560,000 511,375 2,071,375 14.45
2015 31,266,313 695,000 469,750 1,164,750 26.84
2016 33,176,241 1,795,000 432,400 2,227,400 14.89
2017 33,419,449 1,855,000 370,875 2,225,875 15.01
2018 33,215,273 1,920,000 293,775 2,213,775 15.00
(1) Pledged revenues on the Municipal Facility Corporation Bonds include the city base rate sales tax, transportation sales tax, franchisesales tax, licenses and permits, charges for services, fine and forfeits, other revenue, state sales tax, and state revenue sharing. Lessthe debt service requirements for transportation MFC bonds. Refunding Series 2012 excludes state revenue sharing income andsales tax.
(2) MFC revenue bond series 2004 Fourth Street, partial advance refunding pledged revenue series 2012.
Municipal Facility Corporation Bonds As Partial Refunded with Pledged Revenue Bonds Transportation MFC Debt
159
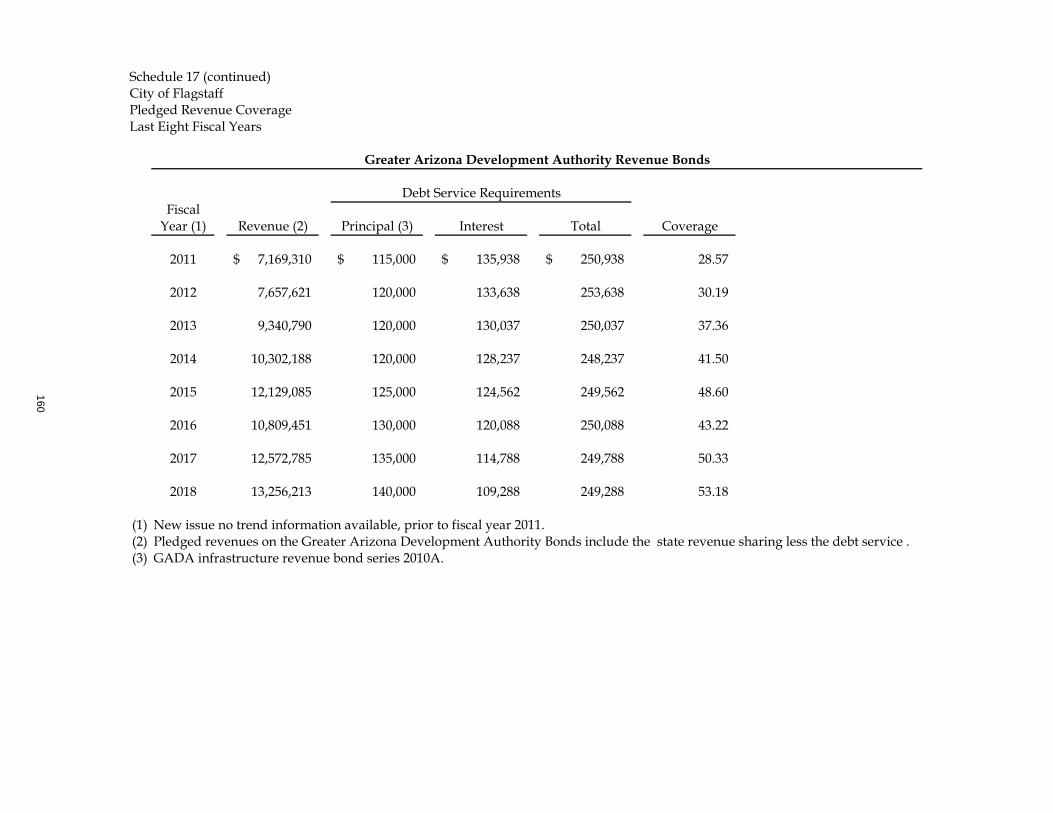
Schedule 17 (continued)City of FlagstaffPledged Revenue CoverageLast Eight Fiscal Years
Debt Service RequirementsFiscal
Year (1) Revenue (2) Principal (3) Interest Total Coverage
2011 7,169,310$ 115,000$ 135,938$ 250,938$ 28.57
2012 7,657,621 120,000 133,638 253,638 30.19
2013 9,340,790 120,000 130,037 250,037 37.36
2014 10,302,188 120,000 128,237 248,237 41.50
2015 12,129,085 125,000 124,562 249,562 48.60
2016 10,809,451 130,000 120,088 250,088 43.22
2017 12,572,785 135,000 114,788 249,788 50.33
2018 13,256,213 140,000 109,288 249,288 53.18
(1) New issue no trend information available, prior to fiscal year 2011.(2) Pledged revenues on the Greater Arizona Development Authority Bonds include the state revenue sharing less the debt service .(3) GADA infrastructure revenue bond series 2010A.
Greater Arizona Development Authority Revenue Bonds
160
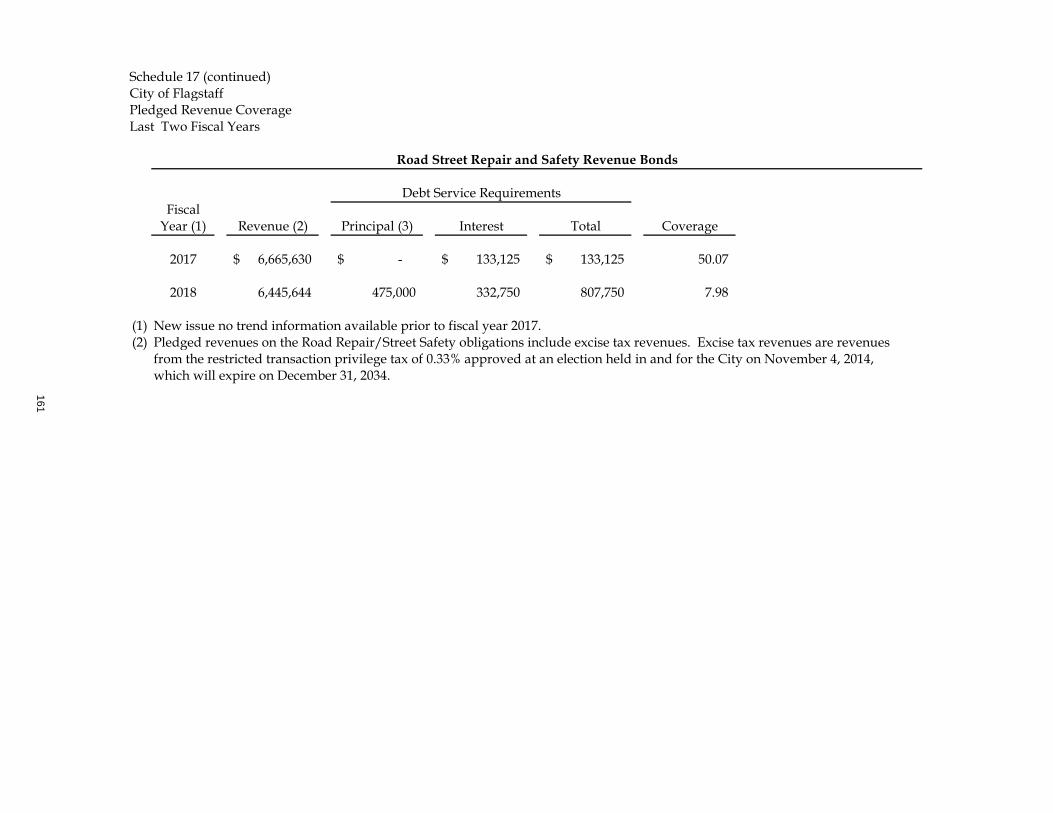
Schedule 17 (continued)City of FlagstaffPledged Revenue CoverageLast Two Fiscal Years
Debt Service RequirementsFiscal
Year (1) Revenue (2) Principal (3) Interest Total Coverage
2017 6,665,630$ -$ 133,125$ 133,125$ 50.07
2018 6,445,644 475,000 332,750 807,750 7.98
(1) New issue no trend information available prior to fiscal year 2017.(2) Pledged revenues on the Road Repair/Street Safety obligations include excise tax revenues. Excise tax revenues are revenues
from the restricted transaction privilege tax of 0.33% approved at an election held in and for the City on November 4, 2014,which will expire on December 31, 2034.
Road Street Repair and Safety Revenue Bonds
161
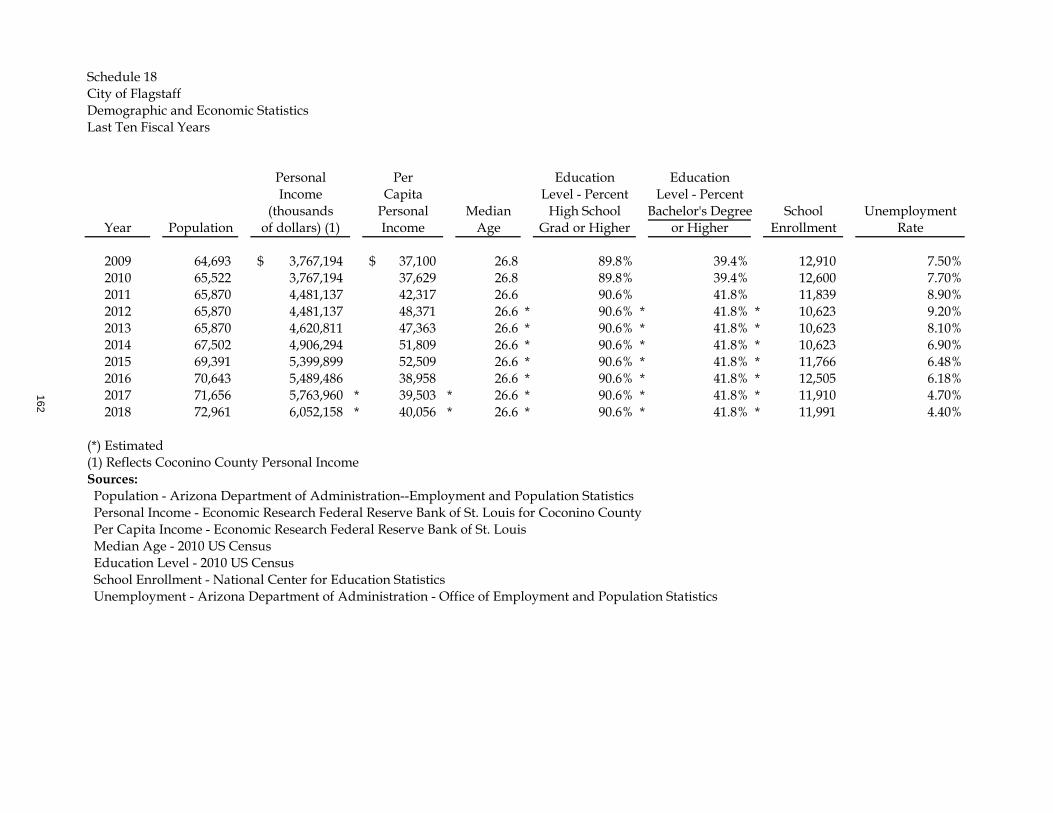
Schedule 18City of FlagstaffDemographic and Economic StatisticsLast Ten Fiscal Years
Personal Per Education EducationIncome Capita Level - Percent Level - Percent
(thousands Personal Median High School Bachelor's Degree School UnemploymentYear Population of dollars) (1) Income Age Grad or Higher or Higher Enrollment Rate
2009 64,693 3,767,194$ 37,100$ 26.8 89.8% 39.4% 12,910 7.50%2010 65,522 3,767,194 37,629 26.8 89.8% 39.4% 12,600 7.70%2011 65,870 4,481,137 42,317 26.6 90.6% 41.8% 11,839 8.90%2012 65,870 4,481,137 48,371 26.6 * 90.6% * 41.8% * 10,623 9.20%2013 65,870 4,620,811 47,363 26.6 * 90.6% * 41.8% * 10,623 8.10%2014 67,502 4,906,294 51,809 26.6 * 90.6% * 41.8% * 10,623 6.90%2015 69,391 5,399,899 52,509 26.6 * 90.6% * 41.8% * 11,766 6.48%2016 70,643 5,489,486 38,958 26.6 * 90.6% * 41.8% * 12,505 6.18%2017 71,656 5,763,960 * 39,503 * 26.6 * 90.6% * 41.8% * 11,910 4.70%2018 72,961 6,052,158 * 40,056 * 26.6 * 90.6% * 41.8% * 11,991 4.40%
(*) Estimated(1) Reflects Coconino County Personal IncomeSources: Population - Arizona Department of Administration--Employment and Population Statistics Personal Income - Economic Research Federal Reserve Bank of St. Louis for Coconino County Per Capita Income - Economic Research Federal Reserve Bank of St. Louis Median Age - 2010 US Census Education Level - 2010 US Census School Enrollment - National Center for Education Statistics Unemployment - Arizona Department of Administration - Office of Employment and Population Statistics
162
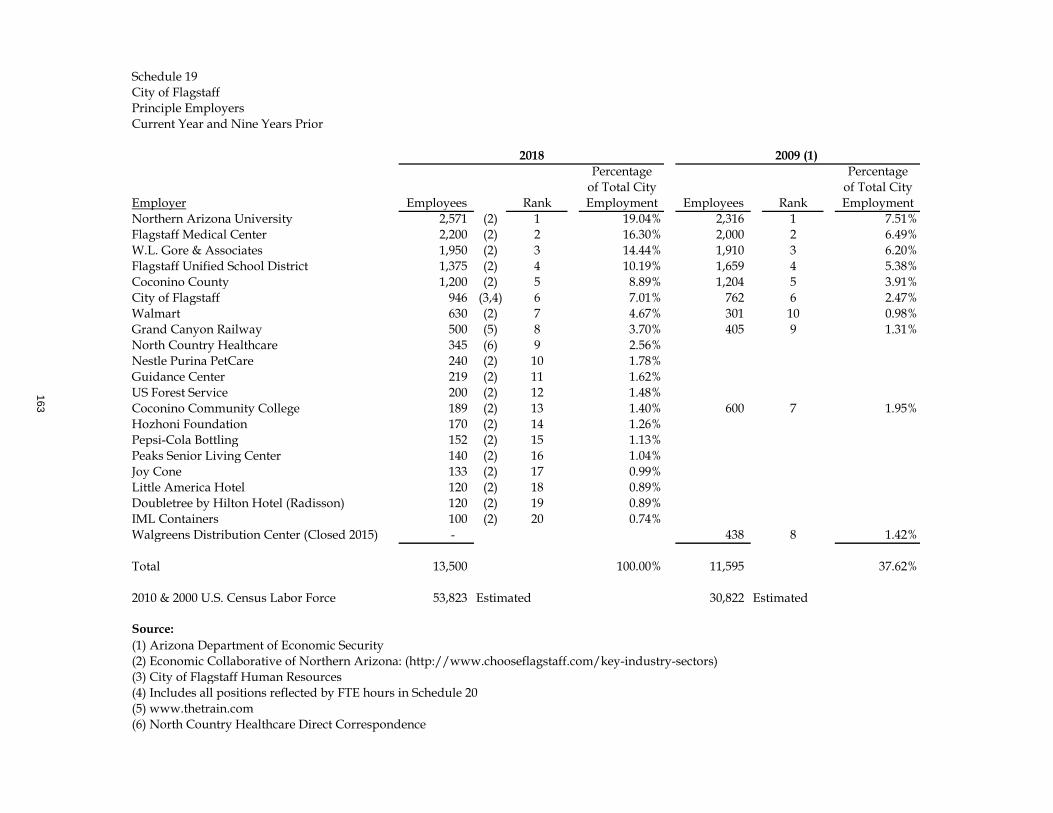
Schedule 19City of FlagstaffPrinciple EmployersCurrent Year and Nine Years Prior
Percentage Percentageof Total City of Total City
Employer Employees Rank Employment Employees Rank EmploymentNorthern Arizona University 2,571 (2) 1 19.04% 2,316 1 7.51%Flagstaff Medical Center 2,200 (2) 2 16.30% 2,000 2 6.49%W.L. Gore & Associates 1,950 (2) 3 14.44% 1,910 3 6.20%Flagstaff Unified School District 1,375 (2) 4 10.19% 1,659 4 5.38%Coconino County 1,200 (2) 5 8.89% 1,204 5 3.91%City of Flagstaff 946 (3,4) 6 7.01% 762 6 2.47%Walmart 630 (2) 7 4.67% 301 10 0.98%Grand Canyon Railway 500 (5) 8 3.70% 405 9 1.31%North Country Healthcare 345 (6) 9 2.56%Nestle Purina PetCare 240 (2) 10 1.78%Guidance Center 219 (2) 11 1.62%US Forest Service 200 (2) 12 1.48%Coconino Community College 189 (2) 13 1.40% 600 7 1.95%Hozhoni Foundation 170 (2) 14 1.26%Pepsi-Cola Bottling 152 (2) 15 1.13%Peaks Senior Living Center 140 (2) 16 1.04%Joy Cone 133 (2) 17 0.99%Little America Hotel 120 (2) 18 0.89%Doubletree by Hilton Hotel (Radisson) 120 (2) 19 0.89%IML Containers 100 (2) 20 0.74%Walgreens Distribution Center (Closed 2015) - 438 8 1.42%
Total 13,500 100.00% 11,595 37.62%
2010 & 2000 U.S. Census Labor Force 53,823 30,822 Estimated
Source: (1) Arizona Department of Economic Security(2) Economic Collaborative of Northern Arizona: (http://www.chooseflagstaff.com/key-industry-sectors)(3) City of Flagstaff Human Resources(4) Includes all positions reflected by FTE hours in Schedule 20(5) www.thetrain.com(6) North Country Healthcare Direct Correspondence
2018
Estimated
2009 (1)
163
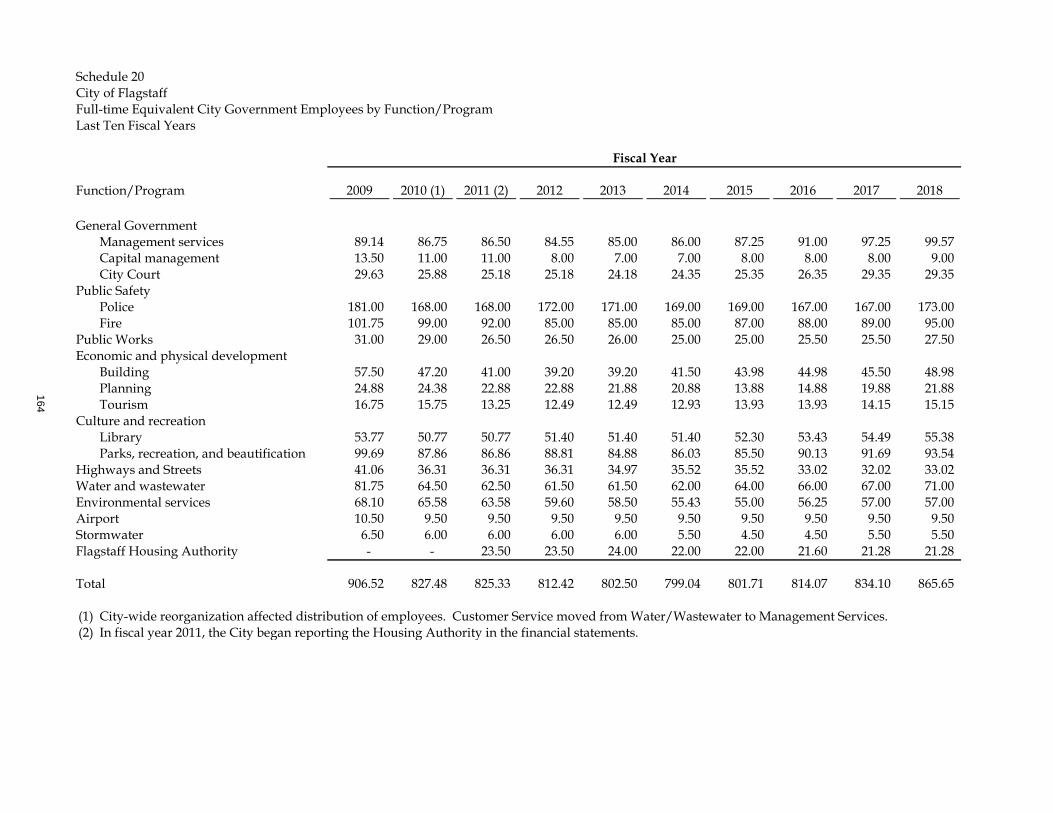
Schedule 20City of FlagstaffFull-time Equivalent City Government Employees by Function/ProgramLast Ten Fiscal Years
Function/Program 2009 2010 (1) 2011 (2) 2012 2013 2014 2015 2016 2017 2018
General GovernmentManagement services 89.14 86.75 86.50 84.55 85.00 86.00 87.25 91.00 97.25 99.57 Capital management 13.50 11.00 11.00 8.00 7.00 7.00 8.00 8.00 8.00 9.00 City Court 29.63 25.88 25.18 25.18 24.18 24.35 25.35 26.35 29.35 29.35
Public SafetyPolice 181.00 168.00 168.00 172.00 171.00 169.00 169.00 167.00 167.00 173.00 Fire 101.75 99.00 92.00 85.00 85.00 85.00 87.00 88.00 89.00 95.00
Public Works 31.00 29.00 26.50 26.50 26.00 25.00 25.00 25.50 25.50 27.50 Economic and physical development
Building 57.50 47.20 41.00 39.20 39.20 41.50 43.98 44.98 45.50 48.98 Planning 24.88 24.38 22.88 22.88 21.88 20.88 13.88 14.88 19.88 21.88 Tourism 16.75 15.75 13.25 12.49 12.49 12.93 13.93 13.93 14.15 15.15
Culture and recreationLibrary 53.77 50.77 50.77 51.40 51.40 51.40 52.30 53.43 54.49 55.38 Parks, recreation, and beautification 99.69 87.86 86.86 88.81 84.88 86.03 85.50 90.13 91.69 93.54
Highways and Streets 41.06 36.31 36.31 36.31 34.97 35.52 35.52 33.02 32.02 33.02 Water and wastewater 81.75 64.50 62.50 61.50 61.50 62.00 64.00 66.00 67.00 71.00 Environmental services 68.10 65.58 63.58 59.60 58.50 55.43 55.00 56.25 57.00 57.00 Airport 10.50 9.50 9.50 9.50 9.50 9.50 9.50 9.50 9.50 9.50 Stormwater 6.50 6.00 6.00 6.00 6.00 5.50 4.50 4.50 5.50 5.50 Flagstaff Housing Authority - - 23.50 23.50 24.00 22.00 22.00 21.60 21.28 21.28
Total 906.52 827.48 825.33 812.42 802.50 799.04 801.71 814.07 834.10 865.65
(1) City-wide reorganization affected distribution of employees. Customer Service moved from Water/Wastewater to Management Services.(2) In fiscal year 2011, the City began reporting the Housing Authority in the financial statements.
Fiscal Year
164
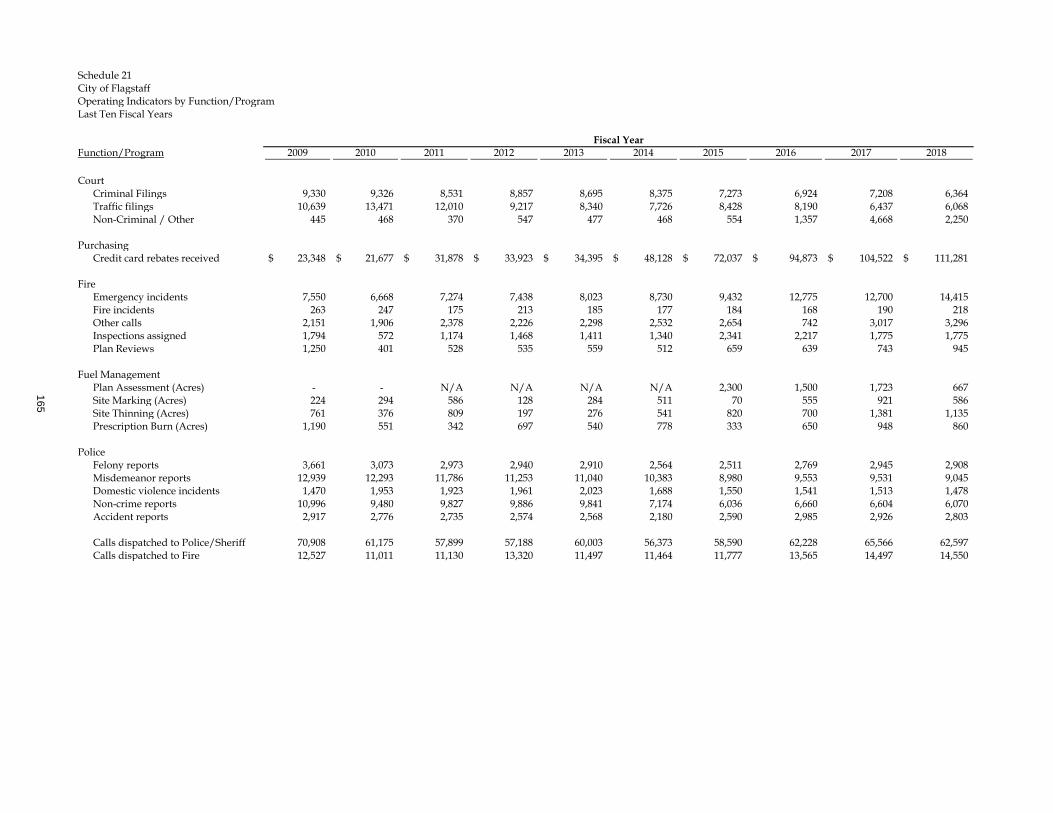
Schedule 21City of FlagstaffOperating Indicators by Function/ProgramLast Ten Fiscal Years
Function/Program 2009 2010 2011 2012 2013 2014 2015 2016 2017 2018
CourtCriminal Filings 9,330 9,326 8,531 8,857 8,695 8,375 7,273 6,924 7,208 6,364 Traffic filings 10,639 13,471 12,010 9,217 8,340 7,726 8,428 8,190 6,437 6,068 Non-Criminal / Other 445 468 370 547 477 468 554 1,357 4,668 2,250
PurchasingCredit card rebates received 23,348$ 21,677$ 31,878$ 33,923$ 34,395$ 48,128$ 72,037$ 94,873$ 104,522$ 111,281$
FireEmergency incidents 7,550 6,668 7,274 7,438 8,023 8,730 9,432 12,775 12,700 14,415 Fire incidents 263 247 175 213 185 177 184 168 190 218 Other calls 2,151 1,906 2,378 2,226 2,298 2,532 2,654 742 3,017 3,296 Inspections assigned 1,794 572 1,174 1,468 1,411 1,340 2,341 2,217 1,775 1,775 Plan Reviews 1,250 401 528 535 559 512 659 639 743 945
Fuel ManagementPlan Assessment (Acres) - - N/A N/A N/A N/A 2,300 1,500 1,723 667 Site Marking (Acres) 224 294 586 128 284 511 70 555 921 586 Site Thinning (Acres) 761 376 809 197 276 541 820 700 1,381 1,135 Prescription Burn (Acres) 1,190 551 342 697 540 778 333 650 948 860
PoliceFelony reports 3,661 3,073 2,973 2,940 2,910 2,564 2,511 2,769 2,945 2,908 Misdemeanor reports 12,939 12,293 11,786 11,253 11,040 10,383 8,980 9,553 9,531 9,045 Domestic violence incidents 1,470 1,953 1,923 1,961 2,023 1,688 1,550 1,541 1,513 1,478 Non-crime reports 10,996 9,480 9,827 9,886 9,841 7,174 6,036 6,660 6,604 6,070 Accident reports 2,917 2,776 2,735 2,574 2,568 2,180 2,590 2,985 2,926 2,803
Calls dispatched to Police/Sheriff 70,908 61,175 57,899 57,188 60,003 56,373 58,590 62,228 65,566 62,597 Calls dispatched to Fire 12,527 11,011 11,130 13,320 11,497 11,464 11,777 13,565 14,497 14,550
Fiscal Year
165
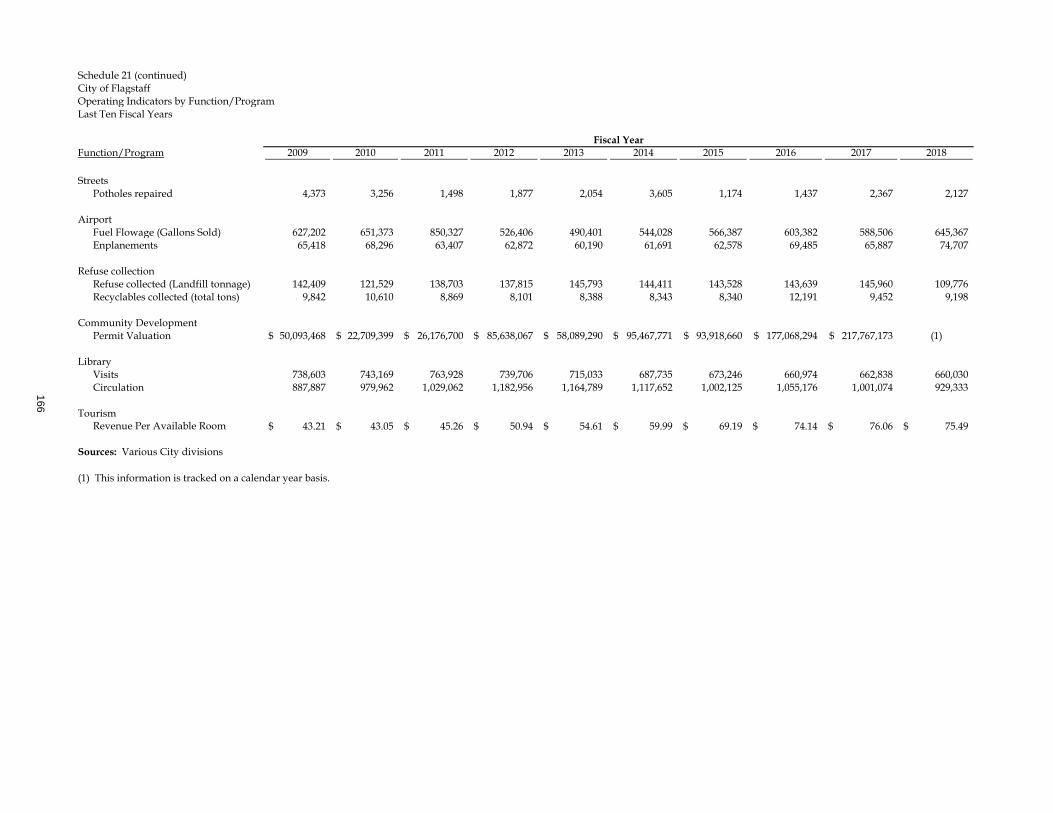
Schedule 21 (continued)City of FlagstaffOperating Indicators by Function/ProgramLast Ten Fiscal Years
Function/Program 2009 2010 2011 2012 2013 2014 2015 2016 2017 2018
StreetsPotholes repaired 4,373 3,256 1,498 1,877 2,054 3,605 1,174 1,437 2,367 2,127
AirportFuel Flowage (Gallons Sold) 627,202 651,373 850,327 526,406 490,401 544,028 566,387 603,382 588,506 645,367 Enplanements 65,418 68,296 63,407 62,872 60,190 61,691 62,578 69,485 65,887 74,707
Refuse collectionRefuse collected (Landfill tonnage) 142,409 121,529 138,703 137,815 145,793 144,411 143,528 143,639 145,960 109,776 Recyclables collected (total tons) 9,842 10,610 8,869 8,101 8,388 8,343 8,340 12,191 9,452 9,198
Community DevelopmentPermit Valuation 50,093,468$ 22,709,399$ 26,176,700$ 85,638,067$ 58,089,290$ 95,467,771$ 93,918,660$ 177,068,294$ 217,767,173$ (1)
LibraryVisits 738,603 743,169 763,928 739,706 715,033 687,735 673,246 660,974 662,838 660,030 Circulation 887,887 979,962 1,029,062 1,182,956 1,164,789 1,117,652 1,002,125 1,055,176 1,001,074 929,333
TourismRevenue Per Available Room 43.21$ 43.05$ 45.26$ 50.94$ 54.61$ 59.99$ 69.19$ 74.14$ 76.06$ 75.49$
Sources: Various City divisions
(1) This information is tracked on a calendar year basis.
Fiscal Year
166
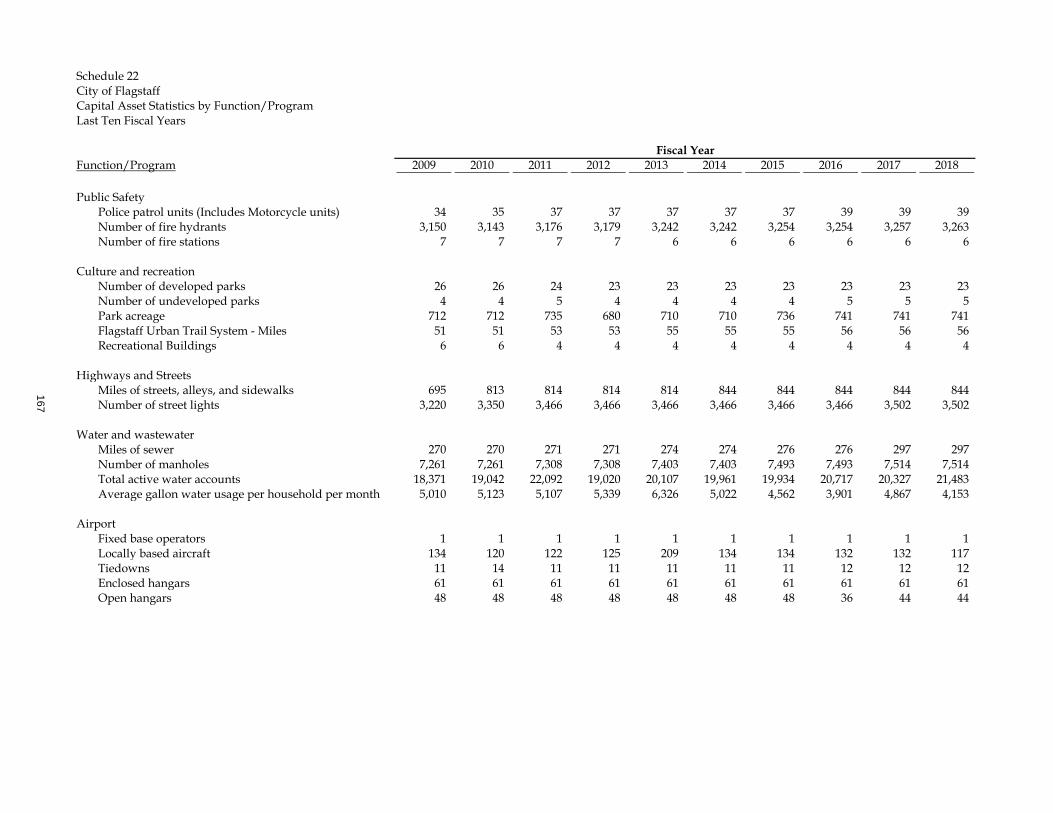
Schedule 22City of FlagstaffCapital Asset Statistics by Function/ProgramLast Ten Fiscal Years
Function/Program 2009 2010 2011 2012 2013 2014 2015 2016 2017 2018
Public SafetyPolice patrol units (Includes Motorcycle units) 34 35 37 37 37 37 37 39 39 39 Number of fire hydrants 3,150 3,143 3,176 3,179 3,242 3,242 3,254 3,254 3,257 3,263 Number of fire stations 7 7 7 7 6 6 6 6 6 6
Culture and recreationNumber of developed parks 26 26 24 23 23 23 23 23 23 23 Number of undeveloped parks 4 4 5 4 4 4 4 5 5 5 Park acreage 712 712 735 680 710 710 736 741 741 741 Flagstaff Urban Trail System - Miles 51 51 53 53 55 55 55 56 56 56 Recreational Buildings 6 6 4 4 4 4 4 4 4 4
Highways and StreetsMiles of streets, alleys, and sidewalks 695 813 814 814 814 844 844 844 844 844 Number of street lights 3,220 3,350 3,466 3,466 3,466 3,466 3,466 3,466 3,502 3,502
Water and wastewaterMiles of sewer 270 270 271 271 274 274 276 276 297 297 Number of manholes 7,261 7,261 7,308 7,308 7,403 7,403 7,493 7,493 7,514 7,514 Total active water accounts 18,371 19,042 22,092 19,020 20,107 19,961 19,934 20,717 20,327 21,483 Average gallon water usage per household per month 5,010 5,123 5,107 5,339 6,326 5,022 4,562 3,901 4,867 4,153
AirportFixed base operators 1 1 1 1 1 1 1 1 1 1 Locally based aircraft 134 120 122 125 209 134 134 132 132 117 Tiedowns 11 14 11 11 11 11 11 12 12 12 Enclosed hangars 61 61 61 61 61 61 61 61 61 61 Open hangars 48 48 48 48 48 48 48 36 44 44
Fiscal Year
167
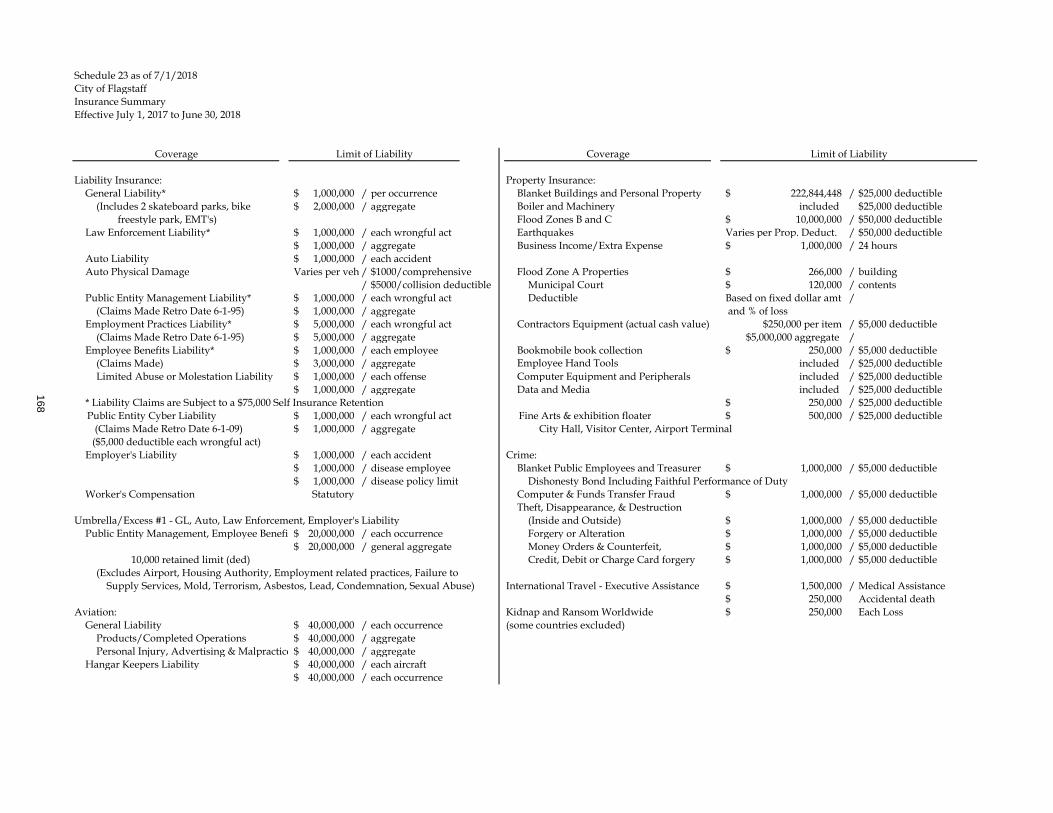
Schedule 23 as of 7/1/2018City of FlagstaffInsurance SummaryEffective July 1, 2017 to June 30, 2018
Coverage Coverage
Liability Insurance: Property Insurance:General Liability* 1,000,000$ / per occurrence Blanket Buildings and Personal Property 222,844,448$ / $25,000 deductible
(Includes 2 skateboard parks, bike 2,000,000$ / aggregate Boiler and Machinery included $25,000 deductiblefreestyle park, EMT's) Flood Zones B and C 10,000,000$ / $50,000 deductible
Law Enforcement Liability* 1,000,000$ / each wrongful act Earthquakes Varies per Prop. Deduct. / $50,000 deductible1,000,000$ / aggregate Business Income/Extra Expense 1,000,000$ / 24 hours
Auto Liability 1,000,000$ / each accidentAuto Physical Damage Varies per veh / $1000/comprehensive Flood Zone A Properties 266,000$ / building
/ $5000/collision deductible Municipal Court 120,000$ / contentsPublic Entity Management Liability* 1,000,000$ / each wrongful act Deductible Based on fixed dollar amt /
(Claims Made Retro Date 6-1-95) 1,000,000$ / aggregate and % of lossEmployment Practices Liability* 5,000,000$ / each wrongful act Contractors Equipment (actual cash value) $250,000 per item / $5,000 deductible
(Claims Made Retro Date 6-1-95) 5,000,000$ / aggregate $5,000,000 aggregate /Employee Benefits Liability* 1,000,000$ / each employee Bookmobile book collection 250,000$ / $5,000 deductible
(Claims Made) 3,000,000$ / aggregate Employee Hand Tools included / $25,000 deductibleLimited Abuse or Molestation Liability 1,000,000$ / each offense Computer Equipment and Peripherals included / $25,000 deductible
1,000,000$ / aggregate Data and Media included / $25,000 deductible* Liability Claims are Subject to a $75,000 Self Insurance Retention 250,000$ / $25,000 deductible
Public Entity Cyber Liability 1,000,000$ / each wrongful act Fine Arts & exhibition floater 500,000$ / $25,000 deductible (Claims Made Retro Date 6-1-09) 1,000,000$ / aggregate City Hall, Visitor Center, Airport Terminal ($5,000 deductible each wrongful act)
Employer's Liability 1,000,000$ / each accident Crime:1,000,000$ / disease employee Blanket Public Employees and Treasurer 1,000,000$ / $5,000 deductible1,000,000$ / disease policy limit Dishonesty Bond Including Faithful Performance of Duty
Worker's Compensation Statutory Computer & Funds Transfer Fraud 1,000,000$ / $5,000 deductibleTheft, Disappearance, & Destruction
Umbrella/Excess #1 - GL, Auto, Law Enforcement, Employer's Liability (Inside and Outside) 1,000,000$ / $5,000 deductiblePublic Entity Management, Employee Benefi 20,000,000$ / each occurrence Forgery or Alteration 1,000,000$ / $5,000 deductible
20,000,000$ / general aggregate Money Orders & Counterfeit, 1,000,000$ / $5,000 deductible10,000 retained limit (ded) Credit, Debit or Charge Card forgery 1,000,000$ / $5,000 deductible
(Excludes Airport, Housing Authority, Employment related practices, Failure to Supply Services, Mold, Terrorism, Asbestos, Lead, Condemnation, Sexual Abuse) International Travel - Executive Assistance 1,500,000$ / Medical Assistance
250,000$ Accidental deathAviation: Kidnap and Ransom Worldwide 250,000$ Each Loss
General Liability 40,000,000$ / each occurrence (some countries excluded)Products/Completed Operations 40,000,000$ / aggregatePersonal Injury, Advertising & Malpractice 40,000,000$ / aggregate
Hangar Keepers Liability 40,000,000$ / each aircraft40,000,000$ / each occurrence
Limit of Liability Limit of Liability
168
City of Flagstaff 211 W. Aspen Ave. Flagstaff, Arizona 86001
flagstaff.az.gov
U.S. Route 66, also known as the Mother Road, was one of the original highways within
the U.S. Highway System. U.S. 66 was established on November 11, 1926, and became one of the most famous roads in the United States. The road originally ran from Chicago, Illinois, through Missouri, Kansas, Oklahoma, Texas, New Mexico and Arizona before ending at Santa Monica, California, covering a total of 2,448 miles.