Embed Size (px)
Citation preview
Attachment FC 3
FY 2014-15
STATE AID ALLOCATIONS AND BUDGET POLICIES
STATE BOARD OF COMMUNITY COLLEGES
DIVISION OF FINANCE AND OPERATIONS
AUGUST 15, 2014
SBCC 08/15/2014 Version 1.0

Document Revision History
Version Date Published Description
1.0 8/15/2014 Document presented to the State Board
TABLE OF CONTENTS I. Purpose Statement ............................................................................................................... 1 II. Guidelines Related to State Salaries of Community College Employees ........................ 3
A. Salaries of Faculty, Professional Staff, and Other State-Supported Positions ............... 3 B. Establishment of Minimum Salaries for Curriculum Faculty ........................................ 6 C. College Presidents’ State Salaries .................................................................................. 7 D. Employer Contribution Rates, UI, and Longevity – FOR INFORMATION ONLY ..... 9 E. Other Personnel-Related Budget Provisions – FOR INFORMATION ONLY ........... 10
III. Budget Allocations ............................................................................................................. 11 A. Formula Budget – Current Operating ........................................................................... 13
1. Curriculum Instruction .......................................................................................... 16 2. Continuing Education (Occupational Extension) Instruction ............................... 18 3. Basic Skills Block Grant ....................................................................................... 20
4. Institutional & Academic Support ........................................................................ 24 5. Performance-Based Funding Allocations ............................................................. 27
B. Categorical Allocations ................................................................................................ 31 1. Career and Technical Education (Federal) ........................................................... 31 2. Child Care ............................................................................................................. 34 3. Small Business Centers ......................................................................................... 36 4. Customized Training ............................................................................................. 41 5. Equipment ............................................................................................................. 46 6. Instructional Resources ......................................................................................... 50
C. Specific Program Categorical Allocations ................................................................... 52 D. Allocation of Management Flexibility Reduction ........................................................ 54 E. Summary of College Allocations ................................................................................. 56
IV. Use of State Funds and Budget Flexibility ....................................................................... 60 A. Cash Management – FOR INFORMATION ONLY ................................................... 60 B. Use of State Funds – FOR INFORMATION ONLY ................................................... 60 C. Authority to Use Funds for Campus Security .............................................................. 61
V. Tuition and Fees – FOR INFORMATION ONLY ......................................................... 63 A. Curriculum Tuition Rates ............................................................................................. 63
B. Continuing Education Occupational Extension Registration Fees ............................... 63 C. No Legislative Changes to Tuition Waivers ................................................................ 63 D. Estimated Receipts ....................................................................................................... 64
VI. Other Budget Policy Issues and Reports – FOR INFORMATION ONLY .................. 66 Appendix A: Relevant Excerpts from S.L. 2014-100 ............................................................... 69 Appendix B: Closing the Skills Gap Priority Occupations ..................................................... 82 Appendix C: Tier Designations.................................................................................................. 83
Appendix D: Performance-Based Funding Allocation Detail ................................................. 87 Appendix E: Revised Purpose and Vocational Codes ............................................................. 91 Appendix F: FY 2014-15 Key Formula Values ........................................................................ 93
Appendix G: FY 2014-15 Per Capita Rates .............................................................................. 94


1
I. Purpose Statement
Through S.L. 2014-100, the General Assembly established the appropriation to the North Carolina Community College System for FY 2014-15. S.L 2014-100 also communicated various directives and made policy changes that require State Board action. These actions and adjustments are required to ensure appropriate fiscal control with respect to the allocation of resources, and as such require the State Board’s deliberation and approval. Furthermore, G.S. 115D-5(a) provides that “[t]he State Board of Community Colleges may adopt and execute such policies, regulations and standards concerning the establishment, administration, and operation of institutions as the State Board may deem necessary … to provide for the equitable distribution of State and federal funds to the several institutions.” G.S. 115D-31(a) further describes the State Board’s responsibility to provide, “from sources available to the State Board,” financial support to the institutions. It is the purpose of this document to allocate funds to the colleges and adopt necessary policies consistent with S.L. 2014-100, and in compliance with G.S. 115D-5(a) and G.S. 115D-31.
It is the responsibility of the colleges to ensure that State and Federal funds are expended consistent with the policies herein.
1

(This page left blank intentionally)
2
II. Guidelines Related to State Salaries of Community College Employees
A. Salaries of Faculty, Professional Staff, and Other State-Supported Positions
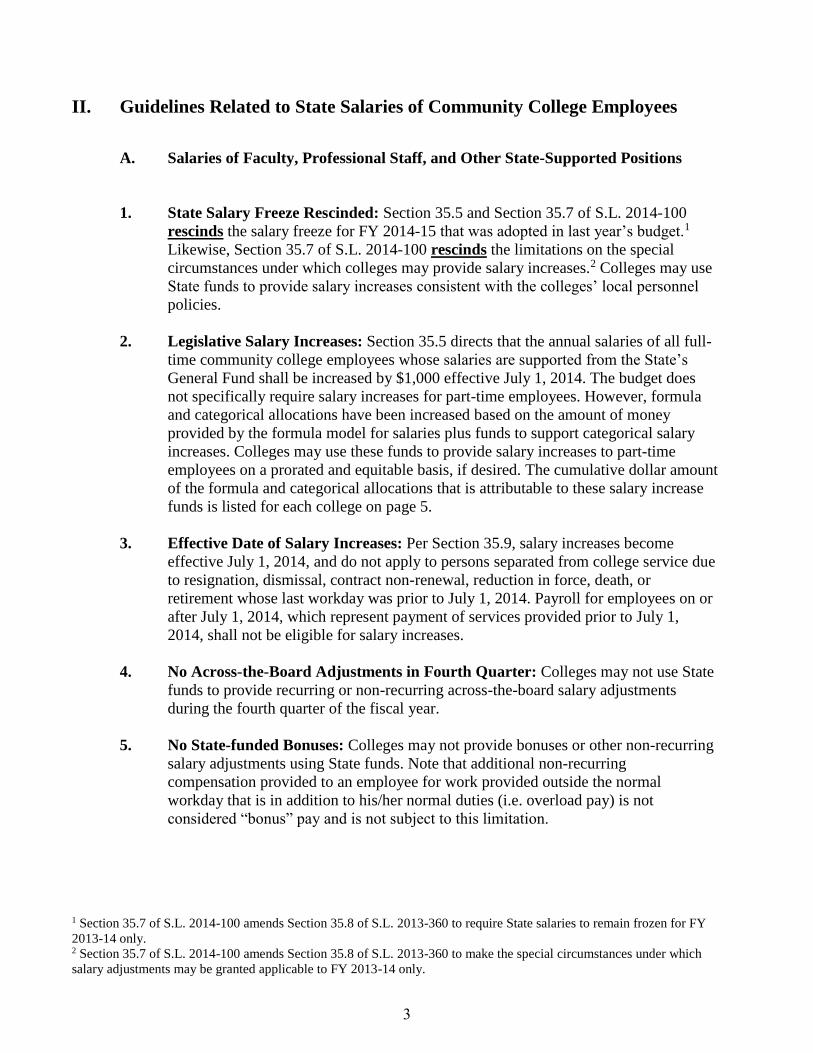
1. State Salary Freeze Rescinded: Section 35.5 and Section 35.7 of S.L. 2014-100
rescinds the salary freeze for FY 2014-15 that was adopted in last year’s budget.1
Likewise, Section 35.7 of S.L. 2014-100 rescinds the limitations on the special
circumstances under which colleges may provide salary increases.2 Colleges may use
State funds to provide salary increases consistent with the colleges’ local personnel
policies.
2. Legislative Salary Increases: Section 35.5 directs that the annual salaries of all full-
time community college employees whose salaries are supported from the State’s
General Fund shall be increased by $1,000 effective July 1, 2014. The budget does
not specifically require salary increases for part-time employees. However, formula
and categorical allocations have been increased based on the amount of money
provided by the formula model for salaries plus funds to support categorical salary
increases. Colleges may use these funds to provide salary increases to part-time
employees on a prorated and equitable basis, if desired. The cumulative dollar amount
of the formula and categorical allocations that is attributable to these salary increase
funds is listed for each college on page 5.
3. Effective Date of Salary Increases: Per Section 35.9, salary increases become
effective July 1, 2014, and do not apply to persons separated from college service due
to resignation, dismissal, contract non-renewal, reduction in force, death, or
retirement whose last workday was prior to July 1, 2014. Payroll for employees on or
after July 1, 2014, which represent payment of services provided prior to July 1,
2014, shall not be eligible for salary increases.
4. No Across-the-Board Adjustments in Fourth Quarter: Colleges may not use State
funds to provide recurring or non-recurring across-the-board salary adjustments
during the fourth quarter of the fiscal year.
5. No State-funded Bonuses: Colleges may not provide bonuses or other non-recurring
salary adjustments using State funds. Note that additional non-recurring
compensation provided to an employee for work provided outside the normal
workday that is in addition to his/her normal duties (i.e. overload pay) is not
considered “bonus” pay and is not subject to this limitation.
1 Section 35.7 of S.L. 2014-100 amends Section 35.8 of S.L. 2013-360 to require State salaries to remain frozen for FY
2013-14 only. 2 Section 35.7 of S.L. 2014-100 amends Section 35.8 of S.L. 2013-360 to make the special circumstances under which
salary adjustments may be granted applicable to FY 2013-14 only.
3
6. Prior State Board Approval Required for Cumulative Increases Greater than
10%: Cumulative State salary adjustments authorized above may exceed 10% only if
approved in advance by the State Board.
7. Locally-funded Compensation Adjustments: Colleges may provide recurring or
non-recurring salary adjustments using local funding sources, if such adjustments are
an authorized use of those funds.
8. State Board Minimum and Maximum State Salaries: Per 1C SBCCC 400.94, the
State Board shall adopt a minimum and maximum amount of State funds which may
be paid to any full-time employee of the college paid with State funds. With the
exception of the college president, the minimum amount is $24,168 and the maximum
amount is $123,023 for FY 2014-15. These amounts have been increased by $1,000
from FY 2013-14, consistent with the $1,000 legislative salary increase.
4

NORTH CAROLINA COMMUNITY COLLEGE SYSTEMLegislative Salary Increase Amounts by College
FY 2014-15
Curriculum Con Ed (OE)Basic Skills
Inst. & Ac. Support Categorical Total Salary FICA Retirement
Total Benefits
Total Salary and Benefits
7.65% 15.21%
Alamance CC $176,000 $15,600 $16,600 $109,379 $1,000 $318,579 $24,371 $48,456 $72,827 $391,406
Asheville-Buncombe TCC 310,000 28,700 19,100 178,242 1,000 537,042 41,084 81,684 122,768 659,810
Beaufort County CC 83,000 9,500 6,900 57,709 1,000 158,109 12,095 24,048 36,143 194,252
Bladen CC 62,600 10,900 3,500 47,113 1,000 125,113 9,571 19,030 28,601 153,714
Blue Ridge CC 91,800 20,600 6,800 75,322 1,000 195,522 14,957 29,739 44,696 240,218
Brunswick CC 70,200 14,700 11,700 56,789 1,000 154,389 11,811 23,483 35,294 189,683
Caldwell CC and TI 165,900 24,500 14,400 115,063 1,000 320,863 24,546 48,803 73,349 394,212
Cape Fear CC 369,400 34,400 24,500 225,800 9,500 663,600 50,765 100,934 151,699 815,299
Carteret CC 75,400 15,400 5,600 56,789 1,000 154,189 11,795 23,452 35,247 189,436
Catawba Valley CC 185,200 25,900 11,900 117,355 10,500 350,855 26,840 53,365 80,205 431,060
Central Carolina CC 194,200 38,400 38,300 155,225 1,000 427,125 32,675 64,966 97,641 524,766
Central Piedmont CC 706,600 25,700 66,800 430,717 1,000 1,230,817 94,158 187,207 281,365 1,512,182
Cleveland CC 139,800 20,900 7,000 89,566 1,000 258,266 19,757 39,282 59,039 317,305
Coastal Carolina CC 185,600 31,700 10,000 119,424 1,000 347,724 26,601 52,889 79,490 427,214
College of the Albemarle 103,600 11,900 9,100 77,552 1,000 203,152 15,541 30,899 46,440 249,592
Craven CC 128,900 16,800 7,700 90,883 1,000 245,283 18,764 37,308 56,072 301,355
Davidson County CC 165,400 18,400 21,200 115,362 1,000 321,362 24,584 48,879 73,463 394,825
Durham TCC 190,100 24,000 17,300 120,136 1,000 352,536 26,969 53,621 80,590 433,126
Edgecombe CC 119,300 13,400 9,200 85,206 1,000 228,106 17,450 34,695 52,145 280,251
Fayetteville TCC 451,500 87,500 50,700 299,978 5,000 894,678 68,443 136,081 204,524 1,099,202
Forsyth TCC 367,500 38,600 30,900 217,294 1,000 655,294 50,130 99,670 149,800 805,094
Gaston College 235,000 15,300 12,200 149,640 5,000 417,140 31,911 63,447 95,358 512,498
Guilford TCC 535,900 35,600 51,700 326,436 1,000 950,636 72,724 144,592 217,316 1,167,952
Halifax CC 68,300 12,800 5,100 51,893 1,000 139,093 10,641 21,156 31,797 170,890
Haywood CC 90,700 12,000 2,400 60,582 1,000 166,682 12,751 25,352 38,103 204,785
Isothermal CC 100,900 11,200 6,500 66,880 1,000 186,480 14,266 28,364 42,630 229,110
James Sprunt CC 65,300 10,600 3,400 48,561 1,000 128,861 9,858 19,600 29,458 158,319
Johnston CC 180,100 24,700 12,000 113,562 1,000 331,362 25,349 50,400 75,749 407,111
Lenoir CC 118,700 69,900 19,100 112,298 1,000 320,998 24,556 48,824 73,380 394,378
Martin CC 37,200 10,100 6,000 35,919 1,000 90,219 6,902 13,722 20,624 110,843
Mayland CC 53,900 19,000 15,200 53,089 1,000 142,189 10,877 21,627 32,504 174,693
McDowell TCC 58,000 10,400 5,400 45,641 1,000 120,441 9,214 18,319 27,533 147,974
Mitchell CC 123,800 15,100 9,700 81,843 1,000 231,443 17,705 35,202 52,907 284,350
Montgomery CC 40,200 10,400 3,700 36,953 1,000 92,253 7,057 14,032 21,089 113,342
Nash CC 135,400 19,000 7,600 87,428 1,000 250,428 19,158 38,090 57,248 307,676
Pamlico CC 29,600 7,800 3,600 31,000 1,000 73,000 5,585 11,103 16,688 89,688
Piedmont CC 72,500 26,500 7,400 69,507 1,000 176,907 13,533 26,908 40,441 217,348
Pitt CC 360,600 24,200 19,500 201,457 1,000 606,757 46,417 92,288 138,705 745,462
Randolph CC 124,800 13,600 14,100 83,544 1,000 237,044 18,134 36,054 54,188 291,232
Richmond CC 100,800 16,100 22,400 77,269 1,000 217,569 16,644 33,092 49,736 267,305
Roanoke Chowan CC 39,000 8,300 3,900 35,045 1,000 87,245 6,674 13,270 19,944 107,189
Robeson CC 106,700 27,300 29,700 89,934 1,000 254,634 19,480 38,730 58,210 312,844
Rockingham CC 83,000 11,800 4,700 57,984 1,000 158,484 12,124 24,105 36,229 194,713
Rowan-Cabarrus CC 262,100 31,900 20,100 187,843 8,500 510,443 39,049 77,638 116,687 627,130
Sampson CC 63,700 14,500 16,100 56,100 1,000 151,400 11,582 23,028 34,610 186,010
Sandhills CC 164,100 15,700 18,000 104,552 1,000 303,352 23,206 46,140 69,346 372,698
South Piedmont CC 89,800 27,700 15,100 82,126 1,000 215,726 16,503 32,812 49,315 265,041
Southeastern CC 70,100 27,100 17,000 66,650 1,000 181,850 13,912 27,659 41,571 223,421
Southwestern CC 104,800 20,100 4,700 79,712 1,000 210,312 16,089 31,988 48,077 258,389
Stanly CC 113,000 19,800 8,800 85,734 1,000 228,334 17,468 34,730 52,198 280,532
Surry CC 137,900 22,000 11,400 92,002 1,000 264,302 20,219 40,200 60,419 324,721
Tri-County CC 62,100 7,200 2,100 43,987 1,000 116,387 8,904 17,702 26,606 142,993
Vance-Granville CC 146,100 25,000 16,300 115,277 1,000 303,677 23,231 46,189 69,420 373,097
Wake TCC 745,700 68,300 72,900 468,359 1,000 1,356,259 103,754 206,287 310,041 1,666,300
Wayne CC 162,900 19,000 14,600 104,093 1,000 301,593 23,072 45,872 68,944 370,537
Western Piedmont CC 106,900 15,700 18,900 78,349 1,000 220,849 16,895 33,591 50,486 271,335
Wilkes CC 125,100 20,900 12,000 92,998 1,000 251,998 19,278 38,329 57,607 309,605
Wilson CC 76,500 14,200 10,100 59,111 1,000 160,911 12,310 24,475 36,786 197,697
Total $9,533,200 $1,288,300 $912,600 $6,474,262 $91,500 $18,299,862 $1,399,939 $2,783,408 $4,183,348 $22,483,210
5
B. Establishment of Minimum Salaries for Curriculum Faculty
No curriculum faculty member shall earn less than the minimum amount for his or her
education level, as of the beginning of the contractual period, consistent with the following
guidelines:
1. Definitions of Educational Levels: The minimum salaries for community college
curriculum faculty shall be based upon the following educational levels as
demonstrated through credentials earned from an accredited institution:
Vocational Diploma, Certificate or Less – This education level includes faculty
members who are high school graduates, have vocational diplomas, or have
completed one year of college.
Associate Degree or Equivalent – This education level includes faculty members
who have an associate’s degree or have completed two or more years of college,
but have no degree.
Bachelor’s Degree.
Master’s Degree or Education Specialist.
Doctoral Degree.
2. Full-Time Curriculum Faculty Minimum Salaries: No nine-month, full-time
faculty member shall earn less than the minimum salary for his or her education level,
regardless of whether their degree is applicable to what they are teaching. Consistent
with Section 35.5 of S.L. 2014-100, the minimum salaries for full-time faculty
described in #4 below have been increased by $1,000.
3. Part-Time Curriculum Faculty Minimum Salaries: The pro-rata hourly rate of the
minimum salary for each education level shall be used to determine the minimum
salary for part-time faculty members. The pro-rata hourly rate of the minimum salary
for adjunct faculty is calculated by dividing the full-time faculty minimum by 1560
hours (number of hours for 9/12th of a work year). The FY 2014-15 minimum
salaries for part-time faculty are fifteen percent (15%) above these derived
minimums based on the minimum salaries for full-time faculty. This is consistent
with the 2005 agreement between the System Office and the North Carolina
Association of Community College Presidents to recognize work time required
outside of direct classroom instruction. The State Board establishes the “contact
hour” as the standard unit of measure for the purpose of determining compliance with
this requirement.
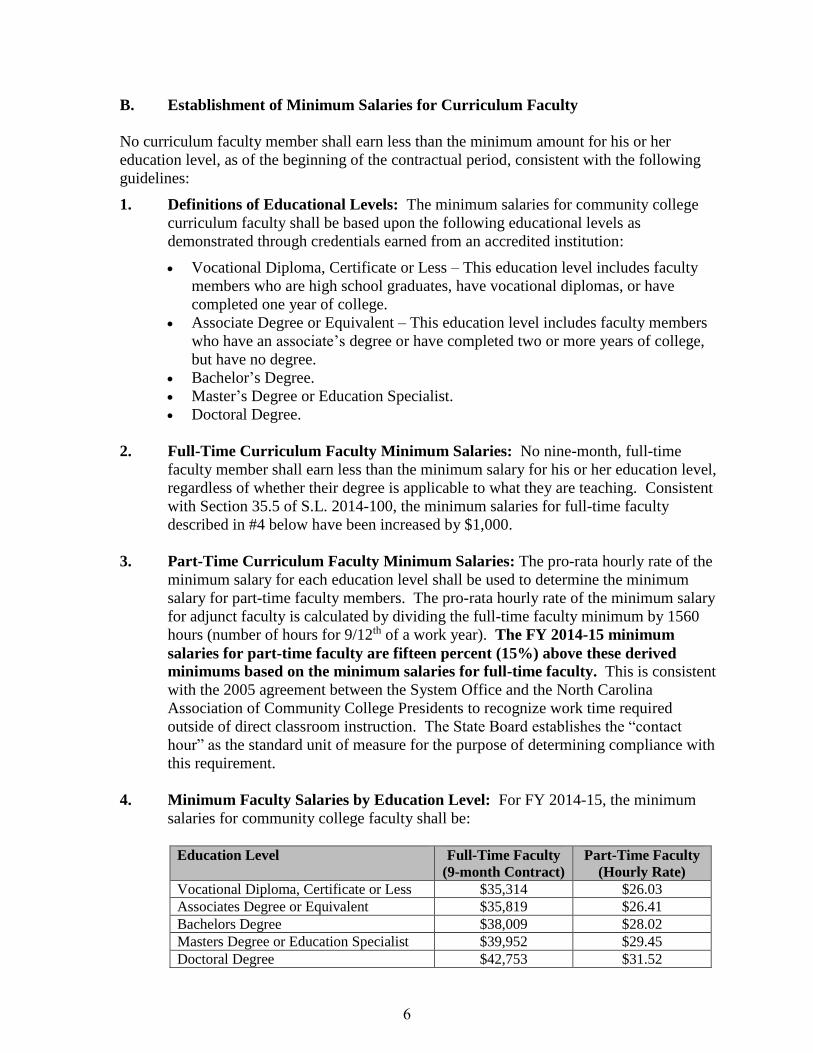
4. Minimum Faculty Salaries by Education Level: For FY 2014-15, the minimum
salaries for community college faculty shall be:
Education Level Full-Time Faculty
(9-month Contract)
Part-Time Faculty
(Hourly Rate)
Vocational Diploma, Certificate or Less $35,314 $26.03
Associates Degree or Equivalent $35,819 $26.41
Bachelors Degree $38,009 $28.02
Masters Degree or Education Specialist $39,952 $29.45
Doctoral Degree $42,753 $31.52
6
C. College Presidents’ State Salaries
Per G.S. 115D-20(1), it is the power and duty of the college board of trustees “(t)o elect a
president or chief administrative officer of the institution for such term and under such
conditions as the trustees may fix, such election to be subject to the approval of the State
Board of Community Colleges.” Furthermore, per G.S. 115D-5(a), “(a)ny and all salary caps
set by the State Board for community college presidents shall apply only to the State-paid
portion of the salary.” Therefore, the amount of local supplement, if any, and the presidents’
total salary is a decision of the local college’s board of trustees.
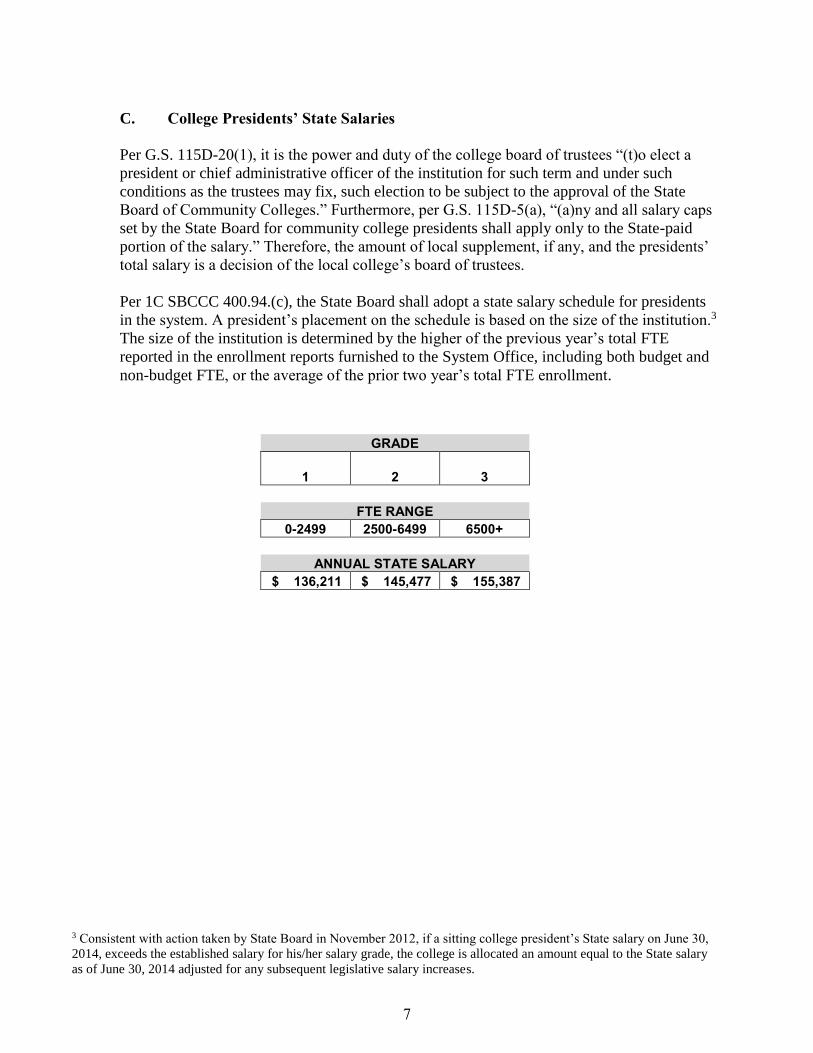
Per 1C SBCCC 400.94.(c), the State Board shall adopt a state salary schedule for presidents
in the system. A president’s placement on the schedule is based on the size of the institution.3
The size of the institution is determined by the higher of the previous year’s total FTE
reported in the enrollment reports furnished to the System Office, including both budget and
non-budget FTE, or the average of the prior two year’s total FTE enrollment.
GRADE
1 2 3
FTE RANGE 0-2499 2500-6499 6500+
ANNUAL STATE SALARY $ 136,211 $ 145,477 $ 155,387
3 Consistent with action taken by State Board in November 2012, if a sitting college president’s State salary on June 30,
2014, exceeds the established salary for his/her salary grade, the college is allocated an amount equal to the State salary
as of June 30, 2014 adjusted for any subsequent legislative salary increases.
7

NORTH CAROLINA COMMUNITY COLLEGE SYSTEMPRESIDENTS' STATE BUDGETED SALARIES
FY 2014-15
STATEBASIC TOTAL INST SALARY
COMMUNITY COLLEGES CURR. CON. ED SKILLS CURR. CON. ED FTE SIZE 2014-15Alamance CC 3,452 351 357 368 43 4,571 2 145,477
Asheville-Buncombe TCC 6,094 651 411 732 144 8,032 3 155,387
Beaufort County CC 1,560 203 149 133 15 2,060 1 136,211
Bladen CC 1,150 226 75 98 5 1,554 1 136,211
Blue Ridge CC 1,737 469 146 184 79 2,615 2 145,477
Brunswick CC 1,293 327 252 104 40 2,016 1 136,211
Caldwell CC & TI 3,226 545 310 391 45 4,517 2 151,318
Cape Fear CC 7,390 787 526 901 61 9,665 3 155,387
Carteret CC 1,408 344 120 163 36 2,071 1 136,211
Catawba Valley CC 3,648 603 256 432 119 5,058 2 145,477
Central Carolina CC 3,824 855 823 341 67 5,910 2 145,477
Central Piedmont CC 14,286 592 1,435 1,866 466 18,645 3 171,465
Cleveland CC 2,689 458 151 154 25 3,477 2 150,298
Coastal Carolina CC 3,669 714 214 743 77 5,417 2 160,536
College of The Albemarle 1,996 258 195 150 31 2,630 2 145,477
Craven CC 2,486 378 165 266 34 3,329 2 145,477
Davidson County CC 3,217 421 456 313 35 4,442 2 145,477
Durham TCC 3,714 542 372 429 127 5,184 2 145,477
Edgecombe CC 2,292 293 197 305 17 3,104 2 145,477
Fayetteville TCC 9,073 1,964 1,089 1,202 203 13,531 3 155,387
Forsyth TCC 7,298 894 663 998 104 9,957 3 155,387
Gaston College 4,642 355 262 349 71 5,679 2 154,342
Guilford TCC 10,820 824 1,111 1,279 236 14,270 3 155,387
Halifax CC 1,257 293 109 74 12 1,745 1 136,211
Haywood CC 1,725 260 52 207 29 2,273 1 136,211
Isothermal CC 1,932 240 139 261 83 2,655 2 145,477
James Sprunt CC 1,213 227 74 77 48 1,639 1 136,211
Johnston CC 3,535 549 258 78 54 4,474 2 145,477
Lenoir CC 2,301 1,575 411 311 49 4,647 2 145,477
Martin CC 628 207 129 37 20 1,021 1 136,211
Mayland CC 963 421 327 45 12 1,768 1 136,211
McDowell TCC 1,034 237 116 146 88 1,621 1 136,211
Mitchell CC 2,422 331 209 317 45 3,324 2 145,477
Montgomery CC 698 231 80 74 18 1,101 1 136,211
Nash CC 2,618 424 163 240 33 3,478 2 145,477
Pamlico CC 470 165 77 26 11 749 1 136,211
Piedmont CC 1,345 594 160 92 27 2,218 1 136,211
Pitt CC 7,206 541 419 934 140 9,240 3 155,387
Randolph CC 2,424 310 302 230 45 3,311 2 145,477
Richmond CC 1,922 360 481 166 18 2,947 2 145,477
Roanoke-Chowan CC 674 169 83 31 8 965 1 136,211
Robeson CC 2,051 626 637 210 29 3,553 2 145,477
Rockingham CC 1,560 264 100 160 27 2,111 1 136,211
Rowan-Cabarrus CC 5,241 727 431 647 48 7,094 3 174,878
Sampson CC 1,173 324 345 71 21 1,934 1 136,211
Sandhills CC 3,208 356 386 411 44 4,405 2 160,536
South Piedmont CC 1,698 626 324 151 26 2,825 2 145,477
Southeastern CC 1,300 635 366 167 16 2,484 1 136,211
Southwestern CC 1,983 458 102 227 16 2,786 2 145,477
Stanly CC 2,174 441 190 248 34 3,087 2 145,477
Surry CC 2,672 487 245 226 41 3,671 2 145,477
Tri-County CC 1,128 141 46 72 29 1,416 1 136,211
Vance-Granville CC 2,844 569 351 258 120 4,142 2 145,477
Wake TCC 15,077 1,634 1,566 1,682 179 20,138 3 168,114
Wayne CC 3,174 442 314 338 23 4,291 2 145,477
Western Piedmont CC 2,048 356 406 228 25 3,063 2 145,477
Wilkes CC 2,390 473 258 176 21 3,318 2 145,477
Wilson CC 1,447 314 212 280 22 2,275 1 136,211
TOTAL 186,499 29,061 19,603 20,799 3,541 259,503 8,448,743$
BUDGET FTE NON-BUDGET FTE
8

9
D. Employer Contribution Rates, UI, and Longevity – FOR INFORMATION ONLY
1. Employer Contribution Retirement Rates: Consistent with Section 35.13(b) of
S.L. 2014-100, colleges shall contribute the following rates toward employee retirement effective July 1, 2014. This new rate shall be implemented starting with the August 2014 payroll. Colleges will be invoiced for the difference between the new rates and those used with the July payroll.
Teachers and State Employees Retirement System (TSERS): 15.21%*
NCCCS Presidents participating in Optional Retirement Program: 12.74%
Retirement must be withheld on all permanent salary increases and non-recurring compensation adjustments (i.e. bonuses/salary supplements), if applicable.
*Regarding presidents participating in TSERS: G.S. 115D-5(a) provides that “the employer contribution rate on the local-paid portion of the salary, to be paid from local funds, shall be set by the State Treasurer based on actuarial recommendations.” Unless notified otherwise in the future, colleges should operate under the assumption that the employer contribution rate on the local-paid portion will be the same, 15.21%, as the State-paid portion.
2. Health Insurance Rates: Consistent with Section 35.13(c), the maximum annual
employer contribution rate is $5,378 for non-Medicare-eligible employees and $4,179 for Medicare-eligible employees. (Note that monthly employer contribution rates are not changing.)
3. Unemployment Insurance (UI) Reserve: The 1% UI reserve that is now required
under S.L. 2013-2. Section 5.15(b) of S.L. 2013-363 clarifies that funds shall be allocated from this reserve for State-funded community college employees. Colleges received an allocation for FY 2013-14 from this reserve and will receive an additional allotment for FY 2014-15. College allocations from this reserve will be presented separately to the State Board for approval in September.
4. Longevity: The General Assembly made no changes to longevity pay. Colleges
should continue to pay longevity to employees consistent with 1C SBCCC 400.98. Please note that consistent with this rule, longevity pay is calculated on an employee's annual base or contract salary rate. Longevity must be paid from the same funding source as an employee’s salary. Funds will be allocated separately for longevity expenses associated with employees supported by formula funds. Note that these funds may not be used to support longevity expenses related to employees supported by categorical funds.
9

10
E. Other Personnel-Related Budget Provisions – FOR INFORMATION ONLY
1. Special Annual Leave Bonus: Per Section 35.10A of S.L. 2014-100, any employee (i) who was full-time permanent employee as of September 1, 2014 and (ii) who is eligible to earn annual leave shall have a one-time additional five days of annual leave credited on September 1, 2014. The additional leave shall be accounted for separately with the annual leave bonus provided by Section 28.3A of S.L. 2002-126, by Section 30.12B(a) of S.L. 2003-284, and by Section 29.14A of S.L. 2005-276 and shall remain available until used notwithstanding any other limitation on the total number of days of annual leave that may be carried forward. Part-time permanent employees shall receive a pro-rata amount of the five days.
2. Alternative Health Benefit Coverage for Nonpermanent Full-time State
Employees: Per Section 35.16 of S.L. 2014-100, any employee who is full-time and does not otherwise qualify for health insurance coverage will be eligible for other contributory coverage. The determination of the employee’s full-time status shall be made by the employing unit and in accordance with federal regulations. The health insurance coverage shall be determined by the State Treasurer and the Board of Trustees for the State Health Plan for Teachers and State Employees (“the Board”). Any coverage approved by the Treasurer and the Board must meet minimum Affordable Care Act requirements, provide no greater coverage than a bronze-level plan, and minimize the required employer contribution in an administratively feasible manner. This section is effective January 1, 2015, and applies to plan years beginning on or after that date.
3. Health Coverage for Re-hired State Retirees: Section 35.16A of S.L. 2014-100
provides that if a retiree has been re-hired and is eligible for coverage as an employee under the State Health Plan, the retiree is not eligible for retiree coverage under the Plan.
10
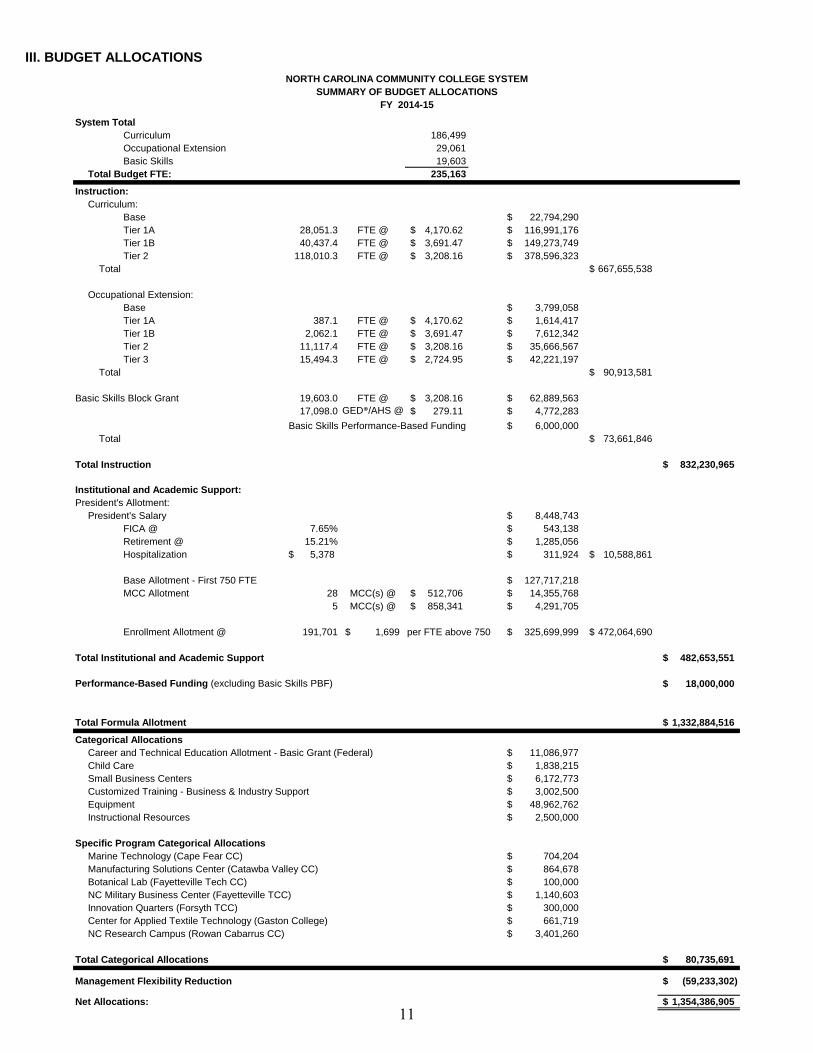
III. BUDGET ALLOCATIONS
System Total
Curriculum 186,499
Occupational Extension 29,061
Basic Skills 19,603
Total Budget FTE: 235,163
Instruction:
Curriculum:
Base 22,794,290$
Tier 1A 28,051.3 FTE @ 4,170.62$ 116,991,176$
Tier 1B 40,437.4 FTE @ 3,691.47$ 149,273,749$
Tier 2 118,010.3 FTE @ 3,208.16$ 378,596,323$
Total 667,655,538$
Occupational Extension:
Base 3,799,058$
Tier 1A 387.1 FTE @ 4,170.62$ 1,614,417$
Tier 1B 2,062.1 FTE @ 3,691.47$ 7,612,342$
Tier 2 11,117.4 FTE @ 3,208.16$ 35,666,567$
Tier 3 15,494.3 FTE @ 2,724.95$ 42,221,197$
Total 90,913,581$
Basic Skills Block Grant 19,603.0 FTE @ 3,208.16$ 62,889,563$
17,098.0 GED®/AHS @ 279.11$ 4,772,283$
6,000,000$
Total 73,661,846$
Total Instruction 832,230,965$
Institutional and Academic Support:
President's Allotment:
President's Salary 8,448,743$
FICA @ 7.65% 543,138$
Retirement @ 15.21% 1,285,056$
Hospitalization 5,378$ 311,924$ 10,588,861$
Base Allotment - First 750 FTE 127,717,218$
MCC Allotment 28 MCC(s) @ 512,706$ 14,355,768$
5 MCC(s) @ 858,341$ 4,291,705$
Enrollment Allotment @ 191,701 1,699$ per FTE above 750 325,699,999$ 472,064,690$
Total Institutional and Academic Support 482,653,551$
Performance-Based Funding (excluding Basic Skills PBF) 18,000,000$
Total Formula Allotment 1,332,884,516$
Categorical Allocations
11,086,977$
1,838,215$
6,172,773$
3,002,500$
48,962,762$
2,500,000$
Specific Program Categorical Allocations
704,204$
864,678$
100,000$
1,140,603$
Innovation Quarters (Forsyth TCC) 300,000$
661,719$
NC Research Campus (Rowan Cabarrus CC) 3,401,260$
Total Categorical Allocations 80,735,691$
Management Flexibility Reduction (59,233,302)$
Net Allocations: 1,354,386,905$
NORTH CAROLINA COMMUNITY COLLEGE SYSTEM
SUMMARY OF BUDGET ALLOCATIONS
FY 2014-15
Career and Technical Education Allotment - Basic Grant (Federal)
Child Care
Basic Skills Performance-Based Funding
Manufacturing Solutions Center (Catawba Valley CC)
Botanical Lab (Fayetteville Tech CC)
NC Military Business Center (Fayetteville TCC)
Center for Applied Textile Technology (Gaston College)
Small Business Centers
Customized Training - Business & Industry Support
Equipment
Instructional Resources
Marine Technology (Cape Fear CC)
11
NORTH CAROLINA COMMUNITY COLLEGE SYSTEMSTATEWIDE COLLEGE ALLOTMENT COMPARISON
2013-14 vs. 2014-15
FY2013-14 FY2014-15 Change +/(-) 1 % ChangeBudget FTE
Curriculum 192,190 186,499 (5,691) -3.0%
Occupational Extension 29,424 29,061 (363) -1.2%
Basic Skills 20,162 19,603 (559) -2.8%
Total Budget FTE 241,776 235,163 (6,613) -2.7%
Formula Allocations Curriculum 661,055,467 667,655,538 6,600,071 1.0%
Continuing Education 89,160,958 90,913,581 1,752,623 2.0%
Basic Skills (including Basic Skills PBF) 77,711,660 73,661,846 (4,049,814) -5.2%
Institutional Support 485,989,570 482,653,551 (3,336,019) -0.7%
Performance-Based Funding (excluding Basic Skills PBF) 9,000,000 18,000,000 9,000,000 100.0%
3 year vs. 2 year Transition Funds 4,000,000 - (4,000,000) -100.0%
Total Current Operating $1,326,917,655 $1,332,884,516 $5,966,861 0.4%
Categorical AllocationsCareer and Technical Educ. Allotment - Basic Grant (federal) 10,077,473 11,086,977 1,009,504 10.0%
Child Care 1,838,215 1,838,215 - 0.0%
Small Business Centers 6,079,718 6,172,773 93,055 1.5%
Customized Training - Business and Industry Support 3,012,500 3,002,500 (10,000) -0.3%
Equipment 58,962,762 48,962,762 (10,000,000) -17.0%
Instructional Resources 2,500,000 2,500,000 - 0.0%
Specific Program Categorical AllocationsMarine Technology (Cape Fear CC) 691,045 704,204 13,159 1.9%
Manufacturing Solutions Center (Catawba Valley CC) 699,582 864,678 165,096 23.6%
Botanical Lab (Fayetteville Tech CC) 100,000 100,000 0 0.0%
NC Military Business Center (Fayetteville TCC) 1,134,158 1,140,603 6,445 0.6%
Innovation Quarters (Forsyth TCC)2
- 300,000 300,000 100.0%
Center for Applied Textile Technology (Gaston) 505,315 661,719 156,404 31.0%
NC Research Campus (Rowan Cabarrus CC) 3,390,342 3,401,260 10,918 0.3%
Total Categorical Allocations $88,991,110 $80,735,691 ($8,255,419) -9.3%
Management Flexibility Reduction (Negative Reserve) (74,233,302) (59,233,302) 15,000,000 -20.2%
TOTAL ALLOCATION: $1,341,675,463 $1,354,386,905 $12,711,442 0.9%Total Allocation per FTE $5,549.25 $5,759.35 $210 3.8%
1 Allocations reflecting an increase/(decrease) in the difference column indicate a legislative action, a change in FTE, and/or a change due to
the increase in employer contribution rates for retirement and health insurance benefits.2 In FY 2013-14, $300,000 was allocated to Forsyth Tech for the Innovation Quarters through separate State Board action.
12
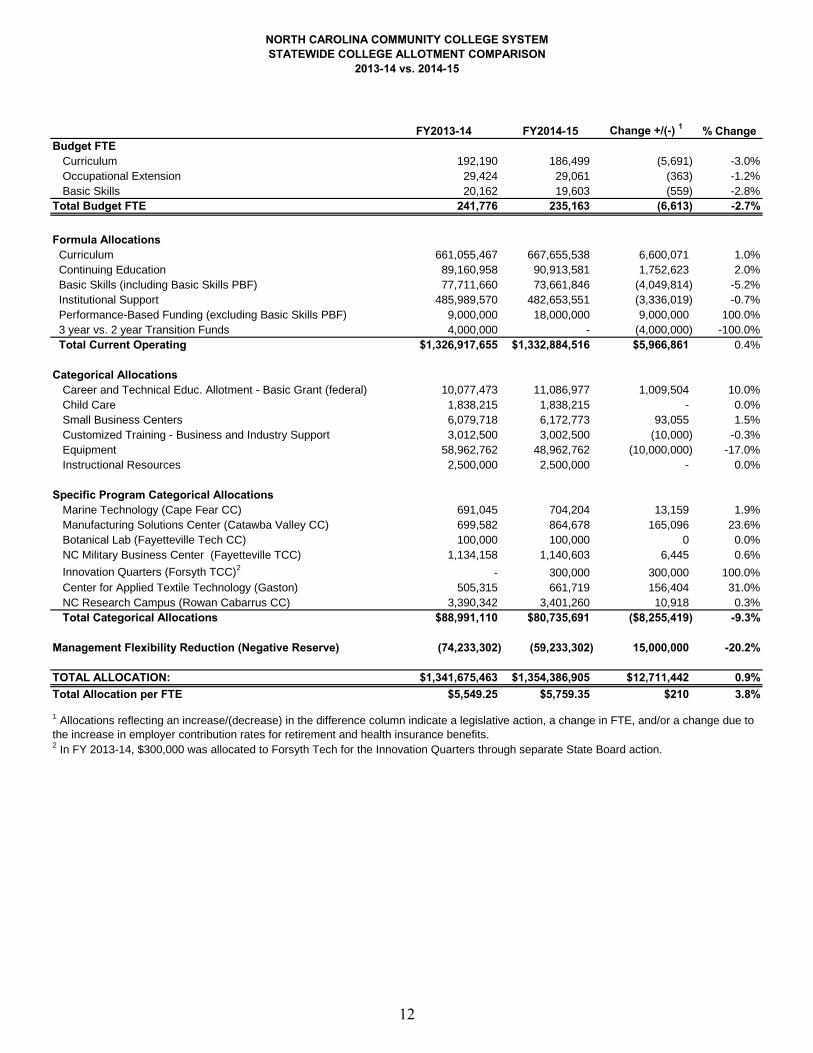
A. Formula Budget – Current Operating
The formula budget is the primary mechanism through which State funds are allocated to the
colleges for current operations. For FY 2014-15, a total of $1,332,884,516 is allocated
through the current operating formula budget. Funds are allocated using three methodologies:
1) base allocations, which provide a standard amount of support regardless of college size, 2)
enrollment allocations, which vary based on a college’s budgeted full-time equivalent (FTE)
student enrollment, and 3) performance-based allocations, which are determined based on
student outcomes. While each component of the formula budget uses a combination of these
methodologies, enrollment is the key driver for colleges’ formula budgets.
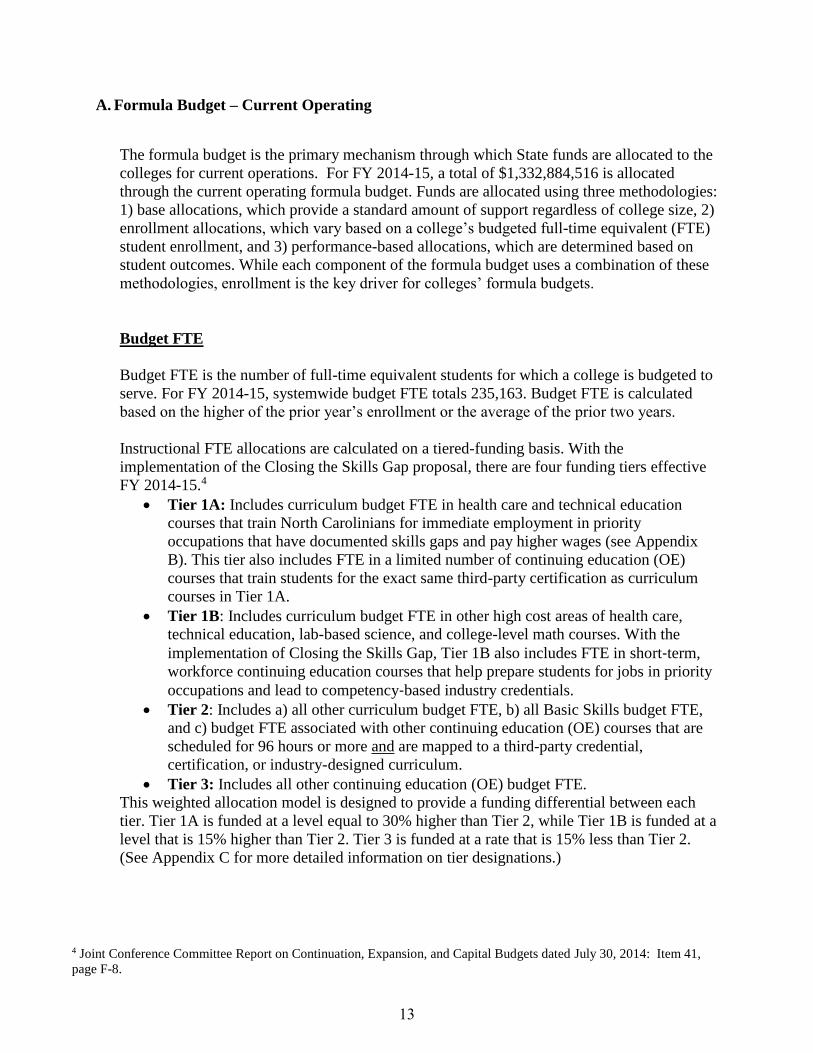
Budget FTE
Budget FTE is the number of full-time equivalent students for which a college is budgeted to
serve. For FY 2014-15, systemwide budget FTE totals 235,163. Budget FTE is calculated
based on the higher of the prior year’s enrollment or the average of the prior two years.
Instructional FTE allocations are calculated on a tiered-funding basis. With the
implementation of the Closing the Skills Gap proposal, there are four funding tiers effective
FY 2014-15.4
Tier 1A: Includes curriculum budget FTE in health care and technical education
courses that train North Carolinians for immediate employment in priority
occupations that have documented skills gaps and pay higher wages (see Appendix
B). This tier also includes FTE in a limited number of continuing education (OE)
courses that train students for the exact same third-party certification as curriculum
courses in Tier 1A.
Tier 1B: Includes curriculum budget FTE in other high cost areas of health care,
technical education, lab-based science, and college-level math courses. With the
implementation of Closing the Skills Gap, Tier 1B also includes FTE in short‐term,
workforce continuing education courses that help prepare students for jobs in priority
occupations and lead to competency‐based industry credentials.
Tier 2: Includes a) all other curriculum budget FTE, b) all Basic Skills budget FTE,
and c) budget FTE associated with other continuing education (OE) courses that are
scheduled for 96 hours or more and are mapped to a third-party credential,
certification, or industry-designed curriculum.
Tier 3: Includes all other continuing education (OE) budget FTE.
This weighted allocation model is designed to provide a funding differential between each
tier. Tier 1A is funded at a level equal to 30% higher than Tier 2, while Tier 1B is funded at a
level that is 15% higher than Tier 2. Tier 3 is funded at a rate that is 15% less than Tier 2.
(See Appendix C for more detailed information on tier designations.)
4 Joint Conference Committee Report on Continuation, Expansion, and Capital Budgets dated July 30, 2014: Item 41,
page F-8.
13

NORTH CAROLINA COMMUNITY COLLEGE SYSTEM2014-15 BUDGET FTE
Curriculum Non-Curric Basic Skills Total >750
Alamance CC 3,452 351 357 4,160 3,410
Asheville-Buncombe TCC 6,094 651 411 7,156 6,406
Beaufort County CC 1,560 203 149 1,912 1,162
Bladen CC 1,150 226 75 1,451 701
Blue Ridge CC 1,737 469 146 2,352 1,602
Brunswick CC 1,293 327 252 1,872 1,122
Caldwell CC and TI 3,226 545 310 4,081 3,331
Cape Fear CC 7,390 787 526 8,703 7,953
Carteret CC 1,408 344 120 1,872 1,122
Catawba Valley CC 3,648 603 256 4,507 3,757
Central Carolina CC 3,824 855 823 5,502 4,752
Central Piedmont CC 14,286 592 1,435 16,313 15,563
Cleveland CC 2,689 458 151 3,298 2,548
Coastal Carolina CC 3,669 714 214 4,597 3,847
College of the Albemarle 1,996 258 195 2,449 1,699
Craven CC 2,486 378 165 3,029 2,279
Davidson County CC 3,217 421 456 4,094 3,344
Durham TCC 3,714 542 372 4,628 3,878
Edgecombe CC 2,292 293 197 2,782 2,032
Fayetteville TCC 9,073 1,964 1,089 12,126 11,376
Forsyth TCC 7,298 894 663 8,855 8,105
Gaston College 4,642 355 262 5,259 4,509
Guilford TCC 10,820 824 1,111 12,755 12,005
Halifax CC 1,257 293 109 1,659 909
Haywood CC 1,725 260 52 2,037 1,287
Isothermal CC 1,932 240 139 2,311 1,561
James Sprunt CC 1,213 227 74 1,514 764
Johnston CC 3,535 549 258 4,342 3,592
Lenoir CC 2,301 1,575 411 4,287 3,537
Martin CC 628 207 129 964 214
Mayland CC 963 421 327 1,711 961
McDowell TCC 1,034 237 116 1,387 637
Mitchell CC 2,422 331 209 2,962 2,212
Montgomery CC 698 231 80 1,009 259
Nash CC 2,618 424 163 3,205 2,455
Pamlico CC 470 165 77 712 0
Piedmont CC 1,345 594 160 2,099 1,349
Pitt CC 7,206 541 419 8,166 7,416
Randolph CC 2,424 310 302 3,036 2,286
Richmond CC 1,922 360 481 2,763 2,013
Roanoke Chowan CC 674 169 83 926 176
Robeson CC 2,051 626 637 3,314 2,564
Rockingham CC 1,560 264 100 1,924 1,174
Rowan-Cabarrus CC 5,241 727 431 6,399 5,649
Sampson CC 1,173 324 345 1,842 1,092
Sandhills CC 3,208 356 386 3,950 3,200
South Piedmont CC 1,698 626 324 2,648 1,898
Southeastern CC 1,300 635 366 2,301 1,551
Southwestern CC 1,983 458 102 2,543 1,793
Stanly CC 2,174 441 190 2,805 2,055
Surry CC 2,672 487 245 3,404 2,654
Tri-County CC 1,128 141 46 1,315 565
Vance-Granville CC 2,844 569 351 3,764 3,014
Wake TCC 15,077 1,634 1,566 18,277 17,527
Wayne CC 3,174 442 314 3,930 3,180
Western Piedmont CC 2,048 356 406 2,810 2,060
Wilkes CC 2,390 473 258 3,121 2,371
Wilson CC 1,447 314 212 1,973 1,223
TOTAL 186,499 29,061 19,603 235,163 191,701
14

NORTH CAROLINA COMMUNITY COLLEGE SYSTEM2014-15 BUDGET FTE BY TIER
College Alamance CC
Asheville-Buncombe TCC
Beaufort County CC
Bladen CC
Blue Ridge CC
Brunswick CC
Caldwell CC and TI
Cape Fear CC
Carteret CC
Catawba Valley CC
Central Carolina CC
Central Piedmont CC
Cleveland CC
Coastal Carolina CC
College of the Albemarle
Craven CC
Davidson County CC
Durham TCC
Edgecombe CC
Fayetteville TCC
Forsyth TCC
Gaston College
Guilford TCC
Halifax CC
Haywood CC
Isothermal CC
James Sprunt CC
Johnston CC
Lenoir CC
Martin CC
Mayland CC
McDowell TCC
Mitchell CC
Montgomery CC
Nash CC
Pamlico CC
Piedmont CC
Pitt CC
Randolph CC
Richmond CC
Roanoke Chowan CC
Robeson CC
Rockingham CC
Rowan-Cabarrus CC
Sampson CC
Sandhills CC
South Piedmont CC
Southeastern CC
Southwestern CC
Stanly CC
Surry CC
Tri-County CC
Vance-Granville CC
Wake TCC
Wayne CC
Western Piedmont CC
Wilkes CC
Wilson CC Total FTE
Basic Skills BFTE
Tier 1A Tier 1B Tier 2 Subtotal Tier 1A Tier 1B Tier 2 Tier 3 Subtotal Tier 2 Total428.1 831.7 2,192.2 3,452.0 0.0 3.2 126.2 221.6 351.0 357.0 4,160.0
1,007.5 1,725.5 3,361.0 6,094.0 0.0 57.9 247.8 345.3 651.0 411.0 7,156.0
339.7 247.1 973.3 1,560.0 25.5 16.8 32.9 127.8 203.0 149.0 1,912.0
212.2 210.5 727.3 1,150.0 0.0 7.6 141.7 76.7 226.0 75.0 1,451.0
315.7 359.1 1,062.3 1,737.0 0.0 61.3 137.5 270.2 469.0 146.0 2,352.0
143.4 388.0 761.5 1,293.0 0.0 39.2 112.6 175.1 327.0 252.0 1,872.0
496.5 809.6 1,919.9 3,226.0 71.4 26.4 215.3 231.9 545.0 310.0 4,081.0
1,265.6 1,399.4 4,725.0 7,390.0 0.0 117.5 270.2 399.4 787.0 526.0 8,703.0
169.8 336.9 901.3 1,408.0 0.0 21.1 112.7 210.2 344.0 120.0 1,872.0
497.3 770.0 2,380.7 3,648.0 0.0 10.0 192.7 400.3 603.0 256.0 4,507.0
596.8 777.6 2,449.5 3,824.0 0.0 76.9 468.2 309.9 855.0 823.0 5,502.0
1,654.5 3,127.4 9,504.1 14,286.0 0.0 33.9 176.7 381.4 592.0 1,435.0 16,313.0
468.4 696.8 1,523.8 2,689.0 0.0 145.9 134.9 177.3 458.0 151.0 3,298.0
375.6 859.0 2,434.5 3,669.0 0.0 35.5 352.0 326.4 714.0 214.0 4,597.0
283.2 357.5 1,355.3 1,996.0 0.0 7.7 95.4 154.9 258.0 195.0 2,449.0
421.3 550.8 1,513.9 2,486.0 30.1 6.0 109.1 232.8 378.0 165.0 3,029.0
438.6 924.3 1,854.1 3,217.0 0.0 5.9 147.1 268.0 421.0 456.0 4,094.0
558.5 1,006.4 2,149.1 3,714.0 10.2 6.1 227.1 298.6 542.0 372.0 4,628.0
389.8 506.6 1,395.6 2,292.0 0.0 10.8 122.5 159.7 293.0 197.0 2,782.0
1,227.0 1,879.5 5,966.5 9,073.0 4.4 92.1 1,172.1 695.3 1,964.0 1,089.0 12,126.0
1,373.3 1,557.4 4,367.4 7,298.0 38.2 46.3 301.9 507.6 894.0 663.0 8,855.0
592.2 1,145.1 2,904.7 4,642.0 5.3 0.0 92.9 256.8 355.0 262.0 5,259.0
1,538.4 1,990.1 7,291.5 10,820.0 20.4 42.6 268.7 492.3 824.0 1,111.0 12,755.0
303.6 202.0 751.3 1,257.0 0.0 0.0 79.2 213.8 293.0 109.0 1,659.0
318.3 283.6 1,123.0 1,725.0 0.0 17.1 119.1 123.8 260.0 52.0 2,037.0
382.9 292.6 1,256.5 1,932.0 0.0 0.0 140.1 99.9 240.0 139.0 2,311.0
170.7 204.4 837.9 1,213.0 0.0 17.5 99.2 110.3 227.0 74.0 1,514.0
688.5 765.2 2,081.3 3,535.0 37.1 39.6 261.2 211.2 549.0 258.0 4,342.0
304.8 484.7 1,511.5 2,301.0 0.0 44.2 966.9 563.8 1,575.0 411.0 4,287.0
160.1 100.0 367.9 628.0 0.0 32.2 94.1 80.7 207.0 129.0 964.0
195.0 225.7 542.3 963.0 0.0 59.4 161.2 200.4 421.0 327.0 1,711.0
286.2 229.0 518.8 1,034.0 0.0 0.0 43.4 193.6 237.0 116.0 1,387.0
182.0 500.3 1,739.7 2,422.0 0.0 29.8 133.5 167.7 331.0 209.0 2,962.0
134.0 192.2 371.7 698.0 0.0 15.2 44.0 171.8 231.0 80.0 1,009.0
539.7 475.6 1,602.7 2,618.0 12.3 35.5 144.5 231.6 424.0 163.0 3,205.0
92.2 137.5 240.2 470.0 4.4 21.8 33.8 105.1 165.0 77.0 712.0
242.1 326.5 776.4 1,345.0 3.4 150.8 157.6 282.3 594.0 160.0 2,099.0
1,199.1 1,396.4 4,610.4 7,206.0 0.0 0.0 288.1 252.9 541.0 419.0 8,166.0
435.1 353.0 1,635.9 2,424.0 0.0 16.9 73.5 219.6 310.0 302.0 3,036.0
307.0 405.7 1,209.2 1,922.0 0.0 50.5 91.2 218.3 360.0 481.0 2,763.0
138.1 89.1 446.7 674.0 0.0 22.3 77.3 69.4 169.0 83.0 926.0
283.7 414.2 1,353.0 2,051.0 0.0 107.8 187.7 330.5 626.0 637.0 3,314.0
297.7 290.0 972.3 1,560.0 0.0 2.7 83.5 177.9 264.0 100.0 1,924.0
652.7 985.0 3,603.3 5,241.0 0.0 96.3 268.1 362.6 727.0 431.0 6,399.0
177.8 244.8 750.3 1,173.0 62.7 1.4 64.4 195.5 324.0 345.0 1,842.0
431.1 753.6 2,023.3 3,208.0 0.0 2.7 126.7 226.6 356.0 386.0 3,950.0
235.9 399.3 1,062.8 1,698.0 0.0 80.5 229.6 315.9 626.0 324.0 2,648.0
253.6 232.2 814.3 1,300.0 0.0 27.4 158.0 449.5 635.0 366.0 2,301.0
325.6 547.0 1,110.3 1,983.0 0.0 50.3 145.9 261.8 458.0 102.0 2,543.0
335.7 436.6 1,401.7 2,174.0 14.8 61.3 142.3 222.6 441.0 190.0 2,805.0
480.9 534.7 1,656.4 2,672.0 0.0 29.6 233.8 223.5 487.0 245.0 3,404.0
204.8 279.2 644.0 1,128.0 0.0 14.9 92.7 33.4 141.0 46.0 1,315.0
481.2 555.1 1,807.6 2,844.0 6.0 30.3 216.2 316.4 569.0 351.0 3,764.0
1,390.5 3,776.8 9,909.7 15,077.0 36.6 81.3 366.0 1,150.2 1,634.0 1,566.0 18,277.0
600.3 634.5 1,939.2 3,174.0 0.0 0.0 111.5 330.5 442.0 314.0 3,930.0
265.3 489.0 1,293.7 2,048.0 0.0 31.7 84.4 239.9 356.0 406.0 2,810.0
531.3 535.6 1,323.1 2,390.0 0.0 12.6 210.6 249.8 473.0 258.0 3,121.0
230.3 209.9 1,006.9 1,447.0 4.3 7.8 130.0 171.8 314.0 212.0 1,973.028,051.3 40,437.4 118,010.3 186,499.0 387.1 2,062.1 11,117.4 15,494.3 29,061.0 19,603.0 235,163.0
15% 22% 63% 1% 7% 38% 53%
Curriculum BFTE Con Ed (OE) BFTE
15

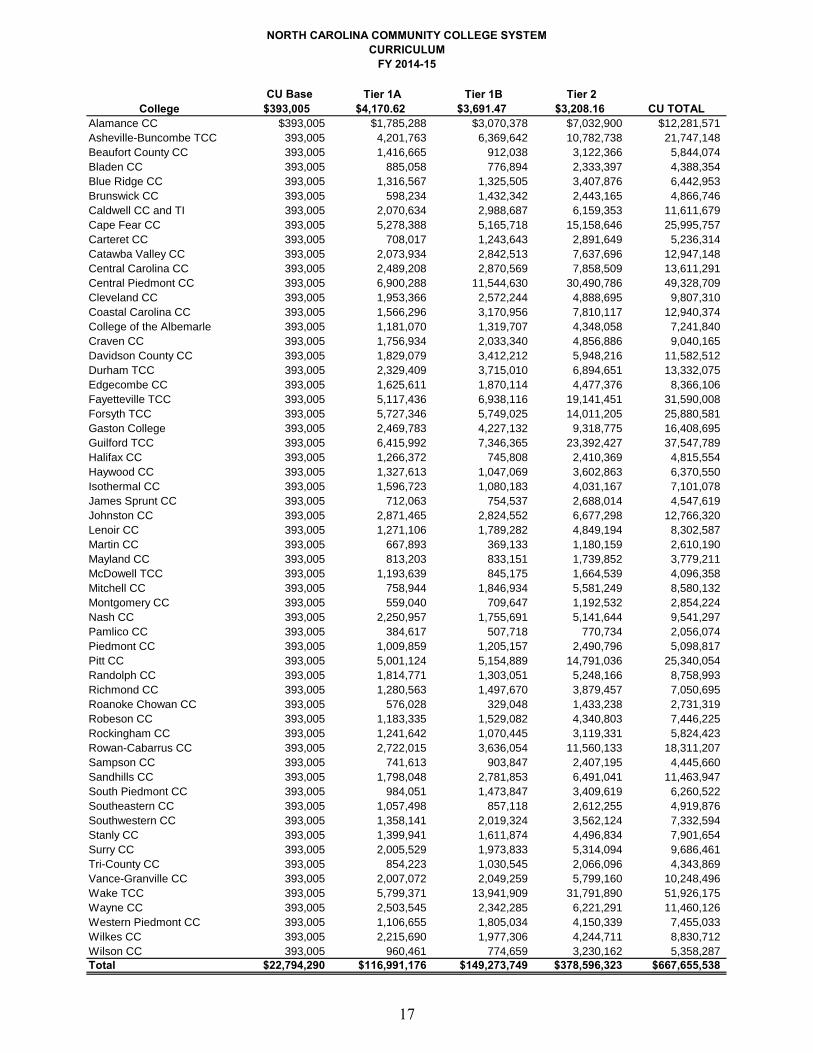
1. Curriculum Instruction
Purpose: A total of $667,655,538 is allocated for curriculum instruction, including
instructional salaries, fringe benefits, and other costs, such as supplies, materials, and faculty
travel.
Allocation Method: Curriculum budget FTE equals the average curriculum FTE enrollment
of the past two years (fall and spring) or the latest year, whichever is greater, excluding any
self-supporting FTE. A college’s curriculum budget FTE is categorized into three funding
tiers based on the proportion of the college’s actual FTE in each tier. Tier 1A includes
curriculum budget FTE in health care and technical education courses that train North
Carolinians for immediate employment in priority occupations that have documented skills
gaps and pay higher wages. Tier 1B includes FTE in other high-cost health care, technical
education, lab-based science, and college-level math courses. Tier 2 includes FTE in all
other curriculum courses. (See Appendix C for more information about tier designations.)
Systemwide 15% of curriculum FTE are in Tier 1A, 22% in Tier 1B, and 63% are in Tier 2.
Each college receives a base curriculum allocation of $393,005 which represents funding for
six instructional units (or the equivalent of six full-time faculty members). In addition to this
base, a college is allocated $4,170.62 for each BFTE in Tier 1A, $3,691.47 in Tier 1B, and
$3,208.16 for each BFTE in Tier 2. These tier values have been adjusted from FY 2013-14
levels to account for legislative adjustments, the legislative salary increase, and changes in
employer contribution rates for hospitalization insurance and retirement.5
Fiscal Management: These funds are budgeted and expended through the following codes:
Purpose codes: 220
Vocational code: 97, 20, consistent with the Accounting Procedures Manual
5 Joint Conference Committee Report on Continuation, Expansion, and Capital Budgets dated July 30, 2014: Items 36-
37, page F-8; Item 41, page F-9; and Item 32, page K-6. Joint Conference Committee Report on Continuation,
Expansion, and Capital Budgets dated July 21, 2013: Item 39, page F-8.
16
NORTH CAROLINA COMMUNITY COLLEGE SYSTEMCURRICULUM
FY 2014-15
CU Base Tier 1A Tier 1B Tier 2College $393,005 $4,170.62 $3,691.47 $3,208.16 CU TOTAL
Alamance CC $393,005 $1,785,288 $3,070,378 $7,032,900 $12,281,571
Asheville-Buncombe TCC 393,005 4,201,763 6,369,642 10,782,738 21,747,148
Beaufort County CC 393,005 1,416,665 912,038 3,122,366 5,844,074
Bladen CC 393,005 885,058 776,894 2,333,397 4,388,354
Blue Ridge CC 393,005 1,316,567 1,325,505 3,407,876 6,442,953
Brunswick CC 393,005 598,234 1,432,342 2,443,165 4,866,746
Caldwell CC and TI 393,005 2,070,634 2,988,687 6,159,353 11,611,679
Cape Fear CC 393,005 5,278,388 5,165,718 15,158,646 25,995,757
Carteret CC 393,005 708,017 1,243,643 2,891,649 5,236,314
Catawba Valley CC 393,005 2,073,934 2,842,513 7,637,696 12,947,148
Central Carolina CC 393,005 2,489,208 2,870,569 7,858,509 13,611,291
Central Piedmont CC 393,005 6,900,288 11,544,630 30,490,786 49,328,709
Cleveland CC 393,005 1,953,366 2,572,244 4,888,695 9,807,310
Coastal Carolina CC 393,005 1,566,296 3,170,956 7,810,117 12,940,374
College of the Albemarle 393,005 1,181,070 1,319,707 4,348,058 7,241,840
Craven CC 393,005 1,756,934 2,033,340 4,856,886 9,040,165
Davidson County CC 393,005 1,829,079 3,412,212 5,948,216 11,582,512
Durham TCC 393,005 2,329,409 3,715,010 6,894,651 13,332,075
Edgecombe CC 393,005 1,625,611 1,870,114 4,477,376 8,366,106
Fayetteville TCC 393,005 5,117,436 6,938,116 19,141,451 31,590,008
Forsyth TCC 393,005 5,727,346 5,749,025 14,011,205 25,880,581
Gaston College 393,005 2,469,783 4,227,132 9,318,775 16,408,695
Guilford TCC 393,005 6,415,992 7,346,365 23,392,427 37,547,789
Halifax CC 393,005 1,266,372 745,808 2,410,369 4,815,554
Haywood CC 393,005 1,327,613 1,047,069 3,602,863 6,370,550
Isothermal CC 393,005 1,596,723 1,080,183 4,031,167 7,101,078
James Sprunt CC 393,005 712,063 754,537 2,688,014 4,547,619
Johnston CC 393,005 2,871,465 2,824,552 6,677,298 12,766,320
Lenoir CC 393,005 1,271,106 1,789,282 4,849,194 8,302,587
Martin CC 393,005 667,893 369,133 1,180,159 2,610,190
Mayland CC 393,005 813,203 833,151 1,739,852 3,779,211
McDowell TCC 393,005 1,193,639 845,175 1,664,539 4,096,358
Mitchell CC 393,005 758,944 1,846,934 5,581,249 8,580,132
Montgomery CC 393,005 559,040 709,647 1,192,532 2,854,224
Nash CC 393,005 2,250,957 1,755,691 5,141,644 9,541,297
Pamlico CC 393,005 384,617 507,718 770,734 2,056,074
Piedmont CC 393,005 1,009,859 1,205,157 2,490,796 5,098,817
Pitt CC 393,005 5,001,124 5,154,889 14,791,036 25,340,054
Randolph CC 393,005 1,814,771 1,303,051 5,248,166 8,758,993
Richmond CC 393,005 1,280,563 1,497,670 3,879,457 7,050,695
Roanoke Chowan CC 393,005 576,028 329,048 1,433,238 2,731,319
Robeson CC 393,005 1,183,335 1,529,082 4,340,803 7,446,225
Rockingham CC 393,005 1,241,642 1,070,445 3,119,331 5,824,423
Rowan-Cabarrus CC 393,005 2,722,015 3,636,054 11,560,133 18,311,207
Sampson CC 393,005 741,613 903,847 2,407,195 4,445,660
Sandhills CC 393,005 1,798,048 2,781,853 6,491,041 11,463,947
South Piedmont CC 393,005 984,051 1,473,847 3,409,619 6,260,522
Southeastern CC 393,005 1,057,498 857,118 2,612,255 4,919,876
Southwestern CC 393,005 1,358,141 2,019,324 3,562,124 7,332,594
Stanly CC 393,005 1,399,941 1,611,874 4,496,834 7,901,654
Surry CC 393,005 2,005,529 1,973,833 5,314,094 9,686,461
Tri-County CC 393,005 854,223 1,030,545 2,066,096 4,343,869
Vance-Granville CC 393,005 2,007,072 2,049,259 5,799,160 10,248,496
Wake TCC 393,005 5,799,371 13,941,909 31,791,890 51,926,175
Wayne CC 393,005 2,503,545 2,342,285 6,221,291 11,460,126
Western Piedmont CC 393,005 1,106,655 1,805,034 4,150,339 7,455,033
Wilkes CC 393,005 2,215,690 1,977,306 4,244,711 8,830,712
Wilson CC 393,005 960,461 774,659 3,230,162 5,358,287
Total $22,794,290 $116,991,176 $149,273,749 $378,596,323 $667,655,538
17
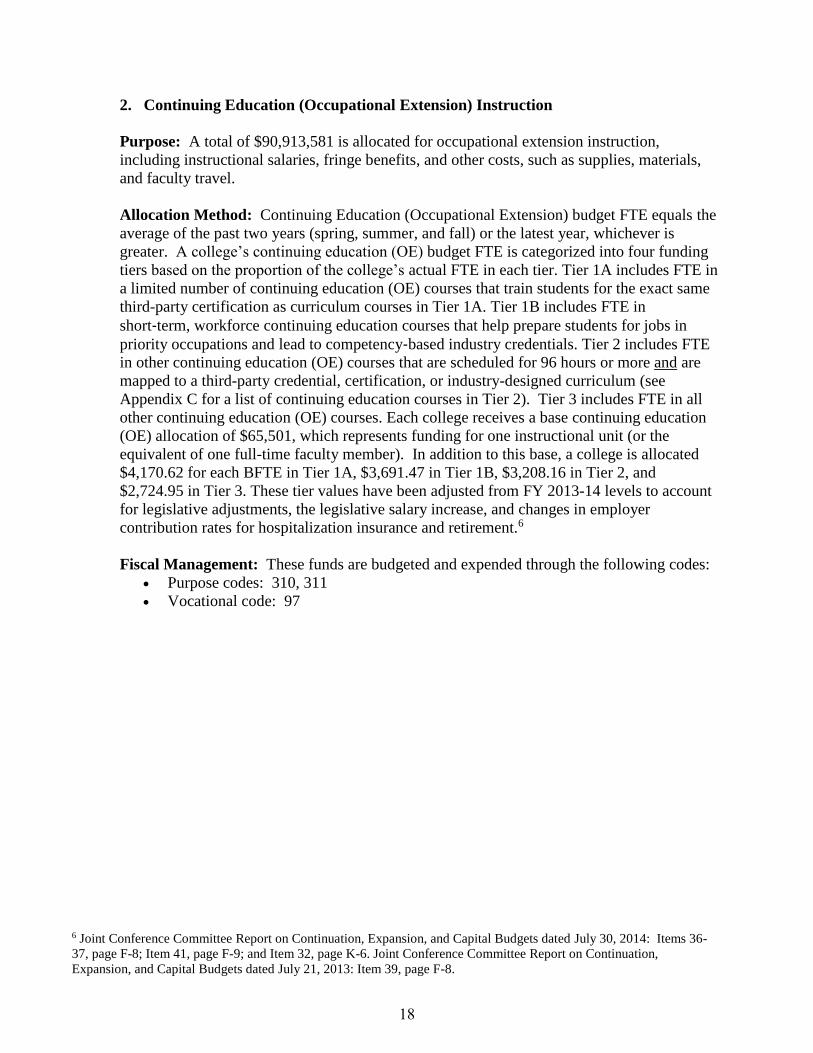
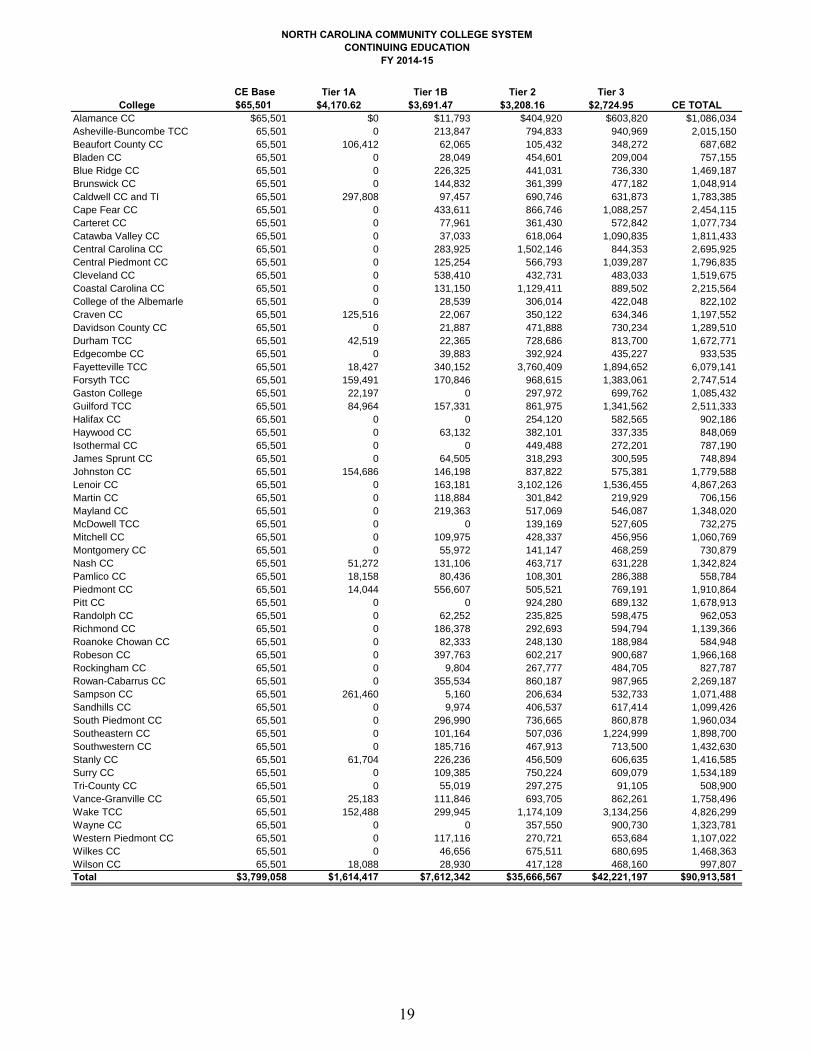
2. Continuing Education (Occupational Extension) Instruction
Purpose: A total of $90,913,581 is allocated for occupational extension instruction,
including instructional salaries, fringe benefits, and other costs, such as supplies, materials,
and faculty travel.
Allocation Method: Continuing Education (Occupational Extension) budget FTE equals the
average of the past two years (spring, summer, and fall) or the latest year, whichever is
greater. A college’s continuing education (OE) budget FTE is categorized into four funding
tiers based on the proportion of the college’s actual FTE in each tier. Tier 1A includes FTE in
a limited number of continuing education (OE) courses that train students for the exact same
third-party certification as curriculum courses in Tier 1A. Tier 1B includes FTE in
short‐term, workforce continuing education courses that help prepare students for jobs in
priority occupations and lead to competency‐based industry credentials. Tier 2 includes FTE
in other continuing education (OE) courses that are scheduled for 96 hours or more and are
mapped to a third-party credential, certification, or industry-designed curriculum (see
Appendix C for a list of continuing education courses in Tier 2). Tier 3 includes FTE in all
other continuing education (OE) courses. Each college receives a base continuing education
(OE) allocation of $65,501, which represents funding for one instructional unit (or the
equivalent of one full-time faculty member). In addition to this base, a college is allocated
$4,170.62 for each BFTE in Tier 1A, $3,691.47 in Tier 1B, $3,208.16 in Tier 2, and
$2,724.95 in Tier 3. These tier values have been adjusted from FY 2013-14 levels to account
for legislative adjustments, the legislative salary increase, and changes in employer
contribution rates for hospitalization insurance and retirement.6
Fiscal Management: These funds are budgeted and expended through the following codes:
Purpose codes: 310, 311
Vocational code: 97
6 Joint Conference Committee Report on Continuation, Expansion, and Capital Budgets dated July 30, 2014: Items 36-
37, page F-8; Item 41, page F-9; and Item 32, page K-6. Joint Conference Committee Report on Continuation,
Expansion, and Capital Budgets dated July 21, 2013: Item 39, page F-8.
18
NORTH CAROLINA COMMUNITY COLLEGE SYSTEMCONTINUING EDUCATION
FY 2014-15
CE Base Tier 1A Tier 1B Tier 2 Tier 3College $65,501 $4,170.62 $3,691.47 $3,208.16 $2,724.95 CE TOTAL
Alamance CC $65,501 $0 $11,793 $404,920 $603,820 $1,086,034
Asheville-Buncombe TCC 65,501 0 213,847 794,833 940,969 2,015,150
Beaufort County CC 65,501 106,412 62,065 105,432 348,272 687,682
Bladen CC 65,501 0 28,049 454,601 209,004 757,155
Blue Ridge CC 65,501 0 226,325 441,031 736,330 1,469,187
Brunswick CC 65,501 0 144,832 361,399 477,182 1,048,914
Caldwell CC and TI 65,501 297,808 97,457 690,746 631,873 1,783,385
Cape Fear CC 65,501 0 433,611 866,746 1,088,257 2,454,115
Carteret CC 65,501 0 77,961 361,430 572,842 1,077,734
Catawba Valley CC 65,501 0 37,033 618,064 1,090,835 1,811,433
Central Carolina CC 65,501 0 283,925 1,502,146 844,353 2,695,925
Central Piedmont CC 65,501 0 125,254 566,793 1,039,287 1,796,835
Cleveland CC 65,501 0 538,410 432,731 483,033 1,519,675
Coastal Carolina CC 65,501 0 131,150 1,129,411 889,502 2,215,564
College of the Albemarle 65,501 0 28,539 306,014 422,048 822,102
Craven CC 65,501 125,516 22,067 350,122 634,346 1,197,552
Davidson County CC 65,501 0 21,887 471,888 730,234 1,289,510
Durham TCC 65,501 42,519 22,365 728,686 813,700 1,672,771
Edgecombe CC 65,501 0 39,883 392,924 435,227 933,535
Fayetteville TCC 65,501 18,427 340,152 3,760,409 1,894,652 6,079,141
Forsyth TCC 65,501 159,491 170,846 968,615 1,383,061 2,747,514
Gaston College 65,501 22,197 0 297,972 699,762 1,085,432
Guilford TCC 65,501 84,964 157,331 861,975 1,341,562 2,511,333
Halifax CC 65,501 0 0 254,120 582,565 902,186
Haywood CC 65,501 0 63,132 382,101 337,335 848,069
Isothermal CC 65,501 0 0 449,488 272,201 787,190
James Sprunt CC 65,501 0 64,505 318,293 300,595 748,894
Johnston CC 65,501 154,686 146,198 837,822 575,381 1,779,588
Lenoir CC 65,501 0 163,181 3,102,126 1,536,455 4,867,263
Martin CC 65,501 0 118,884 301,842 219,929 706,156
Mayland CC 65,501 0 219,363 517,069 546,087 1,348,020
McDowell TCC 65,501 0 0 139,169 527,605 732,275
Mitchell CC 65,501 0 109,975 428,337 456,956 1,060,769
Montgomery CC 65,501 0 55,972 141,147 468,259 730,879
Nash CC 65,501 51,272 131,106 463,717 631,228 1,342,824
Pamlico CC 65,501 18,158 80,436 108,301 286,388 558,784
Piedmont CC 65,501 14,044 556,607 505,521 769,191 1,910,864
Pitt CC 65,501 0 0 924,280 689,132 1,678,913
Randolph CC 65,501 0 62,252 235,825 598,475 962,053
Richmond CC 65,501 0 186,378 292,693 594,794 1,139,366
Roanoke Chowan CC 65,501 0 82,333 248,130 188,984 584,948
Robeson CC 65,501 0 397,763 602,217 900,687 1,966,168
Rockingham CC 65,501 0 9,804 267,777 484,705 827,787
Rowan-Cabarrus CC 65,501 0 355,534 860,187 987,965 2,269,187
Sampson CC 65,501 261,460 5,160 206,634 532,733 1,071,488
Sandhills CC 65,501 0 9,974 406,537 617,414 1,099,426
South Piedmont CC 65,501 0 296,990 736,665 860,878 1,960,034
Southeastern CC 65,501 0 101,164 507,036 1,224,999 1,898,700
Southwestern CC 65,501 0 185,716 467,913 713,500 1,432,630
Stanly CC 65,501 61,704 226,236 456,509 606,635 1,416,585
Surry CC 65,501 0 109,385 750,224 609,079 1,534,189
Tri-County CC 65,501 0 55,019 297,275 91,105 508,900
Vance-Granville CC 65,501 25,183 111,846 693,705 862,261 1,758,496
Wake TCC 65,501 152,488 299,945 1,174,109 3,134,256 4,826,299
Wayne CC 65,501 0 0 357,550 900,730 1,323,781
Western Piedmont CC 65,501 0 117,116 270,721 653,684 1,107,022
Wilkes CC 65,501 0 46,656 675,511 680,695 1,468,363
Wilson CC 65,501 18,088 28,930 417,128 468,160 997,807
Total $3,799,058 $1,614,417 $7,612,342 $35,666,567 $42,221,197 $90,913,581
19

20
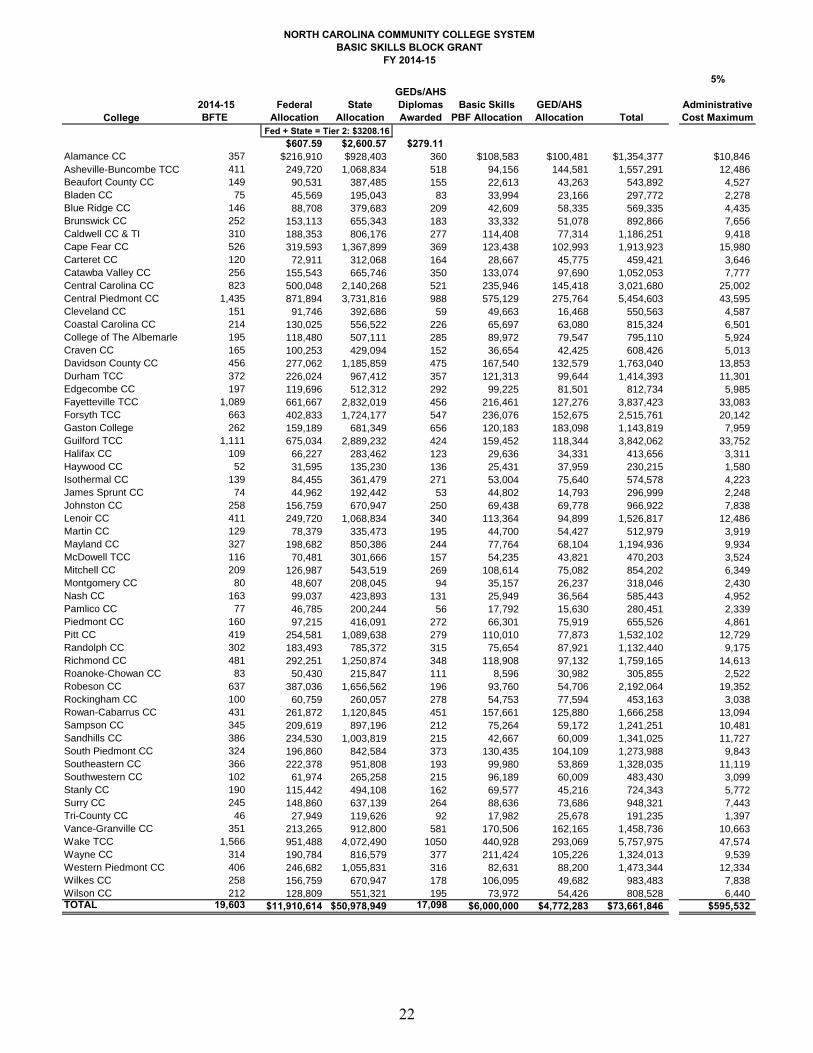
3. Basic Skills Block Grant
Purpose: A total of $73,661,846 is allocated through the Basic Skills Block Grant to support basic skills (literacy) instruction, which is defined as all course offerings related to Adult Basic Education, Adult High School Diploma programs, General Education Development programs, English as a Second Language (ESL), and the Compensatory Education curriculum. Per G.S. 115D-31(b1), Basic Skills funds must be used only for Basic Skills education programs and may not be transferred to any other area. These funds may be used to hire assessment and retention specialists; these funds may also be used to pay for transportation of Basic Skills students. Up to 5% of the federal portion of the Basic Skills block grant may be used for support of administrative functions (such as Director of Basic Skills programs, clerical, etc.).7 Up to five percent of the Basic Skills Block Grant may be used to procure instructional technology including computers for student use in the college’s literacy lab, instructional software and software licenses, scanners for testing, and classroom projection equipment. No other equipment or capital items can be purchased with Basic Skills funds. Title II – Adult Education and Literacy of the Workforce Investment Act of 1998 no longer requires colleges to spend 10% of the federal allotment on instructor training. However, there is no prohibition against colleges using the funds for that purpose.
If funds are transferred to equipment (purpose code 923), the college must send in a copy of the invoice when the funds are expended.
Allocation Method: Basic Skills budget FTE equals the average of the past two years (spring, summer, and fall) or the latest year, whichever is greater. Basic Skills FTE are reported on a contact hour basis. A college’s Basic Skills Block Grant allocation is determined by the sum of the following components:
FTE allocation – Basic Skills FTEs are funded at the Tier 2 rate. A college is allocated $3,208.16 for each BFTE in Tier 2. The FTE allocation is supported through a combination of Federal and State funds. These tier values have been adjusted from FY 2013-14 levels to account for legislative adjustments, the legislative salary increase, and changes in employer contribution rates for hospitalization insurance and retirement.8
Basic Skills Performance-Based Funding allocation: In FY 2014-15, $6 million of
the Basic Skills Block Grant is allocated based on college performance on two measures: 1) Progress of Basic Skills Students and 2) GED® (GED Testing Services,
7 In cases where the 5% limitation is too restrictive to allow for adequate planning, administration, personnel development, and interagency coordination, the college may request that the System Office to review its situation in order to determine an adequate level of funds to be used for non-instructional purposes. 8 Joint Conference Committee Report on Continuation, Expansion, and Capital Budgets dated July 30, 2014: Items 36- 37, page F-8; Item 41, page F-9; and Item 32, page K-6.
20

21
LLC) Attainment.9 Funds are allocated using the Performance-Based Funding (PBF) model described in Section II, Part A5. Additional detail on the quality and impact calculations for each measure can be found in Appendix D.
GED/AHS Performance Incentive allocation: After providing the FTE and PBF allocations, the remaining State funds are allocated among colleges based on their pro-rata share of the number of GEDs and Adult High School (AHS) diplomas awarded. In FY 2014-15, colleges receive an additional $279.11 per GED/AHS diploma awarded. The total amount allocated through this component is significantly less than FY 2013-14 because of the phase-in of the PBF allocation and a $3 million cut to Basic Skills funding included in the 2013 Appropriations Act.10
Basic Skills Plus: Section 10.3 of S.L. 2013-360 gives approved colleges the flexibility to bridge the gap between basic skills and curriculum and continuing education by providing employability skills, job-specific occupational and/or technical skills, and developmental education free of charge to Basic Skills students concurrently pursuing a high school diploma or GED. Specifically, the legislation enables the State Board of Community Colleges to authorize a community college to use up to 20% of its State Basic Skills allocation to implement pathways programs for basic skills students. Only colleges that receive State Board approval may utilize this flexibility. Once a college receives State Board approval, that approval remains in force unless the State Board or the General Assembly takes further action impacting that approval. Fiscal Management: These funds are budgeted and expended through the following codes:
Purpose codes: current – 321, 322, 323, 324, 325 (the 5% of the federal portion that is used for support of administrative functions), 320 (Basic Skills Plus – approved colleges only); capitalized equipment – 923 (instructional technology only)
Vocational code: 97
Each college can track their Federal and State expenditures separately, but is not required. If a college does not track which funding source is being used throughout the fiscal year, the assumption is that federal funds are spent first. All Federal funds must be fully expended on or before June 30, 2015.
9 Joint Conference Committee Report on Continuation, Expansion, and Capital Budgets dated July 21, 2013: Item 39, page F-8. 10 Joint Conference Committee Report on Continuation, Expansion, and Capital Budgets dated July 21, 2013: Item 42, page F-8.
21
NORTH CAROLINA COMMUNITY COLLEGE SYSTEMBASIC SKILLS BLOCK GRANT
FY 2014-15
5%
College 2014-15
BFTE Federal
AllocationState
Allocation
GEDs/AHS Diplomas Awarded
Basic Skills PBF Allocation
GED/AHS Allocation Total
Administrative Cost Maximum
$607.59 $2,600.57 $279.11Alamance CC 357 $216,910 $928,403 360 $108,583 $100,481 $1,354,377 $10,846
Asheville-Buncombe TCC 411 249,720 1,068,834 518 94,156 144,581 1,557,291 12,486
Beaufort County CC 149 90,531 387,485 155 22,613 43,263 543,892 4,527
Bladen CC 75 45,569 195,043 83 33,994 23,166 297,772 2,278
Blue Ridge CC 146 88,708 379,683 209 42,609 58,335 569,335 4,435
Brunswick CC 252 153,113 655,343 183 33,332 51,078 892,866 7,656
Caldwell CC & TI 310 188,353 806,176 277 114,408 77,314 1,186,251 9,418
Cape Fear CC 526 319,593 1,367,899 369 123,438 102,993 1,913,923 15,980
Carteret CC 120 72,911 312,068 164 28,667 45,775 459,421 3,646
Catawba Valley CC 256 155,543 665,746 350 133,074 97,690 1,052,053 7,777
Central Carolina CC 823 500,048 2,140,268 521 235,946 145,418 3,021,680 25,002
Central Piedmont CC 1,435 871,894 3,731,816 988 575,129 275,764 5,454,603 43,595
Cleveland CC 151 91,746 392,686 59 49,663 16,468 550,563 4,587
Coastal Carolina CC 214 130,025 556,522 226 65,697 63,080 815,324 6,501
College of The Albemarle 195 118,480 507,111 285 89,972 79,547 795,110 5,924
Craven CC 165 100,253 429,094 152 36,654 42,425 608,426 5,013
Davidson County CC 456 277,062 1,185,859 475 167,540 132,579 1,763,040 13,853
Durham TCC 372 226,024 967,412 357 121,313 99,644 1,414,393 11,301
Edgecombe CC 197 119,696 512,312 292 99,225 81,501 812,734 5,985
Fayetteville TCC 1,089 661,667 2,832,019 456 216,461 127,276 3,837,423 33,083
Forsyth TCC 663 402,833 1,724,177 547 236,076 152,675 2,515,761 20,142
Gaston College 262 159,189 681,349 656 120,183 183,098 1,143,819 7,959
Guilford TCC 1,111 675,034 2,889,232 424 159,452 118,344 3,842,062 33,752
Halifax CC 109 66,227 283,462 123 29,636 34,331 413,656 3,311
Haywood CC 52 31,595 135,230 136 25,431 37,959 230,215 1,580
Isothermal CC 139 84,455 361,479 271 53,004 75,640 574,578 4,223
James Sprunt CC 74 44,962 192,442 53 44,802 14,793 296,999 2,248
Johnston CC 258 156,759 670,947 250 69,438 69,778 966,922 7,838
Lenoir CC 411 249,720 1,068,834 340 113,364 94,899 1,526,817 12,486
Martin CC 129 78,379 335,473 195 44,700 54,427 512,979 3,919
Mayland CC 327 198,682 850,386 244 77,764 68,104 1,194,936 9,934
McDowell TCC 116 70,481 301,666 157 54,235 43,821 470,203 3,524
Mitchell CC 209 126,987 543,519 269 108,614 75,082 854,202 6,349
Montgomery CC 80 48,607 208,045 94 35,157 26,237 318,046 2,430
Nash CC 163 99,037 423,893 131 25,949 36,564 585,443 4,952
Pamlico CC 77 46,785 200,244 56 17,792 15,630 280,451 2,339
Piedmont CC 160 97,215 416,091 272 66,301 75,919 655,526 4,861
Pitt CC 419 254,581 1,089,638 279 110,010 77,873 1,532,102 12,729
Randolph CC 302 183,493 785,372 315 75,654 87,921 1,132,440 9,175
Richmond CC 481 292,251 1,250,874 348 118,908 97,132 1,759,165 14,613
Roanoke-Chowan CC 83 50,430 215,847 111 8,596 30,982 305,855 2,522
Robeson CC 637 387,036 1,656,562 196 93,760 54,706 2,192,064 19,352
Rockingham CC 100 60,759 260,057 278 54,753 77,594 453,163 3,038
Rowan-Cabarrus CC 431 261,872 1,120,845 451 157,661 125,880 1,666,258 13,094
Sampson CC 345 209,619 897,196 212 75,264 59,172 1,241,251 10,481
Sandhills CC 386 234,530 1,003,819 215 42,667 60,009 1,341,025 11,727
South Piedmont CC 324 196,860 842,584 373 130,435 104,109 1,273,988 9,843
Southeastern CC 366 222,378 951,808 193 99,980 53,869 1,328,035 11,119
Southwestern CC 102 61,974 265,258 215 96,189 60,009 483,430 3,099
Stanly CC 190 115,442 494,108 162 69,577 45,216 724,343 5,772
Surry CC 245 148,860 637,139 264 88,636 73,686 948,321 7,443
Tri-County CC 46 27,949 119,626 92 17,982 25,678 191,235 1,397
Vance-Granville CC 351 213,265 912,800 581 170,506 162,165 1,458,736 10,663
Wake TCC 1,566 951,488 4,072,490 1050 440,928 293,069 5,757,975 47,574
Wayne CC 314 190,784 816,579 377 211,424 105,226 1,324,013 9,539
Western Piedmont CC 406 246,682 1,055,831 316 82,631 88,200 1,473,344 12,334
Wilkes CC 258 156,759 670,947 178 106,095 49,682 983,483 7,838
Wilson CC 212 128,809 551,321 195 73,972 54,426 808,528 6,440TOTAL 19,603 $11,910,614 $50,978,949 17,098 $6,000,000 $4,772,283 $73,661,846 $595,532
Fed + State = Tier 2: $3208.16
22

NORTH CAROLINA COMMUNITY COLLEGE SYSTEM
FY 2014-15 BASIC SKILLS PERFORMANCE-BASED FUNDING
Basic Skills
College Quality Impact Total PBF$ Quality Impact Total PBF$ Total PBF $
Alamance CC 8,530 11,670 20,200 64,602 23,781 88,383 108,583
Asheville-Buncombe TCC 37,880 14,994 52,874 9,473 31,809 41,282 94,156
Beaufort County CC 10,241 5,212 15,453 3,979 3,181 7,160 22,613
Bladen CC 10,601 3,890 14,491 12,232 7,271 19,503 33,994
Blue Ridge CC 11,691 6,345 18,036 14,121 10,452 24,573 42,609
Brunswick CC 17,255 6,383 23,638 0 9,694 9,694 33,332
Caldwell CC and TI 31,767 12,463 44,230 48,214 21,964 70,178 114,408
Cape Fear CC 45,403 21,792 67,195 37,915 18,328 56,243 123,438
Carteret CC 1,610 2,304 3,914 17,937 6,816 24,753 28,667
Catawba Valley CC 25,679 12,086 37,765 67,135 28,174 95,309 133,074
Central Carolina CC 108,492 38,297 146,789 59,923 29,234 89,157 235,946
Central Piedmont CC 314,247 112,171 426,418 108,116 40,595 148,711 575,129
Cleveland CC 24,639 8,498 33,137 12,436 4,090 16,526 49,663
Coastal Carolina CC 29,043 10,990 40,033 16,121 9,543 25,664 65,697
College of the Albemarle 24,370 9,669 34,039 38,362 17,571 55,933 89,972
Craven CC 10,835 6,081 16,916 13,679 6,059 19,738 36,654
Davidson County CC 77,575 27,948 105,523 44,143 17,874 62,017 167,540
Durham TCC 47,822 21,339 69,161 35,641 16,511 52,152 121,313
Edgecombe CC 32,344 12,426 44,770 38,702 15,753 54,455 99,225
Fayetteville TCC 65,052 36,446 101,498 86,032 28,931 114,963 216,461
Forsyth TCC 112,170 41,129 153,299 58,390 24,387 82,777 236,076
Gaston College 24,510 12,539 37,049 58,898 24,236 83,134 120,183
Guilford TCC 57,835 40,638 98,473 39,773 21,206 60,979 159,452
Halifax CC 12,419 4,948 17,367 0 12,269 12,269 29,636
Haywood CC 8,013 2,984 10,997 10,344 4,090 14,434 25,431
Isothermal CC 1,091 3,739 4,830 35,753 12,421 48,174 53,004
James Sprunt CC 23,412 7,289 30,701 10,314 3,787 14,101 44,802
Johnston CC 27,426 12,879 40,305 19,287 9,846 29,133 69,438
Lenoir CC 47,494 18,280 65,774 30,474 17,116 47,590 113,364
Martin CC 6,252 3,852 10,104 25,962 8,634 34,596 44,700
Mayland CC 22,401 9,971 32,372 33,123 12,269 45,392 77,764
McDowell TCC 7,567 3,890 11,457 30,509 12,269 42,778 54,235
Mitchell CC 22,906 9,933 32,839 57,750 18,025 75,775 108,614
Montgomery CC 9,158 4,003 13,161 15,786 6,210 21,996 35,157
Nash CC 3,320 3,626 6,946 12,187 6,816 19,003 25,949
Pamlico CC 4,630 2,153 6,783 8,131 2,878 11,009 17,792
Piedmont CC 15,141 7,214 22,355 30,616 13,330 43,946 66,301
Pitt CC 43,291 18,204 61,495 32,459 16,056 48,515 110,010
Randolph CC 39,170 16,769 55,939 13,202 6,513 19,715 75,654
Richmond CC 45,420 17,524 62,944 35,515 20,449 55,964 118,908
Roanoke Chowan CC 0 1,246 1,246 4,472 2,878 7,350 8,596
Robeson CC 45,094 19,375 64,469 22,626 6,665 29,291 93,760
Rockingham CC 15,593 6,269 21,862 21,531 11,360 32,891 54,753
Rowan-Cabarrus CC 22,889 14,201 37,090 81,794 38,777 120,571 157,661
Sampson CC 33,736 12,426 46,162 22,134 6,968 29,102 75,264
Sandhills CC 7,471 7,176 14,647 16,811 11,209 28,020 42,667
South Piedmont CC 49,338 19,148 68,486 42,712 19,237 61,949 130,435
Southeastern CC 38,352 15,447 53,799 32,246 13,935 46,181 99,980
Southwestern CC 18,972 7,138 26,110 49,630 20,449 70,079 96,189
Stanly CC 25,106 9,253 34,359 25,069 10,149 35,218 69,577
Surry CC 25,927 11,066 36,993 38,919 12,724 51,643 88,636
Tri-County CC 741 1,095 1,836 11,450 4,696 16,146 17,982
Vance-Granville CC 50,765 20,961 71,726 70,303 28,477 98,780 170,506
Wake TCC 122,025 64,432 186,457 168,132 86,339 254,471 440,928
Wayne CC 113,229 35,011 148,240 44,250 18,934 63,184 211,424
Western Piedmont CC 3,529 7,289 10,818 51,213 20,600 71,813 82,631
Wilkes CC 34,126 13,219 47,345 45,269 13,481 58,750 106,095
Wilson CC 26,245 10,840 37,085 25,225 11,662 36,887 73,972
2,101,840 898,160 3,000,000 2,061,022 938,978 3,000,000 6,000,000
Basic Skills Student Progress GED Diploma Passing Rate
23
4. Institutional & Academic Support
Purpose: A total of $482,653,551 is allocated to support salaries, fringe benefits, and other
costs related to the management and administration of the entire institution, student support,
and academic program support.
Allocation Method: A college’s institutional and academic support allocation is determined
by the sum of the following components:
President’s Allotment: Each college receives an allocation to support the salary and
related fringe benefits for the college president (see Section IIC).
Base Allotment: In addition, each college receives $2,202,021. This amount is
based on an amount for other costs and support for 30 positions:
o Nine administrative positions (4.0 senior administrators, 1.0 general
institution, 1.0 technical/paraprofessional, and 3.0 clerical); and
o Twenty-one instructional support positions (2.0 supervisors of programs, 7.0
student support services, 4.0 general institution, 4.0 technical/
paraprofessional, and 4.0 clerical).
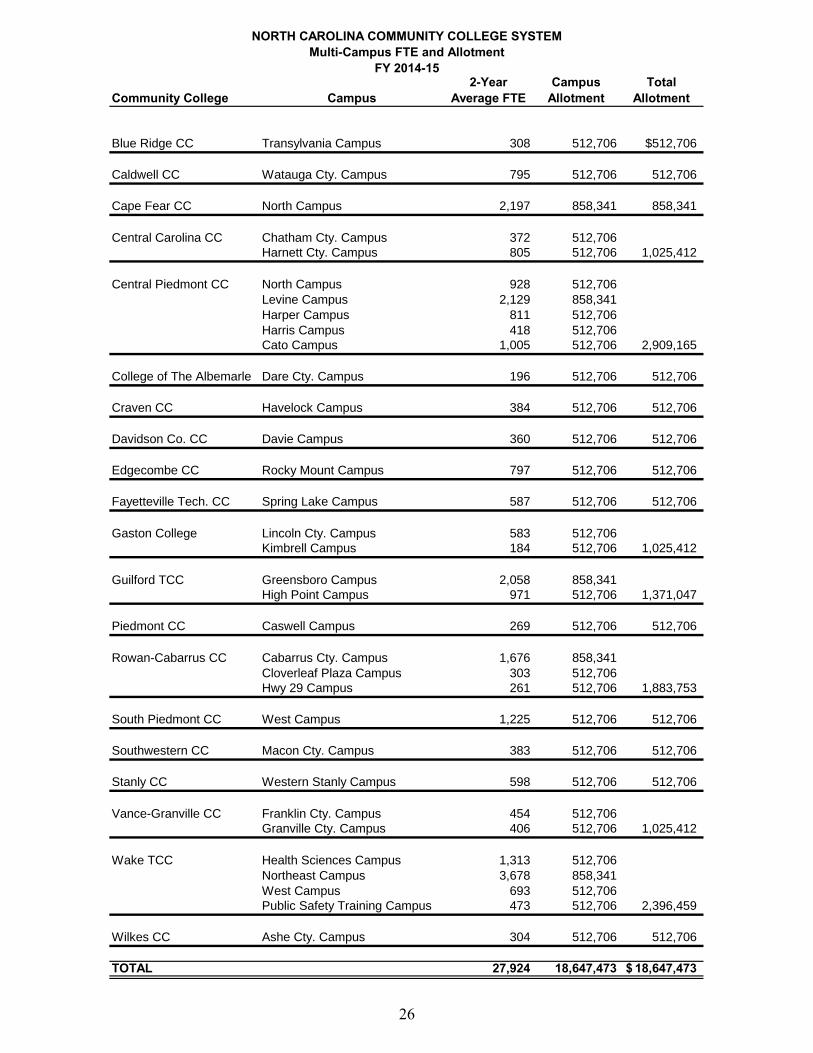
Multi-Campus Base Allotment: MCCs are categorized into two levels based on the
number of FTE (higher of prior year’s FTE or the average of the prior two years’
FTE) served at that location:
o Level 1 MCC: An approved MCC location that serves equal to or less than
1500 FTE. A college receives $512,706 for each Level 1 MCC. This amount
is based on an amount for other costs and support for 7.5 positions.
o Level 2 MCC: An approved MCC location that serves more than 1500 FTE.
A college receives $858,341 for each Level 2 MCC. This amount is based on
an amount for other costs and support for 12 positions.
Enrollment Allotment: Colleges receive an additional $1,699 for each allotted
budget FTE in excess of 750 FTE.
These formula values have been adjusted from FY 2013-14 levels to account for legislative
adjustments, the legislative salary increase, and changes in employer contribution rates for
hospitalization insurance and retirement.11
Fiscal Management: These funds are budgeted and expended through the following codes:
Purpose codes: 1XX, 311, 410, 421, 422, 430, 510
Vocational code: 97
11 Joint Conference Committee Report on Continuation, Expansion, and Capital Budgets dated July 30, 2014: Items 36-
37, page F-8; and Item 32, page K-6.
24

NORTH CAROLINA COMMUNITY COLLEGE SYSTEMINSTITUTIONAL AND ACADEMIC SUPPORT
FY 2014-15
College Presidents' Base Enrollment Multi-Campus TotalAlamance CC $182,345 $2,202,021 $5,793,590 - $8,177,956
Asheville-Buncombe TCC 193,906 2,202,021 10,883,794 - 13,279,721
Beaufort County CC 171,536 2,202,021 1,974,238 - 4,347,795
Bladen CC 171,536 2,202,021 1,190,999 - 3,564,556
Blue Ridge CC 182,345 2,202,021 2,721,798 512,706 5,618,870
Brunswick CC 171,536 2,202,021 1,906,278 - 4,279,835
Caldwell CC and TI 189,159 2,202,021 5,659,369 512,706 8,563,255
Cape Fear CC 193,906 2,202,021 13,512,147 858,341 16,766,415
Carteret CC 171,536 2,202,021 1,906,278 - 4,279,835
Catawba Valley CC 182,345 2,202,021 6,383,143 - 8,767,509
Central Carolina CC 182,345 2,202,021 8,073,648 1,025,412 11,483,426
Central Piedmont CC 212,663 2,202,021 26,441,537 2,909,165 31,765,386
Cleveland CC 187,955 2,202,021 4,329,052 - 6,719,028
Coastal Carolina CC 199,899 2,202,021 6,536,053 - 8,937,973
College of the Albemarle 182,345 2,202,021 2,886,601 512,706 5,783,673
Craven CC 182,345 2,202,021 3,872,021 512,706 6,769,093
Davidson County CC 182,345 2,202,021 5,681,456 512,706 8,578,528
Durham TCC 182,345 2,202,021 6,588,722 - 8,973,088
Edgecombe CC 182,345 2,202,021 3,452,368 512,706 6,349,440
Fayetteville TCC 193,906 2,202,021 19,327,824 512,706 22,236,457
Forsyth TCC 193,906 2,202,021 13,770,395 - 16,166,322
Gaston College 192,672 2,202,021 7,660,791 1,025,412 11,080,896
Guilford TCC 193,906 2,202,021 20,396,495 1,371,047 24,163,469
Halifax CC 171,536 2,202,021 1,544,391 - 3,917,948
Haywood CC 171,536 2,202,021 2,186,613 - 4,560,170
Isothermal CC 182,345 2,202,021 2,652,139 - 5,036,505
James Sprunt CC 171,536 2,202,021 1,298,036 - 3,671,593
Johnston CC 182,345 2,202,021 6,102,808 - 8,487,174
Lenoir CC 182,345 2,202,021 6,009,363 - 8,393,729
Martin CC 171,536 2,202,021 363,586 - 2,737,143
Mayland CC 171,536 2,202,021 1,632,739 - 4,006,296
McDowell TCC 171,536 2,202,021 1,082,263 - 3,455,820
Mitchell CC 182,345 2,202,021 3,758,188 - 6,142,554
Montgomery CC 171,536 2,202,021 440,041 - 2,813,598
Nash CC 182,345 2,202,021 4,171,045 - 6,555,411
Pamlico CC 171,536 2,202,021 0 - 2,373,557
Piedmont CC 171,536 2,202,021 2,291,951 512,706 5,178,214
Pitt CC 193,906 2,202,021 12,599,784 - 14,995,711
Randolph CC 182,345 2,202,021 3,883,914 - 6,268,280
Richmond CC 182,345 2,202,021 3,420,087 - 5,804,453
Roanoke Chowan CC 171,536 2,202,021 299,024 - 2,672,581
Robeson CC 182,345 2,202,021 4,356,236 - 6,740,602
Rockingham CC 171,536 2,202,021 1,994,626 - 4,368,183
Rowan-Cabarrus CC 216,630 2,202,021 9,597,651 1,883,753 13,900,055
Sampson CC 171,536 2,202,021 1,855,308 - 4,228,865
Sandhills CC 199,899 2,202,021 5,436,800 - 7,838,720
South Piedmont CC 182,345 2,202,021 3,224,702 512,706 6,121,774
Southeastern CC 171,536 2,202,021 2,635,149 - 5,008,706
Southwestern CC 182,345 2,202,021 3,046,307 512,706 5,943,379
Stanly CC 182,345 2,202,021 3,491,445 512,706 6,388,517
Surry CC 182,345 2,202,021 4,509,146 - 6,893,512
Tri-County CC 171,536 2,202,021 959,935 - 3,333,492
Vance-Granville CC 182,345 2,202,021 5,120,786 1,025,412 8,530,564
Wake TCC 208,739 2,202,021 29,778,373 2,396,459 34,585,592
Wayne CC 182,345 2,202,021 5,402,820 - 7,787,186
Western Piedmont CC 182,345 2,202,021 3,499,940 - 5,884,306
Wilkes CC 182,345 2,202,021 4,028,329 512,706 6,925,401
Wilson CC 171,536 2,202,021 2,077,877 - 4,451,434
Total $10,588,861 $127,717,218 $325,699,999 $18,647,473 $482,653,551
25
NORTH CAROLINA COMMUNITY COLLEGE SYSTEMMulti-Campus FTE and Allotment
FY 2014-15
Community College Campus2-Year
Average FTECampus
AllotmentTotal
Allotment
Blue Ridge CC Transylvania Campus 308 512,706 $512,706
Caldwell CC Watauga Cty. Campus 795 512,706 512,706
Cape Fear CC North Campus 2,197 858,341 858,341
Central Carolina CC Chatham Cty. Campus 372 512,706
Harnett Cty. Campus 805 512,706 1,025,412
Central Piedmont CC North Campus 928 512,706
Levine Campus 2,129 858,341
Harper Campus 811 512,706
Harris Campus 418 512,706
Cato Campus 1,005 512,706 2,909,165
College of The Albemarle Dare Cty. Campus 196 512,706 512,706
Craven CC Havelock Campus 384 512,706 512,706
Davidson Co. CC Davie Campus 360 512,706 512,706
Edgecombe CC Rocky Mount Campus 797 512,706 512,706
Fayetteville Tech. CC Spring Lake Campus 587 512,706 512,706
Gaston College Lincoln Cty. Campus 583 512,706
Kimbrell Campus 184 512,706 1,025,412
Guilford TCC Greensboro Campus 2,058 858,341
High Point Campus 971 512,706 1,371,047
Piedmont CC Caswell Campus 269 512,706 512,706
Rowan-Cabarrus CC Cabarrus Cty. Campus 1,676 858,341
Cloverleaf Plaza Campus 303 512,706
Hwy 29 Campus 261 512,706 1,883,753
South Piedmont CC West Campus 1,225 512,706 512,706
Southwestern CC Macon Cty. Campus 383 512,706 512,706
Stanly CC Western Stanly Campus 598 512,706 512,706
Vance-Granville CC Franklin Cty. Campus 454 512,706
Granville Cty. Campus 406 512,706 1,025,412
Wake TCC Health Sciences Campus 1,313 512,706
Northeast Campus 3,678 858,341
West Campus 693 512,706
Public Safety Training Campus 473 512,706 2,396,459
Wilkes CC Ashe Cty. Campus 304 512,706 512,706
TOTAL 27,924 18,647,473 18,647,473$
26
5. Performance-Based Funding Allocations
Purpose: Section 10.5 of S.L. 2013-360 amends G.S. 115D-31.3 to direct the State Board to
implement a system of accountability measures and performance standards for community
colleges and to allocate funds based on an evaluation of each institution’s performance.
Furthermore, the General Assembly directed the State Board to allocate $24 million in FY
2014-15 based on college performance: $18 million is allocated in this section and $6 million
is allocated as part of the Basic Skills Block Grant.12
Allocation Method: In FY 2014-15, this component is based on college performance on six
performance measures: 1) success rates of developmental students in subsequent college-
level English courses, 2) success rates of developmental students in subsequent college-level
Math courses, 3) progress of first-year curriculum students, 4) curriculum student retention
and graduation, 5) attainment of licensure and certifications by students, and 6) performance
of students who transfer to a four-year institution. In addition, a portion of the Basic Skills
Block Grant is allocated based on college performance on the remaining two performance
measures: 7) progress of basic skills students and 8) GED attainment.
For each measure, colleges are allocated $3 million through two components:
Quality: Program quality is evaluated by determining a college's rate of student
success on each measure as compared to a systemwide performance baseline and
goal.
o If a college does not meet the baseline, it receives no performance-based
funding through the quality component for that measure;
o If a college exceeds the baseline, but does not meet the goal, it receives a
portion of the performance-based funding for which it would be eligible;
o If a college meets the goal, it receives 100% of the performance-based
funding for which it would be eligible; and,
o If a college exceeds the goal, it would receive more than 100% of the
performance-based funding for which it would be eligible.
Impact: Program impact on student outcomes is evaluated by the number of students
succeeding on each measure.
Additional detail on the quality and impact calculations for each measure can be found in
Appendix D.
Fiscal Management: These funds may be budgeted and expended flexibly for the same
purposes as other instructional and non-instructional formula funds.
Purpose codes: 1XX, 220, 310, 311, 321, 322, 323, 324, 410, 421, 422, 430, 510
Vocational code: 97, 20
12 Joint Conference Committee Report on Continuation, Expansion, and Capital Budgets dated July 21, 2013: Items 39,
page F-8.
27
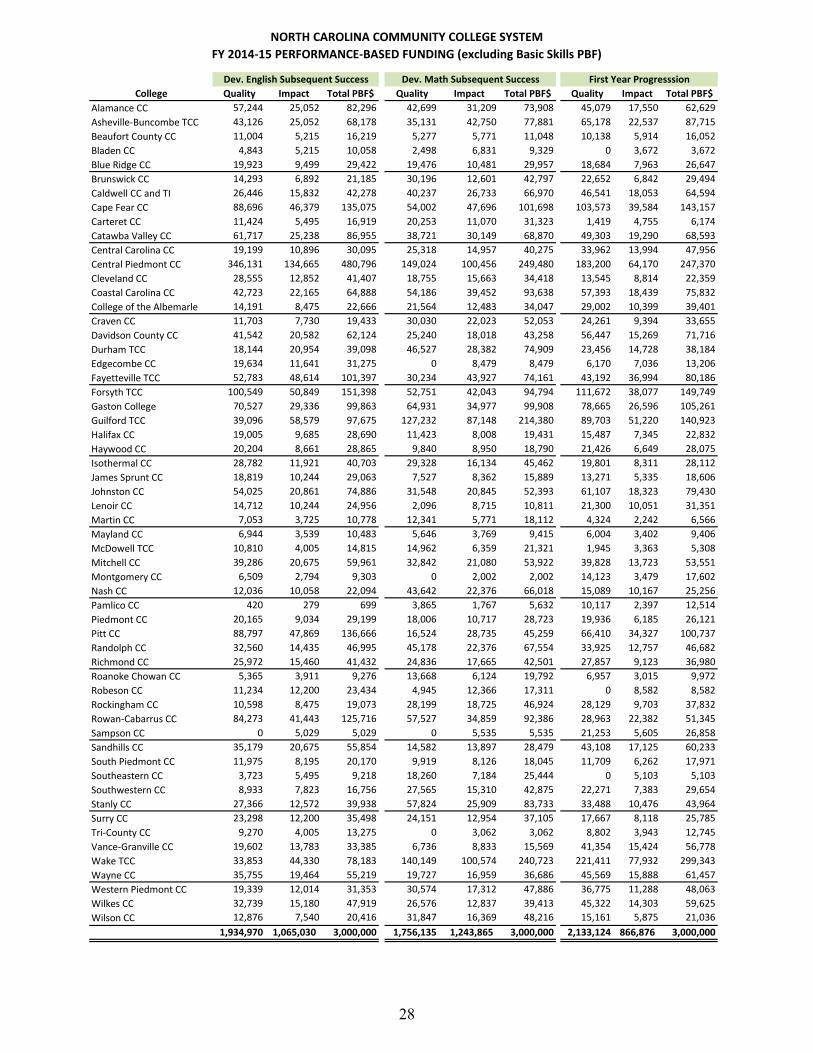
NORTH CAROLINA COMMUNITY COLLEGE SYSTEM
FY 2014-15 PERFORMANCE-BASED FUNDING (excluding Basic Skills PBF)
College Quality Impact Total PBF$ Quality Impact Total PBF$ Quality Impact Total PBF$
Alamance CC 57,244 25,052 82,296 42,699 31,209 73,908 45,079 17,550 62,629
Asheville-Buncombe TCC 43,126 25,052 68,178 35,131 42,750 77,881 65,178 22,537 87,715
Beaufort County CC 11,004 5,215 16,219 5,277 5,771 11,048 10,138 5,914 16,052
Bladen CC 4,843 5,215 10,058 2,498 6,831 9,329 0 3,672 3,672
Blue Ridge CC 19,923 9,499 29,422 19,476 10,481 29,957 18,684 7,963 26,647
Brunswick CC 14,293 6,892 21,185 30,196 12,601 42,797 22,652 6,842 29,494
Caldwell CC and TI 26,446 15,832 42,278 40,237 26,733 66,970 46,541 18,053 64,594
Cape Fear CC 88,696 46,379 135,075 54,002 47,696 101,698 103,573 39,584 143,157
Carteret CC 11,424 5,495 16,919 20,253 11,070 31,323 1,419 4,755 6,174
Catawba Valley CC 61,717 25,238 86,955 38,721 30,149 68,870 49,303 19,290 68,593
Central Carolina CC 19,199 10,896 30,095 25,318 14,957 40,275 33,962 13,994 47,956
Central Piedmont CC 346,131 134,665 480,796 149,024 100,456 249,480 183,200 64,170 247,370
Cleveland CC 28,555 12,852 41,407 18,755 15,663 34,418 13,545 8,814 22,359
Coastal Carolina CC 42,723 22,165 64,888 54,186 39,452 93,638 57,393 18,439 75,832
College of the Albemarle 14,191 8,475 22,666 21,564 12,483 34,047 29,002 10,399 39,401
Craven CC 11,703 7,730 19,433 30,030 22,023 52,053 24,261 9,394 33,655
Davidson County CC 41,542 20,582 62,124 25,240 18,018 43,258 56,447 15,269 71,716
Durham TCC 18,144 20,954 39,098 46,527 28,382 74,909 23,456 14,728 38,184
Edgecombe CC 19,634 11,641 31,275 0 8,479 8,479 6,170 7,036 13,206
Fayetteville TCC 52,783 48,614 101,397 30,234 43,927 74,161 43,192 36,994 80,186
Forsyth TCC 100,549 50,849 151,398 52,751 42,043 94,794 111,672 38,077 149,749
Gaston College 70,527 29,336 99,863 64,931 34,977 99,908 78,665 26,596 105,261
Guilford TCC 39,096 58,579 97,675 127,232 87,148 214,380 89,703 51,220 140,923
Halifax CC 19,005 9,685 28,690 11,423 8,008 19,431 15,487 7,345 22,832
Haywood CC 20,204 8,661 28,865 9,840 8,950 18,790 21,426 6,649 28,075
Isothermal CC 28,782 11,921 40,703 29,328 16,134 45,462 19,801 8,311 28,112
James Sprunt CC 18,819 10,244 29,063 7,527 8,362 15,889 13,271 5,335 18,606
Johnston CC 54,025 20,861 74,886 31,548 20,845 52,393 61,107 18,323 79,430
Lenoir CC 14,712 10,244 24,956 2,096 8,715 10,811 21,300 10,051 31,351
Martin CC 7,053 3,725 10,778 12,341 5,771 18,112 4,324 2,242 6,566
Mayland CC 6,944 3,539 10,483 5,646 3,769 9,415 6,004 3,402 9,406
McDowell TCC 10,810 4,005 14,815 14,962 6,359 21,321 1,945 3,363 5,308
Mitchell CC 39,286 20,675 59,961 32,842 21,080 53,922 39,828 13,723 53,551
Montgomery CC 6,509 2,794 9,303 0 2,002 2,002 14,123 3,479 17,602
Nash CC 12,036 10,058 22,094 43,642 22,376 66,018 15,089 10,167 25,256
Pamlico CC 420 279 699 3,865 1,767 5,632 10,117 2,397 12,514
Piedmont CC 20,165 9,034 29,199 18,006 10,717 28,723 19,936 6,185 26,121
Pitt CC 88,797 47,869 136,666 16,524 28,735 45,259 66,410 34,327 100,737
Randolph CC 32,560 14,435 46,995 45,178 22,376 67,554 33,925 12,757 46,682
Richmond CC 25,972 15,460 41,432 24,836 17,665 42,501 27,857 9,123 36,980
Roanoke Chowan CC 5,365 3,911 9,276 13,668 6,124 19,792 6,957 3,015 9,972
Robeson CC 11,234 12,200 23,434 4,945 12,366 17,311 0 8,582 8,582
Rockingham CC 10,598 8,475 19,073 28,199 18,725 46,924 28,129 9,703 37,832
Rowan-Cabarrus CC 84,273 41,443 125,716 57,527 34,859 92,386 28,963 22,382 51,345
Sampson CC 0 5,029 5,029 0 5,535 5,535 21,253 5,605 26,858
Sandhills CC 35,179 20,675 55,854 14,582 13,897 28,479 43,108 17,125 60,233
South Piedmont CC 11,975 8,195 20,170 9,919 8,126 18,045 11,709 6,262 17,971
Southeastern CC 3,723 5,495 9,218 18,260 7,184 25,444 0 5,103 5,103
Southwestern CC 8,933 7,823 16,756 27,565 15,310 42,875 22,271 7,383 29,654
Stanly CC 27,366 12,572 39,938 57,824 25,909 83,733 33,488 10,476 43,964
Surry CC 23,298 12,200 35,498 24,151 12,954 37,105 17,667 8,118 25,785
Tri-County CC 9,270 4,005 13,275 0 3,062 3,062 8,802 3,943 12,745
Vance-Granville CC 19,602 13,783 33,385 6,736 8,833 15,569 41,354 15,424 56,778
Wake TCC 33,853 44,330 78,183 140,149 100,574 240,723 221,411 77,932 299,343
Wayne CC 35,755 19,464 55,219 19,727 16,959 36,686 45,569 15,888 61,457
Western Piedmont CC 19,339 12,014 31,353 30,574 17,312 47,886 36,775 11,288 48,063
Wilkes CC 32,739 15,180 47,919 26,576 12,837 39,413 45,322 14,303 59,625
Wilson CC 12,876 7,540 20,416 31,847 16,369 48,216 15,161 5,875 21,036
1,934,970 1,065,030 3,000,000 1,756,135 1,243,865 3,000,000 2,133,124 866,876 3,000,000
Dev. English Subsequent Success Dev. Math Subsequent Success First Year Progresssion
28

NORTH CAROLINA COMMUNITY COLLEGE SYSTEM
FY 2014-15 PERFORMANCE-BASED FUNDING (excluding Basic Skills PBF)
College
Alamance CC
Asheville-Buncombe TCC
Beaufort County CC
Bladen CC
Blue Ridge CC
Brunswick CC
Caldwell CC and TI
Cape Fear CC
Carteret CC
Catawba Valley CC
Central Carolina CC
Central Piedmont CC
Cleveland CC
Coastal Carolina CC
College of the Albemarle
Craven CC
Davidson County CC
Durham TCC
Edgecombe CC
Fayetteville TCC
Forsyth TCC
Gaston College
Guilford TCC
Halifax CC
Haywood CC
Isothermal CC
James Sprunt CC
Johnston CC
Lenoir CC
Martin CC
Mayland CC
McDowell TCC
Mitchell CC
Montgomery CC
Nash CC
Pamlico CC
Piedmont CC
Pitt CC
Randolph CC
Richmond CC
Roanoke Chowan CC
Robeson CC
Rockingham CC
Rowan-Cabarrus CC
Sampson CC
Sandhills CC
South Piedmont CC
Southeastern CC
Southwestern CC
Stanly CC
Surry CC
Tri-County CC
Vance-Granville CC
Wake TCC
Wayne CC
Western Piedmont CC
Wilkes CC
Wilson CC
Total*
Quality Impact Total PBF$ Quality Impact Total PBF$ Quality Impact Total PBF$ PBF $
69,643 11,579 81,222 26,115 14,908 41,023 33,450 12,261 45,711 386,789
61,306 10,795 72,101 91,484 38,154 129,638 89,357 26,468 115,825 551,338
22,238 3,474 25,712 21,410 9,808 31,218 13,595 4,184 17,779 118,028
8,521 2,248 10,769 0 8,043 8,043 1,389 4,184 5,573 47,444
32,085 5,823 37,908 24,711 10,691 35,402 18,134 5,741 23,875 183,211
14,896 3,269 18,165 10,560 8,827 19,387 17,566 6,812 24,378 155,406
63,447 9,944 73,391 13,810 11,378 25,188 50,058 20,532 70,590 343,011
130,159 20,365 150,524 99,135 34,917 134,052 129,263 47,486 176,749 841,255
13,097 3,303 16,400 23,358 11,770 35,128 12,167 4,087 16,254 122,198
48,291 11,885 60,176 21,663 15,399 37,062 65,571 21,797 87,368 409,024
50,288 8,412 58,700 57,515 26,188 83,703 34,194 10,509 44,703 305,432
156,160 34,770 190,930 88,386 30,602 118,988 196,124 81,155 277,279 1,564,843
14,786 4,189 18,975 39,204 16,968 56,172 33,392 10,801 44,193 217,524
87,208 12,294 99,502 66,798 23,147 89,945 73,512 21,992 95,504 519,309
40,660 6,505 47,165 41,822 15,987 57,809 21,968 10,023 31,991 233,079
42,034 7,458 49,492 25,849 18,439 44,288 34,233 11,482 45,715 244,636
47,093 8,105 55,198 60,348 23,344 83,692 36,952 13,331 50,283 366,271
29,930 7,083 37,013 61,398 25,305 86,703 55,868 18,294 74,162 350,069
20,836 3,337 24,173 9,257 8,239 17,496 11,991 4,768 16,759 111,388
55,194 15,699 70,893 114,702 45,804 160,506 72,632 25,397 98,029 585,172
110,979 18,866 129,845 95,606 31,092 126,698 92,428 32,014 124,442 776,926
56,742 13,894 70,636 83,618 29,327 112,945 41,372 17,029 58,401 547,014
152,180 27,823 180,003 96,239 41,587 137,826 118,680 47,389 166,069 936,876
22,387 3,678 26,065 10,294 5,395 15,689 9,272 2,919 12,191 124,898
34,698 4,836 39,534 11,255 8,533 19,788 11,776 4,476 16,252 151,304
17,909 4,325 22,234 17,528 10,691 28,219 33,744 9,439 43,183 207,913
21,858 3,167 25,025 12,697 6,277 18,974 7,453 3,211 10,664 118,221
59,951 9,297 69,248 35,384 20,990 56,374 38,830 14,499 53,329 385,660
36,222 5,994 42,216 40,709 38,742 79,451 29,323 10,801 40,124 228,909
12,827 2,077 14,904 0 5,493 5,493 0 292 292 56,145
33,618 4,427 38,045 7,626 8,043 15,669 9,663 2,530 12,193 95,211
7,268 2,316 9,584 27,733 10,299 38,032 3,971 2,627 6,598 95,658
36,800 7,356 44,156 31,755 13,535 45,290 39,221 14,110 53,331 310,211
13,830 2,452 16,282 8,144 3,139 11,283 3,697 876 4,573 61,045
37,216 6,641 43,857 4,540 12,260 16,800 29,479 9,633 39,112 213,137
7,549 988 8,537 2,643 1,667 4,310 4,519 1,070 5,589 37,281
26,354 4,257 30,611 1,201 3,923 5,124 2,367 3,211 5,578 125,356
80,755 13,520 94,275 60,298 25,011 85,309 79,967 30,749 110,716 572,962
26,008 5,210 31,218 19,931 11,574 31,505 30,262 8,855 39,117 263,071
22,989 4,359 27,348 0 5,885 5,885 18,544 5,838 24,382 178,528
11,958 2,316 14,274 1,492 3,041 4,533 5,144 1,460 6,604 64,451
19,614 4,734 24,348 34,208 12,751 46,959 12,813 4,963 17,776 138,410
32,936 6,062 38,998 0 8,337 8,337 10,172 5,060 15,232 166,396
54,688 14,507 69,195 65,268 33,544 98,812 51,643 19,462 71,105 508,559
16,870 2,690 19,560 15,834 7,356 23,190 5,497 5,157 10,654 90,826
42,237 8,378 50,615 44,212 19,028 63,240 26,115 11,969 38,084 296,505
24,374 4,972 29,346 26,292 12,555 38,847 21,204 6,228 27,432 151,811
26,491 4,802 31,293 6,513 9,906 16,419 15,278 5,547 20,825 108,302
23,932 4,223 28,155 32,096 10,985 43,081 30,281 9,342 39,623 200,144
21,322 5,074 26,396 37,420 14,810 52,230 28,658 9,439 38,097 284,358
57,841 9,263 67,104 51,850 17,949 69,799 26,819 9,244 36,063 271,354
3,616 1,669 5,285 9,510 6,866 16,376 11,326 3,406 14,732 65,475
32,059 8,786 40,845 46,868 18,538 65,406 11,620 5,644 17,264 229,247
163,461 31,637 195,098 115,260 41,391 156,651 237,261 77,165 314,426 1,284,424
81,996 11,579 93,575 26,406 14,026 40,432 41,020 13,331 54,351 341,720
43,393 6,607 50,000 32,020 10,004 42,024 29,577 12,066 41,643 260,969
28,792 6,096 34,888 32,893 14,320 47,213 21,752 9,731 31,483 260,541
15,758 3,235 18,993 1,910 8,434 10,344 12,538 3,212 15,750 134,755
2,527,350 472,650 3,000,000 2,044,778 955,222 3,000,000 2,204,702 795,298 3,000,000 18,000,000
*Excludes Basic Skills PBF, which is embedded in Basic Skills Block Grant
College Transfer PerformanceCurriculum Completion Licensure Passing Rates
29

NORTH CAROLINA COMMUNITY COLLEGE SYSTEMFORMULA BUDGET BY COLLEGE
FY 2014-15
Community Colleges CurriculumContinuing Education Basic Skills
Institutional Support
Performance Based
Allocation* TotalAlamance CC $12,281,571 $1,086,034 $1,354,377 $8,177,956 $386,789 $23,286,727
Asheville-Buncombe TCC 21,747,148 2,015,150 1,557,291 13,279,721 551,338 39,150,648
Beaufort County CC 5,844,074 687,682 543,892 4,347,795 118,028 11,541,471
Bladen CC 4,388,354 757,155 297,772 3,564,556 47,444 9,055,281
Blue Ridge CC 6,442,953 1,469,187 569,335 5,618,870 183,211 14,283,556
Brunswick CC 4,866,746 1,048,914 892,866 4,279,835 155,406 11,243,767
Caldwell CC & TI 11,611,679 1,783,385 1,186,251 8,563,255 343,011 23,487,581
Cape Fear CC 25,995,757 2,454,115 1,913,923 16,766,415 841,255 47,971,465
Carteret CC 5,236,314 1,077,734 459,421 4,279,835 122,198 11,175,502
Catawba Valley CC 12,947,148 1,811,433 1,052,053 8,767,509 409,024 24,987,167
Central Carolina CC 13,611,291 2,695,925 3,021,680 11,483,426 305,432 31,117,754
Central Piedmont CC 49,328,709 1,796,835 5,454,603 31,765,386 1,564,843 89,910,376
Cleveland CC 9,807,310 1,519,675 550,563 6,719,028 217,524 18,814,100
Coastal Carolina CC 12,940,374 2,215,564 815,324 8,937,973 519,309 25,428,544
College of The Albemarle 7,241,840 822,102 795,110 5,783,673 233,079 14,875,804
Craven CC 9,040,165 1,197,552 608,426 6,769,093 244,636 17,859,872
Davidson County CC 11,582,512 1,289,510 1,763,040 8,578,528 366,271 23,579,861
Durham TCC 13,332,075 1,672,771 1,414,393 8,973,088 350,069 25,742,396
Edgecombe CC 8,366,106 933,535 812,734 6,349,440 111,388 16,573,203
Fayetteville TCC 31,590,008 6,079,141 3,837,423 22,236,457 585,172 64,328,201
Forsyth TCC 25,880,581 2,747,514 2,515,761 16,166,322 776,926 48,087,104
Gaston College 16,408,695 1,085,432 1,143,819 11,080,896 547,014 30,265,856
Guilford TCC 37,547,789 2,511,333 3,842,062 24,163,469 936,876 69,001,529
Halifax CC 4,815,554 902,186 413,656 3,917,948 124,898 10,174,242
Haywood CC 6,370,550 848,069 230,215 4,560,170 151,304 12,160,308
Isothermal CC 7,101,078 787,190 574,578 5,036,505 207,913 13,707,264
James Sprunt CC 4,547,619 748,894 296,999 3,671,593 118,221 9,383,326
Johnston CC 12,766,320 1,779,588 966,922 8,487,174 385,660 24,385,664
Lenoir CC 8,302,587 4,867,263 1,526,817 8,393,729 228,909 23,319,305
Martin CC 2,610,190 706,156 512,979 2,737,143 56,145 6,622,613
Mayland CC 3,779,211 1,348,020 1,194,936 4,006,296 95,211 10,423,674
McDowell TCC 4,096,358 732,275 470,203 3,455,820 95,658 8,850,314
Mitchell CC 8,580,132 1,060,769 854,202 6,142,554 310,211 16,947,868
Montgomery CC 2,854,224 730,879 318,046 2,813,598 61,045 6,777,792
Nash CC 9,541,297 1,342,824 585,443 6,555,411 213,137 18,238,112
Pamlico CC 2,056,074 558,784 280,451 2,373,557 37,281 5,306,147
Piedmont CC 5,098,817 1,910,864 655,526 5,178,214 125,356 12,968,777
Pitt CC 25,340,054 1,678,913 1,532,102 14,995,711 572,962 44,119,742
Randolph CC 8,758,993 962,053 1,132,440 6,268,280 263,071 17,384,837
Richmond CC 7,050,695 1,139,366 1,759,165 5,804,453 178,528 15,932,207
Roanoke-Chowan CC 2,731,319 584,948 305,855 2,672,581 64,451 6,359,154
Robeson CC 7,446,225 1,966,168 2,192,064 6,740,602 138,410 18,483,469
Rockingham CC 5,824,423 827,787 453,163 4,368,183 166,396 11,639,952
Rowan-Cabarrus CC 18,311,207 2,269,187 1,666,258 13,900,055 508,559 36,655,266
Sampson CC 4,445,660 1,071,488 1,241,251 4,228,865 90,826 11,078,090
Sandhills CC 11,463,947 1,099,426 1,341,025 7,838,720 296,505 22,039,623
South Piedmont CC 6,260,522 1,960,034 1,273,988 6,121,774 151,811 15,768,129
Southeastern CC 4,919,876 1,898,700 1,328,035 5,008,706 108,302 13,263,619
Southwestern CC 7,332,594 1,432,630 483,430 5,943,379 200,144 15,392,177
Stanly CC 7,901,654 1,416,585 724,343 6,388,517 284,358 16,715,457
Surry CC 9,686,461 1,534,189 948,321 6,893,512 271,354 19,333,837
Tri-County CC 4,343,869 508,900 191,235 3,333,492 65,475 8,442,971
Vance-Granville CC 10,248,496 1,758,496 1,458,736 8,530,564 229,247 22,225,539
Wake TCC 51,926,175 4,826,299 5,757,975 34,585,592 1,284,424 98,380,465
Wayne CC 11,460,126 1,323,781 1,324,013 7,787,186 341,720 22,236,826
Western Piedmont CC 7,455,033 1,107,022 1,473,344 5,884,306 260,969 16,180,674
Wilkes CC 8,830,712 1,468,363 983,483 6,925,401 260,541 18,468,500
Wilson CC 5,358,287 997,807 808,528 4,451,434 134,755 11,750,811TOTAL $667,655,538 $90,913,581 $73,661,846 $482,653,551 $18,000,000 $1,332,884,516*Excludes Basic Skills PBF, which is embedded in Basic Skills Block Grant
30
31
B. Categorical Allocations
1. Career and Technical Education (Federal) Purpose: Career and Technical Education (CTE) funds are provided through the Carl D. Perkins Career and Technical Education Improvement Act of 2006 with the purpose of making the United States more competitive in the world economy by developing more fully the academic, career, and technical skills of students who enroll in career and technical education programs. This act places emphasis on:
Promoting services and activities that integrate rigorous and challenging academic and career technical instruction, and that link secondary education and postsecondary education for participating career and technical education students. (Career Pathways)
Developing and integrating strong academic and career and technical competencies, providing professional development, expanding the use of technology in the classroom.
Creating greater accountability by requiring the measurement of student achievement against established core indicators of performance at both state and local levels.
Each college must develop a local plan that includes:
Acceptance of the allocation; Acknowledgement of the nine CTE required activities; Description of the proposed implementation of the nine CTE required activities; Acceptance of updated accountability/performance measures; Implementation of a least one CTE Program of Study; and The proposed budget.
Funds must be used in accordance with the budget approved by System Office CTE program staff. No more than five percent of a college’s allocation may be used for college administration. Allocation Method: The Carl D. Perkins Act requires that at least 85% of available funding be allocated to local community colleges. A total of $11,086,977 is expected to be available from the federal government for allocation through the Career and Technical Education allotment. These funds are allocated based on each college's pro-rata share of Pell Grant recipients pursuing a credential in a vocational/technical curriculum program in relation to the total number of Pell Grant recipients pursuing such credentials systemwide.13 Fiscal Management: These funds will be budgeted and expended through the following codes:
13 In accordance with Section 132.(c)(1) of the Carl D. Perkins Vocational & Technical Education Act of 2006, as amended, no institution or consortium shall receive an allocation of federal vocational education funds in an amount that is less than $50,000. To that end three community colleges with allocations below $50,000 will join a consortium. Craven CC will lead a consortium with Pamlico CC and Brunswick CC. Stanly CC will lead the consortia with Montgomery CC. All 58 colleges will benefit from Perkins funds.
31

Purpose codes: current - as needed, consistent with the activities in the approved
budget and the Accounting Procedures Manual; capitalized equipment– 940, non-
capitalized equipment should be coded to a current purpose code.
Vocational code: current - 10-15 and 17-19, as prescribed by the Accounting
Procedures Manual; 16 – equipment (capitalized equipment can only be used with
purpose code 940, non-capitalized equipment can be used with current purposes, such
as 220 or 510).
32
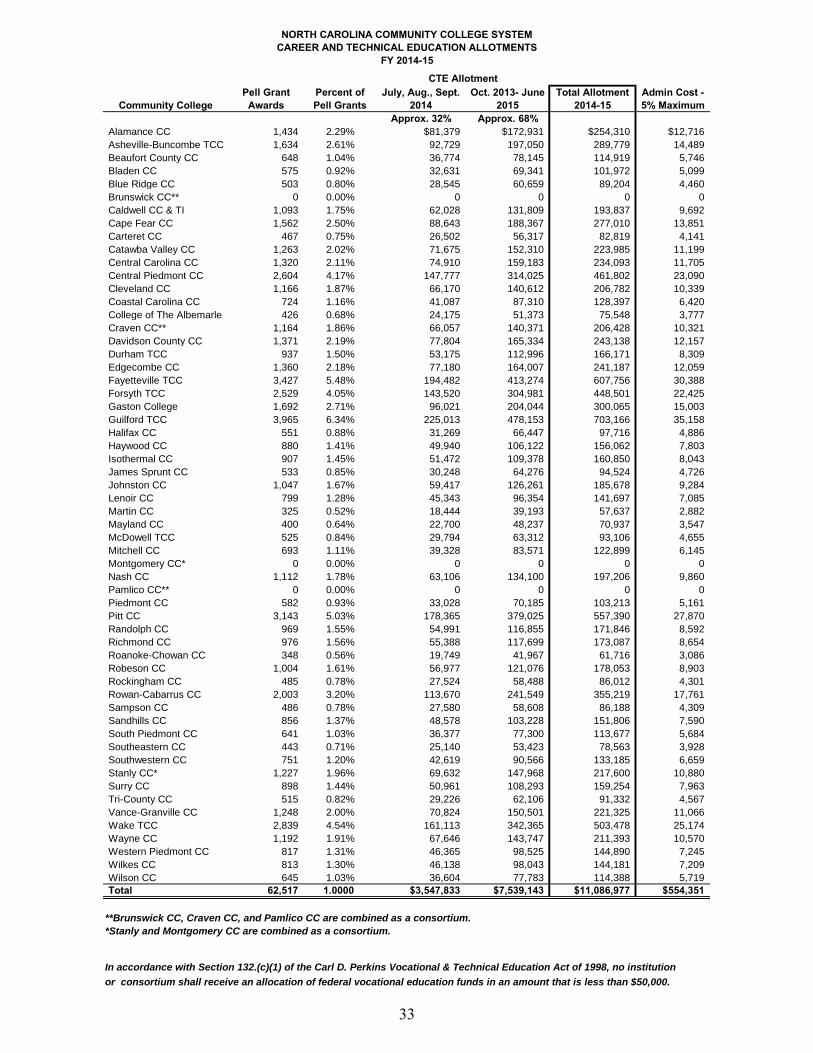
NORTH CAROLINA COMMUNITY COLLEGE SYSTEMCAREER AND TECHNICAL EDUCATION ALLOTMENTS
FY 2014-15
Community CollegePell Grant
AwardsPercent of Pell Grants
July, Aug., Sept. 2014
Oct. 2013- June 2015
Total Allotment 2014-15
Admin Cost - 5% Maximum
Approx. 32% Approx. 68%Alamance CC 1,434 2.29% $81,379 $172,931 $254,310 $12,716
Asheville-Buncombe TCC 1,634 2.61% 92,729 197,050 289,779 14,489
Beaufort County CC 648 1.04% 36,774 78,145 114,919 5,746
Bladen CC 575 0.92% 32,631 69,341 101,972 5,099
Blue Ridge CC 503 0.80% 28,545 60,659 89,204 4,460
Brunswick CC** 0 0.00% 0 0 0 0
Caldwell CC & TI 1,093 1.75% 62,028 131,809 193,837 9,692
Cape Fear CC 1,562 2.50% 88,643 188,367 277,010 13,851
Carteret CC 467 0.75% 26,502 56,317 82,819 4,141
Catawba Valley CC 1,263 2.02% 71,675 152,310 223,985 11,199
Central Carolina CC 1,320 2.11% 74,910 159,183 234,093 11,705
Central Piedmont CC 2,604 4.17% 147,777 314,025 461,802 23,090
Cleveland CC 1,166 1.87% 66,170 140,612 206,782 10,339
Coastal Carolina CC 724 1.16% 41,087 87,310 128,397 6,420
College of The Albemarle 426 0.68% 24,175 51,373 75,548 3,777
Craven CC** 1,164 1.86% 66,057 140,371 206,428 10,321
Davidson County CC 1,371 2.19% 77,804 165,334 243,138 12,157
Durham TCC 937 1.50% 53,175 112,996 166,171 8,309
Edgecombe CC 1,360 2.18% 77,180 164,007 241,187 12,059
Fayetteville TCC 3,427 5.48% 194,482 413,274 607,756 30,388
Forsyth TCC 2,529 4.05% 143,520 304,981 448,501 22,425
Gaston College 1,692 2.71% 96,021 204,044 300,065 15,003
Guilford TCC 3,965 6.34% 225,013 478,153 703,166 35,158
Halifax CC 551 0.88% 31,269 66,447 97,716 4,886
Haywood CC 880 1.41% 49,940 106,122 156,062 7,803
Isothermal CC 907 1.45% 51,472 109,378 160,850 8,043
James Sprunt CC 533 0.85% 30,248 64,276 94,524 4,726
Johnston CC 1,047 1.67% 59,417 126,261 185,678 9,284
Lenoir CC 799 1.28% 45,343 96,354 141,697 7,085
Martin CC 325 0.52% 18,444 39,193 57,637 2,882
Mayland CC 400 0.64% 22,700 48,237 70,937 3,547
McDowell TCC 525 0.84% 29,794 63,312 93,106 4,655
Mitchell CC 693 1.11% 39,328 83,571 122,899 6,145
Montgomery CC* 0 0.00% 0 0 0 0
Nash CC 1,112 1.78% 63,106 134,100 197,206 9,860
Pamlico CC** 0 0.00% 0 0 0 0
Piedmont CC 582 0.93% 33,028 70,185 103,213 5,161
Pitt CC 3,143 5.03% 178,365 379,025 557,390 27,870
Randolph CC 969 1.55% 54,991 116,855 171,846 8,592
Richmond CC 976 1.56% 55,388 117,699 173,087 8,654
Roanoke-Chowan CC 348 0.56% 19,749 41,967 61,716 3,086
Robeson CC 1,004 1.61% 56,977 121,076 178,053 8,903
Rockingham CC 485 0.78% 27,524 58,488 86,012 4,301
Rowan-Cabarrus CC 2,003 3.20% 113,670 241,549 355,219 17,761
Sampson CC 486 0.78% 27,580 58,608 86,188 4,309
Sandhills CC 856 1.37% 48,578 103,228 151,806 7,590
South Piedmont CC 641 1.03% 36,377 77,300 113,677 5,684
Southeastern CC 443 0.71% 25,140 53,423 78,563 3,928
Southwestern CC 751 1.20% 42,619 90,566 133,185 6,659
Stanly CC* 1,227 1.96% 69,632 147,968 217,600 10,880
Surry CC 898 1.44% 50,961 108,293 159,254 7,963
Tri-County CC 515 0.82% 29,226 62,106 91,332 4,567
Vance-Granville CC 1,248 2.00% 70,824 150,501 221,325 11,066
Wake TCC 2,839 4.54% 161,113 342,365 503,478 25,174
Wayne CC 1,192 1.91% 67,646 143,747 211,393 10,570
Western Piedmont CC 817 1.31% 46,365 98,525 144,890 7,245
Wilkes CC 813 1.30% 46,138 98,043 144,181 7,209
Wilson CC 645 1.03% 36,604 77,783 114,388 5,719
Total 62,517 1.0000 $3,547,833 $7,539,143 $11,086,977 $554,351
**Brunswick CC, Craven CC, and Pamlico CC are combined as a consortium.
*Stanly and Montgomery CC are combined as a consortium.
In accordance with Section 132.(c)(1) of the Carl D. Perkins Vocational & Technical Education Act of 1998, no institution
or consortium shall receive an allocation of federal vocational education funds in an amount that is less than $50,000.
CTE Allotment
33
2. Child Care
Purpose: The intent of the Child Care Grant is to assist student-parents with the financial
responsibilities for child care expenses so they may stay enrolled and complete their
educational goals. No faculty, staff, or administrator employed by the college may receive or
utilize funds from this grant with the exception of qualified “work study” students. Child
care coordinators and financial aid officers at each college shall jointly determine the need of
student-parents for child care in coordination with local social services agencies that provide
child care funding for qualified students.
These funds must be disbursed directly to the provider or the student-parent only upon
receipt of an invoice from a child care provider accompanied by a student’s class attendance
report. Under no circumstances may colleges pay in advance for services which have not
been received. These funds may not be used to support the operating costs of a college
childcare facility, except indirectly in the form of payments disbursed to the center as a
provider of childcare services for a student-parent receiving assistance through this program.
Likewise, other State funds may not be used to support college childcare facilities or support
childcare staff positions. Colleges may not expend any of these allocations for administrative
overhead, including salaries.
Allocation Method: A total of $1,838,215 is allocated in FY 2014-15 through the Child
Care Grant allotment. Each college will be authorized funds on the following formula:
$20,000 (base) + $3.64 per curriculum budget FTE.
Fiscal Management: These funds will be budgeted and expended through the following
codes:
Purpose code: 530
Vocational code: 80
34
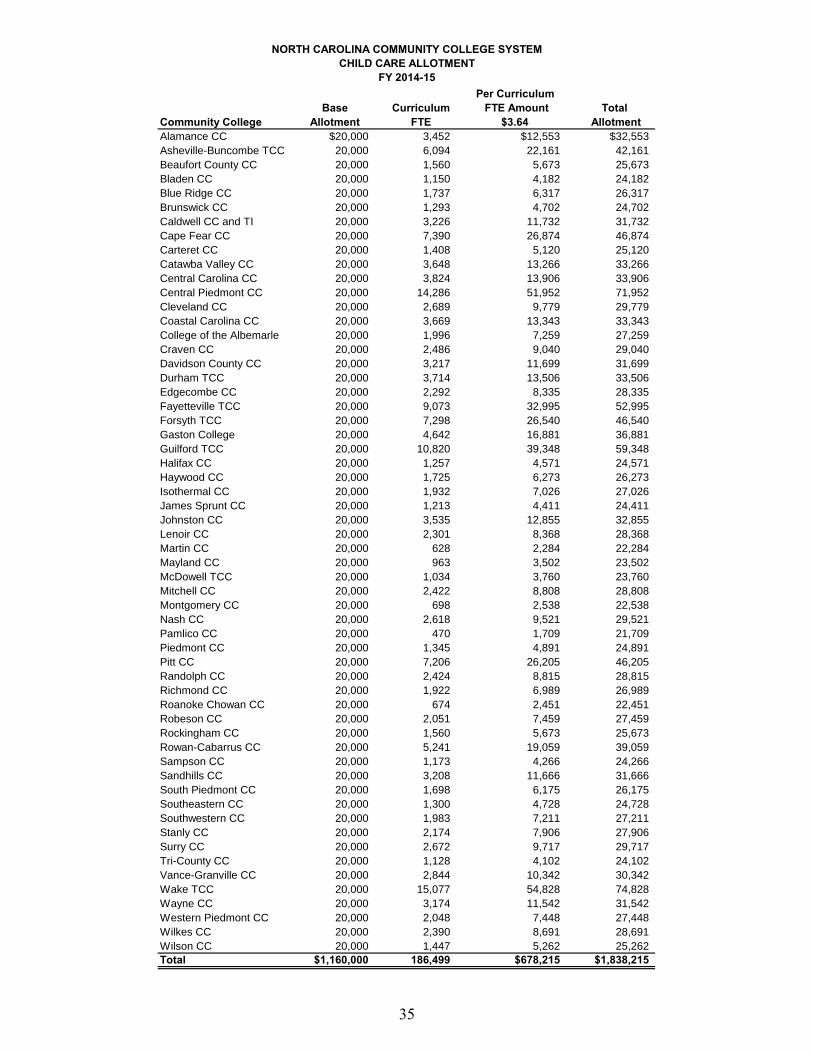
NORTH CAROLINA COMMUNITY COLLEGE SYSTEMCHILD CARE ALLOTMENT
FY 2014-15Per Curriculum
Base Curriculum FTE Amount Total Community College Allotment FTE $3.64 AllotmentAlamance CC $20,000 3,452 $12,553 $32,553
Asheville-Buncombe TCC 20,000 6,094 22,161 42,161
Beaufort County CC 20,000 1,560 5,673 25,673
Bladen CC 20,000 1,150 4,182 24,182
Blue Ridge CC 20,000 1,737 6,317 26,317
Brunswick CC 20,000 1,293 4,702 24,702
Caldwell CC and TI 20,000 3,226 11,732 31,732
Cape Fear CC 20,000 7,390 26,874 46,874
Carteret CC 20,000 1,408 5,120 25,120
Catawba Valley CC 20,000 3,648 13,266 33,266
Central Carolina CC 20,000 3,824 13,906 33,906
Central Piedmont CC 20,000 14,286 51,952 71,952
Cleveland CC 20,000 2,689 9,779 29,779
Coastal Carolina CC 20,000 3,669 13,343 33,343
College of the Albemarle 20,000 1,996 7,259 27,259
Craven CC 20,000 2,486 9,040 29,040
Davidson County CC 20,000 3,217 11,699 31,699
Durham TCC 20,000 3,714 13,506 33,506
Edgecombe CC 20,000 2,292 8,335 28,335
Fayetteville TCC 20,000 9,073 32,995 52,995
Forsyth TCC 20,000 7,298 26,540 46,540
Gaston College 20,000 4,642 16,881 36,881
Guilford TCC 20,000 10,820 39,348 59,348
Halifax CC 20,000 1,257 4,571 24,571
Haywood CC 20,000 1,725 6,273 26,273
Isothermal CC 20,000 1,932 7,026 27,026
James Sprunt CC 20,000 1,213 4,411 24,411
Johnston CC 20,000 3,535 12,855 32,855
Lenoir CC 20,000 2,301 8,368 28,368
Martin CC 20,000 628 2,284 22,284
Mayland CC 20,000 963 3,502 23,502
McDowell TCC 20,000 1,034 3,760 23,760
Mitchell CC 20,000 2,422 8,808 28,808
Montgomery CC 20,000 698 2,538 22,538
Nash CC 20,000 2,618 9,521 29,521
Pamlico CC 20,000 470 1,709 21,709
Piedmont CC 20,000 1,345 4,891 24,891
Pitt CC 20,000 7,206 26,205 46,205
Randolph CC 20,000 2,424 8,815 28,815
Richmond CC 20,000 1,922 6,989 26,989
Roanoke Chowan CC 20,000 674 2,451 22,451
Robeson CC 20,000 2,051 7,459 27,459
Rockingham CC 20,000 1,560 5,673 25,673
Rowan-Cabarrus CC 20,000 5,241 19,059 39,059
Sampson CC 20,000 1,173 4,266 24,266
Sandhills CC 20,000 3,208 11,666 31,666
South Piedmont CC 20,000 1,698 6,175 26,175
Southeastern CC 20,000 1,300 4,728 24,728
Southwestern CC 20,000 1,983 7,211 27,211
Stanly CC 20,000 2,174 7,906 27,906
Surry CC 20,000 2,672 9,717 29,717
Tri-County CC 20,000 1,128 4,102 24,102
Vance-Granville CC 20,000 2,844 10,342 30,342
Wake TCC 20,000 15,077 54,828 74,828
Wayne CC 20,000 3,174 11,542 31,542
Western Piedmont CC 20,000 2,048 7,448 27,448
Wilkes CC 20,000 2,390 8,691 28,691
Wilson CC 20,000 1,447 5,262 25,262
Total $1,160,000 186,499 $678,215 $1,838,215
35

3. Small Business Centers
Purpose: The mission of each Small Business Center (SBC) is to help the many small
businesses within its service area survive, prosper, and contribute to the economic well-being
of the community and the state. Small Business Centers provide a wide variety of seminars
and workshops, one-on-one counseling, a library of resources, and referrals to other sources
of help to owners and operators of small businesses.
The expenditure of SBC funds must be consistent with the State Board’s Small Business
Center Network (SBCN) Guidelines (adopted on February 18, 2011, Program Attachment 5).
At a minimum, the annual SBC program funding will provide for the following at each of the
58 colleges: a) salary and fringe benefits for a full-time SBC Director or in a manner that is at
least equivalent to a full-time director; and b) $9,000 for instruction, either through
instructional or contractual services budget items, that does not earn budget FTE. Colleges
should also be aware of the following fiscally-related provisions in the SBCN Guidelines:
All instruction supported by SBC funds must be used for SBC-sponsored courses,
seminars, and workshops.
SBC funds cannot be used to produce FTE, except for SBCN-approved
entrepreneurship programs.
SBCN program funds may not be used for building or renovation of facilities.
If a Small Business Center Director coordinates FTE-generating classes designed to
meet the management needs of entrepreneurs, that Director’s salary will need to be
pro-rated according to the formula spelled out in the Guidelines.
If a Small Business Center Director is asked to coordinate FTE-generating activities
that are Occupational Extension offerings that are not focused on entrepreneurship or
the "management needs" of entrepreneurs, then an alternative plan must be submitted
to the System Office/State Director for approval. Such arrangements should be rare.
Although colleges retain budget flexibility, using SBC funds to produce FTE (other
than approved entrepreneurship programs) or transferring SBC funds without a
NCCCS- or State-mandated reversion/reduction will result in the loss of performance
funding for the following year.
Allocation Method: A total of $6,172,773 is allocated in FY 2014-15 through the Small
Business Center allotment. Each college receives a base allocation of $95,312. The base
amount increased from FY 2013-14 to account for the legislative salary increase and changes
in employer contribution rates for hospitalization insurance and retirement.
Colleges also receive an additional performance allocation. This allocation is based on the
following factors (as measured using the sum of the prior two years’ data):
Number of Non-FTE Attendees
Number of Non-FTE Seminars
Number of Counseling Clients
36
Number of Counseling Hours
Number of Small Businesses in Service Area
Number of Businesses Started
Number of Jobs Created/Retained
For each factor, a college earns 1-58 points. The sum of each factor’s score determines a
college’s total point score. The total number of points determines a college’s performance
allocation; each point earns approximately $54. For FY 2014-15, performance funding
allocations are calculated based on the colleges’ pro-rata share of total point score, limited to
$644,677 in total due to fund availability. Two colleges had their performance allocation for
FY 2014-15 reduced due to using a portion of their FY 2013-14 allocation for non-SBC
activities. Those funds were allocated to all the other colleges as an adjustment to their
performance allocation.
Fiscal Management: These funds will be budgeted and expended through the following
codes:
Purpose codes: current or non-capitalized equipment – 363; capitalized equipment–
940
Vocational code: 83
Capitalized equipment purchases must be coded to object code 553500. Non-
capitalized equipment purchase should be coded to purpose 363 and object codes
555100 (non-capitalized equipment) or 555200 (non-capitalized equipment – high
risk)
In order to capture all costs associated with the Small Business Center, colleges
should charge all Small Business Center expenditures to this code and if additional
funds are needed, should transfer funds from other purposes to purpose code 363.
Total costs will be utilized for future funding requests and potential funding
reallocations.
These funds can be reverted as part of the Management Flexibility Reversion or transferred
into another purpose. However, doing so will impact future allocations. Specifically,
colleges that use funds for non-SBC activities or transfer funds out of the SBC budget
will not be eligible for their entire performance allocation in the next fiscal year. The
performance allocation for next fiscal year will be reduced by the amount of funds used for
non-SBC activities. Colleges are allowed to return funds as part of the Management
Flexibility reversion or any other reversion up to the pro-rata share of the total amount of the
cut without impacting next year’s performance allocation.
The $9000 requirement that funds be expended for instruction can be waived by the System
Office upon recommendation of the State Small Business Center Director in the case of a
budgetary shortfall. If that is the case, that reversion will not affect future performance
allocations.
37

NORTH CAROLINA COMMUNITY COLLEGE SYSTEMSMALL BUSINESS CENTER ALLOTMENT
FY 2014-15
Community CollegeBase
AllocationPerformance
AllocationTotal
AllocationAlamance CC $95,312 $11,200 $106,512
Asheville-Buncombe TCC 95,312 18,483 113,795
Beaufort County CC 95,312 8,111 103,423
Bladen CC 95,312 1,766 97,078
Blue Ridge CC 95,312 18,814 114,126
Brunswick CC 95,312 6,621 101,933
Caldwell CC and TI 95,312 9,380 104,692
Cape Fear CC 95,312 18,042 113,354
Carteret CC 95,312 9,490 104,802
Catawba Valley CC 95,312 15,559 110,871
Central Carolina CC 95,312 20,359 115,671
Central Piedmont CC 95,312 21,076 116,388
Cleveland CC 95,312 9,655 104,967
Coastal Carolina CC 95,312 19,311 114,623
College of the Albemarle 95,312 14,235 109,547
Craven CC 95,312 12,911 108,223
Davidson County CC 95,312 3,862 99,174
Durham TCC 95,312 13,959 109,271
Edgecombe CC 95,312 8,662 103,974
Fayetteville TCC 95,312 16,276 111,588
Forsyth TCC 95,312 17,821 113,133
Gaston College 95,312 15,449 110,761
Guilford TCC 95,312 18,649 113,961
Halifax CC 95,312 7,448 102,760
Haywood CC 95,312 13,021 108,333
Isothermal CC 95,312 10,869 106,181
James Sprunt CC 95,312 10,814 106,126
Johnston CC 95,312 13,518 108,830
Lenoir CC 95,312 11,145 106,457
Martin CC 95,312 2,814 98,126
Mayland CC 95,312 10,152 105,464
McDowell TCC 95,312 7,007 102,319
Mitchell CC 95,312 14,400 109,712
Montgomery CC 95,312 7,173 102,485
Nash CC 95,312 6,897 102,209
Pamlico CC 95,312 3,641 98,953
Piedmont CC 95,312 3,586 98,898
Pitt CC 95,312 19,035 114,347
Randolph CC 95,312 6,124 101,436
Richmond CC 95,312 10,924 106,236
Roanoke Chowan CC 95,312 7,780 103,092
Robeson CC 95,312 16,056 111,368
Rockingham CC 95,312 0 95,312
Rowan-Cabarrus CC 95,312 16,607 111,919
Sampson CC 95,312 9,876 105,188
Sandhills CC 95,312 10,483 105,795
South Piedmont CC 95,312 4,635 99,947
Southeastern CC 95,312 13,794 109,106
Southwestern CC 95,312 3,697 99,009
Stanly CC 95,312 7,283 102,595
Surry CC 95,312 3,389 98,701
Tri-County CC 95,312 4,690 100,002
Vance-Granville CC 95,312 8,662 103,974
Wake TCC 95,312 21,628 116,940
Wayne CC 95,312 9,655 104,967
Western Piedmont CC 95,312 14,897 110,209
Wilkes CC 95,312 7,228 102,540
Wilson CC 95,312 16,058 111,370
TOTAL $5,528,096 $644,677 $6,172,773
38
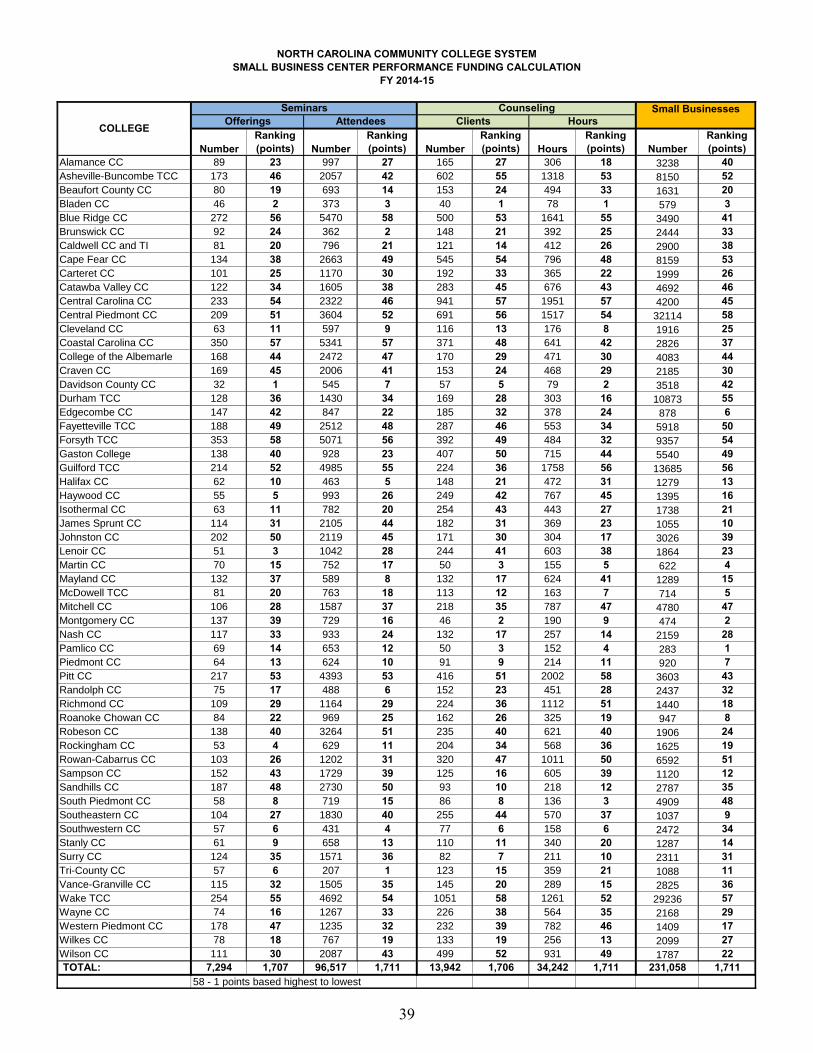
NORTH CAROLINA COMMUNITY COLLEGE SYSTEMSMALL BUSINESS CENTER PERFORMANCE FUNDING CALCULATION
FY 2014-15
NumberRanking (points) Number
Ranking (points) Number
Ranking (points) Hours
Ranking (points) Number
Ranking (points)
Alamance CC 89 23 997 27 165 27 306 18 3238 40Asheville-Buncombe TCC 173 46 2057 42 602 55 1318 53 8150 52Beaufort County CC 80 19 693 14 153 24 494 33 1631 20Bladen CC 46 2 373 3 40 1 78 1 579 3Blue Ridge CC 272 56 5470 58 500 53 1641 55 3490 41Brunswick CC 92 24 362 2 148 21 392 25 2444 33Caldwell CC and TI 81 20 796 21 121 14 412 26 2900 38Cape Fear CC 134 38 2663 49 545 54 796 48 8159 53Carteret CC 101 25 1170 30 192 33 365 22 1999 26Catawba Valley CC 122 34 1605 38 283 45 676 43 4692 46Central Carolina CC 233 54 2322 46 941 57 1951 57 4200 45Central Piedmont CC 209 51 3604 52 691 56 1517 54 32114 58Cleveland CC 63 11 597 9 116 13 176 8 1916 25Coastal Carolina CC 350 57 5341 57 371 48 641 42 2826 37College of the Albemarle 168 44 2472 47 170 29 471 30 4083 44Craven CC 169 45 2006 41 153 24 468 29 2185 30Davidson County CC 32 1 545 7 57 5 79 2 3518 42Durham TCC 128 36 1430 34 169 28 303 16 10873 55Edgecombe CC 147 42 847 22 185 32 378 24 878 6Fayetteville TCC 188 49 2512 48 287 46 553 34 5918 50Forsyth TCC 353 58 5071 56 392 49 484 32 9357 54Gaston College 138 40 928 23 407 50 715 44 5540 49Guilford TCC 214 52 4985 55 224 36 1758 56 13685 56Halifax CC 62 10 463 5 148 21 472 31 1279 13Haywood CC 55 5 993 26 249 42 767 45 1395 16Isothermal CC 63 11 782 20 254 43 443 27 1738 21James Sprunt CC 114 31 2105 44 182 31 369 23 1055 10Johnston CC 202 50 2119 45 171 30 304 17 3026 39Lenoir CC 51 3 1042 28 244 41 603 38 1864 23Martin CC 70 15 752 17 50 3 155 5 622 4Mayland CC 132 37 589 8 132 17 624 41 1289 15McDowell TCC 81 20 763 18 113 12 163 7 714 5Mitchell CC 106 28 1587 37 218 35 787 47 4780 47Montgomery CC 137 39 729 16 46 2 190 9 474 2Nash CC 117 33 933 24 132 17 257 14 2159 28Pamlico CC 69 14 653 12 50 3 152 4 283 1Piedmont CC 64 13 624 10 91 9 214 11 920 7Pitt CC 217 53 4393 53 416 51 2002 58 3603 43Randolph CC 75 17 488 6 152 23 451 28 2437 32Richmond CC 109 29 1164 29 224 36 1112 51 1440 18Roanoke Chowan CC 84 22 969 25 162 26 325 19 947 8Robeson CC 138 40 3264 51 235 40 621 40 1906 24Rockingham CC 53 4 629 11 204 34 568 36 1625 19Rowan-Cabarrus CC 103 26 1202 31 320 47 1011 50 6592 51Sampson CC 152 43 1729 39 125 16 605 39 1120 12Sandhills CC 187 48 2730 50 93 10 218 12 2787 35South Piedmont CC 58 8 719 15 86 8 136 3 4909 48Southeastern CC 104 27 1830 40 255 44 570 37 1037 9Southwestern CC 57 6 431 4 77 6 158 6 2472 34Stanly CC 61 9 658 13 110 11 340 20 1287 14Surry CC 124 35 1571 36 82 7 211 10 2311 31Tri-County CC 57 6 207 1 123 15 359 21 1088 11Vance-Granville CC 115 32 1505 35 145 20 289 15 2825 36Wake TCC 254 55 4692 54 1051 58 1261 52 29236 57Wayne CC 74 16 1267 33 226 38 564 35 2168 29Western Piedmont CC 178 47 1235 32 232 39 782 46 1409 17Wilkes CC 78 18 767 19 133 19 256 13 2099 27Wilson CC 111 30 2087 43 499 52 931 49 1787 22TOTAL: 7,294 1,707 96,517 1,711 13,942 1,706 34,242 1,711 231,058 1,711
58 - 1 points based highest to lowest
COLLEGE
Seminars Counseling Small BusinessesOfferings Attendees Clients Hours
39

NORTH CAROLINA COMMUNITY COLLEGE SYSTEMSMALL BUSINESS CENTER PERFORMANCE FUNDING CALCULATION
FY 2014-15
Alamance CC
Asheville-Buncombe TCC
Beaufort County CC
Bladen CC
Blue Ridge CC
Brunswick CC
Caldwell CC and TI
Cape Fear CC
Carteret CC
Catawba Valley CC
Central Carolina CC
Central Piedmont CC
Cleveland CC
Coastal Carolina CC
College of the Albemarle
Craven CC
Davidson County CC
Durham TCC
Edgecombe CC
Fayetteville TCC
Forsyth TCC
Gaston College
Guilford TCC
Halifax CC
Haywood CC
Isothermal CC
James Sprunt CC
Johnston CC
Lenoir CC
Martin CC
Mayland CC
McDowell TCC
Mitchell CC
Montgomery CC
Nash CC
Pamlico CC
Piedmont CC
Pitt CC
Randolph CC
Richmond CC
Roanoke Chowan CC
Robeson CC
Rockingham CC
Rowan-Cabarrus CC
Sampson CC
Sandhills CC
South Piedmont CC
Southeastern CC
Southwestern CC
Stanly CC
Surry CC
Tri-County CC
Vance-Granville CC
Wake TCC
Wayne CC
Western Piedmont CC
Wilkes CC
Wilson CC
TOTAL:
COLLEGE
NumberRanking (points) Number
Ranking (points)
14 27 117 41 203 34 $10,973 $227 $11,20032 47 116 40 335 51 $18,107 $376 $18,4837 11 63 26 147 19 $7,946 $165 $8,1117 11 26 11 32 1 $1,730 $36 $1,76618 32 166 46 341 53 $18,432 $382 $18,8142 2 27 13 120 10 $6,486 $135 $6,62115 30 53.5 21 170 23 $9,189 $191 $9,38033 49 92 36 327 50 $17,675 $367 $18,0429 19 33 17 172 24 $9,297 $193 $9,49029 42 91 34 282 44 $15,243 $316 $15,55943 53 386 57 369 56 $19,945 $414 $20,35949 55 328 56 382 57 $20,648 $428 $21,07655 57 246 52 175 25 $9,459 $196 $9,65551 56 273 53 350 55 $18,918 $393 $19,31118 32 82 32 258 40 $13,945 $290 $14,2358 15 239 50 234 35 $12,648 $263 $12,9113 4 23 9 70 6 $3,784 $78 $3,86232 47 94 37 253 39 $13,675 $284 $13,95911 23 20 8 157 20 $8,486 $176 $8,66219 34 91 34 295 47 $15,945 $331 $16,27629 42 82 32 323 49 $17,459 $362 $17,82114 27 201 47 280 43 $15,135 $314 $15,44915 30 273 53 338 52 $18,270 $379 $18,64914 27 70 28 135 16 $7,297 $151 $7,44848 54 204 48 236 36 $12,756 $265 $13,02135 51 62 24 197 31 $10,648 $221 $10,86919 34 58.5 23 196 30 $10,594 $220 $10,81425 40 62 24 245 37 $13,243 $275 $13,51822 38 79 31 202 33 $10,918 $227 $11,1454 5 4.5 2 51 2 $2,757 $57 $2,81424 39 68 27 184 28 $9,946 $206 $10,15220 36 72 29 127 12 $6,865 $142 $7,00721 37 74 30 261 41 $14,108 $292 $14,40011 23 99 39 130 13 $7,027 $146 $7,1734 5 15 4 125 11 $6,756 $141 $6,89710 21 26 11 66 4 $3,567 $74 $3,6415 8 18 7 65 3 $3,513 $73 $3,58633 49 98.5 38 345 54 $18,648 $387 $19,0352 2 14.5 3 111 9 $6,000 $124 $6,1248 15 47 20 198 32 $10,702 $222 $10,92411 23 35 18 141 17 $7,621 $159 $7,78028 41 317 55 291 45 $15,729 $327 $16,0568 15 131 42 161 22 $8,702 ($8,702) $035 51 164 45 301 48 $16,270 $337 $16,6077 11 38.5 19 179 27 $9,675 $201 $9,87612 26 23 9 190 29 $10,270 $213 $10,4831 1 1 1 84 7 $4,540 $95 $4,63530 44 212 49 250 38 $13,513 $281 $13,7944 5 17 6 67 5 $3,621 $76 $3,69710 21 154 44 132 15 $7,135 $148 $7,2836 9 31 15 143 18 $7,729 ($4,340) $3,3896 9 54 22 85 8 $4,594 $96 $4,6908 15 15 4 157 20 $8,486 $176 $8,66285 58 423.5 58 392 58 $21,188 $440 $21,6287 11 27 13 175 25 $9,459 $196 $9,65531 46 133 43 270 42 $14,594 $303 $14,8979 19 32 16 131 14 $7,081 $147 $7,22830 44 245.5 51 291 45 $15,730 $328 $16,058
1,146 1,678 6,248 1,703 11,927 $644,677 $0 $644,677Approximate Value Per Point: $54
Total Point Score
Overall Points
Ranking
FY14-15Performance
Allocation
Economic Impact Unadjusted FY14-15
Performance Allocation
AdjustmentStartups Jobs Created/Retained
40
4. Customized Training
Per G.S. 115D-5.1(e), the Customized Training Program offers programs and training
services to assist new and existing business and industry to remain productive, profitable, and
within the State. Funds are allocated to colleges through four means:
a) Customized Training – Program Projects
Purpose: Funds are allotted to colleges to provide customized training assistance in
support of full-time production and customer service positions created in the State of
North Carolina, thereby enhancing the growth potential of companies located in the state
while simultaneously preparing the State’s workforce with skills essential to successful
employment in emerging industries. Business and industries must meet certain criteria to
be eligible to receive assistance. Funds must be used in accordance with the Customized
Training Guidelines adopted by the State Board (see Numbered Memo CC09-14).
Colleges receive a ten percent administrative allowance based upon the current fiscal
year expenditures that support approved Customized Training Program projects. These
administrative funds may be used for the following purposes:
Project clerical staff;
Project administrative personnel;
Project coordination staff;
Travel expenses for personnel involved with the developing, coordinating,
implementing, and monitoring of a Customized Training project;
Administrative business operations costs (printing, mailing, filing, etc.) associated
with Customized Training projects; and
Printing costs of marketing materials for the Customized Training Program.
Allocation Method: Funds are allocated to colleges upon System Office approval of
Funds Action Requests for qualifying projects.
Fiscal Management: These funds will be budgeted and expended through the following
codes:
Purpose codes: 361 (Use this purpose code regardless of whether the project is
approved as job growth, technology investment, or productivity enhancement.)
Vocational code: 80
Customized Training funds cannot be reverted as part of the Management
Flexibility reduction or transferred out to another purpose. Other State funds are
not allowed to be transferred into this purpose.
41
b) Customized Training – Business and Industry Support
Purpose: Colleges receive an initial support allocation that includes both an
administrative ($40,000) and an instructional component. Colleges may only use up to
$40,000 for administrative purposes. These funds may be used to support – in total or
in part – a position whose responsibility is to serve business and industry. The
instructional component may only be used for instructional activities supporting the
Manufacturing, Warehousing and Distribution, Business Support Services, Information
Technology, and Computer Software Design industries.
Allocation Method: A total of $3,002,500 is allocated in FY 2014-15 to community
colleges for Business and Industry Support. Each college receives an administrative
allotment of $40,000.14 Colleges receive an additional instructional allotment based on
the eligible employment in the college’s service area per the following formula:
Eligible Employment Instructional Allotment
Less than 5,000 jobs $7,500
5000 – 10,000 jobs $10,000
Greater than 10,000 jobs $20,000
Eligible employment is defined as employment in the Manufacturing, Warehousing and
Distribution, Business Support Services, Information Technology, and Computer
Software Design industries, as reported by the NC Division of Employment Security for
the 4th quarter of 2013.
Fiscal Management: These funds will be budgeted and expended through the following
codes:
Purpose codes: 364
Vocational code: 80
Customized Training funds cannot be reverted as part of the Management Flexibility
reduction or transferred out to another purpose. Other State funds are not allowed to
be transferred into this purpose.
14 The only exception is Pamlico CC, which is combined into a consortium with Craven CC.
42

NORTH CAROLINA COMMUNITY COLLEGE SYSTEMCUSTOMIZED TRAINING: BUSINESS AND INDUSTRY SUPPORT
FY 2014-15
Community CollegeAdministrative
AllotmentInstructional
Allotment Total AllotmentAlamance CC $40,000 $20,000 $60,000
Asheville-Buncombe TCC 40,000 20,000 60,000
Beaufort County CC 40,000 7,500 47,500
Bladen CC 40,000 10,000 50,000
Blue Ridge CC 40,000 10,000 50,000
Brunswick CC 40,000 7,500 47,500
Caldwell CC & TI 40,000 10,000 50,000
Cape Fear CC 40,000 20,000 60,000
Carteret CC 40,000 7,500 47,500
Catawba Valley CC 40,000 20,000 60,000
Central Carolina CC 40,000 20,000 60,000
Central Piedmont CC 40,000 20,000 60,000
Cleveland CC 40,000 10,000 50,000
Coastal Carolina CC 40,000 7,500 47,500
College of The Albemarle 40,000 7,500 47,500
Craven CC 40,000 10,000 50,000
Davidson County CC 40,000 20,000 60,000
Durham TCC 40,000 20,000 60,000
Edgecombe CC 40,000 7,500 47,500
Fayetteville TCC 40,000 20,000 60,000
Forsyth TCC 40,000 20,000 60,000
Gaston College 40,000 20,000 60,000
Guilford TCC 40,000 20,000 60,000
Halifax CC 40,000 7,500 47,500
Haywood CC 40,000 7,500 47,500
Isothermal CC 40,000 7,500 47,500
James Sprunt CC 40,000 10,000 50,000
Johnston CC 40,000 10,000 50,000
Lenoir CC 40,000 10,000 50,000
Martin CC 40,000 7,500 47,500
Mayland CC 40,000 7,500 47,500
McDowell TCC 40,000 10,000 50,000
Mitchell CC 40,000 20,000 60,000
Montgomery CC 40,000 7,500 47,500
Nash CC 40,000 10,000 50,000
Pamlico CC* * * *
Piedmont CC 40,000 7,500 47,500
Pitt CC 40,000 20,000 60,000
Randolph CC 40,000 20,000 60,000
Richmond CC 40,000 10,000 50,000
Roanoke-Chowan CC 40,000 7,500 47,500
Robeson CC 40,000 10,000 50,000
Rockingham CC 40,000 10,000 50,000
Rowan-Cabarrus CC 40,000 20,000 60,000
Sampson CC 40,000 7,500 47,500
Sandhills CC 40,000 10,000 50,000
South Piedmont CC 40,000 20,000 60,000
Southeastern CC 40,000 7,500 47,500
Southwestern CC 40,000 7,500 47,500
Stanly CC 40,000 7,500 47,500
Surry CC 40,000 10,000 50,000
Tri-County CC 40,000 7,500 47,500
Vance-Granville CC 40,000 20,000 60,000
Wake TCC 40,000 20,000 60,000
Wayne CC 40,000 10,000 50,000
Western Piedmont CC 40,000 10,000 50,000
Wilkes CC 40,000 10,000 50,000
Wilson CC 40,000 20,000 60,000
Total $2,280,000 $722,500 $3,002,500*Craven CC and Pamlico CC are combined into a consortium.
43

c) Customized Training – Regional Capacity Building – FOR INFORMATION ONLY
Per G.S. 115D-5.1(f3), up to eight percent of the funds appropriated each year for
Customized Training may be used to train and support regional community college
personnel to deliver training services. These funds support much-needed depth in the
training services delivery capacity of the NC Community College System. The State
Board will be requested to take action on allocations to host colleges in a separate agenda
item.
Fiscal Management: These funds are budgeted and expended through the following
codes:
Purpose codes: 360
Vocational code: 80
Customized Training funds cannot be reverted as part of the Management
Flexibility reduction or transferred out to another purpose. Other State funds are
not allowed to be transferred into this purpose.
d) Customized Training – Local Capacity Building – FOR INFORMATION ONLY
Per G.S. 115D-5.1(f2), up to ten percent of college-delivered training expenditures and
up to five percent of contractor-delivered training expenditures of the prior fiscal year
may be allotted to each college for capacity building at that college. Colleges utilize
these funds to build the internal capacity of the college to provide customized training
through instructor/trainer skill-specific training, certifications, and development of
instructional materials at the local level. The State Board will be requested to take action
on the amount that individual colleges may access for local capacity building activities in
a separate agenda item.
Fiscal Management: These funds are budgeted and expended through the following
codes:
Purpose codes: 359
Vocational code: 80
Customized Training funds cannot be reverted as part of the Management
Flexibility reduction or transferred out to another purpose. Other State funds are
not allowed to be transferred into this purpose.
44

(This page left blank intentionally)
45
5. Equipment
Purpose: Regular Equipment allocations provide funds for administrative and educational
equipment and furniture.
Allocation Method: A total of $48,962,762 is allocated in FY 2014-15 through the regular
Equipment allotment. A college’s regular equipment allocation is determined by the sum of
the following components:
Base Allocation: Each college receives a base of $100,000.
Weighted FTE Allocation: The remaining balance of the Equipment allotment is
allocated among colleges based on each college’s equipment full-time equivalent
(E/FTE). Colleges receive $245.12 per E/FTE. A college’s E/FTE shall be
calculated by applying the following ratios to the actual FTE for the preceding year,
and adding the products to obtain a sum for each college:
CATEGORY WEIGHT
a) Low equipment intensity programs...............0.50
(College Transfer, General Education, Basic Skills)
b) Moderate equipment intensity programs......0.75
(Occupational Extension)
c) High equipment intensity programs..............1.00
(Technical and Vocational)
Fiscal Management: These funds will be budgeted and expended through the following
codes:
Purpose codes: 920 (Regular Equipment)
Vocational code: 97 or 20, consistent the Accounting Procedures Manual
Note: Any categorical funds that are used for equipment should be coded to Purpose
940.
All equipment-related items over $5,000 must be charged to a Capitalized Equipment object
code and tracked in the college’s inventory system. Equipment costing less than $5,000 are
expensed; they are not capitalized nor depreciated and must be coded as either Non-
Capitalized Equipment or Non-Capitalized Equipment- High Risk. Non-Capitalized
Equipment is a non-consumable asset and should never be purchased using a supply object
code. Non-Capitalized Equipment object codes can be used with either a capital purpose
code (920) or with a current operating purpose code (1XX, 220, 3XX, 4XX, 510).
46
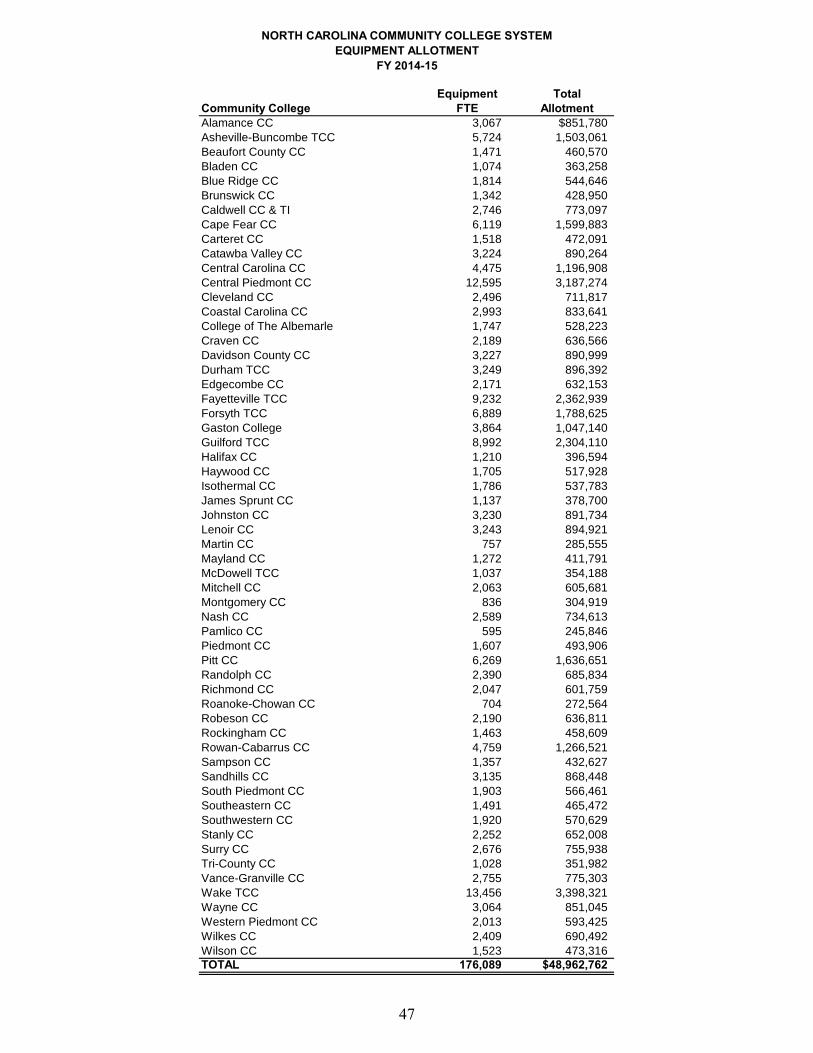
NORTH CAROLINA COMMUNITY COLLEGE SYSTEMEQUIPMENT ALLOTMENT
FY 2014-15
Equipment TotalCommunity College FTE AllotmentAlamance CC 3,067 $851,780
Asheville-Buncombe TCC 5,724 1,503,061
Beaufort County CC 1,471 460,570
Bladen CC 1,074 363,258
Blue Ridge CC 1,814 544,646
Brunswick CC 1,342 428,950
Caldwell CC & TI 2,746 773,097
Cape Fear CC 6,119 1,599,883
Carteret CC 1,518 472,091
Catawba Valley CC 3,224 890,264
Central Carolina CC 4,475 1,196,908
Central Piedmont CC 12,595 3,187,274
Cleveland CC 2,496 711,817
Coastal Carolina CC 2,993 833,641
College of The Albemarle 1,747 528,223
Craven CC 2,189 636,566
Davidson County CC 3,227 890,999
Durham TCC 3,249 896,392
Edgecombe CC 2,171 632,153
Fayetteville TCC 9,232 2,362,939
Forsyth TCC 6,889 1,788,625
Gaston College 3,864 1,047,140
Guilford TCC 8,992 2,304,110
Halifax CC 1,210 396,594
Haywood CC 1,705 517,928
Isothermal CC 1,786 537,783
James Sprunt CC 1,137 378,700
Johnston CC 3,230 891,734
Lenoir CC 3,243 894,921
Martin CC 757 285,555
Mayland CC 1,272 411,791
McDowell TCC 1,037 354,188
Mitchell CC 2,063 605,681
Montgomery CC 836 304,919
Nash CC 2,589 734,613
Pamlico CC 595 245,846
Piedmont CC 1,607 493,906
Pitt CC 6,269 1,636,651
Randolph CC 2,390 685,834
Richmond CC 2,047 601,759
Roanoke-Chowan CC 704 272,564
Robeson CC 2,190 636,811
Rockingham CC 1,463 458,609
Rowan-Cabarrus CC 4,759 1,266,521
Sampson CC 1,357 432,627
Sandhills CC 3,135 868,448
South Piedmont CC 1,903 566,461
Southeastern CC 1,491 465,472
Southwestern CC 1,920 570,629
Stanly CC 2,252 652,008
Surry CC 2,676 755,938
Tri-County CC 1,028 351,982
Vance-Granville CC 2,755 775,303
Wake TCC 13,456 3,398,321
Wayne CC 3,064 851,045
Western Piedmont CC 2,013 593,425
Wilkes CC 2,409 690,492
Wilson CC 1,523 473,316
TOTAL 176,089 $48,962,762
47
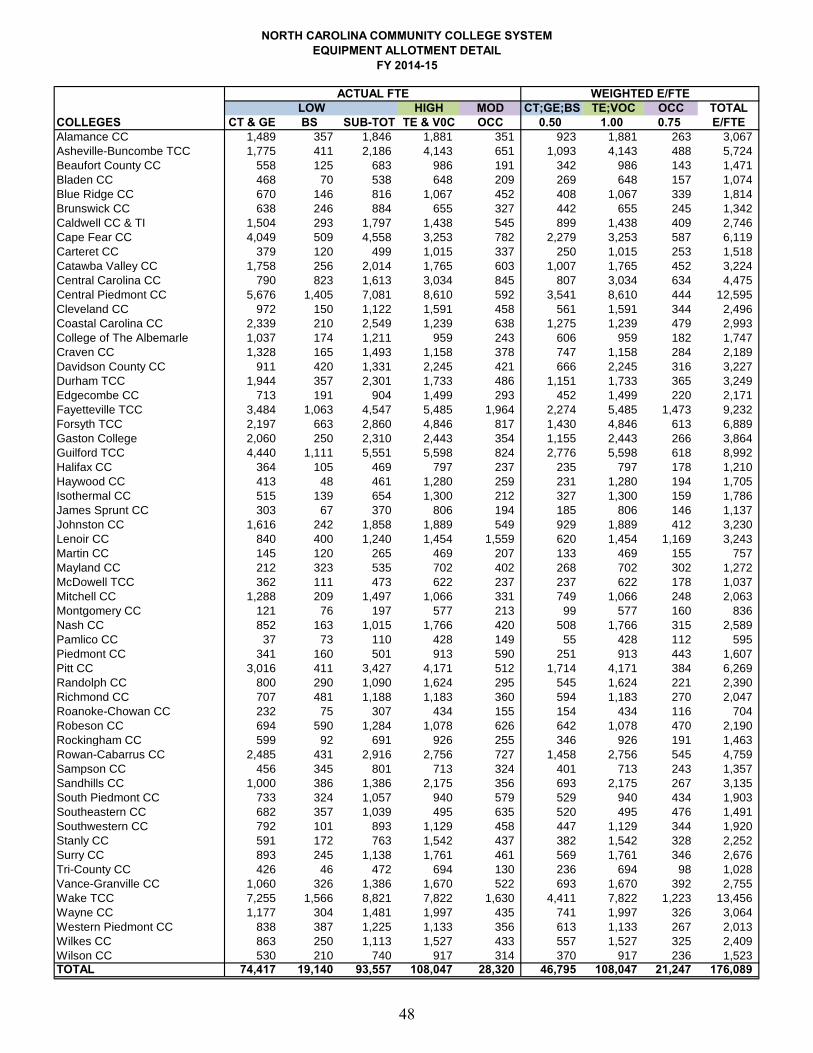
NORTH CAROLINA COMMUNITY COLLEGE SYSTEMEQUIPMENT ALLOTMENT DETAIL
FY 2014-15
HIGH MOD CT;GE;BS TE;VOC OCC TOTALCOLLEGES CT & GE BS SUB-TOT TE & V0C OCC 0.50 1.00 0.75 E/FTEAlamance CC 1,489 357 1,846 1,881 351 923 1,881 263 3,067
Asheville-Buncombe TCC 1,775 411 2,186 4,143 651 1,093 4,143 488 5,724
Beaufort County CC 558 125 683 986 191 342 986 143 1,471
Bladen CC 468 70 538 648 209 269 648 157 1,074
Blue Ridge CC 670 146 816 1,067 452 408 1,067 339 1,814
Brunswick CC 638 246 884 655 327 442 655 245 1,342
Caldwell CC & TI 1,504 293 1,797 1,438 545 899 1,438 409 2,746
Cape Fear CC 4,049 509 4,558 3,253 782 2,279 3,253 587 6,119
Carteret CC 379 120 499 1,015 337 250 1,015 253 1,518
Catawba Valley CC 1,758 256 2,014 1,765 603 1,007 1,765 452 3,224
Central Carolina CC 790 823 1,613 3,034 845 807 3,034 634 4,475
Central Piedmont CC 5,676 1,405 7,081 8,610 592 3,541 8,610 444 12,595
Cleveland CC 972 150 1,122 1,591 458 561 1,591 344 2,496
Coastal Carolina CC 2,339 210 2,549 1,239 638 1,275 1,239 479 2,993
College of The Albemarle 1,037 174 1,211 959 243 606 959 182 1,747
Craven CC 1,328 165 1,493 1,158 378 747 1,158 284 2,189
Davidson County CC 911 420 1,331 2,245 421 666 2,245 316 3,227
Durham TCC 1,944 357 2,301 1,733 486 1,151 1,733 365 3,249
Edgecombe CC 713 191 904 1,499 293 452 1,499 220 2,171
Fayetteville TCC 3,484 1,063 4,547 5,485 1,964 2,274 5,485 1,473 9,232
Forsyth TCC 2,197 663 2,860 4,846 817 1,430 4,846 613 6,889
Gaston College 2,060 250 2,310 2,443 354 1,155 2,443 266 3,864
Guilford TCC 4,440 1,111 5,551 5,598 824 2,776 5,598 618 8,992
Halifax CC 364 105 469 797 237 235 797 178 1,210
Haywood CC 413 48 461 1,280 259 231 1,280 194 1,705
Isothermal CC 515 139 654 1,300 212 327 1,300 159 1,786
James Sprunt CC 303 67 370 806 194 185 806 146 1,137
Johnston CC 1,616 242 1,858 1,889 549 929 1,889 412 3,230
Lenoir CC 840 400 1,240 1,454 1,559 620 1,454 1,169 3,243
Martin CC 145 120 265 469 207 133 469 155 757
Mayland CC 212 323 535 702 402 268 702 302 1,272
McDowell TCC 362 111 473 622 237 237 622 178 1,037
Mitchell CC 1,288 209 1,497 1,066 331 749 1,066 248 2,063
Montgomery CC 121 76 197 577 213 99 577 160 836
Nash CC 852 163 1,015 1,766 420 508 1,766 315 2,589
Pamlico CC 37 73 110 428 149 55 428 112 595
Piedmont CC 341 160 501 913 590 251 913 443 1,607
Pitt CC 3,016 411 3,427 4,171 512 1,714 4,171 384 6,269
Randolph CC 800 290 1,090 1,624 295 545 1,624 221 2,390
Richmond CC 707 481 1,188 1,183 360 594 1,183 270 2,047
Roanoke-Chowan CC 232 75 307 434 155 154 434 116 704
Robeson CC 694 590 1,284 1,078 626 642 1,078 470 2,190
Rockingham CC 599 92 691 926 255 346 926 191 1,463
Rowan-Cabarrus CC 2,485 431 2,916 2,756 727 1,458 2,756 545 4,759
Sampson CC 456 345 801 713 324 401 713 243 1,357
Sandhills CC 1,000 386 1,386 2,175 356 693 2,175 267 3,135
South Piedmont CC 733 324 1,057 940 579 529 940 434 1,903
Southeastern CC 682 357 1,039 495 635 520 495 476 1,491
Southwestern CC 792 101 893 1,129 458 447 1,129 344 1,920
Stanly CC 591 172 763 1,542 437 382 1,542 328 2,252
Surry CC 893 245 1,138 1,761 461 569 1,761 346 2,676
Tri-County CC 426 46 472 694 130 236 694 98 1,028
Vance-Granville CC 1,060 326 1,386 1,670 522 693 1,670 392 2,755
Wake TCC 7,255 1,566 8,821 7,822 1,630 4,411 7,822 1,223 13,456
Wayne CC 1,177 304 1,481 1,997 435 741 1,997 326 3,064
Western Piedmont CC 838 387 1,225 1,133 356 613 1,133 267 2,013
Wilkes CC 863 250 1,113 1,527 433 557 1,527 325 2,409
Wilson CC 530 210 740 917 314 370 917 236 1,523
TOTAL 74,417 19,140 93,557 108,047 28,320 46,795 108,047 21,247 176,089
ACTUAL FTE WEIGHTED E/FTELOW
48

NORTH CAROLINA COMMUNITY COLLEGE SYSTEMEQUIPMENT ALLOTMENT DETAIL
FY 2014-15
COLLEGESAlamance CC
Asheville-Buncombe TCC
Beaufort County CC
Bladen CC
Blue Ridge CC
Brunswick CC
Caldwell CC & TI
Cape Fear CC
Carteret CC
Catawba Valley CC
Central Carolina CC
Central Piedmont CC
Cleveland CC
Coastal Carolina CC
College of The Albemarle
Craven CC
Davidson County CC
Durham TCC
Edgecombe CC
Fayetteville TCC
Forsyth TCC
Gaston College
Guilford TCC
Halifax CC
Haywood CC
Isothermal CC
James Sprunt CC
Johnston CC
Lenoir CC
Martin CC
Mayland CC
McDowell TCC
Mitchell CC
Montgomery CC
Nash CC
Pamlico CC
Piedmont CC
Pitt CC
Randolph CC
Richmond CC
Roanoke-Chowan CC
Robeson CC
Rockingham CC
Rowan-Cabarrus CC
Sampson CC
Sandhills CC
South Piedmont CC
Southeastern CC
Southwestern CC
Stanly CC
Surry CC
Tri-County CC
Vance-Granville CC
Wake TCC
Wayne CC
Western Piedmont CC
Wilkes CC
Wilson CC
TOTAL
BASE E/FTEALLOTMENT ALLOTMENT TOTAL
$100,000 @ $245.12 PER E/FTE ALLOTMENT100,000$ 751,780 851,780$
100,000 1,403,061 1,503,061
100,000 360,570 460,570
100,000 263,258 363,258
100,000 444,646 544,646
100,000 328,950 428,950
100,000 673,097 773,097
100,000 1,499,883 1,599,883
100,000 372,091 472,091
100,000 790,264 890,264
100,000 1,096,908 1,196,908
100,000 3,087,274 3,187,274
100,000 611,817 711,817
100,000 733,641 833,641
100,000 428,223 528,223
100,000 536,566 636,566
100,000 790,999 890,999
100,000 796,392 896,392
100,000 532,153 632,153
100,000 2,262,939 2,362,939
100,000 1,688,625 1,788,625
100,000 947,140 1,047,140
100,000 2,204,110 2,304,110
100,000 296,594 396,594
100,000 417,928 517,928
100,000 437,783 537,783
100,000 278,700 378,700
100,000 791,734 891,734
100,000 794,921 894,921
100,000 185,555 285,555
100,000 311,791 411,791
100,000 254,188 354,188
100,000 505,681 605,681
100,000 204,919 304,919
100,000 634,613 734,613
100,000 145,846 245,846
100,000 393,906 493,906
100,000 1,536,651 1,636,651
100,000 585,834 685,834
100,000 501,759 601,759
100,000 172,564 272,564
100,000 536,811 636,811
100,000 358,609 458,609
100,000 1,166,521 1,266,521
100,000 332,627 432,627
100,000 768,448 868,448
100,000 466,461 566,461
100,000 365,472 465,472
100,000 470,629 570,629
100,000 552,008 652,008
100,000 655,938 755,938
100,000 251,982 351,982
100,000 675,303 775,303
100,000 3,298,321 3,398,321
100,000 751,045 851,045
100,000 493,425 593,425
100,000 590,492 690,492
100,000 373,316 473,316
$5,800,000 $43,162,762 $48,962,762
49

6. Instructional Resources
Purpose: The Instructional Resources allotment provides funds for library books, book-like
materials, magazines and periodicals, audio visual materials, and other non-equipment
learning resources of a durable nature. Book like materials include electronic resources such
as e-book leases and subscriptions to e-book collections.
Allocation Method: A total of $2,500,000 is allocated in FY 2014-15 through the
Instructional Resources allotment. A college’s instructional resources allocation is
determined by the sum of the following components:
Base Allocation: Each college receives a base of $25,000.
Weighted FTE Allocation: The remaining balance of the Instructional Resources
allotment is allocated among colleges based on each college’s weighted library full-
time equivalent (L/FTE). Colleges also receive $4.96 per weighted L/FTE above
1,000 L/FTE. A college’s L/FTE is calculated by applying the following ratios to the
actual FTE for the preceding year, and adding the products to obtain a sum for each
college:
CATEGORY WEIGHT
a) College Transfer and General Education FTE........2.0
b) Technical and Vocational Education FTE…..........1.0
c) Basic Skills and Occupational Extension FTE......0.25
Fiscal Management: These funds will be budgeted and expended through the following
codes:
Purpose codes: 930
Vocational code: 97
The purchase of Magazines and Newspaper Subscriptions (use object code 539400), and
Audio Visual Supplies (use object code 528000) can be charged to a current expense
purpose code or to purpose 930.
50
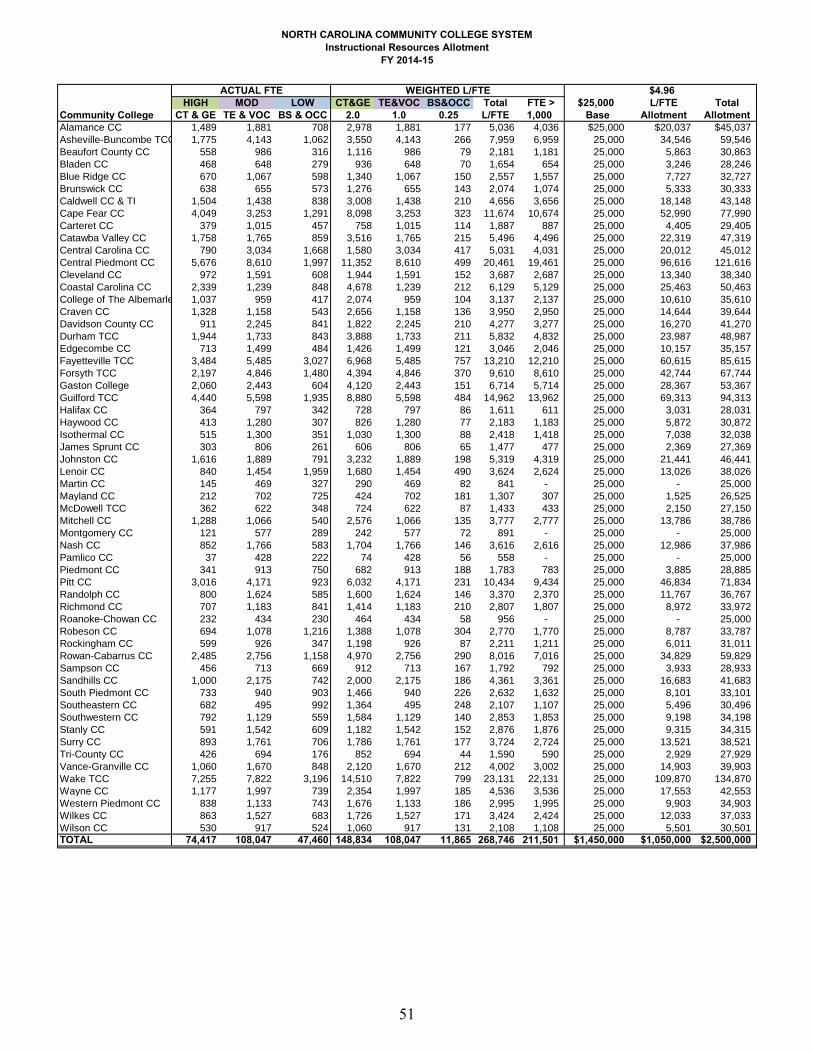
NORTH CAROLINA COMMUNITY COLLEGE SYSTEMInstructional Resources Allotment
FY 2014-15
$4.96HIGH MOD LOW CT&GE TE&VOC BS&OCC Total FTE > $25,000 L/FTE Total
Community College CT & GE TE & VOC BS & OCC 2.0 1.0 0.25 L/FTE 1,000 Base Allotment AllotmentAlamance CC 1,489 1,881 708 2,978 1,881 177 5,036 4,036 $25,000 $20,037 $45,037
Asheville-Buncombe TCC 1,775 4,143 1,062 3,550 4,143 266 7,959 6,959 25,000 34,546 59,546
Beaufort County CC 558 986 316 1,116 986 79 2,181 1,181 25,000 5,863 30,863
Bladen CC 468 648 279 936 648 70 1,654 654 25,000 3,246 28,246
Blue Ridge CC 670 1,067 598 1,340 1,067 150 2,557 1,557 25,000 7,727 32,727
Brunswick CC 638 655 573 1,276 655 143 2,074 1,074 25,000 5,333 30,333
Caldwell CC & TI 1,504 1,438 838 3,008 1,438 210 4,656 3,656 25,000 18,148 43,148
Cape Fear CC 4,049 3,253 1,291 8,098 3,253 323 11,674 10,674 25,000 52,990 77,990
Carteret CC 379 1,015 457 758 1,015 114 1,887 887 25,000 4,405 29,405
Catawba Valley CC 1,758 1,765 859 3,516 1,765 215 5,496 4,496 25,000 22,319 47,319
Central Carolina CC 790 3,034 1,668 1,580 3,034 417 5,031 4,031 25,000 20,012 45,012
Central Piedmont CC 5,676 8,610 1,997 11,352 8,610 499 20,461 19,461 25,000 96,616 121,616
Cleveland CC 972 1,591 608 1,944 1,591 152 3,687 2,687 25,000 13,340 38,340
Coastal Carolina CC 2,339 1,239 848 4,678 1,239 212 6,129 5,129 25,000 25,463 50,463
College of The Albemarle 1,037 959 417 2,074 959 104 3,137 2,137 25,000 10,610 35,610
Craven CC 1,328 1,158 543 2,656 1,158 136 3,950 2,950 25,000 14,644 39,644
Davidson County CC 911 2,245 841 1,822 2,245 210 4,277 3,277 25,000 16,270 41,270
Durham TCC 1,944 1,733 843 3,888 1,733 211 5,832 4,832 25,000 23,987 48,987
Edgecombe CC 713 1,499 484 1,426 1,499 121 3,046 2,046 25,000 10,157 35,157
Fayetteville TCC 3,484 5,485 3,027 6,968 5,485 757 13,210 12,210 25,000 60,615 85,615
Forsyth TCC 2,197 4,846 1,480 4,394 4,846 370 9,610 8,610 25,000 42,744 67,744
Gaston College 2,060 2,443 604 4,120 2,443 151 6,714 5,714 25,000 28,367 53,367
Guilford TCC 4,440 5,598 1,935 8,880 5,598 484 14,962 13,962 25,000 69,313 94,313
Halifax CC 364 797 342 728 797 86 1,611 611 25,000 3,031 28,031
Haywood CC 413 1,280 307 826 1,280 77 2,183 1,183 25,000 5,872 30,872
Isothermal CC 515 1,300 351 1,030 1,300 88 2,418 1,418 25,000 7,038 32,038
James Sprunt CC 303 806 261 606 806 65 1,477 477 25,000 2,369 27,369
Johnston CC 1,616 1,889 791 3,232 1,889 198 5,319 4,319 25,000 21,441 46,441
Lenoir CC 840 1,454 1,959 1,680 1,454 490 3,624 2,624 25,000 13,026 38,026
Martin CC 145 469 327 290 469 82 841 - 25,000 - 25,000
Mayland CC 212 702 725 424 702 181 1,307 307 25,000 1,525 26,525
McDowell TCC 362 622 348 724 622 87 1,433 433 25,000 2,150 27,150
Mitchell CC 1,288 1,066 540 2,576 1,066 135 3,777 2,777 25,000 13,786 38,786
Montgomery CC 121 577 289 242 577 72 891 - 25,000 - 25,000
Nash CC 852 1,766 583 1,704 1,766 146 3,616 2,616 25,000 12,986 37,986
Pamlico CC 37 428 222 74 428 56 558 - 25,000 - 25,000
Piedmont CC 341 913 750 682 913 188 1,783 783 25,000 3,885 28,885
Pitt CC 3,016 4,171 923 6,032 4,171 231 10,434 9,434 25,000 46,834 71,834
Randolph CC 800 1,624 585 1,600 1,624 146 3,370 2,370 25,000 11,767 36,767
Richmond CC 707 1,183 841 1,414 1,183 210 2,807 1,807 25,000 8,972 33,972
Roanoke-Chowan CC 232 434 230 464 434 58 956 - 25,000 - 25,000
Robeson CC 694 1,078 1,216 1,388 1,078 304 2,770 1,770 25,000 8,787 33,787
Rockingham CC 599 926 347 1,198 926 87 2,211 1,211 25,000 6,011 31,011
Rowan-Cabarrus CC 2,485 2,756 1,158 4,970 2,756 290 8,016 7,016 25,000 34,829 59,829
Sampson CC 456 713 669 912 713 167 1,792 792 25,000 3,933 28,933
Sandhills CC 1,000 2,175 742 2,000 2,175 186 4,361 3,361 25,000 16,683 41,683
South Piedmont CC 733 940 903 1,466 940 226 2,632 1,632 25,000 8,101 33,101
Southeastern CC 682 495 992 1,364 495 248 2,107 1,107 25,000 5,496 30,496
Southwestern CC 792 1,129 559 1,584 1,129 140 2,853 1,853 25,000 9,198 34,198
Stanly CC 591 1,542 609 1,182 1,542 152 2,876 1,876 25,000 9,315 34,315
Surry CC 893 1,761 706 1,786 1,761 177 3,724 2,724 25,000 13,521 38,521
Tri-County CC 426 694 176 852 694 44 1,590 590 25,000 2,929 27,929
Vance-Granville CC 1,060 1,670 848 2,120 1,670 212 4,002 3,002 25,000 14,903 39,903
Wake TCC 7,255 7,822 3,196 14,510 7,822 799 23,131 22,131 25,000 109,870 134,870
Wayne CC 1,177 1,997 739 2,354 1,997 185 4,536 3,536 25,000 17,553 42,553
Western Piedmont CC 838 1,133 743 1,676 1,133 186 2,995 1,995 25,000 9,903 34,903
Wilkes CC 863 1,527 683 1,726 1,527 171 3,424 2,424 25,000 12,033 37,033
Wilson CC 530 917 524 1,060 917 131 2,108 1,108 25,000 5,501 30,501
TOTAL 74,417 108,047 47,460 148,834 108,047 11,865 268,746 211,501 $1,450,000 $1,050,000 $2,500,000
ACTUAL FTE WEIGHTED L/FTE
51

C. Specific Program Categorical Allocations
S.L. 2014-100 appropriates funds to specific programs at certain colleges. Specific program
categorical allocations that support positions have been adjusted to account for the legislative
adjustments, the legislative salary increase, and changes in employer contribution rates for
hospitalization insurance and retirement. Colleges must submit a detailed budget plan for FY
2014-15 to the Director of State Aid Funds no later than September 30, 2014:
C1. High Cost Allocation for Marine Science Program - $704,204: Provides
supplemental funds to support the operation of the Marine Science program at Cape
Fear Community College.
These funds are budgeted and expended through the following codes:
Purpose codes: current – 220, 421; capitalized equipment – 940
Vocational code: 71
C2. Manufacturing Solutions Center – $864,678: Provides funds to Catawba Valley
Community College to support the operations of the Center, which assists
manufacturing companies adapt to the 21st century economy.15
These funds will be budgeted and expended through the following codes:
Purpose codes: current – 310, 422; capitalized equipment – 940
Vocational code: 87
C3. Botanical Lab – $100,000: Provides funds to Fayetteville Technical Community
College to support the operation of the Botanical Lab.
These funds will be budgeted and expended through the following codes:
Purpose codes: current - consistent with the approved detail budget plan;
capitalized equipment – 940
Vocational code: 47
C4. NC Military Business Center – $1,140,603: Provides funds to Fayetteville
Technical Community College to support the NC Military Business Center. The
purpose of the Center is to serve as a coordinator and facilitator for small- and
medium-sized businesses throughout the state seeking to win and complete federal
contracts, with a focus on military-related contracts.
These funds will be budgeted and expended through the following codes:
15 Joint Conference Committee Report on Continuation, Expansion, and Capital Budgets dated July 30, 2014: Item 45,
page F-10 increased funding by $150,000.
52
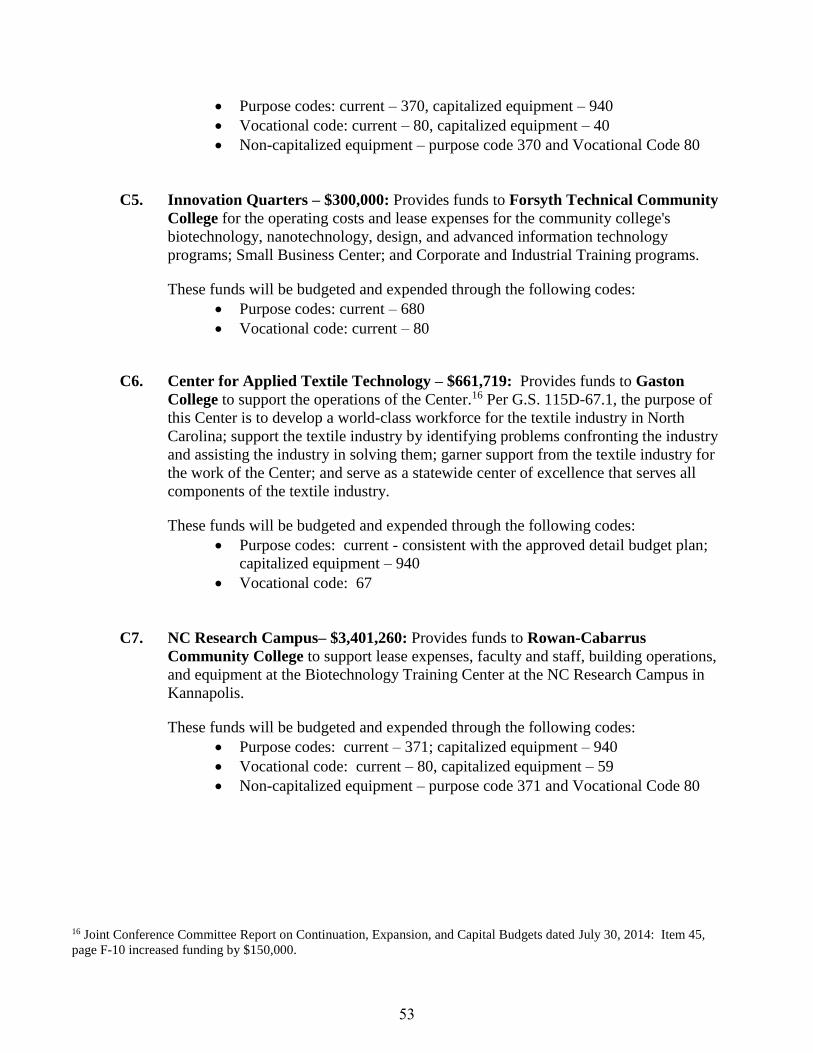
Purpose codes: current – 370, capitalized equipment – 940
Vocational code: current – 80, capitalized equipment – 40
Non-capitalized equipment – purpose code 370 and Vocational Code 80
C5. Innovation Quarters – $300,000: Provides funds to Forsyth Technical Community
College for the operating costs and lease expenses for the community college's
biotechnology, nanotechnology, design, and advanced information technology
programs; Small Business Center; and Corporate and Industrial Training programs.
These funds will be budgeted and expended through the following codes:
Purpose codes: current – 680
Vocational code: current – 80
C6. Center for Applied Textile Technology – $661,719: Provides funds to Gaston
College to support the operations of the Center.16 Per G.S. 115D-67.1, the purpose of
this Center is to develop a world-class workforce for the textile industry in North
Carolina; support the textile industry by identifying problems confronting the industry
and assisting the industry in solving them; garner support from the textile industry for
the work of the Center; and serve as a statewide center of excellence that serves all
components of the textile industry.
These funds will be budgeted and expended through the following codes:
Purpose codes: current - consistent with the approved detail budget plan;
capitalized equipment – 940
Vocational code: 67
C7. NC Research Campus– $3,401,260: Provides funds to Rowan-Cabarrus
Community College to support lease expenses, faculty and staff, building operations,
and equipment at the Biotechnology Training Center at the NC Research Campus in
Kannapolis.
These funds will be budgeted and expended through the following codes:
Purpose codes: current – 371; capitalized equipment – 940
Vocational code: current – 80, capitalized equipment – 59
Non-capitalized equipment – purpose code 371 and Vocational Code 80
16 Joint Conference Committee Report on Continuation, Expansion, and Capital Budgets dated July 30, 2014: Item 45,
page F-10 increased funding by $150,000.
53
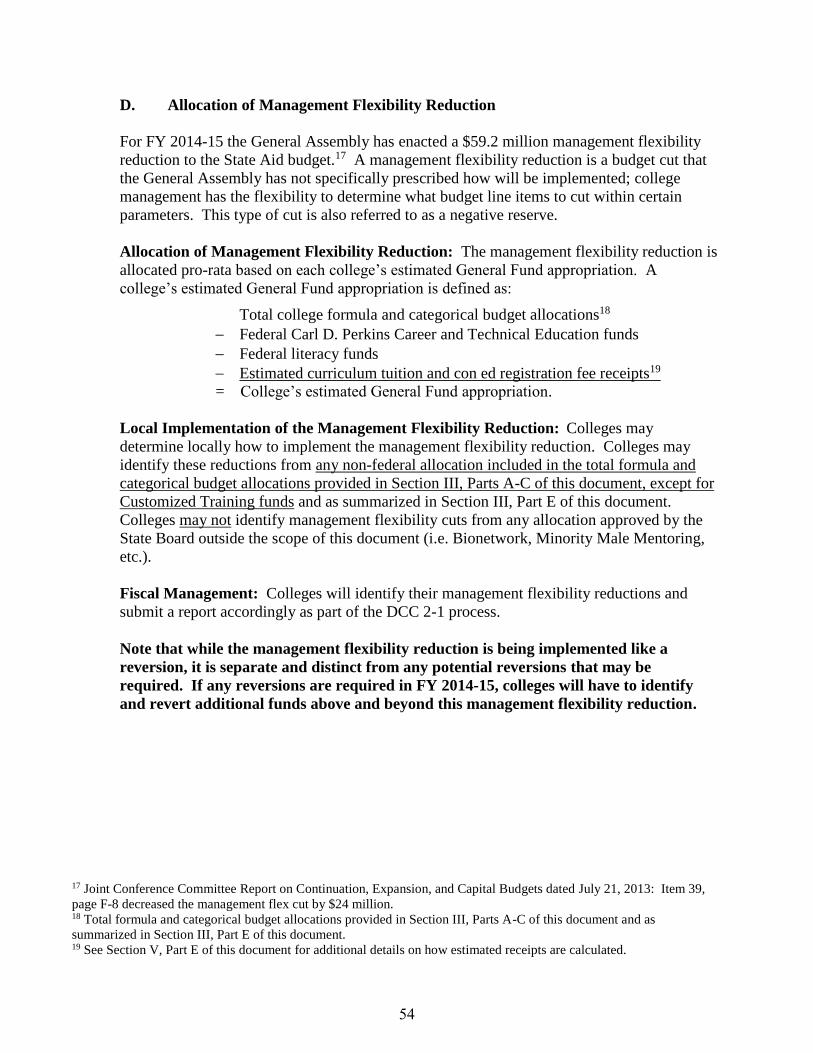
D. Allocation of Management Flexibility Reduction
For FY 2014-15 the General Assembly has enacted a $59.2 million management flexibility
reduction to the State Aid budget.17 A management flexibility reduction is a budget cut that
the General Assembly has not specifically prescribed how will be implemented; college
management has the flexibility to determine what budget line items to cut within certain
parameters. This type of cut is also referred to as a negative reserve.
Allocation of Management Flexibility Reduction: The management flexibility reduction is
allocated pro-rata based on each college’s estimated General Fund appropriation. A
college’s estimated General Fund appropriation is defined as:
Total college formula and categorical budget allocations18
Federal Carl D. Perkins Career and Technical Education funds
Federal literacy funds
Estimated curriculum tuition and con ed registration fee receipts19
= College’s estimated General Fund appropriation.
Local Implementation of the Management Flexibility Reduction: Colleges may
determine locally how to implement the management flexibility reduction. Colleges may
identify these reductions from any non-federal allocation included in the total formula and
categorical budget allocations provided in Section III, Parts A-C of this document, except for
Customized Training funds and as summarized in Section III, Part E of this document.
Colleges may not identify management flexibility cuts from any allocation approved by the
State Board outside the scope of this document (i.e. Bionetwork, Minority Male Mentoring,
etc.).
Fiscal Management: Colleges will identify their management flexibility reductions and
submit a report accordingly as part of the DCC 2-1 process.
Note that while the management flexibility reduction is being implemented like a
reversion, it is separate and distinct from any potential reversions that may be
required. If any reversions are required in FY 2014-15, colleges will have to identify
and revert additional funds above and beyond this management flexibility reduction.
17 Joint Conference Committee Report on Continuation, Expansion, and Capital Budgets dated July 21, 2013: Item 39,
page F-8 decreased the management flex cut by $24 million. 18 Total formula and categorical budget allocations provided in Section III, Parts A-C of this document and as
summarized in Section III, Part E of this document. 19 See Section V, Part E of this document for additional details on how estimated receipts are calculated.
54
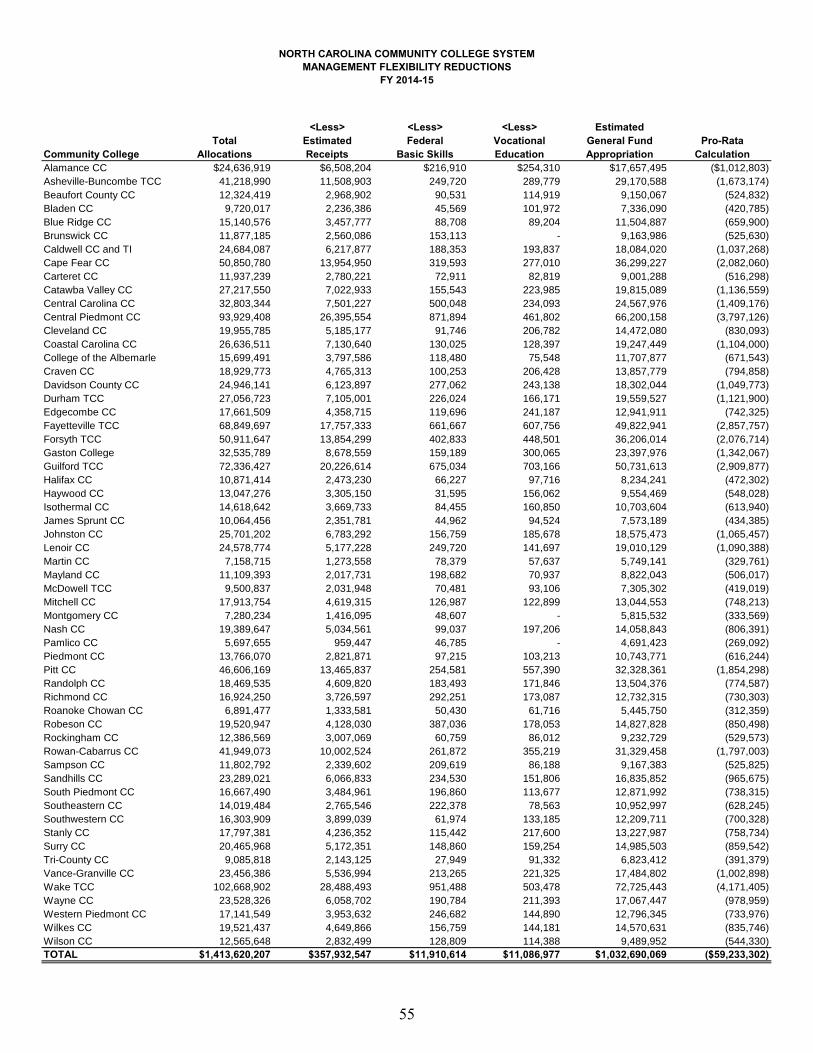
NORTH CAROLINA COMMUNITY COLLEGE SYSTEMMANAGEMENT FLEXIBILITY REDUCTIONS
FY 2014-15
<Less> <Less> <Less> EstimatedTotal Estimated Federal Vocational General Fund Pro-Rata
Community College Allocations Receipts Basic Skills Education Appropriation CalculationAlamance CC $24,636,919 $6,508,204 $216,910 $254,310 $17,657,495 ($1,012,803)
Asheville-Buncombe TCC 41,218,990 11,508,903 249,720 289,779 29,170,588 (1,673,174)
Beaufort County CC 12,324,419 2,968,902 90,531 114,919 9,150,067 (524,832)
Bladen CC 9,720,017 2,236,386 45,569 101,972 7,336,090 (420,785)
Blue Ridge CC 15,140,576 3,457,777 88,708 89,204 11,504,887 (659,900)
Brunswick CC 11,877,185 2,560,086 153,113 - 9,163,986 (525,630)
Caldwell CC and TI 24,684,087 6,217,877 188,353 193,837 18,084,020 (1,037,268)
Cape Fear CC 50,850,780 13,954,950 319,593 277,010 36,299,227 (2,082,060)
Carteret CC 11,937,239 2,780,221 72,911 82,819 9,001,288 (516,298)
Catawba Valley CC 27,217,550 7,022,933 155,543 223,985 19,815,089 (1,136,559)
Central Carolina CC 32,803,344 7,501,227 500,048 234,093 24,567,976 (1,409,176)
Central Piedmont CC 93,929,408 26,395,554 871,894 461,802 66,200,158 (3,797,126)
Cleveland CC 19,955,785 5,185,177 91,746 206,782 14,472,080 (830,093)
Coastal Carolina CC 26,636,511 7,130,640 130,025 128,397 19,247,449 (1,104,000)
College of the Albemarle 15,699,491 3,797,586 118,480 75,548 11,707,877 (671,543)
Craven CC 18,929,773 4,765,313 100,253 206,428 13,857,779 (794,858)
Davidson County CC 24,946,141 6,123,897 277,062 243,138 18,302,044 (1,049,773)
Durham TCC 27,056,723 7,105,001 226,024 166,171 19,559,527 (1,121,900)
Edgecombe CC 17,661,509 4,358,715 119,696 241,187 12,941,911 (742,325)
Fayetteville TCC 68,849,697 17,757,333 661,667 607,756 49,822,941 (2,857,757)
Forsyth TCC 50,911,647 13,854,299 402,833 448,501 36,206,014 (2,076,714)
Gaston College 32,535,789 8,678,559 159,189 300,065 23,397,976 (1,342,067)
Guilford TCC 72,336,427 20,226,614 675,034 703,166 50,731,613 (2,909,877)
Halifax CC 10,871,414 2,473,230 66,227 97,716 8,234,241 (472,302)
Haywood CC 13,047,276 3,305,150 31,595 156,062 9,554,469 (548,028)
Isothermal CC 14,618,642 3,669,733 84,455 160,850 10,703,604 (613,940)
James Sprunt CC 10,064,456 2,351,781 44,962 94,524 7,573,189 (434,385)
Johnston CC 25,701,202 6,783,292 156,759 185,678 18,575,473 (1,065,457)
Lenoir CC 24,578,774 5,177,228 249,720 141,697 19,010,129 (1,090,388)
Martin CC 7,158,715 1,273,558 78,379 57,637 5,749,141 (329,761)
Mayland CC 11,109,393 2,017,731 198,682 70,937 8,822,043 (506,017)
McDowell TCC 9,500,837 2,031,948 70,481 93,106 7,305,302 (419,019)
Mitchell CC 17,913,754 4,619,315 126,987 122,899 13,044,553 (748,213)
Montgomery CC 7,280,234 1,416,095 48,607 - 5,815,532 (333,569)
Nash CC 19,389,647 5,034,561 99,037 197,206 14,058,843 (806,391)
Pamlico CC 5,697,655 959,447 46,785 - 4,691,423 (269,092)
Piedmont CC 13,766,070 2,821,871 97,215 103,213 10,743,771 (616,244)
Pitt CC 46,606,169 13,465,837 254,581 557,390 32,328,361 (1,854,298)
Randolph CC 18,469,535 4,609,820 183,493 171,846 13,504,376 (774,587)
Richmond CC 16,924,250 3,726,597 292,251 173,087 12,732,315 (730,303)
Roanoke Chowan CC 6,891,477 1,333,581 50,430 61,716 5,445,750 (312,359)
Robeson CC 19,520,947 4,128,030 387,036 178,053 14,827,828 (850,498)
Rockingham CC 12,386,569 3,007,069 60,759 86,012 9,232,729 (529,573)
Rowan-Cabarrus CC 41,949,073 10,002,524 261,872 355,219 31,329,458 (1,797,003)
Sampson CC 11,802,792 2,339,602 209,619 86,188 9,167,383 (525,825)
Sandhills CC 23,289,021 6,066,833 234,530 151,806 16,835,852 (965,675)
South Piedmont CC 16,667,490 3,484,961 196,860 113,677 12,871,992 (738,315)
Southeastern CC 14,019,484 2,765,546 222,378 78,563 10,952,997 (628,245)
Southwestern CC 16,303,909 3,899,039 61,974 133,185 12,209,711 (700,328)
Stanly CC 17,797,381 4,236,352 115,442 217,600 13,227,987 (758,734)
Surry CC 20,465,968 5,172,351 148,860 159,254 14,985,503 (859,542)
Tri-County CC 9,085,818 2,143,125 27,949 91,332 6,823,412 (391,379)
Vance-Granville CC 23,456,386 5,536,994 213,265 221,325 17,484,802 (1,002,898)
Wake TCC 102,668,902 28,488,493 951,488 503,478 72,725,443 (4,171,405)
Wayne CC 23,528,326 6,058,702 190,784 211,393 17,067,447 (978,959)
Western Piedmont CC 17,141,549 3,953,632 246,682 144,890 12,796,345 (733,976)
Wilkes CC 19,521,437 4,649,866 156,759 144,181 14,570,631 (835,746)
Wilson CC 12,565,648 2,832,499 128,809 114,388 9,489,952 (544,330)
TOTAL $1,413,620,207 $357,932,547 $11,910,614 $11,086,977 $1,032,690,069 ($59,233,302)
55

E. Summary of College AllocationsNORTH CAROLINA COMMUNITY COLLEGE SYSTEM
BUDGET ALLOCATIONS FOR 2-1 SUMMARYFY 2014-15
CustomizedCareer & State Small Training
Total Current Technical Child Business Business andCommunity Colleges FTE Operating Education Care Center Industry Support
Alamance CC 4,160 $23,286,727 $254,310 $32,553 $106,512 $60,000
Asheville-Buncombe TCC 7,156 39,150,648 289,779 42,161 113,795 60,000
Beaufort County CC 1,912 11,541,471 114,919 25,673 103,423 47,500
Bladen CC 1,451 9,055,281 101,972 24,182 97,078 50,000
Blue Ridge CC 2,352 14,283,556 89,204 26,317 114,126 50,000
Brunswick CC 1,872 11,243,767 - 24,702 101,933 47,500
Caldwell CC & TI 4,081 23,487,581 193,837 31,732 104,692 50,000
Cape Fear CC 8,703 47,971,465 277,010 46,874 113,354 60,000
Carteret CC 1,872 11,175,502 82,819 25,120 104,802 47,500
Catawba Valley CC 4,507 24,987,167 223,985 33,266 110,871 60,000
Central Carolina CC 5,502 31,117,754 234,093 33,906 115,671 60,000
Central Piedmont CC 16,313 89,910,376 461,802 71,952 116,388 60,000
Cleveland CC 3,298 18,814,100 206,782 29,779 104,967 50,000
Coastal Carolina CC 4,597 25,428,544 128,397 33,343 114,623 47,500
College of The Albemarle 2,449 14,875,804 75,548 27,259 109,547 47,500
Craven CC 3,029 17,859,872 206,428 29,040 108,223 50,000
Davidson County CC 4,094 23,579,861 243,138 31,699 99,174 60,000
Durham TCC 4,628 25,742,396 166,171 33,506 109,271 60,000
Edgecombe CC 2,782 16,573,203 241,187 28,335 103,974 47,500
Fayetteville TCC 12,126 64,328,201 607,756 52,995 111,588 60,000
Forsyth TCC 8,855 48,087,104 448,501 46,540 113,133 60,000
Gaston College 5,259 30,265,856 300,065 36,881 110,761 60,000
Guilford TCC 12,755 69,001,529 703,166 59,348 113,961 60,000
Halifax CC 1,659 10,174,242 97,716 24,571 102,760 47,500
Haywood CC 2,037 12,160,308 156,062 26,273 108,333 47,500
Isothermal CC 2,311 13,707,264 160,850 27,026 106,181 47,500
James Sprunt CC 1,514 9,383,326 94,524 24,411 106,126 50,000
Johnston CC 4,342 24,385,664 185,678 32,855 108,830 50,000
Lenoir CC 4,287 23,319,305 141,697 28,368 106,457 50,000
Martin CC 964 6,622,613 57,637 22,284 98,126 47,500
Mayland CC 1,711 10,423,674 70,937 23,502 105,464 47,500
McDowell TCC 1,387 8,850,314 93,106 23,760 102,319 50,000
Mitchell CC 2,962 16,947,868 122,899 28,808 109,712 60,000
Montgomery CC 1,009 6,777,792 - 22,538 102,485 47,500
56

E. Summary of College AllocationsNORTH CAROLINA COMMUNITY COLLEGE SYSTEM
BUDGET ALLOCATIONS FOR 2-1 SUMMARYFY 2014-15
CustomizedCareer & State Small Training
Total Current Technical Child Business Business andCommunity Colleges FTE Operating Education Care Center Industry Support
Nash CC 3,205 18,238,112 197,206 29,521 102,209 50,000
Pamlico CC 712 5,306,147 - 21,709 98,953 -
Piedmont CC 2,099 12,968,777 103,213 24,891 98,898 47,500
Pitt CC 8,166 44,119,742 557,390 46,205 114,347 60,000
Randolph CC 3,036 17,384,837 171,846 28,815 101,436 60,000
Richmond CC 2,763 15,932,207 173,087 26,989 106,236 50,000
Roanoke-Chowan CC 926 6,359,154 61,716 22,451 103,092 47,500
Robeson CC 3,314 18,483,469 178,053 27,459 111,368 50,000
Rockingham CC 1,924 11,639,952 86,012 25,673 95,312 50,000
Rowan-Cabarrus CC 6,399 36,655,266 355,219 39,059 111,919 60,000
Sampson CC 1,842 11,078,090 86,188 24,266 105,188 47,500
Sandhills CC 3,950 22,039,623 151,806 31,666 105,795 50,000
South Piedmont CC 2,648 15,768,129 113,677 26,175 99,947 60,000
Southeastern CC 2,301 13,263,619 78,563 24,728 109,106 47,500
Southwestern CC 2,543 15,392,177 133,185 27,211 99,009 47,500
Stanly CC 2,805 16,715,457 217,600 27,906 102,595 47,500
Surry CC 3,404 19,333,837 159,254 29,717 98,701 50,000
Tri-County CC 1,315 8,442,971 91,332 24,102 100,002 47,500
Vance-Granville CC 3,764 22,225,539 221,325 30,342 103,974 60,000
Wake TCC 18,277 98,380,465 503,478 74,828 116,940 60,000
Wayne CC 3,930 22,236,826 211,393 31,542 104,967 50,000
Western Piedmont CC 2,810 16,180,674 144,890 27,448 110,209 50,000
Wilkes CC 3,121 18,468,500 144,181 28,691 102,540 50,000
Wilson CC 1,973 11,750,811 114,388 25,262 111,370 60,000TOTAL 235,163 $1,332,884,516 $11,086,977 $1,838,215 $6,172,773 $3,002,500
57

E. Summary of College AllocationsNORTH CAROLINA COMMUNITY COLLEGE SYSTEM
BUDGET ALLOCATIONS FOR 2-1 SUMMARYFY 2014-15
Community CollegesAlamance CC
Asheville-Buncombe TCC
Beaufort County CC
Bladen CC
Blue Ridge CC
Brunswick CC
Caldwell CC & TI
Cape Fear CC
Carteret CC
Catawba Valley CC
Central Carolina CC
Central Piedmont CC
Cleveland CC
Coastal Carolina CC
College of The Albemarle
Craven CC
Davidson County CC
Durham TCC
Edgecombe CC
Fayetteville TCC
Forsyth TCC
Gaston College
Guilford TCC
Halifax CC
Haywood CC
Isothermal CC
James Sprunt CC
Johnston CC
Lenoir CC
Martin CC
Mayland CC
McDowell TCC
Mitchell CC
Montgomery CC
Program ManagementInstructional Specific Total Flexibility Net
Equipment Resources Categoricals Allotments Reduction Allotment$851,780 $45,037 $24,636,919 ($1,012,803) $23,624,116
1,503,061 59,546 41,218,990 (1,673,174) 39,545,816
460,570 30,863 12,324,419 (524,832) 11,799,587
363,258 28,246 9,720,017 (420,785) 9,299,232
544,646 32,727 15,140,576 (659,900) 14,480,676
428,950 30,333 11,877,185 (525,630) 11,351,555
773,097 43,148 24,684,087 (1,037,268) 23,646,819
1,599,883 77,990 704,204 50,850,780 (2,082,060) 48,768,720
472,091 29,405 11,937,239 (516,298) 11,420,941
890,264 47,319 864,678 27,217,550 (1,136,559) 26,080,991
1,196,908 45,012 32,803,344 (1,409,176) 31,394,168
3,187,274 121,616 93,929,408 (3,797,126) 90,132,282
711,817 38,340 19,955,785 (830,093) 19,125,692
833,641 50,463 26,636,511 (1,104,000) 25,532,511
528,223 35,610 15,699,491 (671,543) 15,027,948
636,566 39,644 18,929,773 (794,858) 18,134,915
890,999 41,270 24,946,141 (1,049,773) 23,896,368
896,392 48,987 27,056,723 (1,121,900) 25,934,823
632,153 35,157 17,661,509 (742,325) 16,919,184
2,362,939 85,615 1,240,603 68,849,697 (2,857,757) 65,991,940
1,788,625 67,744 300,000 50,911,647 (2,076,714) 48,834,933
1,047,140 53,367 661,719 32,535,789 (1,342,067) 31,193,722
2,304,110 94,313 72,336,427 (2,909,877) 69,426,550
396,594 28,031 10,871,414 (472,302) 10,399,112
517,928 30,872 13,047,276 (548,028) 12,499,248
537,783 32,038 14,618,642 (613,940) 14,004,702
378,700 27,369 10,064,456 (434,385) 9,630,071
891,734 46,441 25,701,202 (1,065,457) 24,635,745
894,921 38,026 24,578,774 (1,090,388) 23,488,386
285,555 25,000 7,158,715 (329,761) 6,828,954
411,791 26,525 11,109,393 (506,017) 10,603,376
354,188 27,150 9,500,837 (419,019) 9,081,818
605,681 38,786 17,913,754 (748,213) 17,165,541
304,919 25,000 7,280,234 (333,569) 6,946,665
58

E. Summary of College AllocationsNORTH CAROLINA COMMUNITY COLLEGE SYSTEM
BUDGET ALLOCATIONS FOR 2-1 SUMMARYFY 2014-15
Community CollegesNash CC
Pamlico CC
Piedmont CC
Pitt CC
Randolph CC
Richmond CC
Roanoke-Chowan CC
Robeson CC
Rockingham CC
Rowan-Cabarrus CC
Sampson CC
Sandhills CC
South Piedmont CC
Southeastern CC
Southwestern CC
Stanly CC
Surry CC
Tri-County CC
Vance-Granville CC
Wake TCC
Wayne CC
Western Piedmont CC
Wilkes CC
Wilson CC TOTAL
Program ManagementInstructional Specific Total Flexibility Net
Equipment Resources Categoricals Allotments Reduction Allotment734,613 37,986 19,389,647 (806,391) 18,583,256
245,846 25,000 5,697,655 (269,092) 5,428,563
493,906 28,885 13,766,070 (616,244) 13,149,826
1,636,651 71,834 46,606,169 (1,854,298) 44,751,871
685,834 36,767 18,469,535 (774,587) 17,694,948
601,759 33,972 16,924,250 (730,303) 16,193,947
272,564 25,000 6,891,477 (312,359) 6,579,118
636,811 33,787 19,520,947 (850,498) 18,670,449
458,609 31,011 12,386,569 (529,573) 11,856,996
1,266,521 59,829 3,401,260 41,949,073 (1,797,003) 40,152,070
432,627 28,933 11,802,792 (525,825) 11,276,967
868,448 41,683 23,289,021 (965,675) 22,323,346
566,461 33,101 16,667,490 (738,315) 15,929,175
465,472 30,496 14,019,484 (628,245) 13,391,239
570,629 34,198 16,303,909 (700,328) 15,603,581
652,008 34,315 17,797,381 (758,734) 17,038,647
755,938 38,521 20,465,968 (859,542) 19,606,426
351,982 27,929 9,085,818 (391,379) 8,694,439
775,303 39,903 23,456,386 (1,002,898) 22,453,488
3,398,321 134,870 102,668,902 (4,171,405) 98,497,497
851,045 42,553 23,528,326 (978,959) 22,549,367
593,425 34,903 17,141,549 (733,976) 16,407,573
690,492 37,033 19,521,437 (835,746) 18,685,691
473,316 30,501 12,565,648 (544,330) 12,021,318
$48,962,762 $2,500,000 $7,172,464 $1,413,620,207 ($59,233,302) $1,354,386,905
59

IV. Use of State Funds and Budget Flexibility
A. Cash Management – FOR INFORMATION ONLY
G.S. 147-86.10. Statement of policy.
It is the policy of the State of North Carolina that all agencies, institutions, departments,
bureaus, boards, commissions, and officers of the State, whether or not subject to the State
Budget Act, Chapter 143C of the General Statutes, shall devise techniques and procedures
for the receipt, deposit, and disbursement of moneys coming into their control and custody
which are designed to maximize interest-bearing investment of cash, and to minimize idle
and nonproductive cash balances. This policy shall apply to the General Court of Justice as
defined in Article IV of the North Carolina Constitution, the public school administrative
units, and the community colleges with respect to the receipt, deposit, and disbursement of
moneys required by law to be deposited with the State Treasurer and with respect to moneys
made available to them for expenditure by warrants drawn on the State Treasurer. This
policy shall include the acceptance of electronic payments in accordance with G.S. 147-86.22
to the maximum extent possible consistent with sound business practices. (1985, c. 709, s. 1;
1999-434, s. 2; 2006-203, s. 120.)
G.S.147-86.13. Cash management for community colleges.
All community colleges and their officers and employees are subject to the provisions of G.S.
147-86.11 with respect to moneys required by law to be deposited with the State Treasurer
and with respect to moneys made available to them for expenditure by warrants drawn on the
State Treasurer. (1985, c. 709, s. 1; 1987, c. 564, s. 9.)
B. Use of State Funds – FOR INFORMATION ONLY
Per G.S. 143C-6-1, all appropriations of State funds “authorize expenditures only for the (i)
purposes or programs and (ii) objects or line items enumerated in the Recommended State
Budget and the Budget Support Document recommended to the General Assembly by the
Governor, as amended and enacted by the General Assembly in the Current Operations
Appropriations Act, the Capital Improvements Appropriations Act, or any other act affecting
the State budget.”
While G.S. 143C-6-1 only allows colleges to use State funds for legislatively-authorized
purposes, G.S. 115D-31(b1) provides colleges some local flexibility to determine how much
of money within each college’s budget will be expended on those purposes. Per G.S. 115D-
31(b1), community colleges may use “State funds allocated to it, except for Literacy (Basic
Skills) and Customized Training funds, for any authorized purpose that is consistent with
the college’s Institutional Effectiveness Plan. Each local community college shall include in
its Institutional Effectiveness Plan a section on how funding flexibility allows the college to
meet the demands of the local community and to maintain a presence in all previously funded
categorical programs.” Colleges must exercise this flexibility consistent with other
provisions of law and State Board policy, including but not limited to S.L. 2013-360, as
60
amended by S.L. 2013-363 and S.L. 2014-100, the State Board of Community Colleges
Code, and the Accounting Procedures Manual.
Except for Basic Skills Block Grant and Customized Training funds, colleges have the
authority to use funds flexibly. There is not any limitation on the amount of money that may
be transferred among purposes or between salaries/benefits and other costs. Likewise,
colleges may transfer current operating funds to equipment and vice versa.
C. Authority to Use Funds for Campus Security
G.S. 115D-32(a).(2).a.1 places the financial responsibility for “watchmen” within the current
expense portion of the tax-levying authority of each institution. In effect, this statute places
the fiscal responsibility for campus security personnel upon the county commissioners.
Section 8.17.(a) of S.L. 2009-451, however, authorizes the State Board to revise the college
funding formulas to ensure that adequate funds are available for campus security. These
funds shall be used to supplement and shall not be used to supplant existing local funding for
campus security.
Under this authority, the State Board authorizes each college to use up to two percent (2%) of
the State funds allocated to it through the enrollment allotment of the Institutional Support
formula for FY 2014-15 for campus security. The Institutional Support allotment is the
portion of the State Aid allocation formula that provides funding for management, financial
services, general administration, information systems, and student support services. These
are all non-instructional funds. Using this authority, colleges may:
1. Hire security personnel;
2. Contract for professional security services;
3. Purchase surveillance cameras, call boxes, alert systems, and other equipment-
related expenditures, excluding vehicles.
A college may both purchase the equipment and have it installed with these funds. These
activities are not to be considered “capital improvement projects”, but rather the purchase
and installation of equipment. The maximum amount of expenditure for these purposes is on
the following page.
Fiscal Management: Funds within non-instructional purpose codes (1XX, 410, 421, 422,
430, and 510) may be used for allowable uses described above. For capitalized equipment
expenditures, funds must be transferred from one of these non-instructional purpose codes
to Purpose Code 920.
Funds expended on campus security under this authority shall be tracked in the following
vocational code:
Vocational code: 92
61

NORTH CAROLINA COMMUNITY COLLEGE SYSTEMCAMPUS SECURITY MAXIMUM
FY 2014-15
Enrollment Allotment Campus SecurityCommunity College 2014-15 2.0%Alamance CC $5,793,590 $115,872
Asheville-Buncombe TCC 10,883,794 217,676
Beaufort County CC 1,974,238 39,485
Bladen CC 1,190,999 23,820
Blue Ridge CC 2,721,798 54,436
Brunswick CC 1,906,278 38,126
Caldwell CC & TI 5,659,369 113,187
Cape Fear CC 13,512,147 270,243
Carteret CC 1,906,278 38,126
Catawba Valley CC 6,383,143 127,663
Central Carolina CC 8,073,648 161,473
Central Piedmont CC 26,441,537 528,831
Cleveland CC 4,329,052 86,581
Coastal Carolina CC 6,536,053 130,721
College of The Albemarle 2,886,601 57,732
Craven CC 3,872,021 77,440
Davidson County CC 5,681,456 113,629
Durham TCC 6,588,722 131,774
Edgecombe CC 3,452,368 69,047
Fayetteville TCC 19,327,824 386,556
Forsyth TCC 13,770,395 275,408
Gaston College 7,660,791 153,216
Guilford TCC 20,396,495 407,930
Halifax CC 1,544,391 30,888
Haywood CC 2,186,613 43,732
Isothermal CC 2,652,139 53,043
James Sprunt CC 1,298,036 25,961
Johnston CC 6,102,808 122,056
Lenoir CC 6,009,363 120,187
Martin CC 363,586 7,272
Mayland CC 1,632,739 32,655
McDowell TCC 1,082,263 21,645
Mitchell CC 3,758,188 75,164
Montgomery CC 440,041 8,801
Nash CC 4,171,045 83,421
Pamlico CC - -
Piedmont CC 2,291,951 45,839
Pitt CC 12,599,784 251,996
Randolph CC 3,883,914 77,678
Richmond CC 3,420,087 68,402
Roanoke-Chowan CC 299,024 5,980
Robeson CC 4,356,236 87,125
Rockingham CC 1,994,626 39,893
Rowan-Cabarrus CC 9,597,651 191,953
Sampson CC 1,855,308 37,106
Sandhills CC 5,436,800 108,736
South Piedmont CC 3,224,702 64,494
Southeastern CC 2,635,149 52,703
Southwestern CC 3,046,307 60,926
Stanly CC 3,491,445 69,829
Surry CC 4,509,146 90,183
Tri-County CC 959,935 19,199
Vance-Granville CC 5,120,786 102,416
Wake TCC 29,778,373 595,567
Wayne CC 5,402,820 108,056
Western Piedmont CC 3,499,940 69,999
Wilkes CC 4,028,329 80,567
Wilson CC 2,077,877 41,558
TOTAL $325,699,999 $6,514,002
62
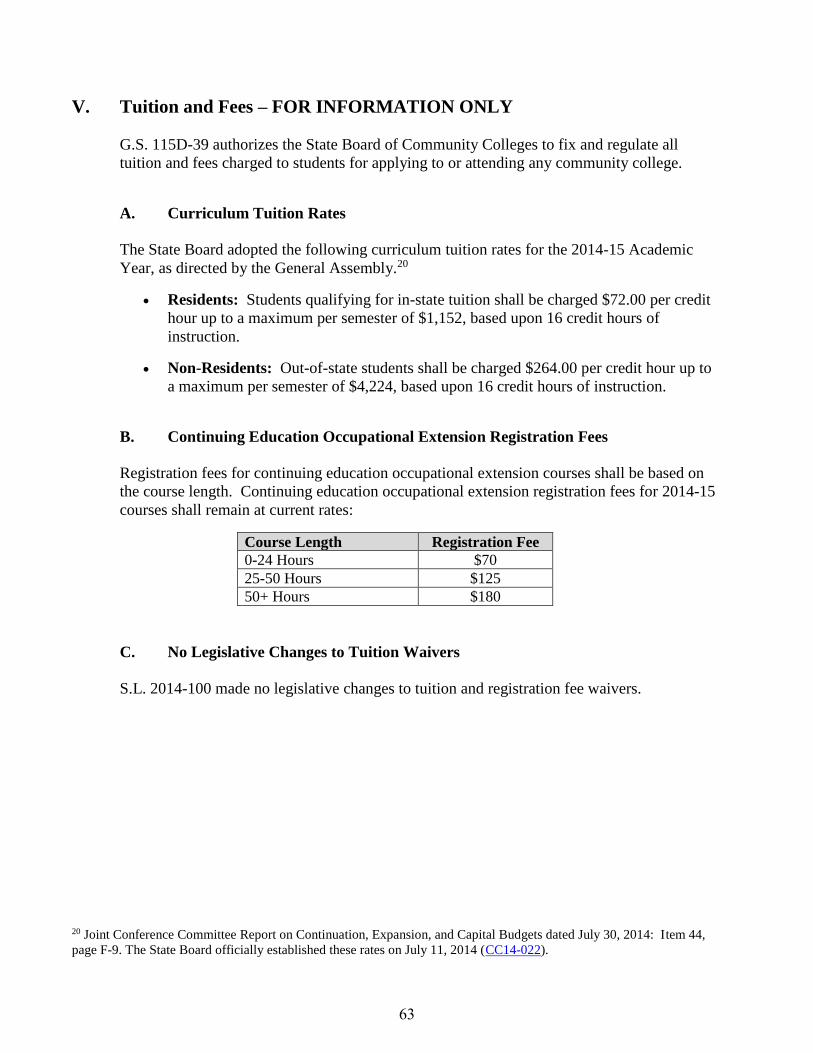
V. Tuition and Fees – FOR INFORMATION ONLY
G.S. 115D-39 authorizes the State Board of Community Colleges to fix and regulate all
tuition and fees charged to students for applying to or attending any community college.
A. Curriculum Tuition Rates
The State Board adopted the following curriculum tuition rates for the 2014-15 Academic
Year, as directed by the General Assembly.20
Residents: Students qualifying for in-state tuition shall be charged $72.00 per credit
hour up to a maximum per semester of $1,152, based upon 16 credit hours of
instruction.
Non-Residents: Out-of-state students shall be charged $264.00 per credit hour up to
a maximum per semester of $4,224, based upon 16 credit hours of instruction.
B. Continuing Education Occupational Extension Registration Fees
Registration fees for continuing education occupational extension courses shall be based on
the course length. Continuing education occupational extension registration fees for 2014-15
courses shall remain at current rates:
Course Length Registration Fee
0-24 Hours $70
25-50 Hours $125
50+ Hours $180
C. No Legislative Changes to Tuition Waivers
S.L. 2014-100 made no legislative changes to tuition and registration fee waivers.
20 Joint Conference Committee Report on Continuation, Expansion, and Capital Budgets dated July 30, 2014: Item 44,
page F-9. The State Board officially established these rates on July 11, 2014 (CC14-022).
63
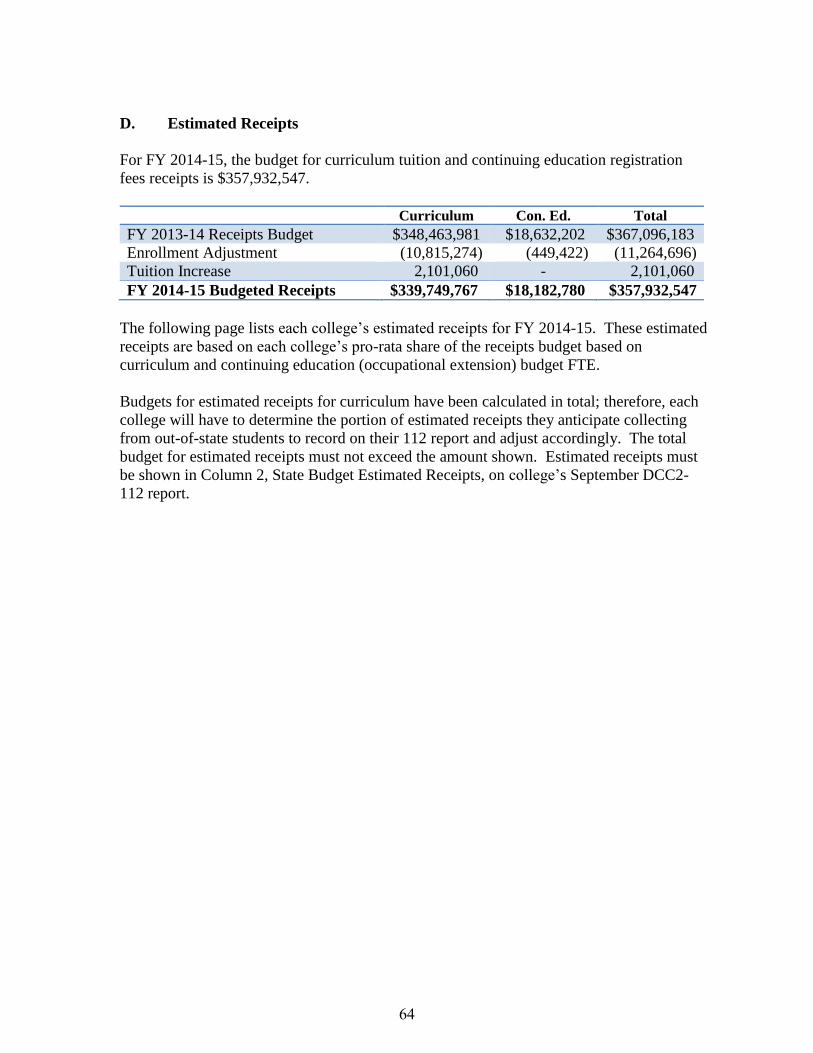
D. Estimated Receipts
For FY 2014-15, the budget for curriculum tuition and continuing education registration
fees receipts is $357,932,547.
Curriculum Con. Ed. Total
FY 2013-14 Receipts Budget $348,463,981 $18,632,202 $367,096,183
Enrollment Adjustment (10,815,274) (449,422) (11,264,696)
Tuition Increase 2,101,060 - 2,101,060
FY 2014-15 Budgeted Receipts $339,749,767 $18,182,780 $357,932,547
The following page lists each college’s estimated receipts for FY 2014-15. These estimated
receipts are based on each college’s pro-rata share of the receipts budget based on
curriculum and continuing education (occupational extension) budget FTE.
Budgets for estimated receipts for curriculum have been calculated in total; therefore, each
college will have to determine the portion of estimated receipts they anticipate collecting
from out-of-state students to record on their 112 report and adjust accordingly. The total
budget for estimated receipts must not exceed the amount shown. Estimated receipts must
be shown in Column 2, State Budget Estimated Receipts, on college’s September DCC2-
112 report.
64
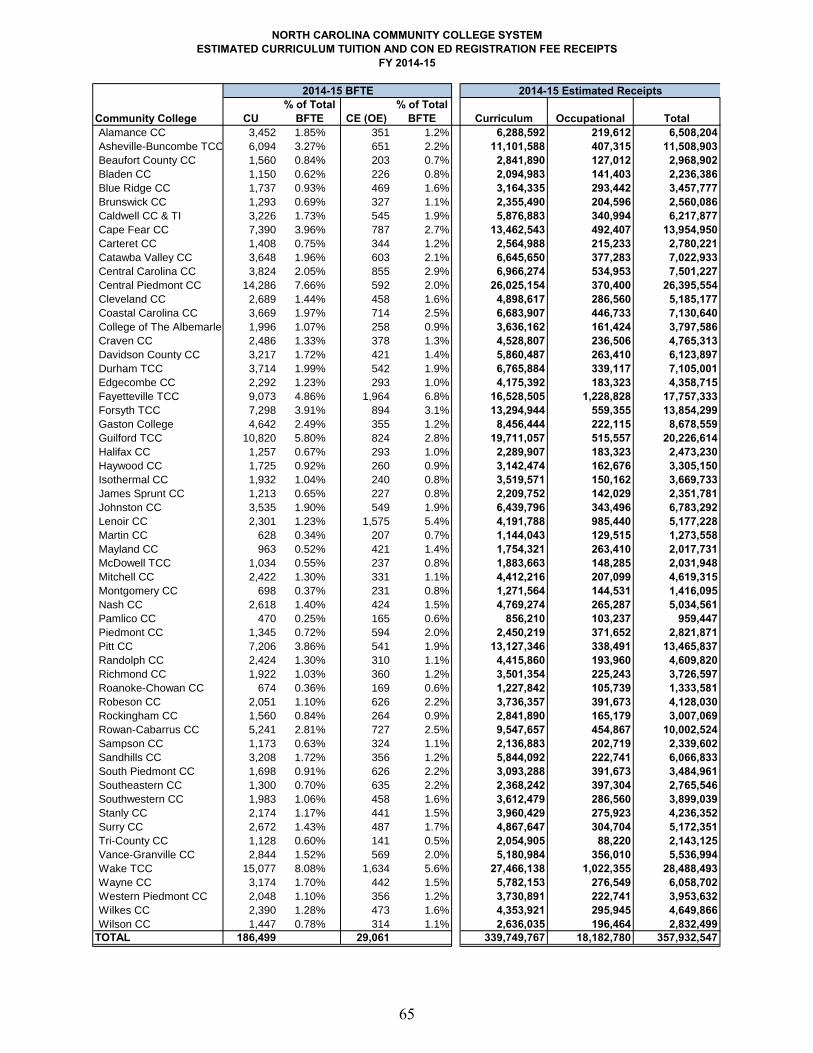
NORTH CAROLINA COMMUNITY COLLEGE SYSTEMESTIMATED CURRICULUM TUITION AND CON ED REGISTRATION FEE RECEIPTS
FY 2014-15
Community College CU% of Total
BFTE CE (OE)% of Total
BFTE Curriculum Occupational TotalAlamance CC 3,452 1.85% 351 1.2% 6,288,592 219,612 6,508,204Asheville-Buncombe TCC 6,094 3.27% 651 2.2% 11,101,588 407,315 11,508,903Beaufort County CC 1,560 0.84% 203 0.7% 2,841,890 127,012 2,968,902Bladen CC 1,150 0.62% 226 0.8% 2,094,983 141,403 2,236,386Blue Ridge CC 1,737 0.93% 469 1.6% 3,164,335 293,442 3,457,777Brunswick CC 1,293 0.69% 327 1.1% 2,355,490 204,596 2,560,086Caldwell CC & TI 3,226 1.73% 545 1.9% 5,876,883 340,994 6,217,877Cape Fear CC 7,390 3.96% 787 2.7% 13,462,543 492,407 13,954,950Carteret CC 1,408 0.75% 344 1.2% 2,564,988 215,233 2,780,221Catawba Valley CC 3,648 1.96% 603 2.1% 6,645,650 377,283 7,022,933Central Carolina CC 3,824 2.05% 855 2.9% 6,966,274 534,953 7,501,227Central Piedmont CC 14,286 7.66% 592 2.0% 26,025,154 370,400 26,395,554Cleveland CC 2,689 1.44% 458 1.6% 4,898,617 286,560 5,185,177Coastal Carolina CC 3,669 1.97% 714 2.5% 6,683,907 446,733 7,130,640College of The Albemarle 1,996 1.07% 258 0.9% 3,636,162 161,424 3,797,586Craven CC 2,486 1.33% 378 1.3% 4,528,807 236,506 4,765,313Davidson County CC 3,217 1.72% 421 1.4% 5,860,487 263,410 6,123,897Durham TCC 3,714 1.99% 542 1.9% 6,765,884 339,117 7,105,001Edgecombe CC 2,292 1.23% 293 1.0% 4,175,392 183,323 4,358,715Fayetteville TCC 9,073 4.86% 1,964 6.8% 16,528,505 1,228,828 17,757,333Forsyth TCC 7,298 3.91% 894 3.1% 13,294,944 559,355 13,854,299Gaston College 4,642 2.49% 355 1.2% 8,456,444 222,115 8,678,559Guilford TCC 10,820 5.80% 824 2.8% 19,711,057 515,557 20,226,614Halifax CC 1,257 0.67% 293 1.0% 2,289,907 183,323 2,473,230Haywood CC 1,725 0.92% 260 0.9% 3,142,474 162,676 3,305,150Isothermal CC 1,932 1.04% 240 0.8% 3,519,571 150,162 3,669,733James Sprunt CC 1,213 0.65% 227 0.8% 2,209,752 142,029 2,351,781Johnston CC 3,535 1.90% 549 1.9% 6,439,796 343,496 6,783,292Lenoir CC 2,301 1.23% 1,575 5.4% 4,191,788 985,440 5,177,228Martin CC 628 0.34% 207 0.7% 1,144,043 129,515 1,273,558Mayland CC 963 0.52% 421 1.4% 1,754,321 263,410 2,017,731McDowell TCC 1,034 0.55% 237 0.8% 1,883,663 148,285 2,031,948Mitchell CC 2,422 1.30% 331 1.1% 4,412,216 207,099 4,619,315Montgomery CC 698 0.37% 231 0.8% 1,271,564 144,531 1,416,095Nash CC 2,618 1.40% 424 1.5% 4,769,274 265,287 5,034,561Pamlico CC 470 0.25% 165 0.6% 856,210 103,237 959,447Piedmont CC 1,345 0.72% 594 2.0% 2,450,219 371,652 2,821,871Pitt CC 7,206 3.86% 541 1.9% 13,127,346 338,491 13,465,837Randolph CC 2,424 1.30% 310 1.1% 4,415,860 193,960 4,609,820Richmond CC 1,922 1.03% 360 1.2% 3,501,354 225,243 3,726,597Roanoke-Chowan CC 674 0.36% 169 0.6% 1,227,842 105,739 1,333,581Robeson CC 2,051 1.10% 626 2.2% 3,736,357 391,673 4,128,030Rockingham CC 1,560 0.84% 264 0.9% 2,841,890 165,179 3,007,069Rowan-Cabarrus CC 5,241 2.81% 727 2.5% 9,547,657 454,867 10,002,524Sampson CC 1,173 0.63% 324 1.1% 2,136,883 202,719 2,339,602Sandhills CC 3,208 1.72% 356 1.2% 5,844,092 222,741 6,066,833South Piedmont CC 1,698 0.91% 626 2.2% 3,093,288 391,673 3,484,961Southeastern CC 1,300 0.70% 635 2.2% 2,368,242 397,304 2,765,546Southwestern CC 1,983 1.06% 458 1.6% 3,612,479 286,560 3,899,039Stanly CC 2,174 1.17% 441 1.5% 3,960,429 275,923 4,236,352Surry CC 2,672 1.43% 487 1.7% 4,867,647 304,704 5,172,351Tri-County CC 1,128 0.60% 141 0.5% 2,054,905 88,220 2,143,125Vance-Granville CC 2,844 1.52% 569 2.0% 5,180,984 356,010 5,536,994Wake TCC 15,077 8.08% 1,634 5.6% 27,466,138 1,022,355 28,488,493Wayne CC 3,174 1.70% 442 1.5% 5,782,153 276,549 6,058,702Western Piedmont CC 2,048 1.10% 356 1.2% 3,730,891 222,741 3,953,632Wilkes CC 2,390 1.28% 473 1.6% 4,353,921 295,945 4,649,866Wilson CC 1,447 0.78% 314 1.1% 2,636,035 196,464 2,832,499
TOTAL 186,499 29,061 339,749,767 18,182,780 357,932,547
2014-15 BFTE 2014-15 Estimated Receipts
65
VI. Other Budget Policy Issues and Reports – FOR INFORMATION ONLY
S.L. 2014-100 includes the following special provisions that are relevant to community colleges (see
Appendix A for full text of each provision):
Section 8.27 Participation in Investing in Innovation Grant: Revises the list of
community colleges that can participate in the NC IRIS (Investing in Rural Innovative
Schools) grant program administered by NC New Schools by removing Wilkes Community
College and adding Bladen Community College and Martin Community College.
Section 8.36 Clarify Regional School CIHS Application: Provides that Regional Schools
are not subject to the 100 students per grade level cap and the location waiver requirement.
Also designates the Northeast Regional School of Biotechnology and Agriscience as a CIHS
for 2014-15 and requires the School to apply with a local board of trustees to maintain CIHS
status.
Section 10.2 Periodic Revision of Enrollment Tiers: Directs the State Board to develop a
process for periodically reviewing and revising tier designations. The process shall be
developed by March 1, 2015.
Section 10.3 Manufacturing Solutions Center and Textile Technology Center Fees:
Directs the State Board to report to the Joint Legislative Education Oversight Committee
(“Ed Oversight”), the Fiscal Research Division (“FRD”), and the Office of State Budget and
Management (“OSBM”) on the structure of the fees assessed and the total fees collected by
these two entities for FY 2012-13 and FY 2013-14.
Section 10.4 JLEOC Study on Vocational Training for Individuals with Intellectual
Disabilities: Ed Oversight would study a number of issues related to training and developing
vocational expertise and job readiness in students with intellectual disabilities.
Section 10.5 Offset Apprenticeship Fees: Directs the State Board to transfer $300,000 of
Customized Training funds in 2014-15 to offset revenue lost when apprenticeship fees are
waived.
Section 10.7 Community Colleges and UNC Study Bilateral Agreements Regarding
Transfer Process: A joint study that would provide data on all bilateral agreements and
partnerships, including number of participants and an analysis of student outcomes.
Section 10.9 GTCC Property Lease: Amends S.L. 2011-153 to change the entity to whom
GTCC can lease certain property at less than fair market value from the NC Center for
Global Logistics to the GTCC Innovative Resources Corporation.
Section 11.8 Financial Aid Payment Schedule: Requires the State Education Assistance
Authority (SEAA) in consultation with the Community College System and others to study
ways to encourage completion of 30 academic hours per year and to implement the revised
financial aid payment schedule for the 2016-17 academic year.
66
Section 11.11 CFNC Sustainability: No later than Dec. 1, 2014, the State Education
Assistance Authority shall report on its progress towards funding operations with non-
General Fund sources.
Section 11.12 Yellow Ribbon G.I. Education Enhancement Program: Funds financial aid
for eligible veterans and dependents attending NC community colleges. Program provides a
direct match of school funds to offset the gap for veterans between non-resident tuition rates
and the Post-9/11 G.I. Bill, which pays only up to resident tuition rate. Funds are intended to
be awarded for 2015-16 academic year, but may be awarded and disbursed in spring 2015.
Section 11.14 Health Care Education/Public-Private Partnership: Directs the UNC-BOG
to use $2,000,000 to support the Union Square Campus, Inc. that will build a facility to house
nursing programs, including the nursing program at GTCC.
Section 11.15 Study University Tuition: Directs Education Oversight to study a number of
issues related to UNC tuition and fees as well as the desirability of encouraging students to
enroll first in a community college and then complete degree requirements at a UNC
institution.
67

(page left blank intentionally)
68
Appendix A: Relevant Excerpts from S.L. 2014-100
Excerpts from S.L. 2014-100
Section 8.27: Participation in Investing in Innovation Grants
Section 8.36.(a): Clarify Regional School CIHS Applications
Section 10.2: Process for Periodically Revising Enrollment Tiers
Section 10.3: Revenues/Expenditures/Fees Collected and Assessed by the Manufacturing
Solutions Center and the Textile Technology Center
Section 10.4: JLEOC Study on Vocational Training for Individuals with Intellectual
Disabilities
Section 10.5: Extend Authority to Reorganize the Community Colleges System Office
Section 10.6: Permit the Board of Community Colleges to Transfer Certain Funds to
Department of Commerce to Offset Apprenticeship Fees
Section 10.7: Community Colleges and UNC Study Bilateral Agreements Regarding
Transfer Process
Section 10.9: Guilford Technical Community College Property Lease
Section 11.8: Study Financial Aid Payment Schedule to Incentivize Thirty Completed Hours
Per Year and Implement Revised Payment Schedule
Section 11.11: Report on College Foundation of North Carolina Sustainability
Section 11.12: Tuition Assistance to Veterans Who Participate in the Yellow Ribbon
Program and Their Spouses and Dependent Relatives
Section 11.14: Health Care Education/Public Private Partnership
Section 11.15: Study University Tuition
Section 35.5: Community Colleges Personnel
Section 35.7: Salary Adjustment Requirements/Limit on Cumulative Increases
Section 35.8: Use of Funds Appropriated for Legislatively Mandated Salary Increases
Section 35.9: All State-Supported Personnel/Salary Increases
Section 35.10: Most State Employees
Section 35.10A: Special Annual Leave Bonus
Section 35.13: Salary-Related Contributions
Section 35.16: Alternative Health Benefit Coverage for Nonpermanent Full-Time State
Employees
Section 35.16A: Clarify that Re-hired State Retirees Shall be Offered Coverage in State
Health Plan as Active Employees Rather than as Retirees
69

PARTICIPATION IN INVESTING IN INNOVATION GRANTS
SECTION 8.27. Section 8.25(b) of S.L. 2013-360 reads as rewritten:
"SECTION 8.25.(b) The federal Investing in Innovation Fund Grant: Validating Early
College Strategies for Traditional Comprehensive High Schools awarded to the North Carolina New
Schools Project for 2012-2017 requires students to enroll in a community college course in the 10th
grade. Notwithstanding any other provision of law, specified local school administrative units may
offer one community college course to participating sophomore (10th grade) students. Participating
local school administrative units are Alleghany, Beaufort, Bladen, Hertford, Jones, Madison, Martin,
Richmond, Rutherford, Surry, Warren, Wilkes, and Yancey County Schools."
CLARIFY REGIONAL SCHOOL CIHS APPLICATIONS
SECTION 8.36.(a) G.S. 115C-238.50A(1a) reads as rewritten:
"(1a) Cooperative innovative high school. – A high school approved by the State Board of
Education and the applicable governing Board that meets the following criteria:
a. It has no more than 100 students per grade level. This criterion shall not apply to a regional
school as defined in G.S. 115C-238.61.
b. It partners with an institution of higher education to enable students to concurrently obtain
a high school diploma and begin or complete an associate degree program, master a
certificate or vocational program, or earn up to two years of college credit within five years.
c. It is located on the campus of the partner institution of higher education, unless the
governing Board or the local board of trustees for a private North Carolina college
specifically waives the requirement through adoption of a formal resolution. This criterion
shall not apply to a regional school established as provided in Part 10 of this Article."
SECTION 8.36.(b) Notwithstanding the requirements of Part 9 of Article 16 of Chapter
115C of the General Statutes, for the 2014-2015 school year, the Northeast Regional School of
Biotechnology and Agriscience shall be designated as a cooperative innovative high school. To
maintain the designation as a cooperative innovative high school beyond the 2014-2015 school year,
the board of directors of the Northeast Regional School of Biotechnology and Agriscience shall
apply with a local board of trustees for approval as a cooperative innovative high school program as
provided under Part 9 of Article 16 of Chapter 115C of the General Statutes.
PART X. COMMUNITY COLLEGES
PROCESS FOR PERIODICALLY REVISING ENROLLMENT TIERS
SECTION 10.2. The State Board of Community Colleges shall develop a process for
periodically reviewing and revising how courses and programs are classified into tiers in the
enrollment funding model. The process shall be developed by March 1, 2015, and reported to the
Office of State Budget and Management and the Fiscal Research Division of the North Carolina
General Assembly.
The State Board of Community Colleges shall identify those courses and programs in
high-need areas and may suggest any revisions to the model. These revisions shall be submitted as
part of their budget requests for the 2017-2019 fiscal biennium.
70
REVENUES/EXPENDITURES/FEES COLLECTED AND ASSESSED BY THE
MANUFACTURING SOLUTIONS CENTER AND THE TEXTILE TECHNOLOGY
CENTER
SECTION 10.3. The State Board of Community Colleges shall report, no later than January
15, 2015, to the Joint Legislative Education Oversight Committee, the Fiscal Research Division, and
the Office of State Budget and Management a summary of the revenues and expenditures for the
Manufacturing Solutions Center at Catawba Valley Community College and for the Textile
Technology Center at Gaston College during the 2012-2013 and 2013-2014 fiscal years. The report
shall include information on the structure of the fees assessed and the total fees collected by each
Center.
JLEOC STUDY ON VOCATIONAL TRAINING FOR INDIVIDUALS WITH
INTELLECTUAL DISABILITIES
SECTION 10.4.(a) The Joint Legislative Education Oversight Committee shall study at least
the following issues related to vocational training for individuals with intellectual disabilities:
(1) Model programs for implementation on a systemwide basis at community college
campuses and constituent institutions of The University of North Carolina for training and
developing vocational expertise and job readiness in students with intellectual disabilities.
(2) Enhancing employment outcomes for individuals with intellectual disabilities.
(3) Barriers to employment for individuals with intellectual disabilities.
(4) Establishment and expansion of partnerships between community colleges, constituent
institutions of The University of North Carolina, the Department of Health and Human
Services, Division of Vocational Rehabilitative Services, and community-based
organizations that offer job training and job placement opportunities for individuals with
intellectual disabilities.
(5) Policies for ensuring that students with intellectual disabilities are prepared for higher
educational opportunities upon completion of their elementary and secondary school
education.
(6) Policies for transition planning and job training for students with intellectual disabilities
as they complete their elementary and secondary school education.
SECTION 10.4.(b) The Joint Legislative Education Oversight Committee shall report the
results of the study required by subsection (a) of this section to the General Assembly prior to the
convening of the 2015 General Assembly.
EXTEND AUTHORITY TO REORGANIZE THE COMMUNITY COLLEGES SYSTEM
OFFICE
SECTION 10.5. Section 10.1(b) of S.L. 2013-360 reads as rewritten:
"SECTION 10.1.(b) This section expires June 30, 2014.June 30, 2015."
PERMIT THE BOARD OF COMMUNITY COLLEGES TO TRANSFER CERTAIN FUNDS
TO DEPARTMENT OF COMMERCE TO OFFSET APPRENTICESHIP FEES
SECTION 10.6.(a) Notwithstanding any other provision of law, of the funds appropriated by
this act for the Customized Industry Training Program for the 2014-2015 fiscal year, the State Board
71
of Community Colleges shall transfer three hundred thousand dollars ($300,000) to the Department
of Commerce to offset fee revenue lost when apprenticeship fees assessed pursuant to G.S. 94-12 are
waived.
SECTION 10.6.(b) This section shall expire June 30, 2015.
COMMUNITY COLLEGES AND UNC STUDY BILATERAL AGREEMENTS
REGARDING TRANSFER PROCESS
SECTION 10.7.(a) The Board of Governors of The University of North Carolina and the
State Board of Community Colleges shall jointly study the various bilateral agreements and
partnerships that exist between constituent institutions of The University of North Carolina and the
community colleges throughout the State. The study shall specifically focus on those agreements and
partnerships that aid in the transfer process and those agreements and partnerships that encourage or
require students to complete some coursework at a community college before attending or
transferring to a constituent institution. The study shall also provide data on the agreements and
partnerships, to the extent this information is available, on all of the following:
(1) A description of the agreement or partnership;
(2) The number of years it has been in existence;
(3) The number of participants by year; and
(4) An analysis of student outcomes after a transfer under the agreement or partnership.
SECTION 10.7.(b) The findings of the study shall be reported to the Joint Legislative
Education Oversight Committee and the Senate Appropriations Committee on Education/Higher
Education and the House Appropriations Subcommittee on Education by February 1, 2015. The final
report shall also include recommendations on replication and expansion possibilities for the various
agreements and partnerships.
GUILFORD TECHNICAL COMMUNITY COLLEGE PROPERTY LEASE
SECTION 10.9.(a) Section 1 of S.L. 2011-153 reads as rewritten:
"SECTION 1. Notwithstanding G.S. 115D-15, Article 12 of Chapter 160A of the General Statutes,
Chapter 66 of the General Statutes, or any other provision of law, the board of trustees of Guilford
Technical Community College may lease at private sale to The North Carolina Center for Global
Logistics, LLC, GTCC Innovative Resources Corporation or its successor in interest a portion of its
land and improvements now or hereafter located on the Donald W. Cameron Campus of Guilford
Technical Community College. The terms and conditions of the lease shall be set by the board of
trustees of Guilford Technical Community College and may include rental at less than fair market
value. The lease shall not be subject to the prior approval of the State Board of Community
Colleges."
SECTION 10.9.(b) Section 3 of S.L. 2011-153 reads as rewritten:
"SECTION 3. Notwithstanding G.S. 66-58(a), the personnel and facilities of Guilford Technical
Community College may, with the consent of the trustees of the college, be used (i) in support of
economic development through the operation of the Donald W. Cameron Campus of Guilford
Technical Community College and its companion facilities as an event venue. venue, (ii) by, for, or
in connection with GTCC Innovative Resources Corporation, an affiliated nonprofit corporation that
is a supporting organization of the college, or its successor in interest, or (iii) for both purposes.
72

Proceeds generated shall be used either to pay the operational costs of the college's facilities, to
support the event venue, or to support the mission of the college."
STUDY FINANCIAL AID PAYMENT SCHEDULE TO INCENTIVIZE THIRTY
COMPLETED HOURS PER YEAR AND IMPLEMENT REVISED PAYMENT SCHEDULE
SECTION 11.8. Section 11.15(h) of S.L. 2013-360 reads as rewritten:
"SECTION 11.15.(h) The State Education Assistance Authority shall structure its payment schedule
Authority, in consultation with The University of North Carolina, the North Carolina Community
College System, and the North Carolina Independent Colleges and Universities, shall study ways to
structure its financial aid payment schedules to encourage students to complete an average of 30
credit hours per academic year. The State Education Assistance Authority shall make an interim
report to the Joint Legislative Education Oversight Committee by March 1, 2014, regarding the
measures implemented by the Authority pursuant to this subsection. March 1, 2015, on its progress
or lack thereof in developing such schedules and shall make a final report to the Joint Legislative
Education Oversight Committee by October 1, 2015, about the financial aid payment schedules it
proposes to implement.
After submitting its final report to the Joint Legislative Education Oversight Committee, the State
Education Assistance Authority shall structure its payment schedules to encourage students to
complete an average of 30 credit hours per academic year. The revised payment schedules shall be in
place for financial aid awards made for the 2016-2017 academic year and all subsequent academic
years."
REPORT ON COLLEGE FOUNDATION OF NORTH CAROLINA SUSTAINABILITY
SECTION 11.11. No later than December 1, 2014, the State Education Assistance Authority
shall report to the Office of State Budget and Management and the Fiscal Research Division of the
General Assembly on its progress toward funding operations of the College Foundation of North
Carolina entirely from non-General Fund sources. This report shall include all of the following:
(1) The status of fundraising efforts to date.
(2) A detailed plan and time line for generating additional revenues.
(3) Estimated expenditures and revenues by type for the next four fiscal years.
(4) Potential reduction measures and alternative funding options should General Fund
appropriations not be provided in the next biennium.
TUITION ASSISTANCE TO VETERANS WHO PARTICIPATE IN THE YELLOW
RIBBON PROGRAM AND THEIR SPOUSES AND DEPENDENT RELATIVES
SECTION 11.12.(a) Article 14 of Chapter 116 of the General Statutes is amended by adding
a new section to read:
"§ 116-143.8. Tuition assistance for certain veterans and their dependents.
(a) The following definitions apply in this section:
(1) Institution of higher education. – Has the same meaning as in G.S.
116-143.1(a)(1).
(2) Yellow Ribbon Program. – Yellow Ribbon G.I. Education Enhancement Program,
38 U.S.C. § 3317.
73

(b) Either the Board of Governors of The University of North Carolina or one or more
constituent institutions shall annually enter into an agreement with the United States
Secretary of Veterans Affairs to participate in the Yellow Ribbon Program. The State Board
of Community Colleges or one or more community colleges shall annually enter into an
agreement with the United States Secretary of Veterans Affairs to participate in the Yellow
Ribbon Program. The agreements shall include all of the following terms:
(1) A grant of ninety percent (90%) of the cost of tuition and mandatory fees not
otherwise covered shall be provided for every eligible veteran or eligible spouse or
dependent relative of a veteran who is enrolled or will be enrolled as an
undergraduate student at a constituent institution or as a student at a community
college.
(2) To be eligible for grants under the Yellow Ribbon Program, a student must meet
all program requirements established by the federal government. In addition, to be
eligible for a Yellow Ribbon grant in which the school share of the grant is paid with
State appropriation, a student must be enrolled as an undergraduate student at a
constituent institution or as a student at a North Carolina community college.
(c) This section is not intended to prohibit constituent institutions from using private funds to
provide Yellow Ribbon grants for students enrolled in master's or doctoral level programs.
(d) The General Assembly encourages private institutions of higher education in North
Carolina to participate in the Yellow Ribbon Program."
SECTION 11.12.(b) It is the intent of the General Assembly to establish two reserve funds
for the purpose of forward funding tuition assistance to students who participate in the Yellow
Ribbon Program. Therefore, the General Assembly establishes the two following reserve funds:
(1) There is established the UNC Yellow Ribbon Reserve to be managed by the Board of
Governors of The University of North Carolina. Of the funds appropriated by this act to the
Board of Governors, the sum of four million eight hundred sixty-three thousand two hundred
seventy-six dollars ($4,863,276) shall be allocated to the UNC Yellow Ribbon Reserve and
shall be held in reserve for the 2014-2015 fiscal year. Beginning with the 2015-2016 fiscal
year, the funds in the UNC Yellow Ribbon Reserve shall be used to fund undergraduate
tuition assistance to participants in the Yellow Ribbon Program for the 2015-2016 academic
year and each subsequent academic year.
(2) There is established the Community College Yellow Ribbon Reserve to be managed by
the State Board of Community Colleges. Of the funds appropriated by this act to the
Community Colleges System Office, the sum of one million dollars ($1,000,000) shall be
allocated to the Community College Yellow Ribbon Reserve and shall be held in reserve for
the 2014-2015 fiscal year. Beginning with the 2015-2016 fiscal year, the funds in the
Community College Yellow Ribbon Reserve shall be used to fund tuition assistance to
participants in the Yellow Ribbon Program for the 2015-2016 academic year and each
subsequent academic year.
SECTION 11.12.(c) The Board of Governors and the State Board of Community Colleges
shall each report to the Joint Legislative Education Oversight Committee by January 1, 2015,
regarding their planned participation in the Yellow Ribbon Program for the 2015-2016 academic
year. Each report shall include the following information:
(1) The number and identity of constituent institutions or community colleges that will
participate in the Yellow Ribbon Program.
74

(2) The methodology used by each governing board to select the institutions of higher
education that will participate in the Yellow Ribbon Program.
(3) For each institution that will participate, the maximum number of students and the
maximum award amount per student.
(4) A list of the institutions of higher education that will not participate in the Yellow Ribbon
Program and the reason each institution is not participating.
SECTION 11.12.(d) Subsection (a) of this section applies to the 2015-2016 academic year
and each subsequent academic year.
HEALTH CARE EDUCATION/PUBLIC PRIVATE PARTNERSHIP
SECTION 11.14. Of the funds appropriated in this act to the Board of Governors of The
University of North Carolina, the Board of Governors shall use two million dollars ($2,000,000) in
the 2014-2015 fiscal year to support Union Square Campus, Inc., a nonprofit entity, that will build a
facility to house nursing programs for North Carolina A&T State University, the University of North
Carolina at Greensboro, and Guilford Technical Community College, as well as the training facilities
for Cone Health Cardiovascular Physician Management Company, Inc.
STUDY UNIVERSITY TUITION
SECTION 11.15.(a) The Joint Legislative Education Oversight Committee shall study the
increasing cost of attendance for resident and nonresident students attending The University of North
Carolina. In doing so, the Committee shall consider, at a minimum, all of the following:
(1) The tuition and mandatory fees at the constituent institutions of The University of North
Carolina.
(2) How changes in tuition and fees in recent years have compared to overall economic
inflation.
(3) The funding available to offset increases in the cost of attendance, which could include
non-General Fund revenues and the availability of State- and non-State-funded financial aid.
(4) The tuition cost controls or limits that may have been implemented in other states.
(5) The desirability of encouraging students seeking an undergraduate degree to enroll first in
a community college for college credit and then enroll in a constituent institution to complete
the requirements for the undergraduate degree.
SECTION 11.15.(b) The Joint Legislative Education Oversight Committee shall report the
results of the study required by subsection (a) of this section to the General Assembly prior to the
convening of the 2015 General Assembly.
COMMUNITY COLLEGES PERSONNEL
SECTION 35.5. Section 35.5 of S.L. 2013-360 reads as rewritten:
"SECTION 35.5.(a) The annual salaries of all full-time community college nonfaculty and
professional staff whose salaries are supported from the State's General Fund shall remain
unchanged for the 2013-2015 fiscal biennium.be increased by one thousand dollars ($1,000).
"SECTION 35.5.(b) For the 2013-2015 fiscal biennium, the Effective July 1, 2014, the annual
salaries of all full-time community college faculty whose salaries are supported from the State's
General Fund shall remain unchanged. The be increased by one thousand dollars ($1,000). The
75

minimum salaries for nine-month, full-time curriculum community college faculty shall also remain
unchanged be increased as follows:
Education Level Minimum Salary
Vocational Diploma/Certificate or Less $34,314 $35,314
Associate Degree or Equivalent 34,819 35,819
Bachelor's Degree 37,009 38,009
Master’s Degree or Education Specialist 38,952 39,952
Doctoral Degree 41,753 42,753
No full-time faculty member shall earn less than the minimum salary for his or her education level.
The pro rata hourly rate of the minimum salary for each education level shall be used to determine
the minimum salary for part-time faculty members."
SALARY ADJUSTMENT REQUIREMENTS/LIMIT ON CUMULATIVE INCREASES SECTION 35.7. Section 35.8 of S.L. 2013-360 reads as rewritten:
"SECTION 35.8.(a) The annual compensation of all employees subject to or exempt from
the State Personnel Act, North Carolina Human Resources Act, including employees of local boards
of education, community colleges, and The University of North Carolina, for the 2013-2015 fiscal
biennium 2013-2014 fiscal year shall remain unchanged from that authorized on June 30, 2013, or
the last date in pay status during the 2011-2013 fiscal biennium, if earlier, unless an increase is
authorized by this section or under the Salary Adjustment Fund established by this act.
SECTION 35.8.(b) Salary increases may be awarded during the 2013-2015 fiscal biennium
2013-2014 fiscal year under this section subsection only for the following special circumstances:
(1) For all State employees regardless of funding source, and for employees of the North
Carolina Community College System and local school boards who are paid from State funds,
salaries may be increased for reallocations or promotions, in-range adjustments for job
change, career progression adjustments for demonstrated competencies, or any other
adjustment related to an increase in job duties or responsibilities, none of which are subject to
the salary freeze otherwise provided by this Part. All other salary increases are prohibited.
(1a) For employees of the North Carolina Community College System, notwithstanding
subdivision (1) of this subsection, salaries may be increased if the increase is (i) funded from
local funding sources or (ii) for the purposes of retention or equity.
(2) For The University of North Carolina, (i) faculty using funds from the Faculty Recruiting
and Retention Fund, the Distinguished Professors Endowment Fund, or the University
Cancer Research Fund in the case of faculty involved in cancer research supported by that
fund; (ii) faculty, nonfaculty, and other employee adjustments, including retention
adjustments, funded from non-State funding sources; (iii) faculty, nonfaculty, and other
employees for the purposes of retention or equity.
(3) For employees of the judicial branch, for local supplementation as authorized by G.S.
7A-300.1.
The cumulative salary adjustment allowed under this subsection for each fiscal year during
the 2013-2015 fiscal biennium 2013-2014 fiscal year may exceed ten percent (10%) of
annual salary only if the adjustment is approved in advance by the Office of State Budget and
Management, The University of North Carolina Board of Governors, the Board of the North
Carolina Community College System, the Legislative Services Commission, the local board
of education, or other authorized body as appropriate.
76

SECTION 35.8.(b1) For fiscal year 2014-2015, the cumulative salary adjustment awarded to
any employee may exceed ten percent (10%) of annual salary only if the adjustment is approved in
advance by the Office of State Budget and Management, The University of North Carolina Board of
Governors, the Board of the North Carolina Community College System, the Legislative Services
Commission, the local board of education, or other authorized body as appropriate.
SECTION 35.8.(c) The automatic salary step increases for assistant and deputy clerks of
superior court and magistrates are suspended for the 2013-2015 fiscal biennium.2013-2014 fiscal
year.
SECTION 35.8.(d) The salary increase provisions of G.S. 20-187.3 are suspended for the
2013-2015 fiscal biennium.2013-2014 fiscal year.
SECTION 35.8.(e) During the 2013-2015 fiscal biennium, For the 2013-2014 fiscal year,
notwithstanding G.S. 53C-2-3(c), employees of the Office of the Commissioner of Banks shall not
be awarded (i) compensation increases unless allowed under subdivision (1) of subsection (b) of this
section or (ii) compensation bonuses.
SECTION 35.8.(f) Employees of the Lottery Commission shall not receive compensation
bonuses during the 2013-2015 fiscal biennium.2013-2014 fiscal year."
USE OF FUNDS APPROPRIATED FOR LEGISLATIVELY MANDATED SALARY
INCREASES
SECTION 35.8.(a) The appropriations set forth in Section 2.1 of this act include
appropriations for legislatively mandated salary increases in amounts set forth in the committee
report described in Section 38.2 of this act. The Office of State Budget and Management shall ensure
that those funds are used only for legislatively mandated salary increases.
SECTION 35.8.(b) If the Director of the Budget determines that funds appropriated to a
State agency for legislatively mandated salary increases exceed the amount required by that agency
for that purpose, the Director may reallocate those funds to other State agencies that received
insufficient funds for legislatively mandated salary increases.
SECTION 35.8.(c) No later than October 1, 2014, the Office of State Budget and
Management shall report to the Joint Legislative Commission on Governmental Operations on the
expenditure of funds for legislatively mandated salary increases. This report shall include at least the
following information for each State agency for the 2014-2015 fiscal year:
(1) The total amount of funds that the agency received for legislatively mandated salary
increases.
(2) The total amount of funds transferred from the agency to other State agencies pursuant to
subsection (b) of this section. This section of the report shall identify the amounts transferred
to each recipient State agency.
(3) The total amount of funds used by the agency for legislatively mandated salary increases.
(4) The total amount of funds received by the agency for legislatively mandated salary
increases that are anticipated to revert at the end of the fiscal year.
ALL STATE-SUPPORTED PERSONNEL/SALARY INCREASES
SECTION 35.9.(a) Salaries and related benefits for positions that are funded:
(1) Partially from the General Fund or Highway Fund and partially from sources other than
the General Fund or Highway Fund shall be increased from the General Fund or Highway
77
Fund appropriation only to the extent of the proportionate part of the salaries paid from the
General Fund or Highway Fund.
(2) Fully from sources other than the General Fund or Highway Fund shall be increased as
provided by this act. The Director of the Budget may increase expenditures of receipts from
these sources by the amount necessary to provide the legislative increase to receipt-supported
personnel in the certified budget.
SECTION 35.9.(b) The salary increases provided in this act become effective July 1, 2014,
and do not apply to persons separated from State service due to resignation, dismissal, reduction in
force, death, or retirement, or whose last workday is prior to July 1, 2014.
SECTION 35.9.(c) Payroll checks issued to employees after July 1, 2014, which represent
payment of services provided prior to July 1, 2014, shall not be eligible for salary increases provided
for in this act. This subsection applies to all employees paid from State funds, whether or not subject
to or exempt from the North Carolina Human Resources Act, including employees of public schools,
community colleges, and The University of North Carolina.
SECTION 35.9.(d) Nothing in this act authorizes the transfer of funds between the General
Fund and the Highway Fund for salary increases.
SECTION 35.9.(e) Unless otherwise provided by this act, for the 2014-2015 fiscal year,
permanent, full-time State agency employees and State-funded public school employees who work a
nine-, 10-, or 11-month work year schedule shall receive the one thousand dollar ($1,000) annual
increase provided by this act.
MOST STATE EMPLOYEES
SECTION 35.10.(a) Section 35.7 of S.L. 2013-360 reads as rewritten:
"SECTION 35.7. For the 2013-2015 fiscal biennium, the salaries in effect June 30, 2013, for the
following employees shall remain unchanged, effective July 1, 2013: Except as otherwise
specifically set forth in this act, the salaries in effect for the following employees on June 30, 2014,
shall be increased by one thousand dollars ($1,000):
(1) Permanent full-time State officials and persons whose salaries are set in accordance with
the State Personnel Act.North Carolina Human Resources Act.
(2) Permanent full-time State officials and persons in positions exempt from the State
Personnel Act.North Carolina Human Resources Act.
(3) Permanent part-time State employees.employees and temporary and permanent hourly
State employees, on a prorated and equitable basis subject to the availability of funds in the
employing State agency, department, or institution and within regular State Budget Act
procedures.
(4) Temporary and permanent hourly State employees."
SECTION 35.10.(b) Except as otherwise specifically provided, any employee who is paid
on a step schedule who:
(1) Does not receive a step increase, shall receive the one thousand dollar ($1,000) salary
increase authorized by this act.
(2) Does receive a step increase, shall not receive the one thousand dollar ($1,000) salary
increase authorized by this act. Further, such employees are not eligible to move more than
one step on the applicable salary schedule.
78
SPECIAL ANNUAL LEAVE BONUS
SECTION 35.10A.(a) Any person who is (i) a full-time permanent employee of the State or
a community college institution on September 1, 2014, and (ii) eligible to earn annual leave shall
have a one-time additional five days of annual leave credited on September 1, 2014.
SECTION 35.10A.(b) The additional leave shall be accounted for separately with the leave
provided by Section 28.3A of S.L. 2002-126, by Section 30.12B(a) of S.L. 2003-284, and by Section
29.14A of S.L. 2005-276 and shall remain available until used, notwithstanding any other limitation
on the total number of days of annual leave that may be carried forward. Part-time permanent
employees shall receive a pro rata amount of the five days.
SALARY-RELATED CONTRIBUTIONS
SECTION 35.13.(a) Section 35.15(b) of S.L. 2013-360 reads as rewritten:
"SECTION 35.15.(b) Effective July 1, 2013, the State's employer contribution rates budgeted for
retirement and related benefits as a percentage of covered salaries for the 2013-2015 fiscal
biennium2013-2014 fiscal year are (i) fourteen and sixty-nine hundredths percent (14.69%) –
Teachers and State Employees; (ii) nineteen and sixty-nine hundredths percent (19.69%) – State Law
Enforcement Officers; (iii) twelve and sixty-eight hundredths percent (12.68%) – University
Employees' Optional Retirement Program; (iv) twelve and sixty-eight hundredths percent (12.68%)
– Community College Optional Retirement Program; (v) thirty-three and forty-one hundredths
percent (33.41%) – Consolidated Judicial Retirement System; and (vi) five and forty hundredths
percent (5.40%) – Legislative Retirement System. Each of the foregoing contribution rates includes
five and forty hundredths percent (5.40%) for hospital and medical benefits. The rate for the
Teachers and State Employees, State Law Enforcement Officers, University Employees' Optional
Retirement Program, and the Community College Optional Retirement Program includes forty-four
hundredths percent (0.44%) for the Disability Income Plan. The rates for Teachers and State
Employees and State Law Enforcement Officers include sixteen hundredths percent (0.16%) for the
Death Benefits Plan. The rate for State Law Enforcement Officers includes five percent (5%) for
Supplemental Retirement Income. The rate for Teachers and State Employees and State Law
Enforcement Officers includes one hundredths percent (0.01%) for the Qualified Excess Benefit
Arrangement."
SECTION 35.13.(b) Effective July 1, 2014, the State's employer contribution rates budgeted
for retirement and related benefits as a percentage of covered salaries for the 2014-2015 fiscal year
are (i) fifteen and twenty-one hundredths percent (15.21%) – Teachers and State Employees; (ii)
twenty and twenty-one hundredths percent (20.21%) – State Law Enforcement Officers; (iii) twelve
and seventy-four hundredths percent (12.74%) – University Employees' Optional Retirement
Program; (iv) twelve and seventy-four hundredths percent (12.74%) – Community College Optional
Retirement Program; (v) thirty-two and seventy hundredths percent (32.70%) – Consolidated
Judicial Retirement System; and (vi) five and forty-nine hundredths percent (5.49%) – Legislative
Retirement System. Each of the foregoing contribution rates includes five and forty-nine hundredths
percent (5.49%) for hospital and medical benefits. The rate for the Teachers and State Employees,
State Law Enforcement Officers, University Employees' Optional Retirement Program, and the
Community College Optional Retirement Program includes forty-one hundredths percent (0.41%)
for the Disability Income Plan. The rates for Teachers and State Employees and State Law
Enforcement Officers include sixteen hundredths percent (0.16%) for the Death Benefits Plan. The
rate for State Law Enforcement Officers includes five percent (5%) for Supplemental Retirement
79

Income. The rate for Teachers and State Employees and State Law Enforcement Officers includes
one hundredths percent (0.01%) for the Qualified Excess Benefit Arrangement.
SECTION 35.13.(c) Section 35.15(d) of S.L. 2013-360 reads as rewritten:
"SECTION 35.15.(d) Effective July 1, 2014, the maximum annual employer contributions, payable
monthly, by the State for each covered employee or retiree for the 2014-2015 fiscal year to the State
Health Plan for Teachers and State Employees are (i) Medicare eligible employees and retirees –
four thousand two hundred twenty-four dollars ($4,224) four thousand one hundred seventy-nine
dollars ($4,179) and (ii) non-Medicare eligible employees and retirees – five thousand four hundred
thirty-five dollars ($5,435).five thousand three hundred seventy-eight dollars ($5,378)."
ALTERNATIVE HEALTH BENEFIT COVERAGE FOR NONPERMANENT FULL-TIME
STATE EMPLOYEES
SECTION 35.16.(a) Section 1 of S.L. 2013-324 is repealed. The amendment to G.S.
135-48.43(a)(2) made in Section 4 of S.L. 2013-324 is repealed.
SECTION 35.16.(b) G.S. 135-48.22 reads as rewritten:
"§ 135-48.22. Board powers and duties.
The Board of Trustees shall have the following powers and duties:
(1) Approve benefit programs, as provided in G.S. 135-48.30(a)(2).
(2) Approve premium rates, co-pays, deductibles, and coinsurance percentages and
maximums for the Plan, as provided in G.S. 135-48.30(a)(2).
(2a) Approve the benefit program, premium rates, co-pays, deductibles, and coinsurance
percentages and maximums for the coverage offered under G.S. 135-48.40(e).
(3) Oversee administrative reviews and appeals, as provided in G.S. 135-48.24.
(4) Approve large contracts, as provided in G.S. 135-48.33(a).
(5) Consult with and advise the State Treasurer as required by this Article and as requested
by the State Treasurer.
(6) Develop and maintain a strategic plan for the Plan."
SECTION 35.16.(c) G.S. 135-48.40 is amended by adding a new subsection to read:
"(e) Other Contributory Coverage. – Any employee of an employing unit is eligible for coverage
under this section on a contributory basis, subject to the provisions of G.S. 135-48.43 and of this
section, if (i) the employee's employing unit determines that the employee is a full-time employee
and (ii) the employee does not qualify for coverage under subdivision (1), (5), (6), (7), (8), (9), or
(10) of G.S. 135-48.40(b). For the purposes of this subsection, the full-time status of an employee
shall be determined by the employing unit, in its sole discretion, in accordance with Section 4980H
of the Internal Revenue Code and the applicable regulations, as amended. The coverage offered and
the contribution required for coverage under this section shall be determined by the Treasurer and
approved by the Board of Trustees. Such coverage shall do all of the following:
(1) Be designed to meet the requirements of minimum essential coverage under the Patient
Protection and Affordable Care Act, P.L. 111-148, and the applicable regulations, as
amended (Affordable Care Act).
(2) Provide no greater coverage than a bronze-level plan, as defined under the Affordable
Care Act.
(3) Minimize the required employer contribution in an administratively feasible
manner."
SECTION 35.16.(d) G.S. 135-48.43(a)(2) reads as rewritten:
80
"(2) New employees may apply for coverage to be effective on the first day of the month following
employment, or on a like date the following month if the employee has enrolled.enrolled, except that
the effective date of coverage for employees who become eligible in accordance with G.S.
135-48.40(e) will be determined by the employing unit in a manner that is consistent with section
4980H of the Internal Revenue Code and the applicable regulations, as amended."
SECTION 35.16.(e) Subsection (a) of this section is effective when this act becomes law.
Subsections (b) through (d) of this section become effective January 1, 2015, and apply to plan years
beginning on or after that date.
CLARIFY THAT RE-HIRED STATE RETIREES SHALL BE OFFERED COVERAGE IN
STATE HEALTH PLAN AS ACTIVE EMPLOYEES RATHER THAN AS RETIREES
SECTION 35.16A.(a) G.S. 135-48.41 is amended by adding the following new subsection:
"§ 135-48.41. Additional eligibility provisions.
…
(j) If a retiree has been hired by an employing unit and is eligible for coverage under subdivision (1),
(5), (6), (7), (8), (9), or (10) of G.S. 135-48.40(b) or under G.S. 135-48.40(e), then the hired retiree
shall not, during the time of employment, be eligible for retiree coverage under G.S.
135-48.40(a)(1), G.S. 135-48.40(b)(3), G.S. 135-48.40(c)(2), or G.S. 135-48.40(d)(11)."
SECTION 35.16A.(b) The second paragraph of Section 35.15(a) of S.L. 2013-360 is
repealed.
81

Appendix B: Closing the Skills Gap Priority Occupations
Health Sciences
Nurses
Dental Hygienists
Dental Assistants
Dental Laboratory Technicians
Occupational Therapy Assistant
Physical Therapy Technician/Assistant
Radiation Therapists
Respiratory Care Therapy/Therapist
Cardiovascular Technologists and
Technicians
Diagnostic Medical Sonographers
Magnetic Resonance Imaging (MRI)
Technology/Technician
Nuclear Medicine Technologists
Radiologic Technologists
Surgical Technologists
Biological, Chemical, and Biotechnology
Biological Technicians
Chemical Technicians
Chemical Plant and System Operators
Chemical Equipment Operators and
Tenders
Manufacturing, Production, and Installation
Machinists and Precision Metal Workers
Heavy/Industrial Equipment Maintenance
Technician
Medical Equipment Repairers
Industrial Machine Mechanics
Machine Maintenance Workers
Electrical Power-Line Transmission
Installers.
Telecommunications Line Installers and
Repairers
Architecture, Engineering, and Construction
Aerospace Engineering and Operations
Technicians
Civil Engineering Technicians
Electrical and Electronic Engineering
Technicians
Electro-Mechanical Technicians
Industrial Engineering Technicians
Mechanical Engineering Technicians
Nuclear and Industrial Radiologic
Technicians
Architectural and Civil Drafters
Electrical and Electronics Drafters
Mechanical Drafters
Building/Construction Finishing,
Management, and Inspection.
Plumbers, Pipefitters, and Steamfitters
Electricians
Heating, Air Conditioning, Ventilation and
Refrigeration Maintenance Technicians
(HAC, HACR, HVAC, HVACR).
Operating Engineers and Construction
Equipment Operators
Transportation
Heavy and Tractor-Trailer Truck Drivers
Air Transportation
Aircraft Mechanics and Service Technicians
Automotive Body and Related Repairers
Automotive Service Technicians and
Mechanics
Avionics Technicians
Bus and Truck Mechanics and Diesel Engine
Specialists
Boat Mechanics and Service Technicians
Mobile Heavy Equipment Mechanics
82
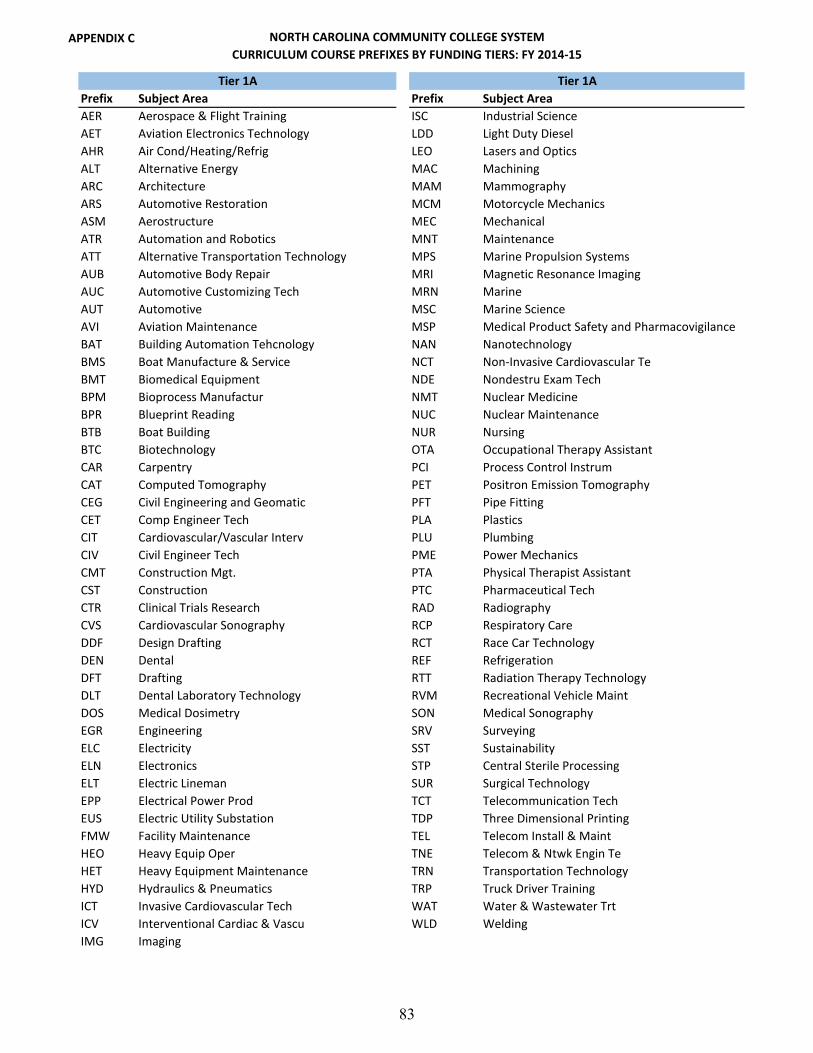
APPENDIX C NORTH CAROLINA COMMUNITY COLLEGE SYSTEM
CURRICULUM COURSE PREFIXES BY FUNDING TIERS: FY 2014-15
Prefix Subject Area Prefix Subject Area
AER Aerospace & Flight Training ISC Industrial Science
AET Aviation Electronics Technology LDD Light Duty Diesel
AHR Air Cond/Heating/Refrig LEO Lasers and Optics
ALT Alternative Energy MAC Machining
ARC Architecture MAM Mammography
ARS Automotive Restoration MCM Motorcycle Mechanics
ASM Aerostructure MEC Mechanical
ATR Automation and Robotics MNT Maintenance
ATT Alternative Transportation Technology MPS Marine Propulsion Systems
AUB Automotive Body Repair MRI Magnetic Resonance Imaging
AUC Automotive Customizing Tech MRN Marine
AUT Automotive MSC Marine Science
AVI Aviation Maintenance MSP Medical Product Safety and Pharmacovigilance
BAT Building Automation Tehcnology NAN Nanotechnology
BMS Boat Manufacture & Service NCT Non-Invasive Cardiovascular Te
BMT Biomedical Equipment NDE Nondestru Exam Tech
BPM Bioprocess Manufactur NMT Nuclear Medicine
BPR Blueprint Reading NUC Nuclear Maintenance
BTB Boat Building NUR Nursing
BTC Biotechnology OTA Occupational Therapy Assistant
CAR Carpentry PCI Process Control Instrum
CAT Computed Tomography PET Positron Emission Tomography
CEG Civil Engineering and Geomatic PFT Pipe Fitting
CET Comp Engineer Tech PLA Plastics
CIT Cardiovascular/Vascular Interv PLU Plumbing
CIV Civil Engineer Tech PME Power Mechanics
CMT Construction Mgt. PTA Physical Therapist Assistant
CST Construction PTC Pharmaceutical Tech
CTR Clinical Trials Research RAD Radiography
CVS Cardiovascular Sonography RCP Respiratory Care
DDF Design Drafting RCT Race Car Technology
DEN Dental REF Refrigeration
DFT Drafting RTT Radiation Therapy Technology
DLT Dental Laboratory Technology RVM Recreational Vehicle Maint
DOS Medical Dosimetry SON Medical Sonography
EGR Engineering SRV Surveying
ELC Electricity SST Sustainability
ELN Electronics STP Central Sterile Processing
ELT Electric Lineman SUR Surgical Technology
EPP Electrical Power Prod TCT Telecommunication Tech
EUS Electric Utility Substation TDP Three Dimensional Printing
FMW Facility Maintenance TEL Telecom Install & Maint
HEO Heavy Equip Oper TNE Telecom & Ntwk Engin Te
HET Heavy Equipment Maintenance TRN Transportation Technology
HYD Hydraulics & Pneumatics TRP Truck Driver Training
ICT Invasive Cardiovascular Tech WAT Water & Wastewater Trt
ICV Interventional Cardiac & Vascu WLD Welding
IMG Imaging
Tier 1A Tier 1A
83
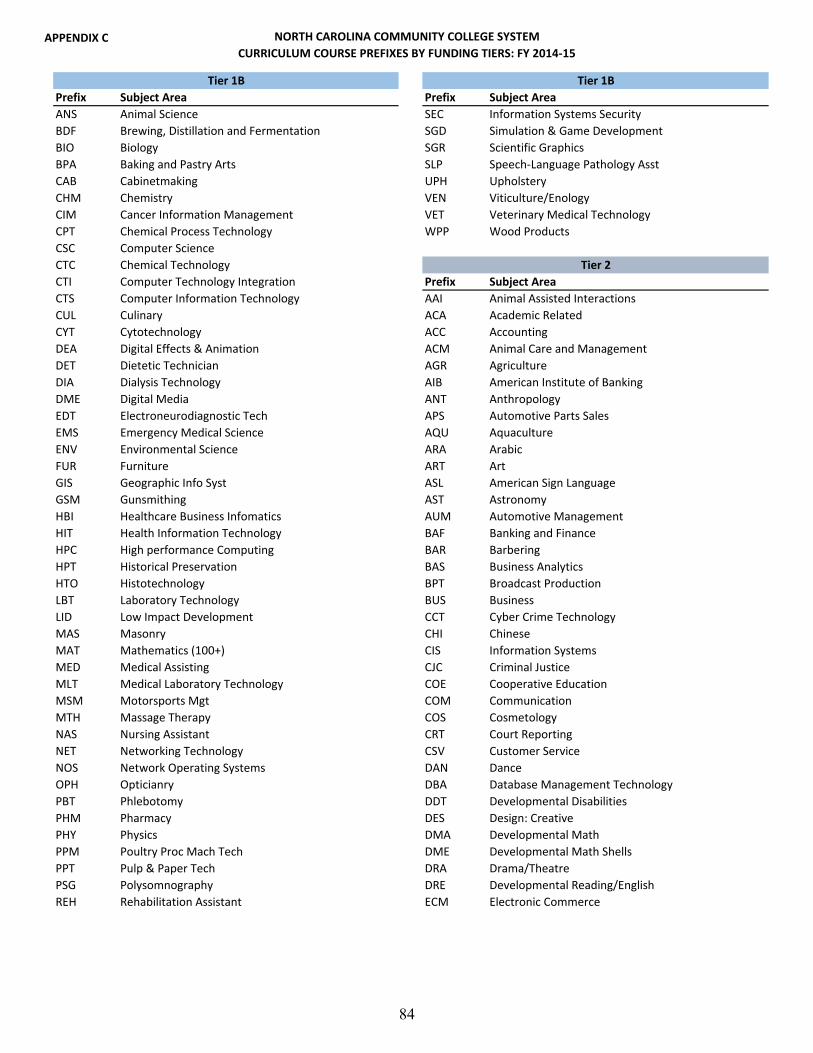
APPENDIX C NORTH CAROLINA COMMUNITY COLLEGE SYSTEM
CURRICULUM COURSE PREFIXES BY FUNDING TIERS: FY 2014-15
Prefix Subject Area Prefix Subject Area
ANS Animal Science SEC Information Systems Security
BDF Brewing, Distillation and Fermentation SGD Simulation & Game Development
BIO Biology SGR Scientific Graphics
BPA Baking and Pastry Arts SLP Speech-Language Pathology Asst
CAB Cabinetmaking UPH Upholstery
CHM Chemistry VEN Viticulture/Enology
CIM Cancer Information Management VET Veterinary Medical Technology
CPT Chemical Process Technology WPP Wood Products
CSC Computer Science
CTC Chemical Technology
CTI Computer Technology Integration Prefix Subject Area
CTS Computer Information Technology AAI Animal Assisted Interactions
CUL Culinary ACA Academic Related
CYT Cytotechnology ACC Accounting
DEA Digital Effects & Animation ACM Animal Care and Management
DET Dietetic Technician AGR Agriculture
DIA Dialysis Technology AIB American Institute of Banking
DME Digital Media ANT Anthropology
EDT Electroneurodiagnostic Tech APS Automotive Parts Sales
EMS Emergency Medical Science AQU Aquaculture
ENV Environmental Science ARA Arabic
FUR Furniture ART Art
GIS Geographic Info Syst ASL American Sign Language
GSM Gunsmithing AST Astronomy
HBI Healthcare Business Infomatics AUM Automotive Management
HIT Health Information Technology BAF Banking and Finance
HPC High performance Computing BAR Barbering
HPT Historical Preservation BAS Business Analytics
HTO Histotechnology BPT Broadcast Production
LBT Laboratory Technology BUS Business
LID Low Impact Development CCT Cyber Crime Technology
MAS Masonry CHI Chinese
MAT Mathematics (100+) CIS Information Systems
MED Medical Assisting CJC Criminal Justice
MLT Medical Laboratory Technology COE Cooperative Education
MSM Motorsports Mgt COM Communication
MTH Massage Therapy COS Cosmetology
NAS Nursing Assistant CRT Court Reporting
NET Networking Technology CSV Customer Service
NOS Network Operating Systems DAN Dance
OPH Opticianry DBA Database Management Technology
PBT Phlebotomy DDT Developmental Disabilities
PHM Pharmacy DES Design: Creative
PHY Physics DMA Developmental Math
PPM Poultry Proc Mach Tech DME Developmental Math Shells
PPT Pulp & Paper Tech DRA Drama/Theatre
PSG Polysomnography DRE Developmental Reading/English
REH Rehabilitation Assistant ECM Electronic Commerce
Tier 1B Tier 1B
Tier 2
84
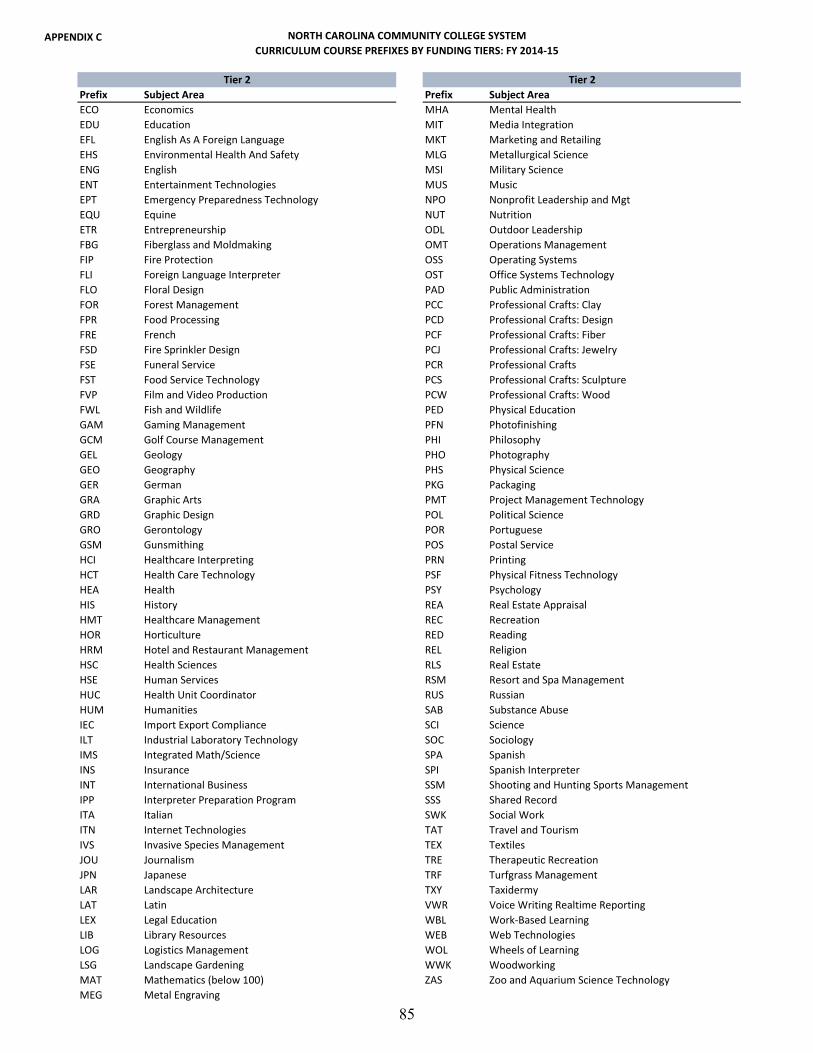
APPENDIX C NORTH CAROLINA COMMUNITY COLLEGE SYSTEM
CURRICULUM COURSE PREFIXES BY FUNDING TIERS: FY 2014-15
Prefix Subject Area Prefix Subject Area
ECO Economics MHA Mental Health
EDU Education MIT Media Integration
EFL English As A Foreign Language MKT Marketing and Retailing
EHS Environmental Health And Safety MLG Metallurgical Science
ENG English MSI Military Science
ENT Entertainment Technologies MUS Music
EPT Emergency Preparedness Technology NPO Nonprofit Leadership and Mgt
EQU Equine NUT Nutrition
ETR Entrepreneurship ODL Outdoor Leadership
FBG Fiberglass and Moldmaking OMT Operations Management
FIP Fire Protection OSS Operating Systems
FLI Foreign Language Interpreter OST Office Systems Technology
FLO Floral Design PAD Public Administration
FOR Forest Management PCC Professional Crafts: Clay
FPR Food Processing PCD Professional Crafts: Design
FRE French PCF Professional Crafts: Fiber
FSD Fire Sprinkler Design PCJ Professional Crafts: Jewelry
FSE Funeral Service PCR Professional Crafts
FST Food Service Technology PCS Professional Crafts: Sculpture
FVP Film and Video Production PCW Professional Crafts: Wood
FWL Fish and Wildlife PED Physical Education
GAM Gaming Management PFN Photofinishing
GCM Golf Course Management PHI Philosophy
GEL Geology PHO Photography
GEO Geography PHS Physical Science
GER German PKG Packaging
GRA Graphic Arts PMT Project Management Technology
GRD Graphic Design POL Political Science
GRO Gerontology POR Portuguese
GSM Gunsmithing POS Postal Service
HCI Healthcare Interpreting PRN Printing
HCT Health Care Technology PSF Physical Fitness Technology
HEA Health PSY Psychology
HIS History REA Real Estate Appraisal
HMT Healthcare Management REC Recreation
HOR Horticulture RED Reading
HRM Hotel and Restaurant Management REL Religion
HSC Health Sciences RLS Real Estate
HSE Human Services RSM Resort and Spa Management
HUC Health Unit Coordinator RUS Russian
HUM Humanities SAB Substance Abuse
IEC Import Export Compliance SCI Science
ILT Industrial Laboratory Technology SOC Sociology
IMS Integrated Math/Science SPA Spanish
INS Insurance SPI Spanish Interpreter
INT International Business SSM Shooting and Hunting Sports Management
IPP Interpreter Preparation Program SSS Shared Record
ITA Italian SWK Social Work
ITN Internet Technologies TAT Travel and Tourism
IVS Invasive Species Management TEX Textiles
JOU Journalism TRE Therapeutic Recreation
JPN Japanese TRF Turfgrass Management
LAR Landscape Architecture TXY Taxidermy
LAT Latin VWR Voice Writing Realtime Reporting
LEX Legal Education WBL Work-Based Learning
LIB Library Resources WEB Web Technologies
LOG Logistics Management WOL Wheels of Learning
LSG Landscape Gardening WWK Woodworking
MAT Mathematics (below 100) ZAS Zoo and Aquarium Science Technology
MEG Metal Engraving
Tier 2 Tier 2
85
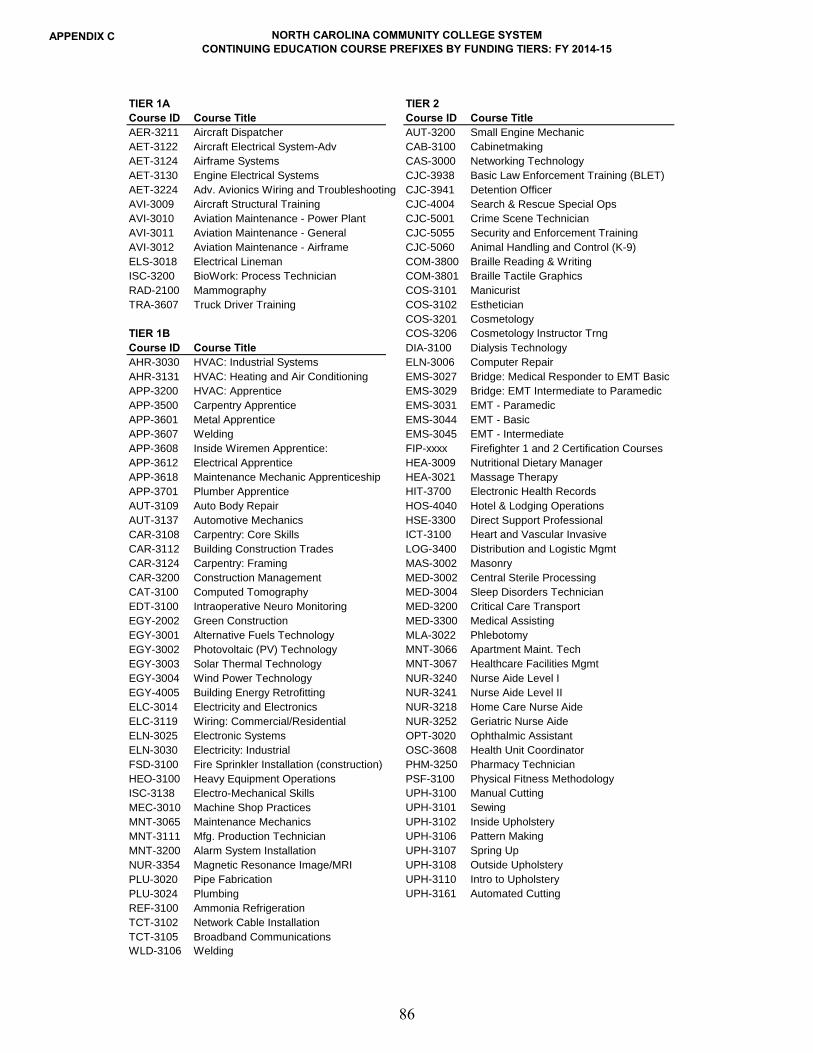
APPENDIX C NORTH CAROLINA COMMUNITY COLLEGE SYSTEMCONTINUING EDUCATION COURSE PREFIXES BY FUNDING TIERS: FY 2014-15
TIER 1A TIER 2Course ID Course Title Course ID Course TitleAER-3211 Aircraft Dispatcher AUT-3200 Small Engine Mechanic
AET-3122 Aircraft Electrical System-Adv CAB-3100 Cabinetmaking
AET-3124 Airframe Systems CAS-3000 Networking Technology
AET-3130 Engine Electrical Systems CJC-3938 Basic Law Enforcement Training (BLET)
AET-3224 Adv. Avionics Wiring and Troubleshooting CJC-3941 Detention Officer
AVI-3009 Aircraft Structural Training CJC-4004 Search & Rescue Special Ops
AVI-3010 Aviation Maintenance - Power Plant CJC-5001 Crime Scene Technician
AVI-3011 Aviation Maintenance - General CJC-5055 Security and Enforcement Training
AVI-3012 Aviation Maintenance - Airframe CJC-5060 Animal Handling and Control (K-9)
ELS-3018 Electrical Lineman COM-3800 Braille Reading & Writing
ISC-3200 BioWork: Process Technician COM-3801 Braille Tactile Graphics
RAD-2100 Mammography COS-3101 Manicurist
TRA-3607 Truck Driver Training COS-3102 Esthetician
COS-3201 Cosmetology
TIER 1B COS-3206 Cosmetology Instructor Trng
Course ID Course Title DIA-3100 Dialysis Technology
AHR-3030 HVAC: Industrial Systems ELN-3006 Computer Repair
AHR-3131 HVAC: Heating and Air Conditioning EMS-3027 Bridge: Medical Responder to EMT Basic
APP-3200 HVAC: Apprentice EMS-3029 Bridge: EMT Intermediate to Paramedic
APP-3500 Carpentry Apprentice EMS-3031 EMT - Paramedic
APP-3601 Metal Apprentice EMS-3044 EMT - Basic
APP-3607 Welding EMS-3045 EMT - Intermediate
APP-3608 Inside Wiremen Apprentice: FIP-xxxx Firefighter 1 and 2 Certification Courses
APP-3612 Electrical Apprentice HEA-3009 Nutritional Dietary Manager
APP-3618 Maintenance Mechanic Apprenticeship HEA-3021 Massage Therapy
APP-3701 Plumber Apprentice HIT-3700 Electronic Health Records
AUT-3109 Auto Body Repair HOS-4040 Hotel & Lodging Operations
AUT-3137 Automotive Mechanics HSE-3300 Direct Support Professional
CAR-3108 Carpentry: Core Skills ICT-3100 Heart and Vascular Invasive
CAR-3112 Building Construction Trades LOG-3400 Distribution and Logistic Mgmt
CAR-3124 Carpentry: Framing MAS-3002 Masonry
CAR-3200 Construction Management MED-3002 Central Sterile Processing
CAT-3100 Computed Tomography MED-3004 Sleep Disorders Technician
EDT-3100 Intraoperative Neuro Monitoring MED-3200 Critical Care Transport
EGY-2002 Green Construction MED-3300 Medical Assisting
EGY-3001 Alternative Fuels Technology MLA-3022 Phlebotomy
EGY-3002 Photovoltaic (PV) Technology MNT-3066 Apartment Maint. Tech
EGY-3003 Solar Thermal Technology MNT-3067 Healthcare Facilities Mgmt
EGY-3004 Wind Power Technology NUR-3240 Nurse Aide Level I
EGY-4005 Building Energy Retrofitting NUR-3241 Nurse Aide Level II
ELC-3014 Electricity and Electronics NUR-3218 Home Care Nurse Aide
ELC-3119 Wiring: Commercial/Residential NUR-3252 Geriatric Nurse Aide
ELN-3025 Electronic Systems OPT-3020 Ophthalmic Assistant
ELN-3030 Electricity: Industrial OSC-3608 Health Unit Coordinator
FSD-3100 Fire Sprinkler Installation (construction) PHM-3250 Pharmacy Technician
HEO-3100 Heavy Equipment Operations PSF-3100 Physical Fitness Methodology
ISC-3138 Electro-Mechanical Skills UPH-3100 Manual Cutting
MEC-3010 Machine Shop Practices UPH-3101 Sewing
MNT-3065 Maintenance Mechanics UPH-3102 Inside Upholstery
MNT-3111 Mfg. Production Technician UPH-3106 Pattern Making
MNT-3200 Alarm System Installation UPH-3107 Spring Up
NUR-3354 Magnetic Resonance Image/MRI UPH-3108 Outside Upholstery
PLU-3020 Pipe Fabrication UPH-3110 Intro to Upholstery
PLU-3024 Plumbing UPH-3161 Automated Cutting
REF-3100 Ammonia Refrigeration
TCT-3102 Network Cable Installation
TCT-3105 Broadband Communications
WLD-3106 Welding
86
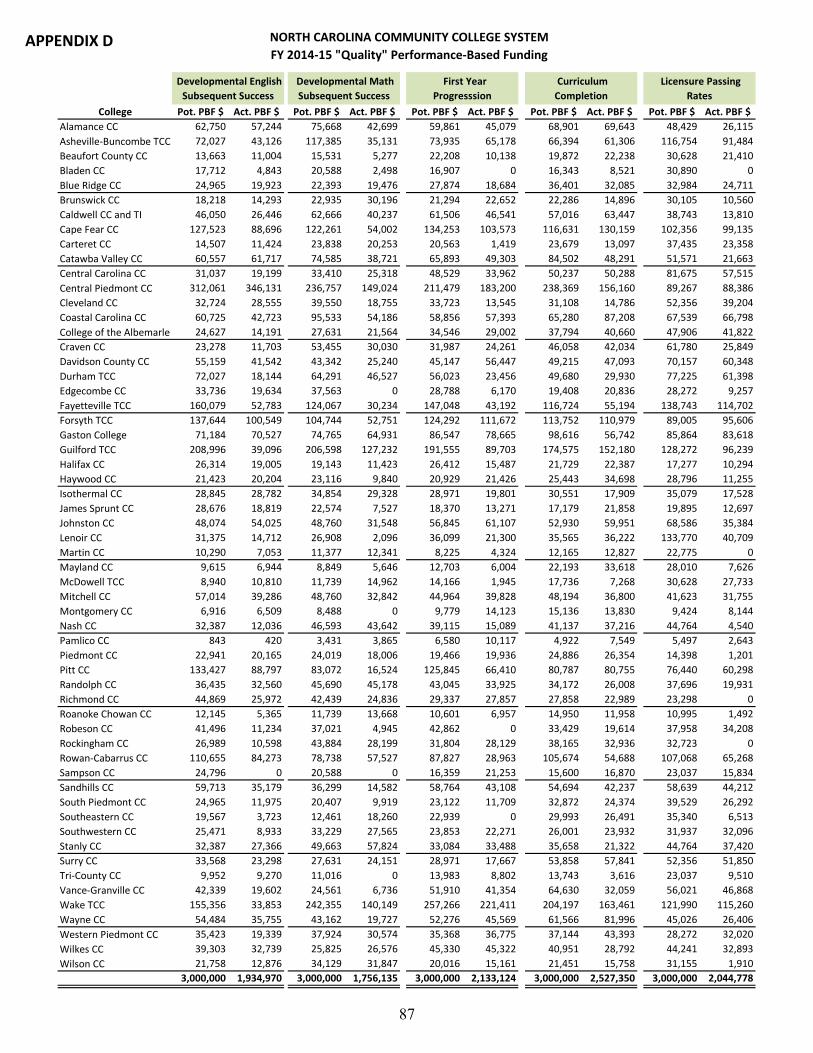
APPENDIX D NORTH CAROLINA COMMUNITY COLLEGE SYSTEM
FY 2014-15 "Quality" Performance-Based Funding
College Pot. PBF $ Act. PBF $ Pot. PBF $ Act. PBF $ Pot. PBF $ Act. PBF $ Pot. PBF $ Act. PBF $ Pot. PBF $ Act. PBF $
Alamance CC 62,750 57,244 75,668 42,699 59,861 45,079 68,901 69,643 48,429 26,115
Asheville-Buncombe TCC 72,027 43,126 117,385 35,131 73,935 65,178 66,394 61,306 116,754 91,484
Beaufort County CC 13,663 11,004 15,531 5,277 22,208 10,138 19,872 22,238 30,628 21,410
Bladen CC 17,712 4,843 20,588 2,498 16,907 0 16,343 8,521 30,890 0
Blue Ridge CC 24,965 19,923 22,393 19,476 27,874 18,684 36,401 32,085 32,984 24,711
Brunswick CC 18,218 14,293 22,935 30,196 21,294 22,652 22,286 14,896 30,105 10,560
Caldwell CC and TI 46,050 26,446 62,666 40,237 61,506 46,541 57,016 63,447 38,743 13,810
Cape Fear CC 127,523 88,696 122,261 54,002 134,253 103,573 116,631 130,159 102,356 99,135
Carteret CC 14,507 11,424 23,838 20,253 20,563 1,419 23,679 13,097 37,435 23,358
Catawba Valley CC 60,557 61,717 74,585 38,721 65,893 49,303 84,502 48,291 51,571 21,663
Central Carolina CC 31,037 19,199 33,410 25,318 48,529 33,962 50,237 50,288 81,675 57,515
Central Piedmont CC 312,061 346,131 236,757 149,024 211,479 183,200 238,369 156,160 89,267 88,386
Cleveland CC 32,724 28,555 39,550 18,755 33,723 13,545 31,108 14,786 52,356 39,204
Coastal Carolina CC 60,725 42,723 95,533 54,186 58,856 57,393 65,280 87,208 67,539 66,798
College of the Albemarle 24,627 14,191 27,631 21,564 34,546 29,002 37,794 40,660 47,906 41,822
Craven CC 23,278 11,703 53,455 30,030 31,987 24,261 46,058 42,034 61,780 25,849
Davidson County CC 55,159 41,542 43,342 25,240 45,147 56,447 49,215 47,093 70,157 60,348
Durham TCC 72,027 18,144 64,291 46,527 56,023 23,456 49,680 29,930 77,225 61,398
Edgecombe CC 33,736 19,634 37,563 0 28,788 6,170 19,408 20,836 28,272 9,257
Fayetteville TCC 160,079 52,783 124,067 30,234 147,048 43,192 116,724 55,194 138,743 114,702
Forsyth TCC 137,644 100,549 104,744 52,751 124,292 111,672 113,752 110,979 89,005 95,606
Gaston College 71,184 70,527 74,765 64,931 86,547 78,665 98,616 56,742 85,864 83,618
Guilford TCC 208,996 39,096 206,598 127,232 191,555 89,703 174,575 152,180 128,272 96,239
Halifax CC 26,314 19,005 19,143 11,423 26,412 15,487 21,729 22,387 17,277 10,294
Haywood CC 21,423 20,204 23,116 9,840 20,929 21,426 25,443 34,698 28,796 11,255
Isothermal CC 28,845 28,782 34,854 29,328 28,971 19,801 30,551 17,909 35,079 17,528
James Sprunt CC 28,676 18,819 22,574 7,527 18,370 13,271 17,179 21,858 19,895 12,697
Johnston CC 48,074 54,025 48,760 31,548 56,845 61,107 52,930 59,951 68,586 35,384
Lenoir CC 31,375 14,712 26,908 2,096 36,099 21,300 35,565 36,222 133,770 40,709
Martin CC 10,290 7,053 11,377 12,341 8,225 4,324 12,165 12,827 22,775 0
Mayland CC 9,615 6,944 8,849 5,646 12,703 6,004 22,193 33,618 28,010 7,626
McDowell TCC 8,940 10,810 11,739 14,962 14,166 1,945 17,736 7,268 30,628 27,733
Mitchell CC 57,014 39,286 48,760 32,842 44,964 39,828 48,194 36,800 41,623 31,755
Montgomery CC 6,916 6,509 8,488 0 9,779 14,123 15,136 13,830 9,424 8,144
Nash CC 32,387 12,036 46,593 43,642 39,115 15,089 41,137 37,216 44,764 4,540
Pamlico CC 843 420 3,431 3,865 6,580 10,117 4,922 7,549 5,497 2,643
Piedmont CC 22,941 20,165 24,019 18,006 19,466 19,936 24,886 26,354 14,398 1,201
Pitt CC 133,427 88,797 83,072 16,524 125,845 66,410 80,787 80,755 76,440 60,298
Randolph CC 36,435 32,560 45,690 45,178 43,045 33,925 34,172 26,008 37,696 19,931
Richmond CC 44,869 25,972 42,439 24,836 29,337 27,857 27,858 22,989 23,298 0
Roanoke Chowan CC 12,145 5,365 11,739 13,668 10,601 6,957 14,950 11,958 10,995 1,492
Robeson CC 41,496 11,234 37,021 4,945 42,862 0 33,429 19,614 37,958 34,208
Rockingham CC 26,989 10,598 43,884 28,199 31,804 28,129 38,165 32,936 32,723 0
Rowan-Cabarrus CC 110,655 84,273 78,738 57,527 87,827 28,963 105,674 54,688 107,068 65,268
Sampson CC 24,796 0 20,588 0 16,359 21,253 15,600 16,870 23,037 15,834
Sandhills CC 59,713 35,179 36,299 14,582 58,764 43,108 54,694 42,237 58,639 44,212
South Piedmont CC 24,965 11,975 20,407 9,919 23,122 11,709 32,872 24,374 39,529 26,292
Southeastern CC 19,567 3,723 12,461 18,260 22,939 0 29,993 26,491 35,340 6,513
Southwestern CC 25,471 8,933 33,229 27,565 23,853 22,271 26,001 23,932 31,937 32,096
Stanly CC 32,387 27,366 49,663 57,824 33,084 33,488 35,658 21,322 44,764 37,420
Surry CC 33,568 23,298 27,631 24,151 28,971 17,667 53,858 57,841 52,356 51,850
Tri-County CC 9,952 9,270 11,016 0 13,983 8,802 13,743 3,616 23,037 9,510
Vance-Granville CC 42,339 19,602 24,561 6,736 51,910 41,354 64,630 32,059 56,021 46,868
Wake TCC 155,356 33,853 242,355 140,149 257,266 221,411 204,197 163,461 121,990 115,260
Wayne CC 54,484 35,755 43,162 19,727 52,276 45,569 61,566 81,996 45,026 26,406
Western Piedmont CC 35,423 19,339 37,924 30,574 35,368 36,775 37,144 43,393 28,272 32,020
Wilkes CC 39,303 32,739 25,825 26,576 45,330 45,322 40,951 28,792 44,241 32,893
Wilson CC 21,758 12,876 34,129 31,847 20,016 15,161 21,451 15,758 31,155 1,910
3,000,000 1,934,970 3,000,000 1,756,135 3,000,000 2,133,124 3,000,000 2,527,350 3,000,000 2,044,778
Developmental English
Subsequent Success
Developmental Math
Subsequent Success
Licensure Passing
Rates
First Year
Progresssion
Curriculum
Completion
87

APPENDIX D NORTH CAROLINA COMMUNITY COLLEGE SYSTEM
FY 2014-15 "Quality" Performance-Based Funding
College
Alamance CC
Asheville-Buncombe TCC
Beaufort County CC
Bladen CC
Blue Ridge CC
Brunswick CC
Caldwell CC and TI
Cape Fear CC
Carteret CC
Catawba Valley CC
Central Carolina CC
Central Piedmont CC
Cleveland CC
Coastal Carolina CC
College of the Albemarle
Craven CC
Davidson County CC
Durham TCC
Edgecombe CC
Fayetteville TCC
Forsyth TCC
Gaston College
Guilford TCC
Halifax CC
Haywood CC
Isothermal CC
James Sprunt CC
Johnston CC
Lenoir CC
Martin CC
Mayland CC
McDowell TCC
Mitchell CC
Montgomery CC
Nash CC
Pamlico CC
Piedmont CC
Pitt CC
Randolph CC
Richmond CC
Roanoke Chowan CC
Robeson CC
Rockingham CC
Rowan-Cabarrus CC
Sampson CC
Sandhills CC
South Piedmont CC
Southeastern CC
Southwestern CC
Stanly CC
Surry CC
Tri-County CC
Vance-Granville CC
Wake TCC
Wayne CC
Western Piedmont CC
Wilkes CC
Wilson CC
Pot. PBF $ Act. PBF $ Pot. PBF $ Actual PBF$ Pot. PBF $ Act. PBF $ Pot. PBF $ Act. PBF $ Pot. PBF $ Actual PBF$
46,417 33,450 362,026 274,230 66,803 8,530 67,700 64,602 134,503 73,132
94,767 89,357 541,262 385,582 45,878 37,880 141,650 9,473 187,528 47,353
15,150 13,595 117,052 83,662 20,290 10,241 12,151 3,979 32,441 14,220
19,018 1,389 121,458 17,251 10,754 10,601 25,691 12,232 36,445 22,833
20,952 18,134 165,569 133,013 25,852 11,691 39,232 14,121 65,084 25,812
26,109 17,566 140,947 110,163 17,853 17,255 45,828 0 63,681 17,255
79,617 50,058 345,598 240,539 37,719 31,767 70,131 48,214 107,850 79,981
179,865 129,263 782,889 604,828 81,001 45,403 60,062 37,915 141,063 83,318
15,150 12,167 135,172 81,718 13,297 1,610 19,789 17,937 33,086 19,547
80,585 65,571 417,693 285,266 44,182 25,679 86,448 67,135 130,630 92,814
38,036 34,194 282,924 220,476 99,755 108,492 96,169 59,923 195,924 168,415
315,247 196,124 1,403,180 1,119,025 297,409 314,247 117,000 108,116 414,409 422,363
39,648 33,392 229,109 148,237 21,297 24,639 10,763 12,436 32,060 37,075
78,973 73,512 426,906 381,820 31,733 29,043 33,677 16,121 65,410 45,164
39,648 21,968 212,152 169,207 29,667 24,370 56,243 38,362 85,910 62,732
42,549 34,233 259,107 168,110 25,323 10,835 19,095 13,679 44,418 24,514
50,285 36,952 313,305 267,622 75,173 77,575 53,813 44,143 128,986 121,718
67,369 55,868 386,615 235,323 74,326 47,822 53,119 35,641 127,445 83,463
18,373 11,991 166,140 67,888 36,607 32,344 47,564 38,702 84,171 71,046
95,090 72,632 781,751 368,737 151,618 65,052 77,422 86,032 229,040 151,084
119,587 92,428 689,024 563,985 113,581 112,170 74,644 58,390 188,225 170,560
66,079 41,372 483,055 395,855 49,003 24,510 73,603 58,898 122,606 83,408
182,766 118,680 1,092,762 623,130 190,874 57,835 72,214 39,773 263,088 97,608
10,637 9,272 121,512 87,868 15,257 12,419 57,979 0 73,236 12,419
17,084 11,776 136,791 109,199 8,423 8,013 12,151 10,344 20,574 18,357
33,201 33,744 191,501 147,092 23,839 1,091 34,024 35,753 57,863 36,844
12,571 7,453 119,265 81,625 14,886 23,412 10,763 10,314 25,649 33,726
55,120 38,830 330,315 280,845 46,990 27,426 32,982 19,287 79,972 46,713
40,937 29,323 304,654 144,362 53,983 47,494 59,368 30,474 113,351 77,968
1,612 0 66,444 36,545 16,952 6,252 22,914 25,962 39,866 32,214
8,703 9,663 90,073 69,501 34,647 22,401 35,065 33,123 69,712 55,524
10,959 3,971 94,168 66,689 15,257 7,567 36,801 30,509 52,058 38,076
53,186 39,221 293,741 219,732 33,640 22,906 45,481 57,750 79,121 80,656
2,901 3,697 52,644 46,303 13,668 9,158 18,401 15,786 32,069 24,944
35,457 29,479 239,453 142,002 19,760 3,320 23,608 12,187 43,368 15,507
3,546 4,519 24,819 29,113 7,788 4,630 7,985 8,131 15,773 12,761
14,183 2,367 119,893 88,029 26,647 15,141 41,662 30,616 68,309 45,757
117,653 79,967 617,224 392,751 59,704 43,291 53,119 32,459 112,823 75,750
31,589 30,262 228,627 187,864 56,049 39,170 21,525 13,202 77,574 52,372
21,274 18,544 189,075 120,198 51,917 45,420 71,520 35,515 123,437 80,935
5,157 5,144 65,587 44,584 12,185 0 10,415 4,472 22,600 4,472
19,018 12,813 211,784 82,814 65,002 45,094 15,970 22,626 80,972 67,720
20,307 10,172 193,872 110,034 19,548 15,593 38,537 21,531 58,085 37,124
74,138 51,643 564,100 342,362 62,724 22,889 126,027 81,794 188,751 104,683
22,241 5,497 122,621 59,454 34,541 33,736 17,706 22,134 52,247 55,870
47,384 26,115 315,493 205,433 37,772 7,471 40,967 16,811 78,739 24,282
22,241 21,204 163,136 105,473 57,162 49,338 61,104 42,712 118,266 92,050
20,952 15,278 141,252 70,265 48,261 38,352 43,398 32,246 91,659 70,598
33,845 30,281 174,336 145,078 20,449 18,972 62,146 49,630 82,595 68,602
34,813 28,658 230,369 206,078 25,747 25,106 30,552 25,069 56,299 50,175
34,490 26,819 230,874 201,626 36,872 25,927 33,329 38,919 70,201 64,846
12,249 11,326 83,980 42,524 6,357 741 14,234 11,450 20,591 12,191
22,564 11,620 262,025 158,239 67,386 50,765 85,754 70,303 153,140 121,068
283,657 237,261 1,264,821 911,395 257,624 122,025 289,897 168,132 547,521 290,157
48,995 41,020 305,509 250,473 70,353 113,229 58,674 44,250 129,027 157,479
46,739 29,577 220,870 191,678 44,394 3,529 61,798 51,213 106,192 54,742
38,358 21,752 234,008 188,074 39,361 34,126 32,635 45,269 71,996 79,395
10,959 12,538 139,468 90,090 34,860 26,245 37,501 25,225 72,361 51,470
3,000,000 2,204,702 18,000,000 12,601,059 3,000,000 2,101,840 3,000,000 2,061,022 6,000,000 4,162,862
Basic Skills
Total Quality PBF$
College Transfer
Performance
Basic Skills Student
Progress
GED Dipolma Passing
Rate
(excluding Basic Skills)
Total Quality PBF$
88
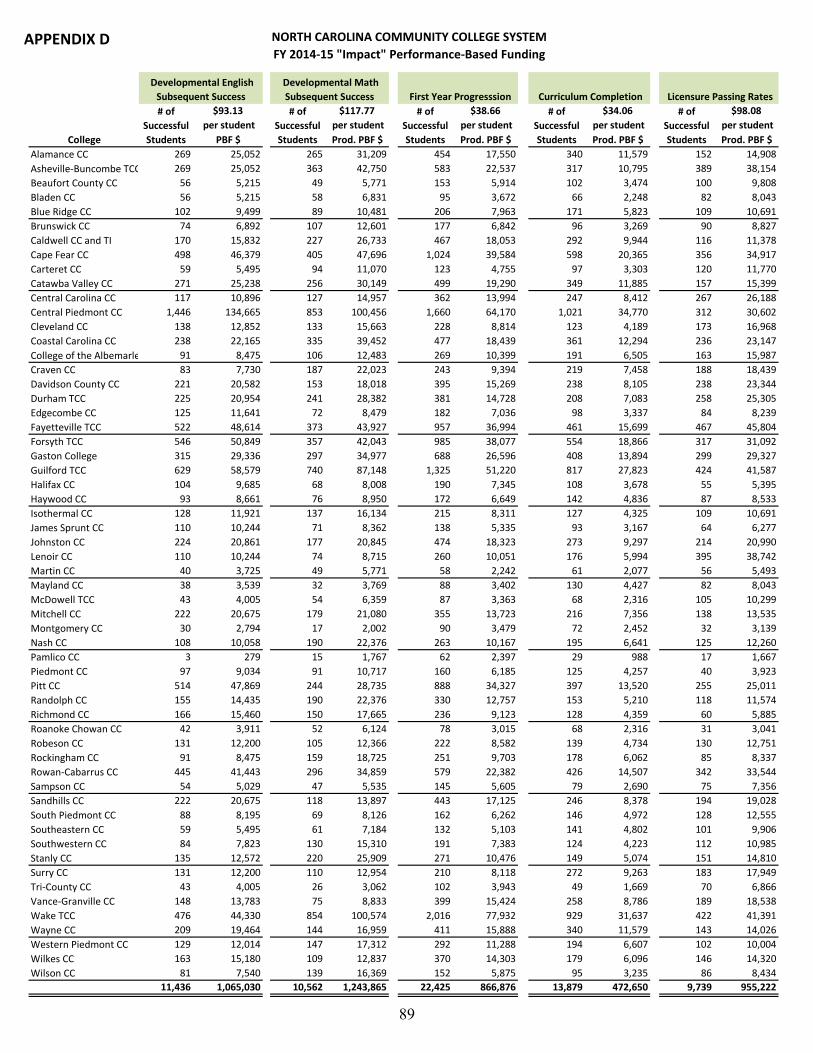
APPENDIX D NORTH CAROLINA COMMUNITY COLLEGE SYSTEM
FY 2014-15 "Impact" Performance-Based Funding
$93.13 $117.77 $38.66 $34.06 $98.08
per student per student per student per student per student
College PBF $ Prod. PBF $ Prod. PBF $ Prod. PBF $ Prod. PBF $
Alamance CC 269 25,052 265 31,209 454 17,550 340 11,579 152 14,908
Asheville-Buncombe TCC 269 25,052 363 42,750 583 22,537 317 10,795 389 38,154
Beaufort County CC 56 5,215 49 5,771 153 5,914 102 3,474 100 9,808
Bladen CC 56 5,215 58 6,831 95 3,672 66 2,248 82 8,043
Blue Ridge CC 102 9,499 89 10,481 206 7,963 171 5,823 109 10,691
Brunswick CC 74 6,892 107 12,601 177 6,842 96 3,269 90 8,827
Caldwell CC and TI 170 15,832 227 26,733 467 18,053 292 9,944 116 11,378
Cape Fear CC 498 46,379 405 47,696 1,024 39,584 598 20,365 356 34,917
Carteret CC 59 5,495 94 11,070 123 4,755 97 3,303 120 11,770
Catawba Valley CC 271 25,238 256 30,149 499 19,290 349 11,885 157 15,399
Central Carolina CC 117 10,896 127 14,957 362 13,994 247 8,412 267 26,188
Central Piedmont CC 1,446 134,665 853 100,456 1,660 64,170 1,021 34,770 312 30,602
Cleveland CC 138 12,852 133 15,663 228 8,814 123 4,189 173 16,968
Coastal Carolina CC 238 22,165 335 39,452 477 18,439 361 12,294 236 23,147
College of the Albemarle 91 8,475 106 12,483 269 10,399 191 6,505 163 15,987
Craven CC 83 7,730 187 22,023 243 9,394 219 7,458 188 18,439
Davidson County CC 221 20,582 153 18,018 395 15,269 238 8,105 238 23,344
Durham TCC 225 20,954 241 28,382 381 14,728 208 7,083 258 25,305
Edgecombe CC 125 11,641 72 8,479 182 7,036 98 3,337 84 8,239
Fayetteville TCC 522 48,614 373 43,927 957 36,994 461 15,699 467 45,804
Forsyth TCC 546 50,849 357 42,043 985 38,077 554 18,866 317 31,092
Gaston College 315 29,336 297 34,977 688 26,596 408 13,894 299 29,327
Guilford TCC 629 58,579 740 87,148 1,325 51,220 817 27,823 424 41,587
Halifax CC 104 9,685 68 8,008 190 7,345 108 3,678 55 5,395
Haywood CC 93 8,661 76 8,950 172 6,649 142 4,836 87 8,533
Isothermal CC 128 11,921 137 16,134 215 8,311 127 4,325 109 10,691
James Sprunt CC 110 10,244 71 8,362 138 5,335 93 3,167 64 6,277
Johnston CC 224 20,861 177 20,845 474 18,323 273 9,297 214 20,990
Lenoir CC 110 10,244 74 8,715 260 10,051 176 5,994 395 38,742
Martin CC 40 3,725 49 5,771 58 2,242 61 2,077 56 5,493
Mayland CC 38 3,539 32 3,769 88 3,402 130 4,427 82 8,043
McDowell TCC 43 4,005 54 6,359 87 3,363 68 2,316 105 10,299
Mitchell CC 222 20,675 179 21,080 355 13,723 216 7,356 138 13,535
Montgomery CC 30 2,794 17 2,002 90 3,479 72 2,452 32 3,139
Nash CC 108 10,058 190 22,376 263 10,167 195 6,641 125 12,260
Pamlico CC 3 279 15 1,767 62 2,397 29 988 17 1,667
Piedmont CC 97 9,034 91 10,717 160 6,185 125 4,257 40 3,923
Pitt CC 514 47,869 244 28,735 888 34,327 397 13,520 255 25,011
Randolph CC 155 14,435 190 22,376 330 12,757 153 5,210 118 11,574
Richmond CC 166 15,460 150 17,665 236 9,123 128 4,359 60 5,885
Roanoke Chowan CC 42 3,911 52 6,124 78 3,015 68 2,316 31 3,041
Robeson CC 131 12,200 105 12,366 222 8,582 139 4,734 130 12,751
Rockingham CC 91 8,475 159 18,725 251 9,703 178 6,062 85 8,337
Rowan-Cabarrus CC 445 41,443 296 34,859 579 22,382 426 14,507 342 33,544
Sampson CC 54 5,029 47 5,535 145 5,605 79 2,690 75 7,356
Sandhills CC 222 20,675 118 13,897 443 17,125 246 8,378 194 19,028
South Piedmont CC 88 8,195 69 8,126 162 6,262 146 4,972 128 12,555
Southeastern CC 59 5,495 61 7,184 132 5,103 141 4,802 101 9,906
Southwestern CC 84 7,823 130 15,310 191 7,383 124 4,223 112 10,985
Stanly CC 135 12,572 220 25,909 271 10,476 149 5,074 151 14,810
Surry CC 131 12,200 110 12,954 210 8,118 272 9,263 183 17,949
Tri-County CC 43 4,005 26 3,062 102 3,943 49 1,669 70 6,866
Vance-Granville CC 148 13,783 75 8,833 399 15,424 258 8,786 189 18,538
Wake TCC 476 44,330 854 100,574 2,016 77,932 929 31,637 422 41,391
Wayne CC 209 19,464 144 16,959 411 15,888 340 11,579 143 14,026
Western Piedmont CC 129 12,014 147 17,312 292 11,288 194 6,607 102 10,004
Wilkes CC 163 15,180 109 12,837 370 14,303 179 6,096 146 14,320
Wilson CC 81 7,540 139 16,369 152 5,875 95 3,235 86 8,434
11,436 1,065,030 10,562 1,243,865 22,425 866,876 13,879 472,650 9,739 955,222
Curriculum Completion
Developmental English
Subsequent Success
Developmental Math
Subsequent Success Licensure Passing Rates First Year Progresssion
# of
Successful
Students
# of
Successful
Students
# of
Successful
Students
# of
Successful
Students
# of
Successful
Students
89
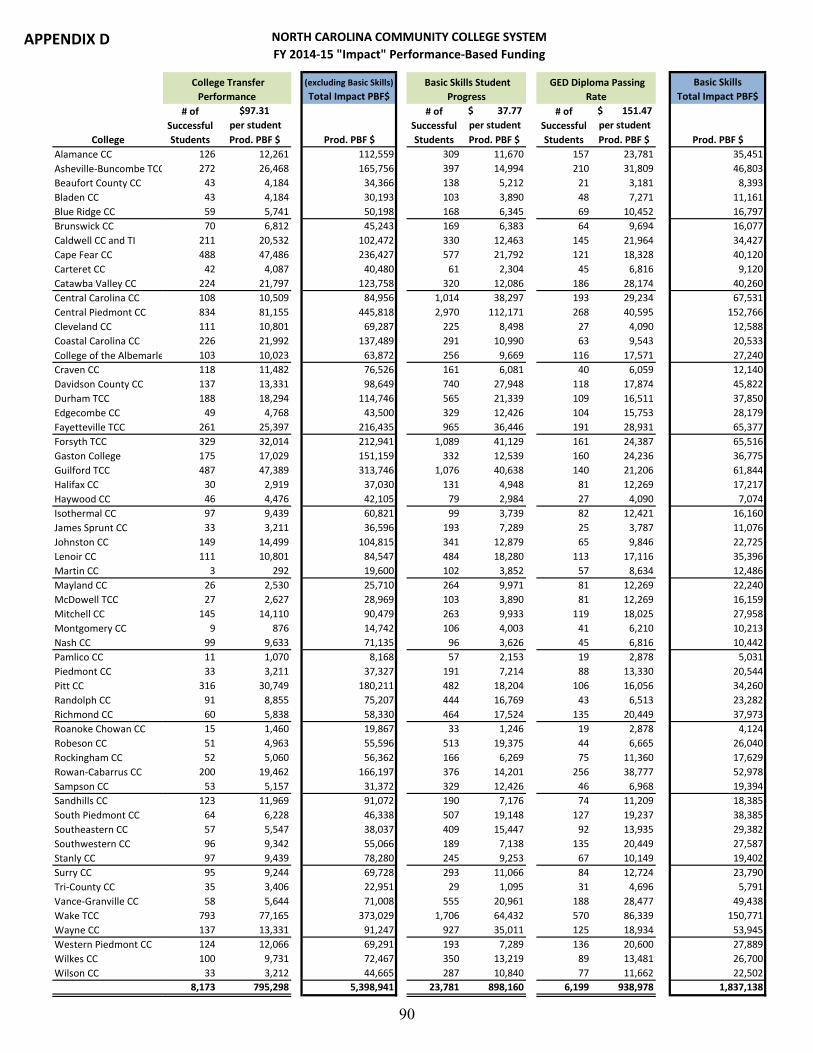
APPENDIX D NORTH CAROLINA COMMUNITY COLLEGE SYSTEM
FY 2014-15 "Impact" Performance-Based Funding
College
Alamance CC
Asheville-Buncombe TCC
Beaufort County CC
Bladen CC
Blue Ridge CC
Brunswick CC
Caldwell CC and TI
Cape Fear CC
Carteret CC
Catawba Valley CC
Central Carolina CC
Central Piedmont CC
Cleveland CC
Coastal Carolina CC
College of the Albemarle
Craven CC
Davidson County CC
Durham TCC
Edgecombe CC
Fayetteville TCC
Forsyth TCC
Gaston College
Guilford TCC
Halifax CC
Haywood CC
Isothermal CC
James Sprunt CC
Johnston CC
Lenoir CC
Martin CC
Mayland CC
McDowell TCC
Mitchell CC
Montgomery CC
Nash CC
Pamlico CC
Piedmont CC
Pitt CC
Randolph CC
Richmond CC
Roanoke Chowan CC
Robeson CC
Rockingham CC
Rowan-Cabarrus CC
Sampson CC
Sandhills CC
South Piedmont CC
Southeastern CC
Southwestern CC
Stanly CC
Surry CC
Tri-County CC
Vance-Granville CC
Wake TCC
Wayne CC
Western Piedmont CC
Wilkes CC
Wilson CC
(excluding Basic Skills)
Total Impact PBF$
Basic Skills
Total Impact PBF$
$97.31 $ 37.77 $ 151.47
per student per student per student
Prod. PBF $ Prod. PBF $ Prod. PBF $ Prod. PBF $ Prod. PBF $
126 12,261 112,559 309 11,670 157 23,781 35,451
272 26,468 165,756 397 14,994 210 31,809 46,803
43 4,184 34,366 138 5,212 21 3,181 8,393
43 4,184 30,193 103 3,890 48 7,271 11,161
59 5,741 50,198 168 6,345 69 10,452 16,797
70 6,812 45,243 169 6,383 64 9,694 16,077
211 20,532 102,472 330 12,463 145 21,964 34,427
488 47,486 236,427 577 21,792 121 18,328 40,120
42 4,087 40,480 61 2,304 45 6,816 9,120
224 21,797 123,758 320 12,086 186 28,174 40,260
108 10,509 84,956 1,014 38,297 193 29,234 67,531
834 81,155 445,818 2,970 112,171 268 40,595 152,766
111 10,801 69,287 225 8,498 27 4,090 12,588
226 21,992 137,489 291 10,990 63 9,543 20,533
103 10,023 63,872 256 9,669 116 17,571 27,240
118 11,482 76,526 161 6,081 40 6,059 12,140
137 13,331 98,649 740 27,948 118 17,874 45,822
188 18,294 114,746 565 21,339 109 16,511 37,850
49 4,768 43,500 329 12,426 104 15,753 28,179
261 25,397 216,435 965 36,446 191 28,931 65,377
329 32,014 212,941 1,089 41,129 161 24,387 65,516
175 17,029 151,159 332 12,539 160 24,236 36,775
487 47,389 313,746 1,076 40,638 140 21,206 61,844
30 2,919 37,030 131 4,948 81 12,269 17,217
46 4,476 42,105 79 2,984 27 4,090 7,074
97 9,439 60,821 99 3,739 82 12,421 16,160
33 3,211 36,596 193 7,289 25 3,787 11,076
149 14,499 104,815 341 12,879 65 9,846 22,725
111 10,801 84,547 484 18,280 113 17,116 35,396
3 292 19,600 102 3,852 57 8,634 12,486
26 2,530 25,710 264 9,971 81 12,269 22,240
27 2,627 28,969 103 3,890 81 12,269 16,159
145 14,110 90,479 263 9,933 119 18,025 27,958
9 876 14,742 106 4,003 41 6,210 10,213
99 9,633 71,135 96 3,626 45 6,816 10,442
11 1,070 8,168 57 2,153 19 2,878 5,031
33 3,211 37,327 191 7,214 88 13,330 20,544
316 30,749 180,211 482 18,204 106 16,056 34,260
91 8,855 75,207 444 16,769 43 6,513 23,282
60 5,838 58,330 464 17,524 135 20,449 37,973
15 1,460 19,867 33 1,246 19 2,878 4,124
51 4,963 55,596 513 19,375 44 6,665 26,040
52 5,060 56,362 166 6,269 75 11,360 17,629
200 19,462 166,197 376 14,201 256 38,777 52,978
53 5,157 31,372 329 12,426 46 6,968 19,394
123 11,969 91,072 190 7,176 74 11,209 18,385
64 6,228 46,338 507 19,148 127 19,237 38,385
57 5,547 38,037 409 15,447 92 13,935 29,382
96 9,342 55,066 189 7,138 135 20,449 27,587
97 9,439 78,280 245 9,253 67 10,149 19,402
95 9,244 69,728 293 11,066 84 12,724 23,790
35 3,406 22,951 29 1,095 31 4,696 5,791
58 5,644 71,008 555 20,961 188 28,477 49,438
793 77,165 373,029 1,706 64,432 570 86,339 150,771
137 13,331 91,247 927 35,011 125 18,934 53,945
124 12,066 69,291 193 7,289 136 20,600 27,889
100 9,731 72,467 350 13,219 89 13,481 26,700
33 3,212 44,665 287 10,840 77 11,662 22,502
8,173 795,298 5,398,941 23,781 898,160 6,199 938,978 1,837,138
Basic Skills Student
Progress
GED Diploma Passing
Rate
# of
Successful
Students
# of
Successful
Students
# of
Successful
Students
College Transfer
Performance
90

Appendix E: Revised Purpose and Vocational Codes
110 Executive Management
120 Financial Services
130 General Admin
140 Information Systems (Admin)
220 Curriculum Instruction
310 Occupational
311 Occupational Extention - Support
320 Basic Skills Plus
321 ABE/ESL
322 Adult High School
323 Compensatory Ed
324 General Ed Dev - GED
325 Basic Skills Administration
357 Project Skill Up - Calendar Year 2014
358 Project Skill Up - Calendar Year 2015
359 Local Capacity Building 10%/5%
360 Regional Capacity Building 8%
361 Customized Training Projects
363 Small Business
364 Business and Industry Support - Administrative
365 Business and Industry Support - Instructional
367 BioNetwork Special Projects
369 BioNetwork Centers
370 FTCC - Military Business Center
371 Kannapolis - Rowan
373 Literacy Special Projects
410 Library
421 Curriculum Admin
422 Continuing Education Admin
430 Information Systems (Academic)
450 HB275 Technology
510 Student Services
530 Child Care - State Appropriation
680 Innovation Quarters (Forsyth Tech CC)
920 Equipment
921 Equipment Reserve
922 HB275 Equipment
923 Equipment - Literacy
930 Instructional Resources - Books
940 Categorical Equipment
Note: Colleges are prohibited from creating purpose codes for use with state funds and may only use the
purpose codes listed above as prescribed by the Accounting Procedures Manual.
NORTH CAROLINA COMMUNITY COLLEGE SYSTEMFY 2014-15 PURPOSE CODES
91

Appendix E: Revised Purpose and Vocational Codes
10 Aca. Integ/Post 2Nd. 55 Accounts Receivable Clearing
11 All Aspects of an Industry 56 Voed Prof Development
12 Use Tech. & Prof Dev 57 Vacant
13 Administration 58 Vacant
14 Mod.& Exp-Upgrading Curriculum 59 Kannapolis-Rowan-Eq.
15 Services & Activities 60 NC Back-to-Work
16 Equipment 61 Vacant
17 Guidance & Counseling 62 Vacant
18 Non-Trad.Trng.& Empl. 63 Vacant
19 Supp Per/Instr Sup, Aids, and Devices 64 Vacant
20 Non-Federal Matching 65 Vacant
21 Vacant 66 Vacant
22 Vacant 67 Gaston-Textile
23 Vacant 68 Vacant
24 Vacant 69 Ready For College
25 Vacant 70 CRC Perf Incentive Grant
26 Vacant 71 Hicost (Marine Technology)
27 Vacant 72 Basic Skills Grants (Post & Mini)
28 Vacant 73 Vacant
29 Vacant 74 ABE CASAS
30 CIP 75 ABE Ideal/Path/Family Literacy
31 VLC - St Appropriation 76 ABE English Literacy/Civics
32 Vacant 77 ABE Innovations/Transitions
33 Vacant 78 Vacant
34 Vacant 79 Gate
35 Vacant 80 Misc Non-Formula Allotment36 Vacant 81 Prison - Designated
37 Vacant 82 Prison - Discretionary
38 Voed Teaching Excellence 83 SBC Equipment
39 Vacant 84 Vacant
40 FTCC-Military Business Eq 85 Vacant
41 Vacant 86 Vacant
42 Vacant 87 CVCC - CEMS
43 Bio Eq Ctrs Approp. 88 Project Skill-Up Equipment
44 Bio Eq.-Grant 89 Vacant
45 LCC - Motorcycle Safety 90 Vacant
46 Vacant 91 Vacant
47 FTCC - Botanical Lab 92 Campus Security
48 Vacant 93 Vacant
49 Vacant 94 Minority Male Mentoring
50 Vacant 95 College Access Challenge Grant
51 Vacant 96 Vacant
52 Vacant 97 Formula Expenditure***53 Enroll. Reserve Op.*** 98 Vacant
***54 Enroll. Reserve Eq.*** 99 Vacant
***Vocational Codes 53-54 N/A For Fiscal Year 2014-15***
Note: Colleges are prohibited from creating vocational codes for use with state funds and may only use the
vocational codes listed above as prescribed by the Accounting Procedures Manual.
NORTH CAROLINA COMMUNITY COLLEGE SYSTEMFY 2014-15 VOCATIONAL CODES
92
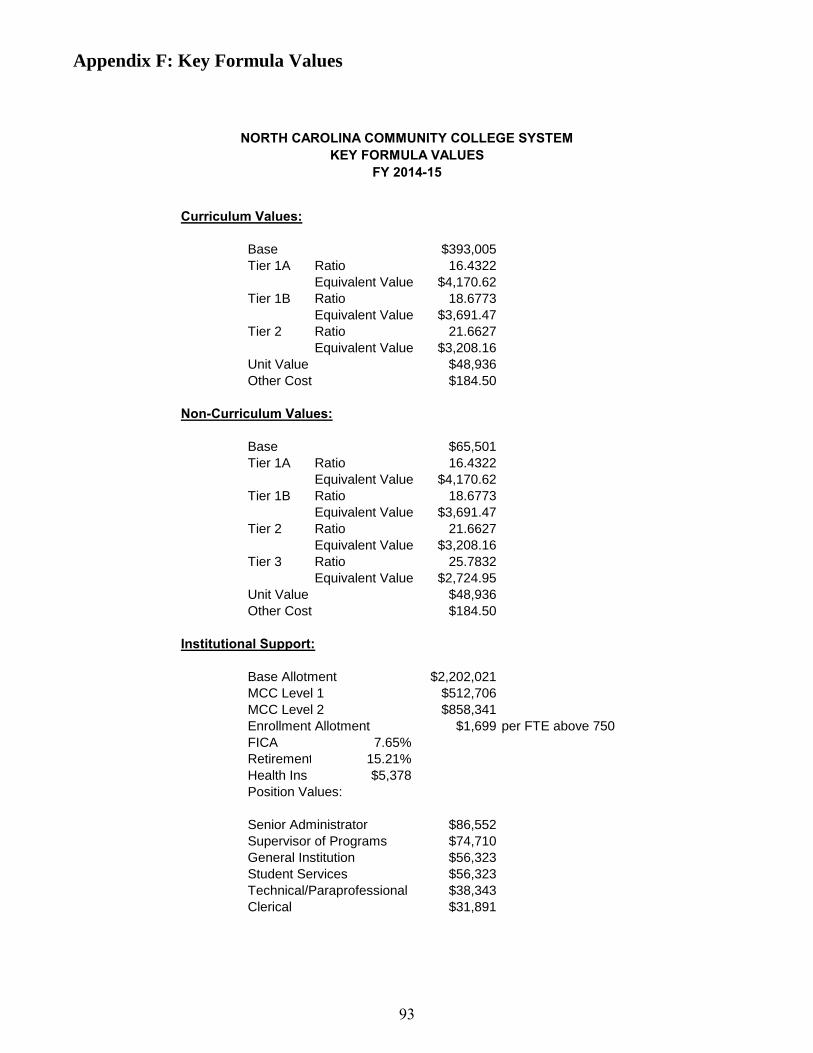
Appendix F: Key Formula Values
NORTH CAROLINA COMMUNITY COLLEGE SYSTEMKEY FORMULA VALUES
FY 2014-15
Curriculum Values:
Base $393,005
Tier 1A Ratio 16.4322
Equivalent Value $4,170.62
Tier 1B Ratio 18.6773
Equivalent Value $3,691.47
Tier 2 Ratio 21.6627
Equivalent Value $3,208.16
Unit Value $48,936
Other Cost $184.50
Non-Curriculum Values:
Base $65,501
Tier 1A Ratio 16.4322
Equivalent Value $4,170.62
Tier 1B Ratio 18.6773
Equivalent Value $3,691.47
Tier 2 Ratio 21.6627
Equivalent Value $3,208.16
Tier 3 Ratio 25.7832
Equivalent Value $2,724.95
Unit Value $48,936
Other Cost $184.50
Institutional Support:
Base Allotment $2,202,021
MCC Level 1 $512,706
MCC Level 2 $858,341
Enrollment Allotment $1,699 per FTE above 750
FICA 7.65%
Retirement 15.21%
Health Ins $5,378
Position Values:
Senior Administrator $86,552
Supervisor of Programs $74,710
General Institution $56,323
Student Services $56,323
Technical/Paraprofessional $38,343
Clerical $31,891
93
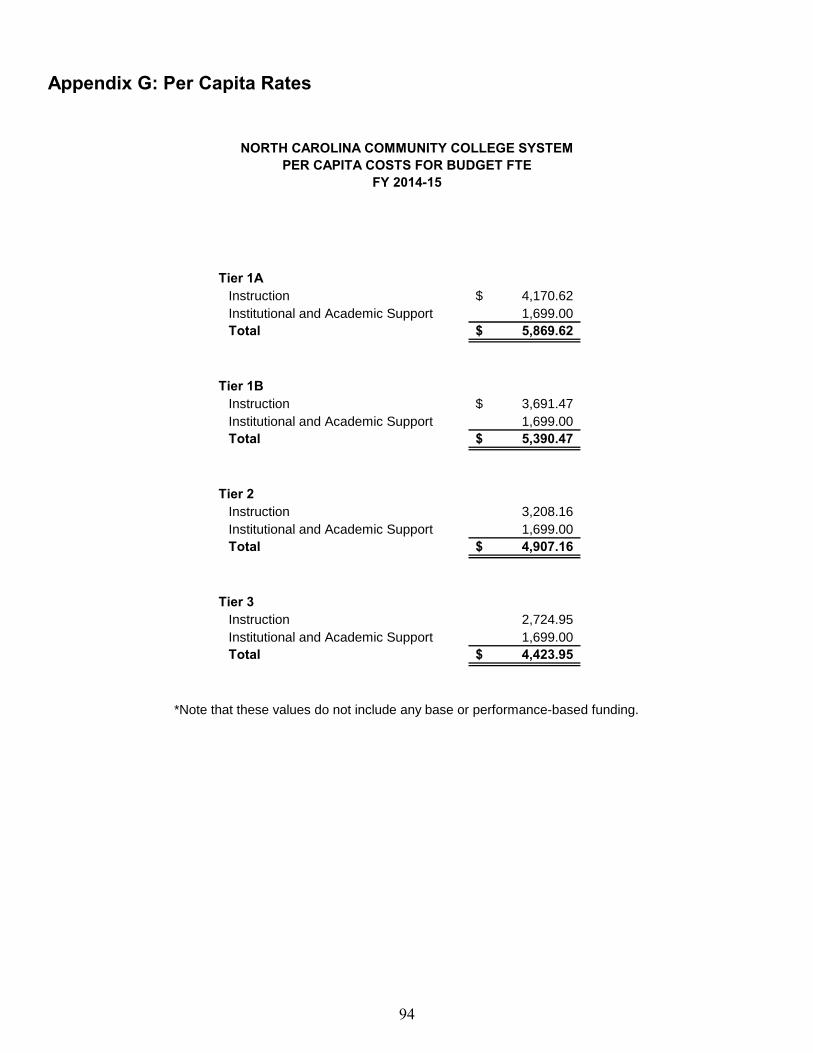
Appendix G: Per Capita Rates
NORTH CAROLINA COMMUNITY COLLEGE SYSTEMPER CAPITA COSTS FOR BUDGET FTE
FY 2014-15
Tier 1AInstruction 4,170.62$
Institutional and Academic Support 1,699.00
Total 5,869.62$
Tier 1BInstruction 3,691.47$
Institutional and Academic Support 1,699.00
Total 5,390.47$
Tier 2 Instruction 3,208.16
Institutional and Academic Support 1,699.00
Total 4,907.16$
Tier 3Instruction 2,724.95
Institutional and Academic Support 1,699.00
Total 4,423.95$
*Note that these values do not include any base or performance-based funding.
94