Embed Size (px)
Citation preview

FY 2010 MFO BUDGET
By MFO/By Expense Class (In Thousand Pesos)
Particulars PS MOOE CO Total % Share
MFO 1 Public Pre-Elem and Elementary Education Services
97,530,209
11,378,527
6,477,384
115,386,120
66.76%
MFO 2 Public Secondary Education Services
41,770,705
5,164,802
2,870,829
49,806,336
28.82%
MFO 3 Alternative Learning System
36,418
484,675
-
521,093
0.30%
MFO 4 Basic Education Sector Management Services
1,377,451
1,200,294
440,490
3,018,235
1.75%
MFO 5 Regulatory and Development Services
-
2,145
-
2,145
0.00%
MFO 6 Gov’t Assistance to Students & Teachers in Private Education (GASTPE) Services
-
3,939,560
3,939,560
2.28%
MFO 7 Informal Education Services
69,374
78,273
147,647
0.09%
MFO 8 Book Industry Development Services
10,190
11,404
21,594
0.01%
TOTAL 140,794,347 22,259,680 9,788,703 172,842,730
% Share 81.46% 12.88% 5.66% 100.00%
By MFO (Total Budget = P172,842,730,000)
MFO 1 66.76%
MFO 2 28.82%
MFO 3 0.30%
MFO 4 1.75%
MFO 5 0.00%
MFO 6 2.28%
MFO 7 0.09%
MFO 8 0.01%

By Agency/By MFO (In Thousand Pesos)
Particulars
MFO1 MFO2 MFO3 MFO4 MFO5 MFO6 MFO7 MFO8 Total % share Public Pre-
Elem & Elem Educ.
Services
Pubic Secondary Education Services
Alternative Learning System Services
Basic Education
Sector Management
Services
Regulatory & Dev’t
Services
GASTPE Services
Informal Education Services
Book Industry
Development Services
National Book Development Board
21,594
21,594
0.016%
National Council for Children’s Television
9,765
9,765
0.003%
National Mesuem 127,091 127,091 0.079%
Philippine HS for the Arts
35,669
10,791
46,460
0.030%
OSEC 115,386,120 49,770,667 521,093 3,018,235 2,145 3,939,560 172,637,820 99.872%
Total 115,386,120 49,806,336 521,093 3,018,235 2,145 3,939,560 147,647 21,594 172,842,730 100.000%
% Share 66.76% 28.82% 0.30% 1.75% 0.00% 2.28% 0.09% 0.01% 100.00%
By Agency/By Expense Class (In Thousand Pesos)
Particulars PS MOOE CO TOTAL % SHARE
National Book Development Board 10,190 11,404 - 21,594 0.012%
National Council for Children’s Television 1,500 8,265 - 9,765 0.006%
National Mesum 62,135 64,956 - 127,091 0.074%
Philippine High School for the Arts 11,661 34,799 - 46,460 0.027%
DepEd – OSEC 140,708,861 22,140,256 9,788,703 172,637,820 99.881%
TOTAL 140,794,347 22,259,680 9,788,703 172,842,730 100.00
% Share 81.46% 12.88% 5.66% 100.00%
By Expense Class (Total Budget = P 172,842,730,000)
PS 81.46%
MOOE 12.88%
CO 5.66%

Department of Education – Office of the Secretary
PERFORMANCE MEASURES AND TARGETS (Amounts in Thousand Pesos)
Particulars FY 2008 FY 2009 FY 2010
Actual/Amount Target/Amount Target/Amount MFO 1 Public Pre-Elementary and Elementary Education Services
Enrolment in DepEd % DepEd-contracted pre-schools
No. Of public pre-school completers
No. Of public pre-school children who passed Grade 1 (G1) readiness test administered
% of underweight preschool children Public Elementary Education Services
Enrolment in public elementary schools
Participation rate
Completion rate
Percent of Grade 3(G3) effective readers (instructional level) to the total G3 enrolees English Filipino
Mean Percentage Scores in National Achievement Test (NAT) of Grade 6 (G6) in public schools Total Test English Science Math Filipino HeKaSi
% of underweight children to the total no. Of G1-G6 enrolees
104,304,831
114,320,707
115,386,120
746,443
736,625 Not yet
Available (NYA)
12,562,272 77.66% 72.16%
No Data Availabe (NDA)
66.33 62.14 59.63 68.70
72.21 68.99
NYA
809,711
801,613 721,452
6.00%
13,071,152 79.14% 76.69%
81.56% 82.90%
70.00 66.81 63.09 69.08 78.37 77.82
12.00%
878,281
869,399 808,541
4.00%
13,607,517 81.24% 80.15%
84.56% 85.00%
75.04 75.12 68.92 74.27 82.18 77.82
MFO 2 Public Secondary Education Services
44,805,273
48,949,511
49,770,667
Enrolment in public secondary schools
Participation rate
Completion rate
MPS in NAT of Year II (Y-II) students in public secondary schools
Total Test English Science Math Filipino Araling Panlipunan
MPs in National Career Assessment Exam (NCAE) of Year IV (Y-IV) students in public secondary schools
Gen. Scholastic Aptitude Tech. Voc. Aptitude Non-Verbal Ability Enterpreneurial Skills
5,378,756 46.85% 72.34%
47.40 52.37 43.40 39.53 51.21 50.51
43.88 58.68
NYA 71.69
5,510,322 47.05% 76.53%
53.25 57.80 50.50 46.32 51.48 60.13
50.22 62.44 52.05 76.35
5,754,477 48.15% 78.56%
57.56 62.48 54.58 50.07 55.65 65.00
54.84 65.75 56.52 77.72

Particulars FY 2008 FY 2009 FY 2010
Actual/Amount Target/Amount Target/Amount MFO 3 Alternative Learning System (ALS) Services
Ratio of completers to total no. of learners in DepEd-delivered ALS programs
Ratio of completers to total no. of learners in DepEd-procured ALS progams
Ratio of test passers to total no. of test takers of Accreditation and Equivalency (A& E) Test
446,230
346,524
521,093
1:1.3
1:1.4
1:4
1:1.3
1:1.3
1:4
1:1.3
1:1.2
1:4
MFO 4 Basic Education Sector Management Services
No. of policies to be reviewed, assessed and formulated for the current year
% of basic education sector policies and standards adopted by Teacher Education Council (TEC), TESDA, CHED, PRC adn Civil Service Commission to total no. of policies for formulated
3,056,850
6,304,870
3,018,235
21
5.00%
16
30.00%
MFO 5 Regulatory and Development Services
Ratio of non-DepEd preschools with permit to operate as a proportion to total number of non-DepEd pre schools
Ratio of private elementary schools with permit to operate to the total number of private elementary schools
Ratio of private secondary schools with government recognition to the total no. of private secondary schools with DepEd permit to operate
-
-
2,145
MFO 6 Government Assistance to Students and Teachers in Private Education (GASTPE) Services
2,907,999
4,288,747
3,939,560
Ratio of Education Service Contracting (ESC) completers to ESC grantees
Ratio of Education Voucher System (EVS) completers to EVS grantees
MPS in NCAE ESC grantees
EVS grantees
NDA 25:25
25:25
52.47
25:25
25:25
54.05
TOTAL 1/ 155,521,183 174,210,359 172,637,820
Note: Data for public elementary and secondary enrolment, completion and participation rate exculde SUCs. 1/ -Includes Special Purpose Fund – DepEd School Building Program and RLIP

FY 2010 MFO BUDGET
By MFO/By Expense Class (In Thousand Pesos)
Particulars PS MOOE CO TOTAL % Share MFO 1 Public Pre-Elementary and Elementary Education Services MFO 2 Public Secondary Education Services MFO 3 Alternative Learning System (ALS) Services MFO 4 Basic Education Sector Management Services MFO 5 Regulatory and Development Services MFO 6 Government Assistance to Students and Teachers in Private Education (GASTPE) Services
97,530,209
41,764,783
36,418
1,377,451
-
-
11,378,527
5,135,055
484,675
1,200,294
2,145
3,939,560
6,477,384
2,870,829
-
440,490
-
115,386,120
49,770,667
521,093
3,018,235
2,145
3,939,560
66.84%
28.83%
0.30%
1.75%
0.00%
2.28%
TOTAL 140,708,861 22,140,256 9,788,703 172,637,820* 100.00% % Share 81.51% 12.82% 5.67% 100.00%
*Including Specila Purpose Fund-DepEd School Building Program, and RLIP
By MFO (Total Budget = P 172,637,820,000)
By Expense Class
(Total Budget = P167,723,659,000)
MFO 1 66.84%
MFO 2 28.83%
MFO 3 0.30%
MFO 4 1.75%
MFO 5 0.00%
MFO 6 2.28%
PS 81.51%
MOOE 12.82%
CO 5.67%
National Book Development Board
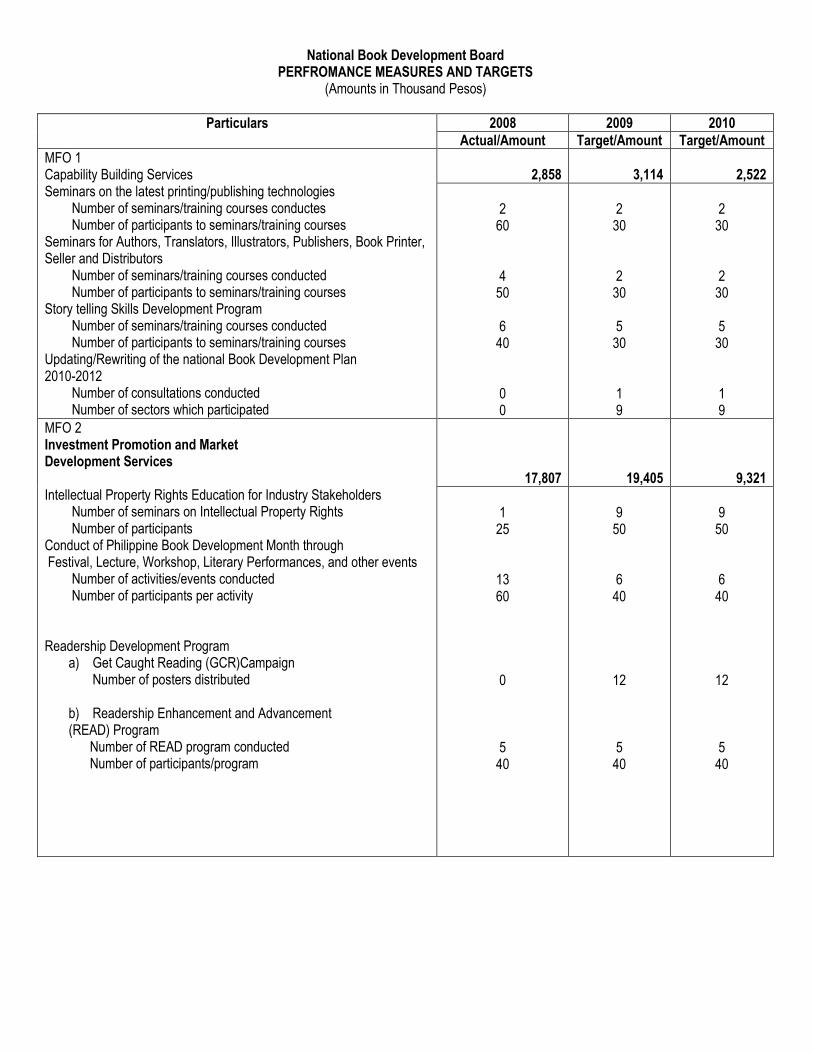
PERFROMANCE MEASURES AND TARGETS (Amounts in Thousand Pesos)
Particulars 2008 2009 2010
Actual/Amount Target/Amount Target/Amount
MFO 1 Capability Building Services Seminars on the latest printing/publishing technologies
Number of seminars/training courses conductes Number of participants to seminars/training courses
Seminars for Authors, Translators, Illustrators, Publishers, Book Printer, Seller and Distributors
Number of seminars/training courses conducted Number of participants to seminars/training courses
Story telling Skills Development Program Number of seminars/training courses conducted Number of participants to seminars/training courses
Updating/Rewriting of the national Book Development Plan 2010-2012
Number of consultations conducted Number of sectors which participated
2,858
3,114
2,522
2
60
4 50
6
40
0 0
2
30
2 30
5
30
1 9
2
30
2 30
5
30
1 9
MFO 2 Investment Promotion and Market Development Services Intellectual Property Rights Education for Industry Stakeholders
Number of seminars on Intellectual Property Rights Number of participants
Conduct of Philippine Book Development Month through Festival, Lecture, Workshop, Literary Performances, and other events
Number of activities/events conducted Number of participants per activity
Readership Development Program
a) Get Caught Reading (GCR)Campaign Number of posters distributed
b) Readership Enhancement and Advancement (READ) Program
Number of READ program conducted Number of participants/program
17,807
19,405
9,321
1
25
13 60
0
5 40
9
50
6 40
12
5 40
9
50
6 40
12
5 40

Particulars 2007 2008 2009
Actual/Amount Target/Amount Target/Amount
c) Get Caught reading (GCR) Campaign
Number of endoresement Number of media exposure Number of poems
d) Tulaan sa Tren (Train of Thought) Number of promotional materials produced Number of endorsement Number of poems
Promotion of quality books thru: a) Conduct of Quality Seal Awards (QSA) for textbooks
Number of private textbooks given QSA Number of entrees evaluated Percentage of books nominated for QSA process
b) Administration of National Book Awards (NBA) Number of NBA winners
c) National Textbook Review Services Number of private textbook titles evaluated
2 2 2
0 0 0
5 10
100%
26/18
8
2 2 2
2,000 10 40
2 10
100%
1 per
300
2 2 2
2,000 10 40
2 10
100%
1 per
300
MFO 3 Incentives Administration Services Registration of authors and Other Stakeholders in the book industry with the NBDB
Percentage increase in no. of registered entities
Grant of Incentives to Registered Entities Percentage of requests for incentives acted upon vs total application for tax incentives
1,319
10,890
9,751
17%
100%
10%
100%
15%
100%
Total
21,984
33,409
21,594
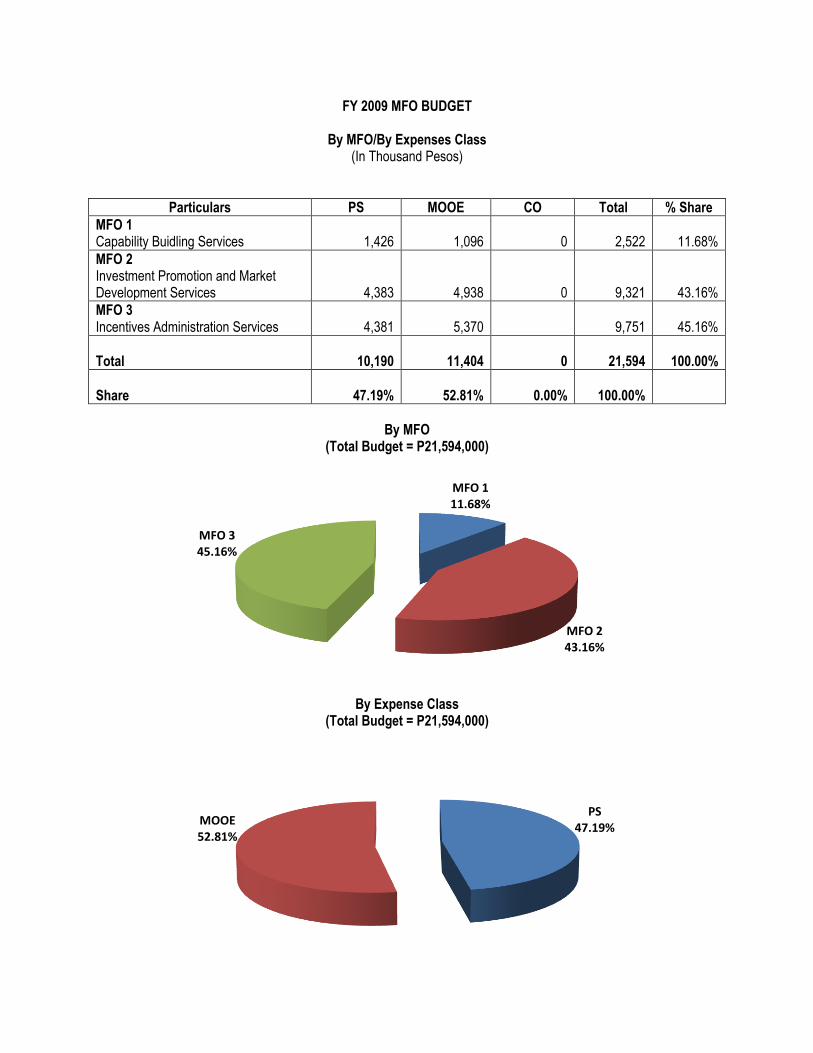
FY 2009 MFO BUDGET
By MFO/By Expenses Class (In Thousand Pesos)
Particulars PS MOOE CO Total % Share
MFO 1 Capability Buidling Services
1,426
1,096
0
2,522
11.68%
MFO 2 Investment Promotion and Market Development Services
4,383
4,938
0
9,321
43.16%
MFO 3 Incentives Administration Services
4,381
5,370
9,751
45.16%
Total
10,190
11,404
0
21,594
100.00%
Share
47.19%
52.81%
0.00%
100.00%
By MFO
(Total Budget = P21,594,000)
By Expense Class (Total Budget = P21,594,000)
MFO 1 11.68%
MFO 2 43.16%
MFO 3 45.16%
PS 47.19%
MOOE 52.81%
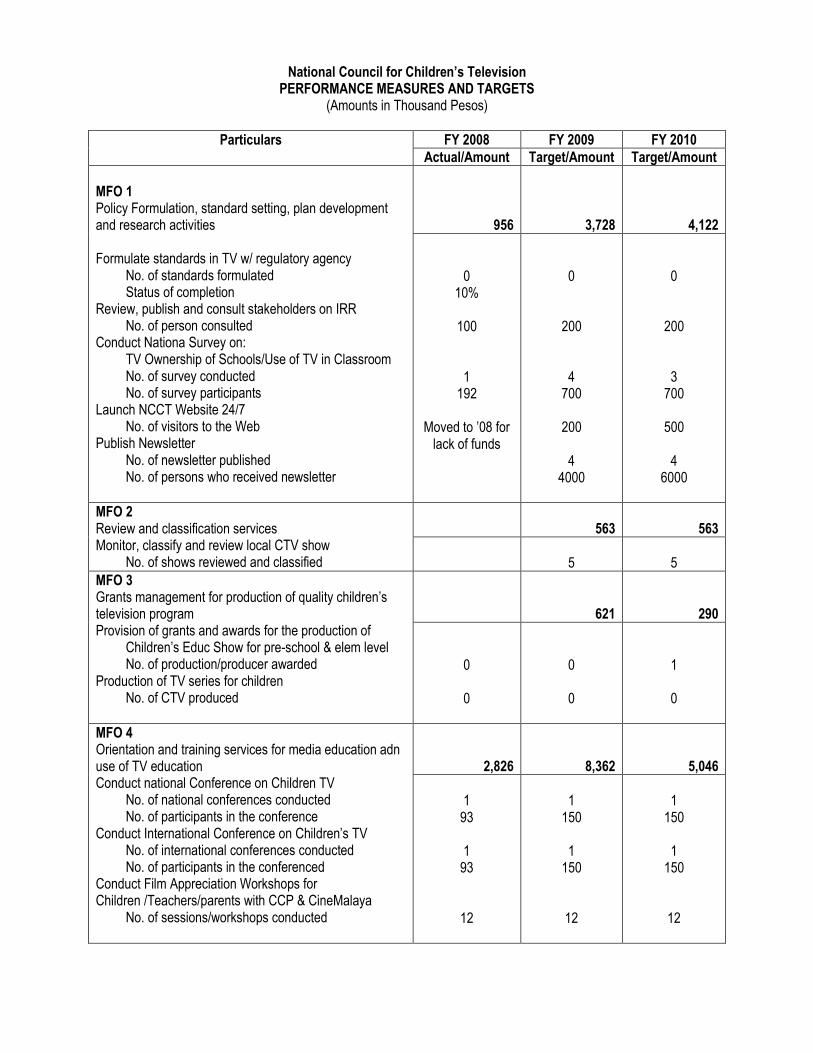
National Council for Children’s Television PERFORMANCE MEASURES AND TARGETS
(Amounts in Thousand Pesos)
Particulars FY 2008 FY 2009 FY 2010
Actual/Amount Target/Amount Target/Amount
MFO 1 Policy Formulation, standard setting, plan development and research activities Formulate standards in TV w/ regulatory agency
No. of standards formulated Status of completion
Review, publish and consult stakeholders on IRR No. of person consulted
Conduct Nationa Survey on: TV Ownership of Schools/Use of TV in Classroom No. of survey conducted No. of survey participants
Launch NCCT Website 24/7 No. of visitors to the Web
Publish Newsletter No. of newsletter published No. of persons who received newsletter
956
3,728
4,122
0 10%
100
1 192
Moved to ’08 for
lack of funds
0
200
4 700
200
4
4000
0
200
3 700
500
4
6000
MFO 2 Review and classification services Monitor, classify and review local CTV show
No. of shows reviewed and classified
563
563
5
5
MFO 3 Grants management for production of quality children’s television program Provision of grants and awards for the production of
Children’s Educ Show for pre-school & elem level No. of production/producer awarded
Production of TV series for children No. of CTV produced
621
290
0
0
0
0
1
0
MFO 4 Orientation and training services for media education adn use of TV education Conduct national Conference on Children TV
No. of national conferences conducted No. of participants in the conference
Conduct International Conference on Children’s TV No. of international conferences conducted No. of participants in the conferenced
Conduct Film Appreciation Workshops for Children /Teachers/parents with CCP & CineMalaya
No. of sessions/workshops conducted
2,826
8,362
5,046
1
93
1 93
12
1
150
1 150
12
1
150
1 150
12
Particulars FY 2008 FY 2009 FY 2010
Actual/Amount Target/Amount Target/Amount
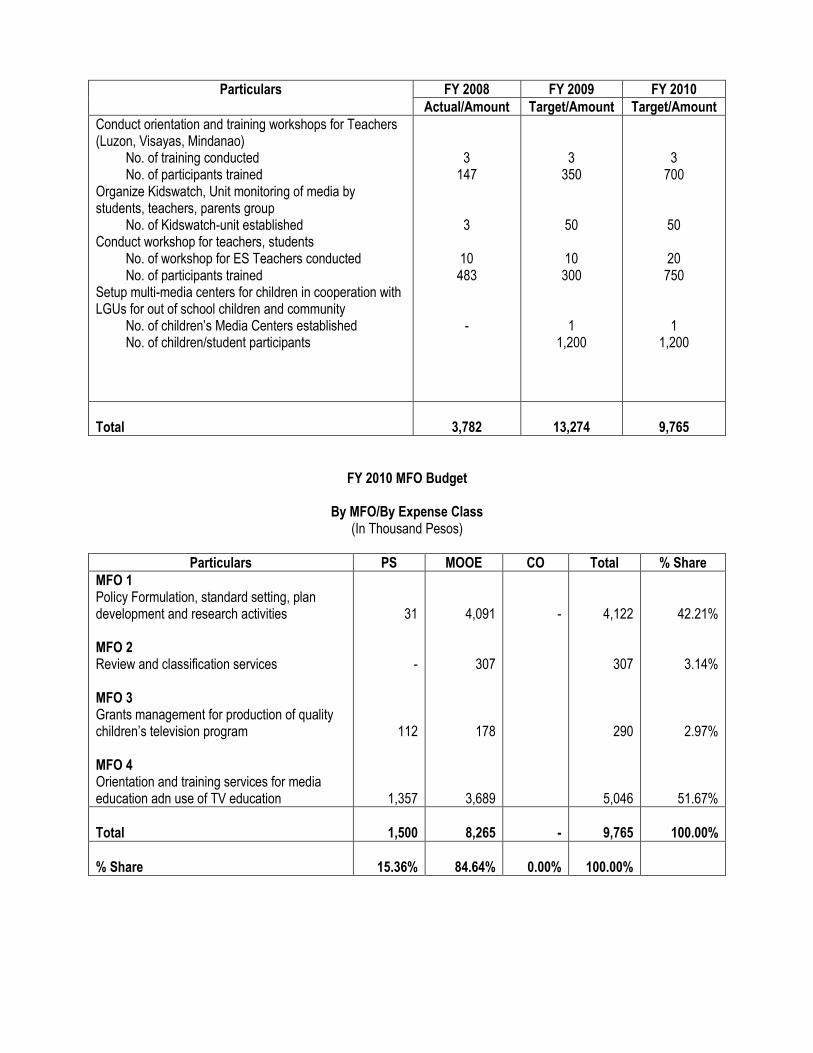
Conduct orientation and training workshops for Teachers (Luzon, Visayas, Mindanao)
No. of training conducted No. of participants trained
Organize Kidswatch, Unit monitoring of media by students, teachers, parents group
No. of Kidswatch-unit established Conduct workshop for teachers, students
No. of workshop for ES Teachers conducted No. of participants trained
Setup multi-media centers for children in cooperation with LGUs for out of school children and community
No. of children’s Media Centers established No. of children/student participants
3 147
3
10 483
-
3 350
50
10 300
1 1,200
3 700
50
20 750
1 1,200
Total
3,782
13,274
9,765
FY 2010 MFO Budget
By MFO/By Expense Class (In Thousand Pesos)
Particulars PS MOOE CO Total % Share
MFO 1 Policy Formulation, standard setting, plan development and research activities MFO 2 Review and classification services MFO 3 Grants management for production of quality children’s television program MFO 4 Orientation and training services for media education adn use of TV education
31
-
112
1,357
4,091
307
178
3,689
-
4,122
307
290
5,046
42.21%
3.14%
2.97%
51.67%
Total
1,500
8,265
-
9,765
100.00%
% Share
15.36%
84.64%
0.00%
100.00%

By MFO (Total Budget = P9,765,000)
By Expense Class (Total Budget = P9,765,000)
MFO 1 42.21%
MFO 2 3.14% MFO 3
2.97%
MFO 4 51.67%
PS 15.36%
MOOE 84.64%

National Museum
PERFORMANCE MEASURES AND TARGETS (Amounts in Thousand Pesos)
Particulars FY 2008 FY 2009 FY 2010
Actual/Amount Target/Amount Target/Amount
MFO 1 Publications, research papers and reference collection in both natural and social sciences Number of research projects conducted Number of zoological, botanical, geological specimens acquired, processes, identified, illustrated, documented and maintained Number of archeological and ethnological specimens acquired, processes, identified, illustrated, documented and maintained Number of artifacts conserved and restored Number of underwater and terrestial archeological excavations, explorations conducted Number of publications and research papers prepared
45,954
41,784
42,261
164
280,297
148,571
1,744
31
129
172
280,297
93,396
1,744
31
129
172
294,312
98,066
1,831
33
135
MFO 2 Dissemination of cultural and scientific knowledge Performance Indicators: Number of exhibits conducted (exhibits in Meseum of the Filipino People) Number of visitors/viewers of exhibits (exhibits in Meseum of the Filipino People) Number of attendees of museology training, lectures, seminars/workshops organized Number of scientific/technical papers, popular/promotional instructional materials prepared for publications and promotions Number of astronomical shows demonstrated (Planetarium bld and Mobile Planetarium)
19,992
22,490
21,880
78
461,368
1,122
1,651
81
56
461,368
1,122
1,600
0
80
484,436
1,178
1,680
300

Particulars FY 2007 FY 2008 FY 2009
Actual/Amount Target/Amount Target/Amount
MFO 3 Preservation/protection, conservation and restoration of cultural and natural heritage Number of cultural properties authenticated/registered and identified Number of licenses and permit issued Number of artworks acquired, identified, authenticated, exhibited, illustrated and maitained Number of immovable cultural properties/word heritage sites conserved, restored preserved and developed Number of Regional Mesuems maintained and developed
Regional/Branch Museums Museum Sites
49,896
99,751
62,950
1,421
1,000
1,500
561
3,743
11
15 4
500
3,743
5
15 4
600
3,930
7
15 4
Total
115,772
164,025
127,091
FY 2010 MFO Budget
By MFO/By Expense Class (In Thousand Pesos)
Particulars PS MOOE CO Total % Share
MFO 1 Publications, research papers and reference collection in both natural and social sciences
17,622
24,639
-
42,261
33.25%
MFO 2 Dissemination of cultural and scientific knowledge
8,056
13,824
-
21,880
17.22%
MFO 3 Preservation/protection, conservation and restoration of cultural and natural heritage
36,457
26,493
-
62,950
49.53%
TOTAL 62,135 64,956 - 127,091 100.00%
% Share 48.89% 51.11% 0.00% 100.00%

By MFO (Total Budget = P 127,091,000)
By Expense Class (Total Budget = 127,091,000)
MFO 1 33.25%
MFO 2 17.22%
MFO 3 49.53%
PS 48.89%
MOOE 51.11%
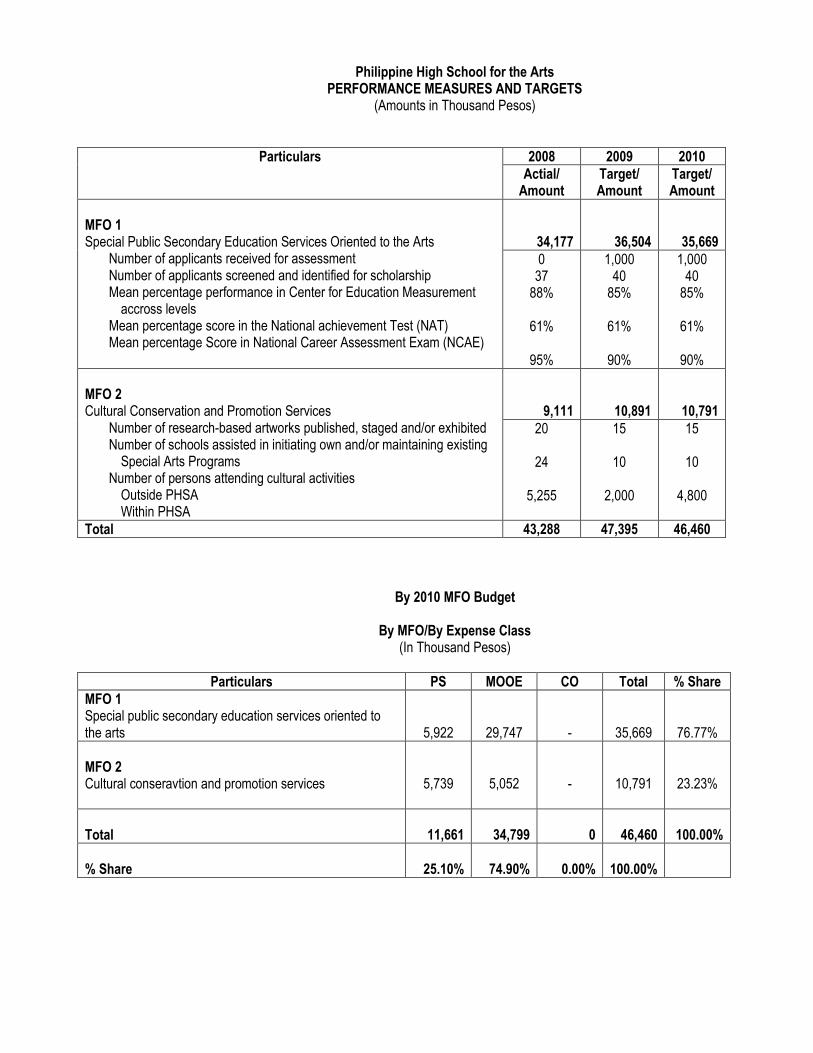
Philippine High School for the Arts PERFORMANCE MEASURES AND TARGETS
(Amounts in Thousand Pesos)
Particulars 2008 2009 2010
Actial/ Amount
Target/ Amount
Target/ Amount
MFO 1 Special Public Secondary Education Services Oriented to the Arts
Number of applicants received for assessment Number of applicants screened and identified for scholarship Mean percentage performance in Center for Education Measurement
accross levels Mean percentage score in the National achievement Test (NAT) Mean percentage Score in National Career Assessment Exam (NCAE)
34,177
36,504
35,669
0 37
88%
61%
95%
1,000 40
85%
61%
90%
1,000 40
85%
61%
90%
MFO 2 Cultural Conservation and Promotion Services
Number of research-based artworks published, staged and/or exhibited Number of schools assisted in initiating own and/or maintaining existing
Special Arts Programs Number of persons attending cultural activities
Outside PHSA Within PHSA
9,111
10,891
10,791
20
24
5,255
15
10
2,000
15
10
4,800
Total 43,288 47,395 46,460
By 2010 MFO Budget
By MFO/By Expense Class (In Thousand Pesos)
Particulars PS MOOE CO Total % Share
MFO 1 Special public secondary education services oriented to the arts
5,922
29,747
-
35,669
76.77%
MFO 2 Cultural conseravtion and promotion services
5,739
5,052
-
10,791
23.23%
Total
11,661
34,799
0
46,460
100.00%
% Share
25.10%
74.90%
0.00%
100.00%

By MFO (Total Budget = P46,460,000)
By Expense Class (Total Budget = P46,460,000)
MFO 1 76.77%
MFO 2 23.23%
PS 25.10%
MOOE 74.90%