Embed Size (px)
Citation preview

1
FY 2006 Fourth Quarter Earnings Conference CallNovember 14, 2006
FY 2006 Fourth Quarter Earnings Conference Call
Chip McClure, Chairman, CEO & President Jim Donlon, Senior Vice President & CFO
November 14, 2006

2
FY 2006 Fourth Quarter Earnings Conference CallNovember 14, 2006
Forward-Looking StatementsThis presentation contains statements relating to future results of the company (including certain projections and business trends) that are “forward-looking statements” as defined in the Private Securities Litigation Reform Act of 1995. Forward-looking statements are typically identified by words or phrases such as “believe,” “expect,”“anticipate,” “estimate,” “should,” “are likely to be,” “will” and similar expressions. Actual results may differ materially from those projected as a result of certain risks and uncertainties, including but not limited to global economic and market cycles and conditions; the demand for commercial, specialty and light vehicles for which the company supplies products; risks inherent in operating abroad (including foreign currency exchange rates and potential disruption of production and supply due to terrorist attacks or acts of aggression); availability and cost of raw materials, including steel; OEM program delays; demand for and market acceptance of new and existing products; successful development of new products; reliance on major OEM customers; labor relations of the company, its suppliers and customers, including potential disruptions in supply of parts to our facilities or demand for our products due to work stoppages; the financial condition of the company’s suppliers and customers, including potential bankruptcies; possible adverse effects of any future suspension of normal trade credit terms by our suppliers; potential difficulties competing with companies that have avoided their existing contracts in bankruptcy and reorganization proceedings; successful integration of acquired or merged businesses; the ability to achieve the expected annual savings and synergies from past and future business combinations and the ability to achieve the expected benefits of restructuring actions; success and timing of potential divestitures; potential impairment of long-lived assets, including goodwill; competitive product and pricing pressures; the amount of the company’s debt; the ability of the company to continue to comply with covenants in its financing agreements; the ability of the company to access capital markets; credit ratings of the company’s debt; the outcome of existing and any future legal proceedings, including any litigation with respect to environmental or asbestos-related matters; rising costs of pension and other post-retirement benefits and possible changes in pension and other accounting rules; as well as other risks and uncertainties, including but not limited to those detailed herein and from time to time in other filings of the company with the SEC. These forward-looking statements are made only as of the date hereof, and the company undertakes no obligation to update or revise the forward-looking statements, whether as a result of new information, future events or otherwise, except as otherwise required by law.

3
FY 2006 Fourth Quarter Earnings Conference CallNovember 14, 2006
Highlights• Met guidance with fourth-quarter EPS of $0.40
before special items• Favorable tax items of $0.53 per share are excluded from
this number• Delivered full-year 2006 EPS of $1.78, achieving the
upper end of the guidance range• Includes $0.06 benefit of reclassifying LVA Venezuela to
continuing ops.• Produced full-year free cash flow of $284 million,
exceeding the guidance range of $200-225 million• Includes $116 million from non-recourse sales of
receivables largely included in the previous guidance

4
FY 2006 Fourth Quarter Earnings Conference CallNovember 14, 2006
Highlights – continued• Projecting 2007 EPS in the range of $1.15 to $1.25
from continuing operations before special items• Announcing a major new profit improvement
initiative• Established six new facilities and joint ventures in
emerging markets in 2006• Reduced net debt by $103 million in the quarter and
$501 million during the fiscal year• Completed most of the previously-announced
restructuring within spending projections and with greater savings than forecasted

5
FY 2006 Fourth Quarter Earnings Conference CallNovember 14, 2006
2005 Restructuring Program Update
• Goals of this program have been achieved• Benefits to date have offset negative effect of raw materials prices,
production volumes and customer pricing• Incremental benefits in 2007 will offset stainless steel pricing
• Goals of this program have been achieved• Benefits to date have offset negative effect of raw materials prices,
production volumes and customer pricing• Incremental benefits in 2007 will offset stainless steel pricing
$60-65$50$50-60Run-rate annual benefits
$105$99$110Cash Restructuring
$132$127$135Restructuring Costs
UpdateProgram to Date
Original Estimate($ million)

6
FY 2006 Fourth Quarter Earnings Conference CallNovember 14, 2006
Emissions Technologies Restructuring
New Business Unit for 2007
Emissions Technologies
58%
Undercarriage Systems
17%
Aperture Systems
25%
LVS Sales2006
Commercial Vehicle
Emissions1%
Undercarriage and Drivetrain
Systems91%
Specialty Products
8%
CVS Sales2006
EmissionsTechnologies
BusinessUnit
• $50 million additional restructuring
• $310 million impairment

7
FY 2006 Fourth Quarter Earnings Conference CallNovember 14, 2006
Performance Plus Profit Improvement Initiative
AftermarketProductGrowthER&DOverheadManufacturingMaterials
Revenue EnhancementCost ImprovementsCommercial ExcellenceOperational Excellence
• Three teams addressing operational performance• Three teams focusing on ways to grow the business• More details at Analyst Day on December 7 in New
York

8
FY 2006 Fourth Quarter Earnings Conference CallNovember 14, 2006
$39 millionSoldCVS Off-Highway Brakes
$ 227millionTotal Light Vehicle Aftermarket
Other Divestitures
Light Vehicle Aftermarket
N/AEvaluatingLVS MSSC suspension JV
SoldEquity share in Purolator India
In ProcessN.A. Ride Control
SoldS. Africa Ride Control
SoldN.A. Purolator filtersSoldN.A. Exhaust
In ProcessLVA Europe
SoldN.A. Motion Control
ProceedsStatus
Divestiture Status

9
FY 2006 Fourth Quarter Earnings Conference CallNovember 14, 2006
Diverse Customer Base
Minimizes Reliance on Any Single Customer
Commercial Vehicle Customers Light Vehicle CustomersDaimlerChrysler
10%
General Motors9%
Volkswagen10%
Ford 7%
Asian Based OEMs 3%
BMW 2%Fiat 3%
Other LVS 9%
Other CVS15%
Fiat 2%
Asian Based OEMs 3%
Ford 3%
Volkswagen 1%General Motors 1%
PACCAR 2%
International 3%
Volvo 9%
DaimlerChrysler8%
47% Commercial
Vehicle
53% Light
Vehicle

10
FY 2006 Fourth Quarter Earnings Conference CallNovember 14, 2006
Geographic/Customer Mix of 2006 Sales
South America*
6%
Asia and Asian-based OEMs *
9%
North America47%
Europe and European-
based OEMs *38%
Consolidated Revenue
* Includes local operations of companies headquartered in North America
+ Non-Consolidated Joint Ventures
South America*
7%
Asia and Asian-based OEMs *
16%
North America44%
Europe and European-
based OEMs *33%

11
FY 2006 Fourth Quarter Earnings Conference CallNovember 14, 2006
Top 15 Light Vehicle Platforms
Avensis, CorollaToyota 296NTown and Country, CaravanDCX RS/RTSanta Fe, SonataHyundai NF/CM
Megane, ScenicRenault CRamDodge DR-DEFocus, C-MAX, Volvo S40/V50Ford C1
SuperDuty F-SeriesFord P131Fiesta, European FusionFord B2E-ClassMercedes W211TouaregVW PL71CromaFiat 194Polo, Ibiza, Audi A2, Skoda FabiaVW PQ24/25Golf, Touran, Audi A1, Skoda OctaviaVW PQ34/35Vectra, ZaphiraOpel Epsilon/3000Silverado, Sierra, Tahoe, SuburbanGMT 800/900
Key VehiclesPlatform

12
FY 2006 Fourth Quarter Earnings Conference CallNovember 14, 2006
Top 15 Vehicle Platforms
TouaregVW PL71CromaFiat 194
Golf, Touran, Audi A1, Skoda OctaviaVW PQ34/35VT, VN, Pinnacle, VisionMack/Volvo Class 8
Premium, MagnumRenault Trucks HD
Coronado, Century S/T, ColumbiaFreightliner Class 8FH, FH16Volvo Trucks HD
SuperDuty F-SeriesFord P1314000 Series, CF SeriesInternational MDFiesta, European FusionFord B2E-ClassMercedes W211
Polo, Ibiza, Audi A2, Skoda FabiaVW PQ24/25ProStar, 8000 Series, 9000 SeriesInternational Class 8
Vectra, ZaphiraOpel Epsilon/3000
Silverado, Sierra, Tahoe, SuburbanGMT 800/900
Key VehiclesPlatform

13
FY 2006 Fourth Quarter Earnings Conference CallNovember 14, 2006
Full Year Income Statement from Continuing Operations – Before Special Items (1)
(1) See Appendix – “Non-GAAP Financial Information”
3%$ 0.05$ 1.73$ 1.78Continuing OperationsDILUTED EARNINGS PER SHARE
3%4121$ 125Income from Continuing Operations(8)(6)(14)Minority Interests
26%12(47)(35)Provision for Income Taxes0%-174174INCOME BEFORE INCOME TAXES
-1%(1)(123)(124)Interest Expense, Net and Other29%82836Equity in Earnings of Affiliates-3%(7)269262OPERATING INCOME0%-(2)(2)Other Expense
16(16)-Restructuring Costs0%(1)(376)(377)SG&A
-3%(22)663641GROSS MARGIN-4%(344)(8,210)(8,554)Cost of Sales4%$ 322$ 8,873$ 9,195Sales
%$Better/(Worse)20052006
Twelve Months Ended September 30(in millions, except per share amounts)
14
FY 2006 Fourth Quarter Earnings Conference CallNovember 14, 2006
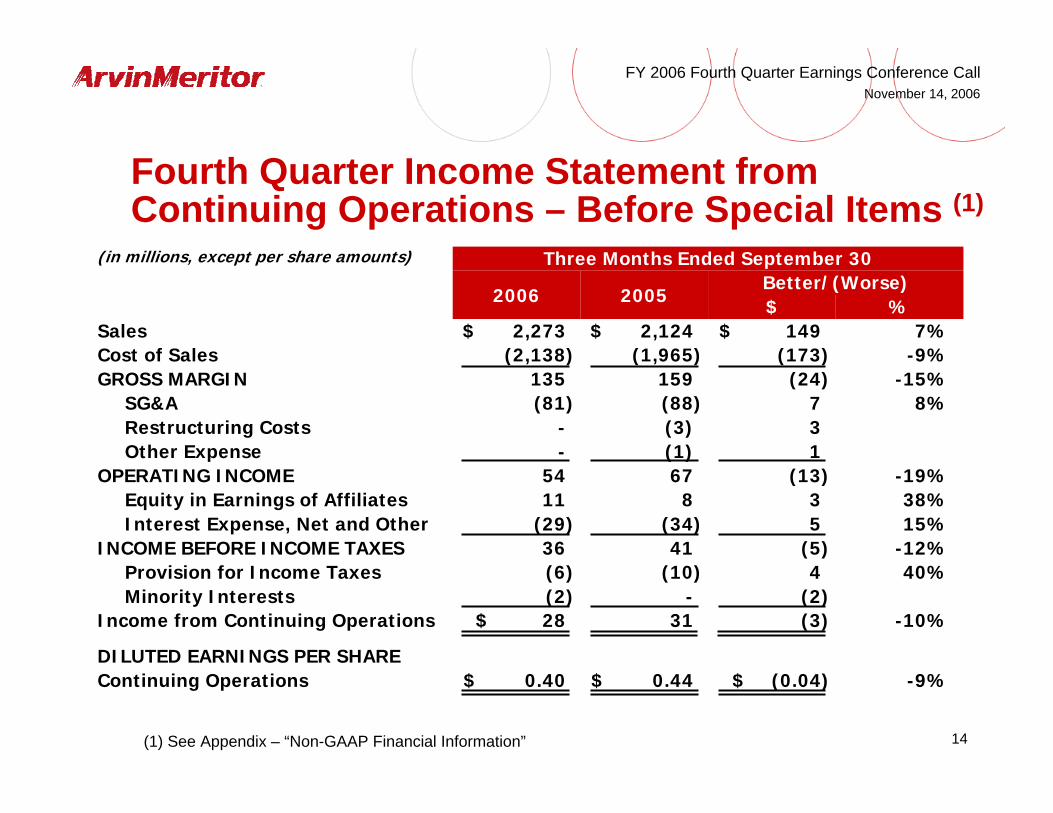
Fourth Quarter Income Statement from Continuing Operations – Before Special Items (1)
(1) See Appendix – “Non-GAAP Financial Information”
-9%$ (0.04)$ 0.44$ 0.40Continuing OperationsDILUTED EARNINGS PER SHARE
-10%(3)31$ 28Income from Continuing Operations(2)-(2)Minority Interests
40%4(10)(6)Provision for Income Taxes-12%(5)4136INCOME BEFORE INCOME TAXES15%5(34)(29)Interest Expense, Net and Other38%3811Equity in Earnings of Affiliates
-19%(13)6754OPERATING INCOME1(1)-Other Expense3(3)-Restructuring Costs
8%7(88)(81)SG&A-15%(24)159135GROSS MARGIN
-9%(173)(1,965)(2,138)Cost of Sales7%$ 149$ 2,124$ 2,273Sales
%$Better/(Worse)
20052006
Three Months Ended September 30(in millions, except per share amounts)

15
FY 2006 Fourth Quarter Earnings Conference CallNovember 14, 2006
Segment Operating Income –Before Special Items (1)
(1) See Appendix – “Non-GAAP Financial Information”
(0.2) pts3.0%2.8%(0.8) pts3.2%2.4%Total Operating Margins(0.2) pts3.1%2.9%(0.7) pts3.2%2.5%Segment Operating Income
- pts5.2%5.2%(0.5) pts5.2%4.7%Commercial Vehicle Systems(0.3) pts1.3%1.0%(1.2) pts1.5%0.3%Light Vehicle Systems
Operating Margins-3%(7)269262-19%(13)6754Operating Income
(3)(4)(7)-(2)(2)Unallocated Corporate Costs-1%(4)273269-19%(13)6956Segment Operating Income4%92122212%15253Commercial Vehicle Systems
-21%$ (13)$ 61$ 48-82%$ (14)$ 17$ 3 Light Vehicle SystemsOperating Income
%$%$Better/(Worse)
20052006Better/(Worse)
20052006
Twelve Months Ended September 30Quarter Ended September 30(in millions)

16
FY 2006 Fourth Quarter Earnings Conference CallNovember 14, 2006
61%59%
63%
2003 2004 2005 2006
$561
$469
$659
2003 2004 2005 2006
$299
$948
$696
2003 2004 2005 2006
$1,648
$1,356 $1,383
2003 2004 2005 2006
Debt-to-capitalization ratio
Unfunded pension liability(millions)
Term debt due within 5 years(millions)
Net debt(millions)
Balance Sheet Strengthening
$882 55%
$93$409

17
FY 2006 Fourth Quarter Earnings Conference CallNovember 14, 2006
Pension and Retiree HealthcarePension• Unfunded status of $409 million as of June 30, 2006 measurement date,
compared to $659 million a year ago• Expense of $76 million in 2007, down $19 million from 2006• Planned funding of $134 million in 2007, compared to $59 million in 2006• Discount rate currently at 6.6% for U.S. plans, with long-term return assumption
of 8.5%• Actual returns for 2006 were 11%
Retiree Healthcare• Expense of $57 million in 2007, compared to $47 million in 2006• Continuing appeal and negotiation of previously proposed retiree healthcare
cost sharing• Current net OPEB liability is $600 million vs. $455 million last year
New Accounting Standard• Plan to adopt SFAS 158 in 2008

18
FY 2006 Fourth Quarter Earnings Conference CallNovember 14, 2006
CY 2005 CY 2006 CY 2007
Q4 Q1 Q2 Q3 Q4 Q1 Q2 Q3 Q4
78 89 92 93 85 55 45 50 50
Q1 Q2 Q3 Q4 Q1 Q2 Q3 Q4 Q1
FY 2006 FY 2007 FY 2008
235
200(Thousands of vehicles)
North America Class 8 TruckVolume Forecast

19
FY 2006 Fourth Quarter Earnings Conference CallNovember 14, 2006
CY 2005 CY 2006 CY 2007
Q4 Q1 Q2 Q3 Q4 Q1 Q2 Q3 Q4
111 116 114 98 109 111 107 92 107
Q1 Q2 Q3 Q4 Q1 Q2 Q3 Q4 Q1
FY 2006 FY 2007 FY 2008
419
417(Thousands of vehicles)
Western Europe Medium & Heavy Truck Volume Forecast

20
FY 2006 Fourth Quarter Earnings Conference CallNovember 14, 2006
FY 2007 Outlook – Continuing Operations Before Special Items
$ 125$ 75$ 284Free Cash Flow
$ 1.25$ 1.15$ 1.78Diluted Earnings Per Share
$ 89$ 82$ 125Income from Continuing Operations
24.0%21.0%20.0%Effect Tax Rate
(112)$ (105)$ (124)Interest Expense
2.4%2.2%2.8%Operating Margin
$ 8,900$ 8,700$ 9,195Sales
FY 2007Full Year Outlook (1)
FY 2006Full Year
(1) Outlook does not include the impact of any future acquisitions or divestitures, or the impact of additional restructuring actions

21
FY 2006 Fourth Quarter Earnings Conference CallNovember 14, 2006
Fiscal Year 2007 Outlook
(1) Excluding gains or losses on divestitures, restructuring costs, and other special items
(0.25) - (0.35)Higher Net Steel Costs
Volume$(0.45) - $(0.60)North American Class 8 Downturn
(0.15) - (0.20)Q1Big Three Production Cuts(0.30) - (0.45)Other Volume Mix
$1.15 - $1.25FY 2007 Guidance Range*
0.40 - 0.50All Other Improvements0.05 - 0.10Lower Pension and Retiree Medical Expense0.25 - 0.30Restructuring Savings
$1.78FY 2006 ResultEstimated EPS (1)

22
FY 2006 Fourth Quarter Earnings Conference CallNovember 14, 2006
FY 2007 First Quarter Metrics
21-24%Tax Rate
$27-29 millionInterest Expense
(7)%YOY Production Change for Top 15 Platforms
Outlook

23
FY 2006 Fourth Quarter Earnings Conference CallNovember 14, 2006
Appendix

24
FY 2006 Fourth Quarter Earnings Conference CallNovember 14, 2006
Use of Non-GAAP Financial InformationIn addition to the results reported in accordance with accounting principles generally accepted in the United States (“GAAP”) included throughout this presentation, the Company has provided information regarding income from continuing operations, diluted earnings per share and segment operating income and margins before special items, which are non-GAAP financial measures. These non-GAAP measures are defined as reported income or loss from continuing operations, reported diluted earnings or loss per share from continuing operations and segment operating income or loss plus or minus special items. Other non-GAAP financial measures include “net debt” and “free cash flow”. Net debt is defined as total debt less the fair value adjustment of notes due to interest rate swaps, less cash. Free cash flow represents net cash provided by operating activities less capital expenditures.
Management believes that the non-GAAP financial measures used in this presentation are useful to both management and investors in their analysis of the Company’s financial position and results of operations. In particular, management believes that net debt is an important indicator of the Company’s overall leverage and free cash flow is useful in analyzing the Company’s ability to service and repay its debt. Further, management uses these non-GAAP measures for planning and forecasting in future periods.
These non-GAAP measures should not be considered a substitute for the reported results prepared in accordance with GAAP. Neither net debt nor free cash flow should be considered substitutes for debt, cash provided by operating activities or other balance sheet or cash flow statement data prepared in accordance with GAAP or as a measure of financial position or liquidity. In addition, the calculation of free cash flow does not reflect cash used to service debt and thus, does not reflect funds available for investment or other discretionary uses. These non-GAAP financial measures, as determined and presented by the Company, may not be comparable to related or similarly titled measures reported by other companies.
Set forth on the following slides are reconciliations of these non-GAAP financial measures, if applicable, to the most directly comparable financial measures calculated and presented in accordance with GAAP.

25
FY 2006 Fourth Quarter Earnings Conference CallNovember 14, 2006
Non-GAAP Financial Information –Full Year FY 2006 Results Before Special Items
(in millions, except per share amounts) Twelve Months Environmental, BeforeReported Goodwill Gains on Tilbury Work Severance Retiree Debt Taxes, Special Items09/30/06 Impairment Divestitures Restructuring Stoppage and Other Medical Extinguishment Other 09/30/06
Sales 9,195$ -$ -$ -$ -$ -$ -$ -$ -$ 9,195$ Gross Margin 588 - - - 45 3 5 - - 641 Operating Income (Loss) (119) 310 (28) 37 45 12 5 - - 262 Income (Loss) From Continuing Operations (174) 310 (17) 23 28 8 3 6 (62) 125
Diluted Earnings (Loss) Per ShareContinuing Operations (2.51)$ 4.42$ (0.24)$ 0.33$ 0.40$ 0.11$ 0.04$ 0.08$ (0.85)$ 1.78$
Operating Income (Loss)Light Vehicle Systems (291)$ 310$ (5)$ 31$ -$ 3$ -$ -$ -$ 48$ Commercial Vehicle Systems 185 - (23) 6 45 3 5 - - 221
Segment Operating Income (Loss) (106) 310 (28) 37 45 6 5 - - 269 Unallocated Corporate Costs (13) - - - - 6 - - - (7)
Total Operating Income (Loss) (119)$ 310$ (28)$ 37$ 45$ 12$ 5$ -$ -$ 262$
Operating Margins LVS -5.9% 1.0%CVS 4.3% 5.2%Segment Operating Margin -1.2% 2.9%
Total Operating Margins -1.3% 2.8%

26
FY 2006 Fourth Quarter Earnings Conference CallNovember 14, 2006
Non-GAAP Financial Information –Full Year FY 2005 Results before Special Items
(in millions, except per share amounts) Twelve Months BeforeReported Customer Debt Special Items09/30/05 Environmental Bankruptcies Restructuring Exchange Taxes 09/30/05
Sales 8,873$ -$ -$ -$ -$ -$ 8,873$ Gross Margin 659 - 4 - - - 663
Operating Income 184 6 9 70 - - 269
Income From Continuing Operations 63 4 6 43 3 2 121
Diluted Earnings Per ShareContinuing Operations 0.90$ 0.06$ 0.09$ 0.62$ 0.04$ 0.02$ 1.73$
Operating Income Light Vehicle Systems 1$ -$ 9$ 51$ -$ -$ 61$ Commercial Vehicle Systems 193 - - 19 - - 212
Segment Operating Income 194 - 9 70 - - 273 Unallocated Corporate Costs (10) 6 - - - - (4)
Total Operating Income 184$ 6$ 9$ 70$ -$ -$ 269$
Operating MarginsLVS 0.0% 1.3%CVS 4.8% 5.2%Total Operating Margins 2.1% 3.0%

27
FY 2006 Fourth Quarter Earnings Conference CallNovember 14, 2006
Non-GAAP Financial Information –Fourth Quarter FY 2006 Results Before Special Items
(in millions, except per share amounts) 3 Months Environmental, BeforeReported Goodwill Severance Retiree Taxes, Special Items09/30/06 Impairment Restructuring and Other Medical Other 09/30/06
Sales 2,273$ -$ -$ -$ -$ -$ 2,273$ Gross Margin 127 - - 3 5 - 135 Operating Income (288) 310 18 9 5 - 54 Income From Continuing Operations (261) 310 11 6 3 (41) 28
Diluted Earnings Per ShareContinuing Operations (3.76)$ 4.40$ 0.16$ 0.09$ 0.04$ (0.53)$ 0.40$
Operating Income Light Vehicle Systems (325)$ 310$ 15$ 3$ -$ -$ 3$ Commercial Vehicle Systems 42 - 3 3 5 - 53
Segment Operating Income (283) 310 18 6 5 - 56 Unallocated Corporate Costs (5) - - 3 - - (2)
Total Operating Income (288)$ 310$ 18$ 9$ 5$ -$ 54$
Operating MarginsLVS -28.2% 0.3%CVS 3.8% 4.7%Segment Operating Margin -12.5% 2.5%
Total Operating Margins -12.7% 2.4%

28
FY 2006 Fourth Quarter Earnings Conference CallNovember 14, 2006
Non-GAAP Financial Information –Fourth Quarter FY 2005 Results before Special Items
(in millions, except per share amounts) 3 Months BeforeReported Debt Special Items09/30/05 Exchange Restructuring Tax 09/30/05
Sales 2,124$ -$ -$ -$ 2,124$ Gross Margin 159 - - - 159
Operating Income 49 - 18 - 67
Income From Continuing Operations 18 3 11 (1) 31
Diluted Earnings Per ShareContinuing Operations 0.26$ 0.04$ 0.16$ (0.02)$ 0.44$
Operating Income Light Vehicle Systems 4$ -$ 13$ -$ 17$ Commercial Vehicle Systems 47 - 5 - 52
Segment Operating Income 51 - 18 - 69 Unallocated Corporate Costs (2) - - - (2)
Total Operating Income 49$ -$ 18$ -$ 67$
Operating MarginsLVS 0.4% 1.5%CVS 4.7% 5.2%Total Operating Margins 2.3% 3.2%

29
FY 2006 Fourth Quarter Earnings Conference CallNovember 14, 2006
Non-GAAP Financial Information – Net Debt
(in millions)
09/30/06 06/30/06 03/31/06 12/31/05 09/30/05
Short-term debt 56$ 65$ 217$ 106$ 136$
Long-term debt 1,184 1,288 1,146 1,438 1,451
Total Debt 1,240 1,353 1,363 1,544 1,587
Less: Cash (350) (365) (236) (302) (187)
Less: Fair value adjustment of notes (8) (3) (7) (14) (17)
Net Debt 882$ 985$ 1,120$ 1,228$ 1,383$

30
FY 2006 Fourth Quarter Earnings Conference CallNovember 14, 2006
Non-GAAP Financial Information –Free Cash Flow
(in millions)
09/30/06 09/30/05
Cash Provided By (Used For) Operating Activities 440$ (32)$
Changes in U.S. Accounts Receivable Securitization - 32
Less: Capital expenditures (156) (156)
Free Cash Flow 284$ (156)$
Twelve Months Ended September 30,

31
FY 2006 Fourth Quarter Earnings Conference CallNovember 14, 2006
Other Balance Sheet Measures
(in millions)09/30/06 06/30/06 03/31/06 12/31/05 09/30/05
Minority Interests 65 67 63 69 66
Equity 944 1,132 1,022 877 875
Total Debt to Capital 55% 53% 56% 62% 63%
Working Capital 146 248 338 208 315
Working Capital % of Sales (1) 2.2% 2.9% 2.9% 3.1% 4.2%

32
FY 2006 Fourth Quarter Earnings Conference CallNovember 14, 2006