Embed Size (px)
Citation preview
Future changes in the western North Pacific tropical cyclone
activity: results from Project Athena
Julia Manganello1, Kevin Hodges2, Brandt Dirmeyer1, Jim Kinter1,3, Ben Cash1, Larry Marx1, Thomas Jung4, Deepthi Achuthavarier1,5, Jennifer M. Adams1, Eric L. Altshuler1, Bohua Huang1,3, Emilia K. Jin6,3, Peter Towers7
and Nils Wedi7
1 COLA, USA 2 NERC Centre for Earth Observa9on, University of Reading, UK 3 GMU, USA 4 Alfred-‐Wegener-‐Ins9tute for Polar and Marine Research, Germany 5 USRA, USA 6 KIAPS, South Korea 7 ECMWF, UK
NOAA MAPP Webinar, Dec. 2013

• The World Modeling Summit (WMS) in May 2008 called for a revolu)on in climate modeling to more rapidly advance improvements in accuracy and reliability
• The WMS recommended petascale supercomputers dedicated to climate modeling based in at least 3 interna9onal facili9es • Dedicated petascale machines are needed to provide enough computa9onal capability
and a controlled environment to support long runs and the management, analysis and stewardship of very large (petabyte) data sets
• The U.S. Na)onal Science Founda)on, recognizing the importance of the problem, realized that a resource (Athena) was available to meet the challenge of the World Modeling Summit and offered to dedicate the Athena supercomputer for 6 months in 2009-‐2010
• An interna9onal collabora9on was formed among groups in the U.S., Japan and the U.K. to use Athena to take up the challenge
Courtesy of Jim Kinter (COLA)
Project Athena
Page 1 NOAA MAPP Webinar, Dec. 2013
Page 2
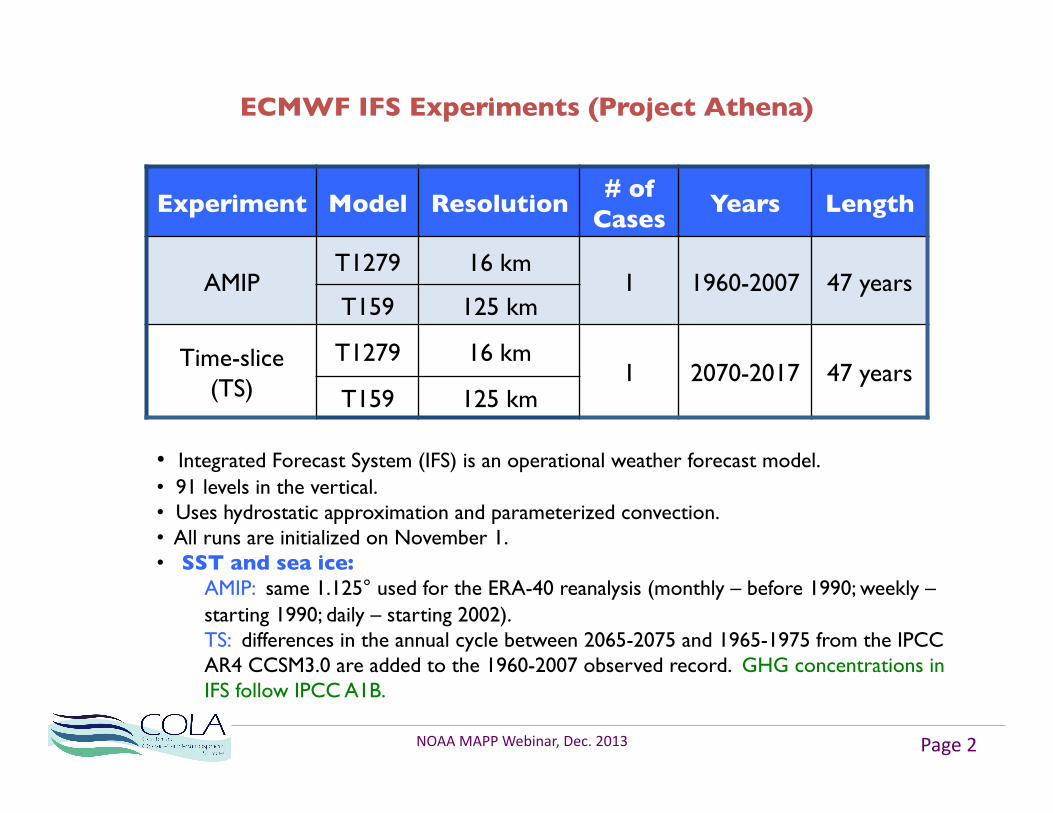
ECMWF IFS Experiments (Project Athena)
Experiment Model Resolution # of
Cases Years Length
AMIP T1279 16 km
1 1960-2007 47 years T159 125 km
Time-slice (TS)
T1279 16 km 1 2070-2017 47 years
T159 125 km
• Integrated Forecast System (IFS) is an operational weather forecast model. • 91 levels in the vertical. • Uses hydrostatic approximation and parameterized convection. • All runs are initialized on November 1. • SST and sea ice:
AMIP: same 1.125° used for the ERA-40 reanalysis (monthly – before 1990; weekly – starting 1990; daily – starting 2002). TS: differences in the annual cycle between 2065-2075 and 1965-1975 from the IPCC AR4 CCSM3.0 are added to the 1960-2007 observed record. GHG concentrations in IFS follow IPCC A1B.
NOAA MAPP Webinar, Dec. 2013

Page 3
TS - AMIP (T1279)
Tropical Storm
CAT 1-2 CAT 3-5
Total TC frequency, counts per season +2.2 (+7%)
TC frequency per storm category -2.4
(-12%) +1.3
(+17%) + 3.3 (+70%)
Power Dissipation Index, *1.e11 m3/s2 +1.8 (+51%)
Mean Peak Intensity, m/s +3.4 (+12%)
Mean Lifetime, days +0.02 (+0.1%)
• for MJJASON season, based on 47 years of data • Values in bold are statistically significant at the 95% confidence level.
Projected changes: TC frequency, intensity and the PDI
NOAA MAPP Webinar, Dec. 2013

Page 4
Genesis Density Track Density
AM
IP
TS
TS
- AM
IP
Shading shows differences that are statistically significant using a permutation Monte Carlo approach (Hodges 2008).
Projected changes: TC frequency
NOAA MAPP Webinar, Dec. 2013

Page 5
Genesis Density
Projected changes: TC frequency, cont.
NOAA MAPP Webinar, Dec. 2013
Shading denotes changes that are statistically significant at the 95% confidence level.
MJJASON means
TS – AMIP (T1279)
Sea Surface Temperature
Precipitation and 850-hPa Vel. Pot.
Negative of 500-hPa Omega

Page 6
850-hPa Relative Vorticity
Negative of 500-hPa Omega
Genesis Density
700-hPa Relative Humidity
Projected changes: TC frequency, cont. TS – AMIP (T1279)
Shading denotes changes that are statistically significant at the 95% confidence level.
MJJASON means
Vertical Wind Shear
Track Density of Tropical Disturbances
NOAA MAPP Webinar, Dec. 2013
Page 7
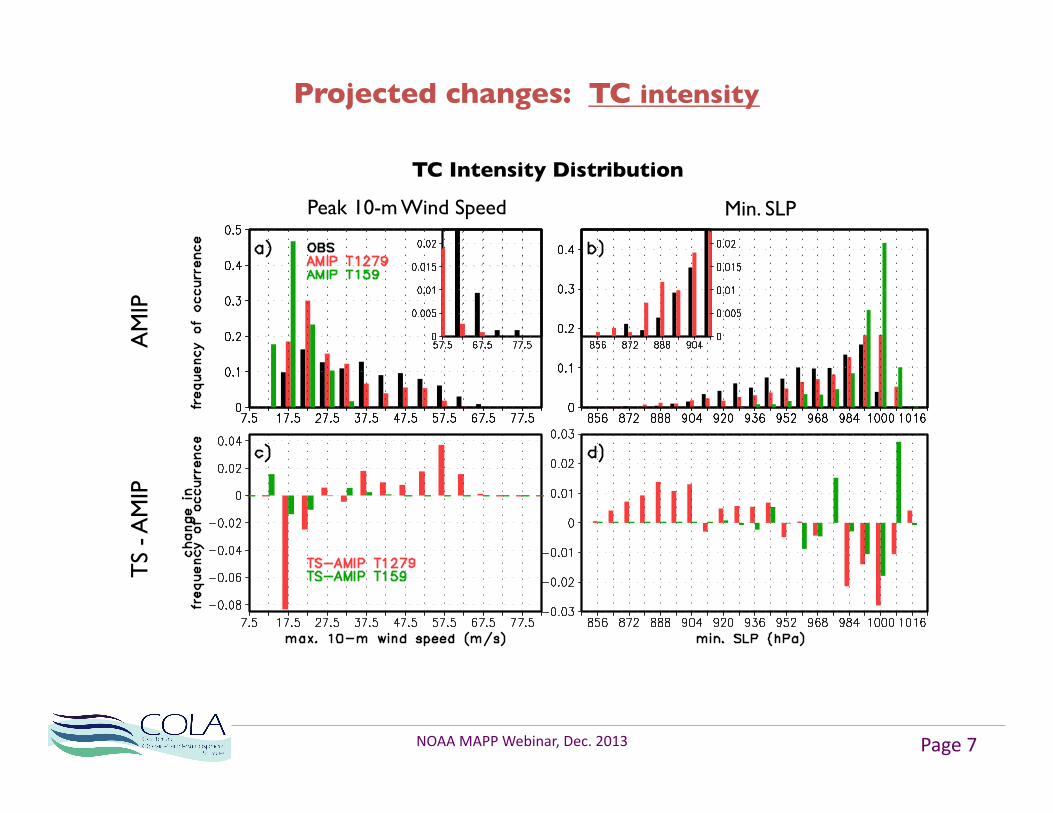
Projected changes: TC intensity
NOAA MAPP Webinar, Dec. 2013
TC Intensity Distribution
Peak 10-m Wind Speed Min. SLP
AM
IP
TS
- AM
IP

Page 8
Changes in the Cumulative Distribution of TC Intensity
OBS IFS T1279 IFS T159
16-km IFS: Future changes in the typhoon intensities are comparable with the range of intensity variations due to the model’s natural variability.
Projected changes: TC intensity, cont.
NOAA MAPP Webinar, Dec. 2013
Based on OBS Based on MODEL

Page 9
Intensity Life Cycle
OBS AMIP T1279
TS T1279
# of storms 48 47 47
Maximum 10-m wind speed, m/s
>=65.0 or CAT 5
>= 54.0 or CAT 4
>=58.5 or CAT 4
Intensification time, days 5.6 13.8 11.7
Super-typhoon Composites
Projected changes: TC intensity, cont.
NOAA MAPP Webinar, Dec. 2013
Page 10
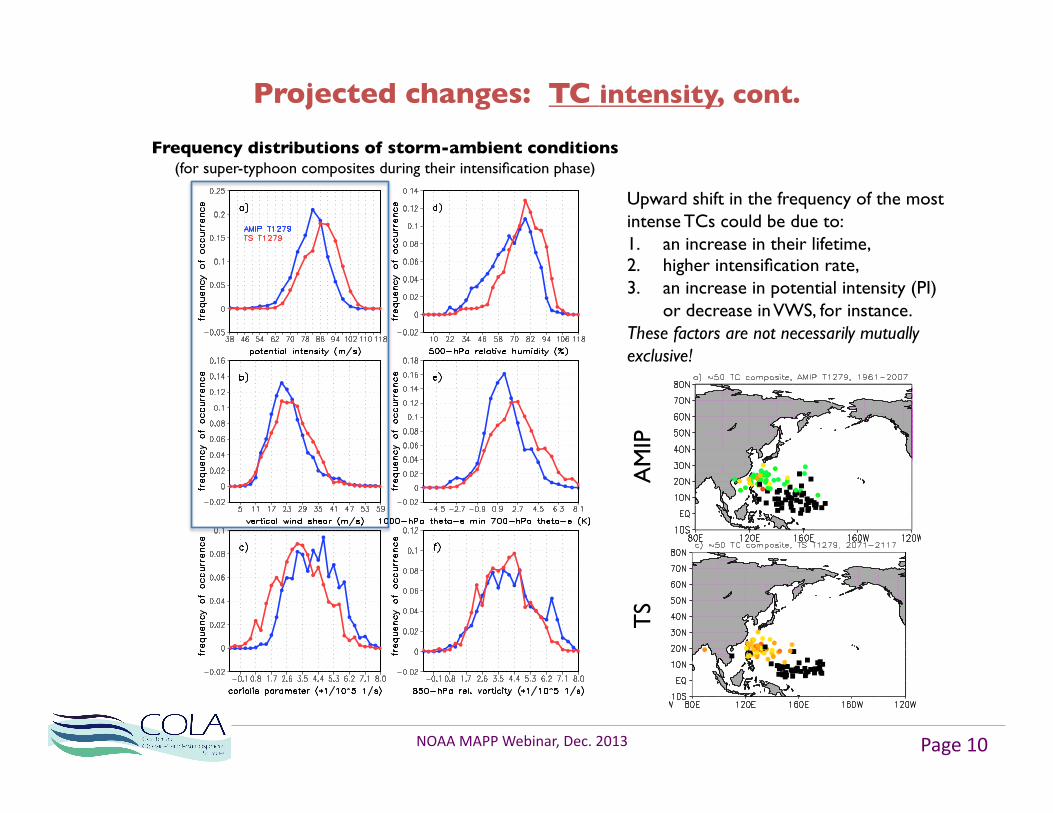
Projected changes: TC intensity, cont.
Frequency distributions of storm-ambient conditions (for super-typhoon composites during their intensification phase)
Upward shift in the frequency of the most intense TCs could be due to: 1. an increase in their lifetime, 2. higher intensification rate, 3. an increase in potential intensity (PI)
or decrease in VWS, for instance. These factors are not necessarily mutually exclusive!
NOAA MAPP Webinar, Dec. 2013
AM
IP
TS

Page 11
Tang
entia
l Win
d R
adia
l Win
d
Neg
ativ
e O
meg
a
0.1% of occurrence
0.01% of occurrence
0.1% of occurrence
0.01% of occurrence
Azimuthal Means
Projected changes: TC structure
Vert
ical
Vel
ocity
NOAA MAPP Webinar, Dec. 2013

Page 12
Azimuthal Means
Tem
pera
ture
Spec
ific
Hum
idity
Regional Anomalies
Equi
vale
nt P
oten
tial
Tem
pera
ture
Projected changes: TC structure, cont.
NOAA MAPP Webinar, Dec. 2013