Embed Size (px)
Citation preview
Page 1 of 21
Further analysis of the PQRI BUWG industry survey: How do formulation and process
parameters impact blend and unit dose uniformity?
Bruno C. Hancock* & Salvador Garcia-Munoz
Pfizer Inc., Eastern Point Road, Groton, CT 06340, USA
Updated 23rd August 2012
Submitted to the Journal of Pharmaceutical Sciences
*Corresponding author (email: [email protected]; tel: 1-860-715-2484

Page 2 of 21
Summary
Responses from the second PQRI BUWG survey of industry have been reanalyzed to identify
potential links between formulation and processing variables and the measured uniformity of
blends and unit dosage forms. As expected, the variability of the blend potency and tablet
potency data increased with a decrease in the API loading. There was also an inverse
relationship between the nominal strength of the unit dose and the blend uniformity data. The
data from the PQRI industry survey do NOT support the commonly held viewpoint that
granulation processes are necessary to create and sustain tablet and capsule formulations with
a high degree of API uniformity. There was no correlation between the blend or tablet potency
variability and the type of process used to manufacture the product. Although it is commonly
believed that direct compression processes should be avoided for low API loading formulations
due to blend and tablet content uniformity concerns, the data for direct compression processes
reported by the respondents to the PQRI survey suggests that such processes are being used
routinely to manufacture solid dosage forms of acceptable quality even when the low drug
loading is quite low.

Page 3 of 21
Introduction
Between 2000 and 2003 the Blend Uniformity Working Group (BUWG) of the Product Quality
Research Institute (PQRI) surveyed pharmaceutical companies on two occasions to better
understand the practices used for blend sampling [1] and to clarify the relationships (if any)
between blend potency test results and dosage unit potency [2]. The results of these surveys
resulted in a proposed guidance for industry regarding in-process sampling protocols for powder
blends and solid dosage units (tablets and capsules) [3]. They also lead to the development of
recommendations for interpreting the results of such sample testing. Since that time the
sampling and analysis approaches described in the whitepapers published by the BUWG have
become the de-facto standard for formulation and manufacturing scientists throughout the
industry.
The second BUWG survey of industry solicited responses relating to the formulation
composition (drug loading and dose) and type of manufacturing process used to manufacture
solid dosage forms, but these responses were not included in the original analysis [2].
Conventional wisdom amongst pharmaceutical formulators is that granulation processes are
useful for enhancing the uniformity of dosage units, especially in low dose products. However,
to the authors’ knowledge there has never been an in-depth retrospective analysis of
manufacturing data to establish whether this widely held conviction is correct. In theory, the
results of the BUWG anonymous survey should provide an opportunity to assess the impact of
the drug loading, dose, and the choice of processing method on both the blend uniformity and
the dose uniformity of the final dosage form.
The objective of the work described in this manuscript was to re-examine the responses from
the second PQRI BUWG survey of industry to identify any potential links between formulation
and processing variables and the measured uniformity of blends and unit dosage forms. This

Page 4 of 21
analysis should increase the industry’s understanding of how formulation and processing factors
can impact the content uniformity of solid dosage forms, consistent with PQRI’s mission of
providing objective guidance to industry on practices that can enhance drug product quality.
Materials & methods
Raw data from the BUWG survey of industry were received in blinded form from PQRI. Details
of the survey methodology used to obtain the data can be found elsewhere [2]. The responses
solicited during the survey are shown in Table 1. The raw data comprised nine spreadsheets
containing over twenty thousand unique data points. Anonymous responses were received
from nine companies, and data were reported for seventy-six unique products and over eight-
hundred lotsa.
Initially, the raw data were pooled, sorted and checked for errors. Any obviously incorrect data
(for example, API loadings of more than 100%) were omitted from further analysis. Potential
correlations between the various survey responses were then explored using SpotFire software
(TIBCO Software Inc., Somerville, MA, USA). More complex statistical analyses (such as partial
least square (PLS) analysis) were attempted using MatLab software (MathWorks, Natick, MA,
USA).
Results & discussion
The amount of data collated from the cross industry PQRI BUWG survey is unprecedented and
it is certainly worthy of further examination. However, the data are not as perfect as would be
desired (missing data, obviously incorrect values, etc), so it is important not to over-interpret the
results. The data from the PQRI BUWG industry surveys are also more than ten years old, so
a Some data were received by PQRI after the original deadline for the survey, and thus not all of the results included here were considered in the original PQRI BUWG reports.

Page 5 of 21
any trends that are uncovered reflect the practices of the 20th century and cannot provide any
insights into more recent development and manufacturing practices (such as process analytical
technologies (PAT) and quality-by-design (QbD)). However, the data can provide useful
information about longstanding formulation design and process development practices.
The pooled data exhibit some notable trends. The vast majority (~90%) of the formulations
were to be compressed as tablets rather than being filled into capsules. As shown in Figure 1,
the API loading in the solid dosage formulations was generally much less than 20% by weight
and in many cases (~60%) was less than 10% by weight. This low percentage of API in the
formulations and products covered by the survey could influence the trends that emerge from
the data as it is further analyzed. Figure 1 shows the range of batch sizes for which the data
was obtained, and, it is worth noting that a wide range of batch sizes from pilot scale (24kg) to
commercial scale (2400kg) was represented.
The frequency of use of different manufacturing methods by the responding companies is
represented in Figure 2. The most commonly used manufacturing methods were direct
compression and wet granulation. Of the nine responding companies, six used direct
compression processes, six used wet granulation and only two used dry granulation. No
company reported data for all three processing techniques, but just over half of companies (5
out of 9) used more than one approach. Four companies reported only one type of data,
suggesting that they make a single manufacturing pathway work irrespective of the API
properties that are presented. More detailed analysis of the individual batch data showed that
there was a bias in the survey data towards direct compression (67% of batches) and wet
granulation (32% of batches). Data for products manufactured by dry granulation represented
only 1% of the pooled batch data, and it was clustered in a narrow range of API contents

Page 6 of 21
(between 1 and 5 %) and batch sizes (100 to 123 kg). These trends should be taken into
consideration as the data from the survey are further analyzed.
From Figure 3 it is readily apparent that all three manufacturing pathways are used for
formulations with moderate (2 – 10%) API loadings. For the very lowest API loadings (<1%),
direct compression and wet granulation are both used extensively. Direct compression was
used for up to 50% API loading and wet granulation was exclusively used for the formulations
with the very highest drug loadings. This is presumably to impart good flow and compaction
properties to the formulations which contain limited amounts of excipients. These trends seem
to reflect the commonly help beliefs about the strengths and weaknesses of each possible
method for manufacturing solid oral dosage forms. However, whilst Figures 2 and 3 show the
trends in manufacturing process selection, they do not give any insights into the reasons for
those choices. This topic will be the subject of the following analysis and discussion.
To further understand the trends in the survey data, it is necessary to examine the relationships
between well accepted measures of product quality, such as blend uniformity and tablet potency
variation, and the reported manufacturing data. The first relationships examined were those
between the most common measures of product quality (such as blend uniformity and dosage
form content uniformity) and the company identity and batch size. It was found that there was
no correlation between the identity of the company or the batch size and the various measures
of product quality (data not shown).
Next, the pooled data from all nine companies were examined to determine if there was any
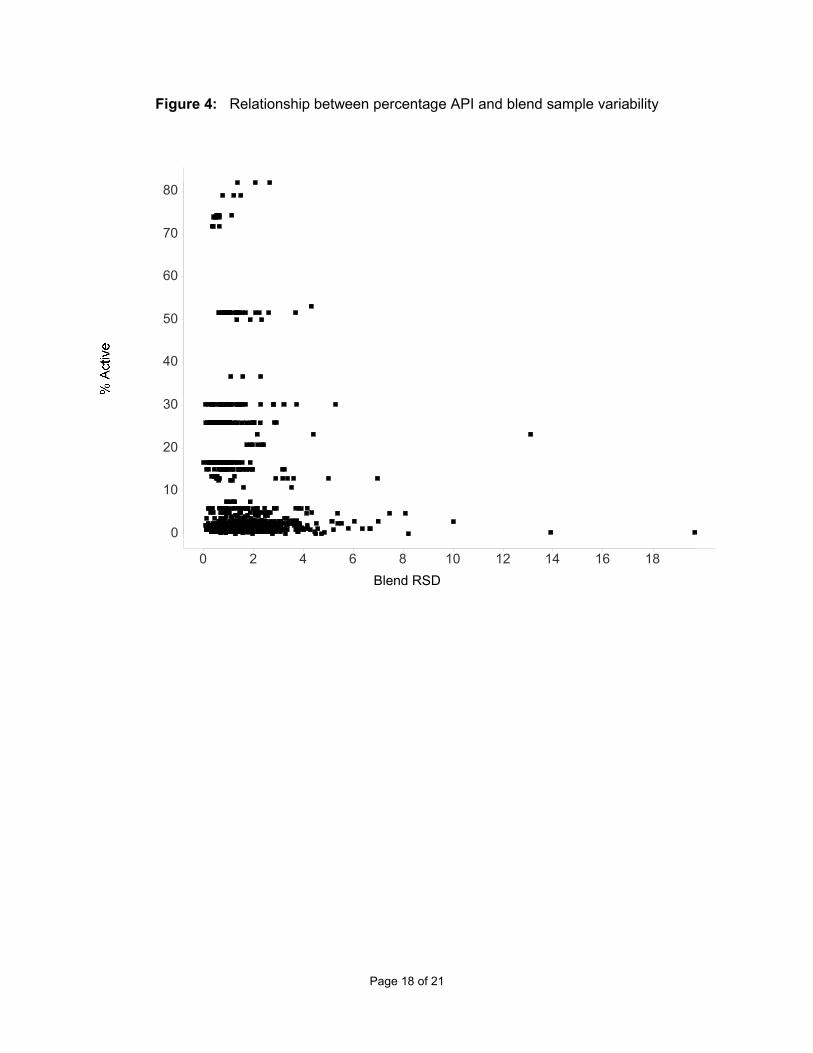
relationship between the API loading and the various measures of product quality. Figure 4
shows that the variability of the blend potency data from any given batch (“blend RSD”) tends to
increase with a decrease in the API loading. A similar trend is apparent when the stratified

Page 7 of 21
tablet sample potency variation data are plotted in an analogous manner (plot not shown). This
is consistent with conventional wisdom regarding the challenges of making and sustaining a
uniform blend for a formulation that contains a low percentage of API [4]. Notably, Figure 5
shows that there is also a relationship between the nominal strength of the unit dose and the
blend uniformity data. Presumably, this is a direct result of the strong dependence of the API
loading on the nominal strength of the unit dose (that is, lower doses are usually associated with
lower API loadings, and vice versa).
It is a widely held belief that granulation processes can be necessary to create and sustain
tablet and capsule formulations with a high degree of API uniformity. This is believed to be
especially true when the API loading in the formulation is very low (say, <1%). The data from
the PQRI industry survey do NOT support this commonly held viewpoint. As illustrated in
Figure 6 there was no correlation between the mean blend potency variability and the type of
process used to manufacture the product. When only the formulations containing between 1
and 5% API were considered, again there was no consistent trend between the mean uniformity
of the blend and the type of process used (Table 2). This trend is also seen in the mean
stratified tablet uniformity data (Figure 7 & Table 2), although the dry-granulation data is notable
for a single outlying data point. Interestingly, although it is commonly believed that direct
compression processes should be avoided for low API loading formulations due to blend and
tablet content uniformity concerns, the data for direct compression processes reported by the
respondents to the PQRI survey suggests that such processes are being used routinely to
manufacture solid dosage forms of acceptable quality even when the low drug loading is quite
low. In fact, data for direct compression processes were the most widely reported in the PQRI
survey and the blend uniformity variation was always less than 10%. The largest variation in
blend potency data was found for the wet granulated products, but this could be because these
products were the most challenging to manufacture because of poor API physical properties or

Page 8 of 21
high API loadings. Without API property data for these products or more details of the
manufacturing processes (such as whether the blends were made by high or low shear mixing)
it is impossible to be sure of the underlying cause of the observed trends.
As a final method of analysis, multivariate regression techniques were used to scrutinize the
data. Unfortunately these analyses were unsuccessful because the data for the different
manufacturing methods were not evenly distributed and several parameters (such as batch
size) were not fully independent variables. However, it was possible to confirm that the method
of manufacture had a negligible contribution to blend and dosage uniformity differences.
Conclusions
The responses from the second PQRI BUWG survey of industry have been reanalyzed to
identify any potential links between formulation and processing variables and the measured
uniformity of blends and unit dosage forms. As expected, the variability of the blend potency
and tablet potency data increased with a decrease in the API loading. There was also an
inverse relationship between the nominal strength of the unit dose and the blend uniformity
data. This is probably a direct result of the strong dependence of the API loading on the
nominal strength of the unit dose. The data from the PQRI industry survey do NOT support the
commonly held viewpoint that granulation processes are necessary to create and sustain tablet
and capsule formulations with a high degree of API uniformity.. There was no correlation
between the blend or tablet potency variability and the type of process used to manufacture the
product. Although it is commonly believed that direct compression processes should be
avoided for low API loading formulations due to blend and tablet content uniformity concerns,
the data for direct compression processes reported by the respondents to the PQRI survey
suggests that such processes are being used routinely to manufacture solid dosage forms of
acceptable quality even when the low drug loading is quite low. The re-analysis of the PQRI

Page 9 of 21
BUWG industry survey increases the industry’s understanding of how formulation and
processing factors can impact the content uniformity of solid dosage forms, consistent with
PQRI’s mission of providing objective guidance to industry on practices that can enhance drug
product quality. It also shows the value of analyzing blinded manufacturing data for a large
number of products and companies. Additional work aimed at creating cross-industry data sets
that can provide additional insights into formulation and manufacturing best-practices would be
of significant value to regulators, industry scientists, and academic researchers.
Acknowledgements
The Board of Directors of the Product Quality Research Institute (PQRI) is thanked for providing
blinded access to the Blend Uniformity Working Group (BUWG) survey results.

Page 10 of 21
References
1. Boehm, G., Report on the industry blend uniformity practices survey. Pharmaceutical
Technology, 2001, August, p.20-26.
2. Boehm, G., et al., Results of statistical analysis of blend and dosage unit content
uniformity data obtained from the Product Quality Reasearch Institute blend uniformity
working group data-mining effort. PDA Journal of Pharmaceutical Science and
Technology, 2004, 58(2): p.62-74.
3. Boehm, G., et al., The Use of Stratefied Sampling of Blend and Dosage Units to
Demonstrate Adequacy of Mix for Powder Blends. PDA Journal of Pharmaceutical
Science and Technology, 2003, 57(2): p.64-74.
4. Prescott, J.K. and T.P. Garcia, A solid dosage and blend content uniformity
troubleshooting diagram. Pharmaceutical Technology, 2001, March p.68-84.

Page 11 of 21
List of tables
Table 1: Formulation and process parameters collected in the BUWG survey of industry
Table 2: Mean blend and tablet potency variability data for batches manufactured using different methods

Page 12 of 21
List of figures
Figure 1: Relationship between percentage of API in the product and the batch size (squares = direct compression, circles = dry granulation, diamonds = wet granulation)
Figure 2: Manufacturing methods used by each company responding to the survey
Figure 3: Percentage API distribution for each manufacturing method
Figure 4: Relationship between percentage API and blend sample variability
Figure 5: Relationship between dose strength and blend sample variability
Figure 6: Blend sample variability distribution for each method of manufacturing
Figure 7: Stratified tablet sample variability distribution for each manufacturing method

Page 13 of 21
Table 1: Formulation and process parameters collected in the BUWG survey of industry
Parameter Description / units
Company Blinded
Product Blinded
Lot No Blinded
API Loading Percent
Batch Size Kilograms
Method of Manufacture Direct compression /
Dry granulation /
Wet granulation
Dosage Form Tablet / Capsule
Dose Milligrams
Blend Sample Location Top, middle, bottom, etc
Target Blend sample size X – Y mg, 1-3x unit dose,
etc
Blend Potency Result Percentage of theory
Stratified Tablet Sample Location Percentage of batch
Stratified Tablet Result Percentage of theory
Dosage Form Weight Milligrams
Composite Assay Value Percentage of Label Claim

Page 14 of 21
Table 2: Mean blend and tablet potency variability data for batches manufactured using
different methods
API loading
(%)
Manufacturing
method
# of batches Blend potency
variability
(‘blend RSD’, %)
Stratified tablet
potency variability
(‘tablet RSD’, %)
Direct compression 693 3.6 2.9
All Dry granulation 19 3.5 4.6
Wet granulation 97 5.3 2.6
Direct compression 375 3.6 2.5
1-5% Dry granulation 19 3.5 4.6
Wet granulation 30 3.1 2.5

Page 15 of 21
Figure 1: Relationship between percentage of API in the product and the batch size
(squares = direct compression, circles = dry granulation, diamonds = wet granulation)

Page 16 of 21
Figure 2: Manufacturing methods used by each company responding to the survey
(WG = wet granulation, DG = dry granulation, DC = direct compression)

Page 17 of 21
Figure 3: Percentage API distribution for each manufacturing method
(WG = wet granulation, DG = dry granulation, DC = direct compression)
Page 18 of 21
Figure 4: Relationship between percentage API and blend sample variability
Blend RSD0 2 4 6 8 10 12 14 16 18
80
70
60
50
40
30
20
10
0

Page 19 of 21
Figure 5: Relationship between dose strength and blend sample variability

Page 20 of 21
Figure 6: Blend sample variability distribution for each method of manufacturing
(WG = wet granulation, DG = dry granulation, DC = direct compression)

Page 21 of 21
Figure 7: Stratified tablet sample variability distribution for each manufacturing method
(WG = wet granulation, DG = dry granulation, DC = direct compression)