Embed Size (px)
Citation preview

The top place where talent wants to live, work and invest92 93Annual Plan 2013-14
IntroductionThe Funding Impact Statement (FIS) is one of the key statements included in this Annual Plan. Essentially it pulls together all the information from each of the different groups of activities and sets out in a single statement the sources of both the operating and capital funding for everything that Council does.
This statement is prepared in a different format to most of the other financial statements included in this plan and, in one sheet, provides a synthesis of Council’s overall funding requirements.
The format of this statement has been prescribed in the legislation and does not have to meet the normal accounting requirements. The intention is that this new format provides a more understandable picture of what Council is spending money on and how those expenditures are funded.
The FIS for the whole of Council position follows the analysis of rate types and the methodologies for applying them. This table represents the consolidated position for all activities. There is also a FIS for each of the individual groups of activities, and these follow at the end of the rate type analysis.
The second and perhaps, more important purpose of the FIS is to set out the basis of rating which Council proposes for the term of this Annual Plan.
Legislative RequirementsThe Local Government Act 2002 requires that Council include a FIS in the Annual Plan. This statement must include the following information:
• The sources of funding to be used by the local authority • The amount of funds expected to be produced from each source
How the funds are to be applied.
The Revenue and Financing Policy, which was consulted on in the Draft Annual Plan provides the basis for the final rates included in this Funding Impact Statement.
Key features of this Funding Impact StatementThe Draft Annual Plan discussed the introduction of a new system of rating for the district and included details of both the current and the proposed new "fairer" systems.
There were a number of submissions to these proposals, in support and opposed.
After taking into consideration all the submissions, Council decided to introduce an amalgam of both systems.
Essentially Council is retaining the key features of the current rating system, including the two differentials for the General Rate, the basis of setting the UAGC and the ward rate, but is reducing the commercial differential from 3 to 2.75 times the general differential.
In addition Council has decided to introduce a new roading rate to recover 10% of the cost of roading less the total recovered by way of the roading uniform annual rate. This new rate is set as a differential land value rate based on the differentials included in the "fairer" system.
This new rate means that the heavy users of the roading network will be making a small contribution towards the impact that their vehicles cause. In addition Council is proposing to continue to pursue a bigger contribution from heavy traffic users, possibly through a bylaw change later this year which will look at alternate collection methods, including a possible electronic fee structure.
Finally as a result of submissions from the Paihia Community Council has agreed to double the Paihia CBD Rate to $18 for general ratepayers and $56 for commercial ratepayers.
Funding Impact Statement
What is the Funding Impact Statement

93Annual Plan 2013-14
Revenue and Financing MechanismsIn addition to the rating income, Council has a number of other sources of revenue. These additional funding sources include:
• Fees and charges • Subsidies • Depreciation funds and other reserves • Loans and borrowings • Development and financial contributions.
Summaries of Council’s income and expenditure are set out in the following statements.
Funding Impact Statements for 2013-14This table (which is in two parts) represents the whole of Council consolidated FIS for all activities. Individual statements for each group of activities follow the rating information.
Note: it is now a requirement that Water Rates, including water by meter charges, are shown under the Fees and Charges category rather than as rating income.

95Annual Plan 2013-14The top place where talent wants to live, work and invest94
Funding Impact Statement
LTP LTP Annual Plan 2012-13 2013-14 2013-14 $’000s $’000s $’000s
Sources of Operational Funding 45,817 General rates, uniform annual general charges, 46,444 45,242 rates penalties 22,801 Targeted rates (other than a targeted rate for water supply) 24,232 24,745 5,621 Subsidies and grants for operating purposes 6,284 5,720 15,492 Fees, charges, and targeted rates for water supply 17,148 15,937 399 Interest and Dividends from Investments 411 295 954 Local authority fuel tax, fines, infringement fees, 1,067 1,014 and other receipts
91,084 Total operating funding (A) 95,586 92,952
Applications of operating funding 61,153 Payments to staff and suppliers 63,409 61,746 7,120 Finance costs 7,732 6,579 - Internal charges and overheads applied - - Other operating funding applications
68,272 Total applications of operating funds (B) 71,140 68,324
22,811 Surplus(deficit)ofoperatingfunding(A-B) 24,446 24,628
Sources of capital funding 16,075 Subsidies and grants for capital expenditure 12,027 10,257 484 Development and financial contributions 492 487 10,762 Increase (decrease) in debt 9,343 9,001 - Gross proceeds from sale of assets - - Lump sum contributions
27,321 Total sources of capital funding (C) 21,862 19,745
LTP LTP Annual Plan 2012-13 2013-14 2013-14 $’000s $’000s $’000s
Applications of capital funding Capital Expenditure 902 - to meet additional demand 1,561 1,585 26,482 - to improve the level of service 22,826 19,763 24,038 - to replace existing assets 19,693 21,526 (1,290) Increase (decrease) in reserves 2,228 1,499 Increase (decrease) in investments
50,132 Total applications of capital funding (D) 46,308 44,373
(22,811) Surplus(deficit)ofcapitalfunding(C-D) (24,446) (24,628)
- Funding balance ((A - B) + (C - D)) - -
FUNdiNg iMPACt stAteMeNt FoR 2013-14 ANNUAL PLANFor the year ended 30 June 2014

95Annual Plan 2013-14
Funding Impact Statement
Council has set the following rates for the 2013-14 rating year. These rates are based on the budgets set out in the Plan together with the land values and property numbers contained within the current Rating Information Database.
General RatesGeneral RateCouncil has set a General Rate on the basis of Land Value to fund its general activities. This rate has been set on a differential basis as described in the differential section below.
The activity statements included in this plan set out how the general rates has been applied (Local Government (Rating) Act 2002 Section 13 (2)(b)).
Uniform Annual General Charge (UAGC)Council has set a UAGC on the basis of one charge in respect of every separately used or inhabited part of a rating unit. This rate has been set to at a level to ensure that the total UAGC, Roading Uniform Rate and the differential Ward Rate does not exceed 34% (SUIP) (Local Government (Rating) Act 2002 Section 15(b)). Note: the legislation sets the maximum of all uniform charges at 30% of total rate revenue. Because the Ward Rate is set on a differential basis it does not form part of the 30% calculation.
Targeted RatesCouncil has set the following targeted rates:
Roading RateCouncil has set two targeted rates to fund a portion of the costs of its roading activities:
• A targeted rate on the basis of a uniform amount payable by every separately used or inhabited part of a rating unit to fund part of the total costs of the activity. (Local Government (Rating) Act 2002 Section 16 & Schedule 3 Clause 7)
• A targeted rate on the basis of Land Value to fund 10% of the balance of the roading activity not funded by the uniform roading rate. This rate has been set on a differential basis according to land use as described in the differential section below. (Local Government (Rating) Act 2002 Section 16 & Schedule 3 Clause 3).
Ward RatesCouncil has set a targeted rate on the basis of a fixed amount payable by every separately used or inhabited part of a rating unit to fund urban and recreational and other local services and activities within the three wards of the district.
This rate has been set on a differential basis according to the ward in which the rating unit is located as described in the differential section below. (Local Government (Rating) Act 2002 Section 16 & Schedule 3 Clause 7).
Stormwater RatesCouncil has set a targeted rate to fund stormwater developments across the district. This rate is payable by every rating unit that is located within defined urban settlements which are provided with stormwater disposal services.
This rate has been set on a differential basis according to land use as described in the differential section below. (Local Government (Rating) Act 2002 Section 16 & Schedule 3 Clause 7)
Kerikeri Mainstreet RateCouncil has set a targeted rate on the basis of a fixed amount payable by every separately used or inhabited part of a rating unit to fund the Kerikeri Main Street project. The area to be rated includes the whole of the former Kerikeri/Paihia Community with the exclusion of the area to the south of the Waitangi River.
This rate has been set on a differential basis according to land use as described in the differential section below. (Local Government (Rating) Act 2002 Section 16 & Schedule 3 Clause 7)
Rates for 2013-14

97Annual Plan 2013-14The top place where talent wants to live, work and invest96
Funding Impact Statement
Paihia Central Business District Development RateCouncil has set a targeted rate on the basis of a fixed amount payable by every separately used or inhabited part of a rating unit to fund improvements to the Paihia Central Business Area. The rated area includes rating rolls 00221, 00223, 00225, 00227 but excludes any rating units in those rolls which currently pay the Kerikeri Mainstreet Rate.
This rate has been set on a differential basis according to land use as described in the differential section below. (Local Government (Rating) Act 2002 Section 16 & Schedule 3 Clause 7)
Kaitaia Business Improvement District RateCouncil has set a targeted rate to support the Kaitaia Business Improvement District. This rate has been set on the basis of land value assessed over all commercial properties within the defined rating area. (Local Government (Rating) Act 2002, Section 16 & Schedule 3 Clause 3).
Tanekaha Lane Improvement RateAt the request of the community, Council has set a targeted rate to fund the sealing of Tanekaha Lane, Kerikeri. The rating area is shown in the map included at the end of this statement. This proposal has been developed in accordance with Council’s policy which allows a community to ask Council to seal certain roads where that community agrees to directly fund the equivalent of the subsidy that would have been received if the project had qualified.
In accordance with the provisions of this policy, the area benefiting from this road sealing has been defined and a poll of ratepayers has been carried out. The proposal has been supported by 89% of ratepayers.
This rate has been set on the basis of a uniform amount and a rate based on land area, as follows:
• A targeted rate on the basis of a uniform amount payable by every separately used or inhabited part of a rating unit to fund 50% of the total costs of the activity. (Local Government (Rating) Act 2002 Section 16 & Schedule 3 Clause 7)
• A targeted rate on the basis of a rate per hectare of land within each rating unit to fund the balance of the activity. (Local Government (Rating) Act 2002, Section 16 & Schedule 3 Clause 5).
Sewerage RatesCouncil has set a series of targeted rates for sewerage services.
Capital Rates (Set on the basis of the scheme)
1. A separate targeted rate for the capital costs associated with the provision of sewerage services to each of the district’s sewerage schemes. These rates have been set on the basis of fixed amounts payable by every separately used or inhabited part of a rating that are connected, either directly or indirectly, to each of the public reticulated wastewater disposal system.
2. Where a rating unit is capable of being connected to a public reticulated wastewater disposal system, but is not so connected, a targeted rate will be set as a flat amount on every rating unit that is capable of being connected. (Local Government (Rating) Act 2002, Section 16 & Schedule 3 Clause 7 & 9).
3. Where the total number of water closets or urinals connected either directly or indirectly in a rating unit in each of the sewerage schemes exceeds two, or where the total number of water closets or urinals connected either directly or indirectly exceeds two for every separately used or inhabited part of the rating unit which has been assessed the charge under 1 above, a targeted rate will be set in respect of every subsequent water closet or urinal in the rating unit. (Local Government (Rating) Act 2002, Section 16 & Schedule 3 Clauses 7 & 12)
These rates are set differentially according to availability of service as described in the differential section below.
Operating Rates (Set district wide)
1. Council has set a targeted rate for the operating costs associated with the provision of sewerage services. This rate has been set on the basis of a flat amount on every separately used or inhabited part of a rating unit that is connected, either directly or indirectly, to a public reticulated wastewater disposal system. (Local Government (Rating) Act 2002, Section 16 & Schedule 3 Clause 7)

97Annual Plan 2013-14
2. Where the total number of water closets or urinals connected either directly or indirectly in a rating unit exceeds two, or where the total number of water closets or urinals connected either directly or indirectly exceeds two for every separately used or inhabited part of the rating unit which has been assessed the rate under 1 above, a targeted rate on the basis of a flat amount will be set in respect of every subsequent water closet or urinal in the rating unit. (Local Government (Rating) Act 2002, Section 16 & Schedule 3 Clauses 7 & 12).
Rating units that are outside of one of the defined sewerage schemes and that are neither connected to, nor capable of connection to a public reticulated sewerage system, will not be liable for this rate.
Water RatesCouncil has set a series of targeted rates for water supply.
Capital Rates (Set on the basis of the scheme)
1. A separate targeted rate for the capital costs associated with the provision of water services to each of the district’s water supply schemes. This rate has been set on the basis of a flat amount on every separately used or inhabited part of a rating unit that is connected, either directly or indirectly, to a public reticulated water supply system.
2. Where a rating unit is capable of being connected to a public reticulated water supply system, but is not so
connected, a targeted rate has been set on the basis of a flat amount on every rating unit that is capable of being connected. (Local Government (Rating) Act 2002, Section 16 & Schedule 3 Clause 8 & 9)
These rates are set differentially according to availability of service as described in the differential section below.
Operating Rates (Set district wide)
1. A targeted rate for a water supply based on the volume of water supplied or consumed by a separately used or inhabited part of a rating unit, as recorded by meter. (Local Government (Rating) Act 2002, Section 19)
2. A targeted rate for a potable water supply to every separately used or inhabited part of a rating unit which is supplied with water other than through a water meter. This rate is based on a flat amount equivalent to the supply of 250 cubic metres of water per annum. (Local Government (Rating) Act 2002, Section 16 & Schedule 3 Clause 8 & 9)
3. A targeted rate for a non-potable water supply to every separately used or inhabited part of a rating unit which is supplied with water other than through a water meter. This rate is based on a flat amount equivalent to the supply of 250 cubic metres of water per annum. (Local Government (Rating) Act 2002, Section 16 & Schedule 3 Clause 8 & 9)
Rating units that are outside of one of the defined water supply schemes and that are neither connected to, nor
capable of connection to a public reticulated water supply system, will not be liable for this rate.
Land Drainage RatesThere are four different Land Drainage rating areas in the Far North District.
Kaikino Drainage Area:
Council has set a targeted rate for land drainage in the Kaikino Drainage area. This rate is based on a rate per hectare of land within each rating unit.
This rate is differentiated according to location as described in the differential section on the following page. (Local Government (Rating) Act 2002 Section 16 & Schedule 3 Clause 5).
Kaitaia Drainage District:
Council has set a targeted rate for land drainage in the Kaitaia Drainage District based on a rate per hectare of land area within each rating unit. (Local Government (Rating) Act 2002, Section 16 & Schedule 3 Clause 5).
Motutangi Drainage District:
Council has set a targeted rate for land drainage in the Motutangi Drainage area. This rate is based on a rate per hectare of land within each rating unit.
This rate is differentiated according to location as described in the differential section on the following page. (Local Govern-ment (Rating) Act 2002 Section 16 & Schedule 3 Clause 5).

99Annual Plan 2013-14The top place where talent wants to live, work and invest98
Funding Impact Statement
Waiharara Drainage District:
Council has set a targeted rate for land drainage in the Waiharara Drainage area. This rate is based on a rate per hectare of land within each rating unit.
This rate is differentiated according to location as described in the differential section below. (Local Government (Rating) Act 2002 Section 16 & Schedule 3 Clause 5).
Lump Sum ContributionsCouncil is not seeking any lump sum contributions in respect of any targeted rates. (Local Government Act 2002 Schedule 10 Clause 4(e)
Differential Description Land Use Codes
General These are rating units which have a non-commercial use according based on their land use codes. 0, 1, 2, 9, 10 to 17, 19 to 29, 90, 91, 92 & 97-99
Commercial These are rating units which have some form of commercial or industrial use or are used primarily for commercial purposes as defined by their land use codes. The differential also includes some general land uses where the actual uses are defined as commercial in nature
3, 4, 5, 6, 7, 8, 18, 30 to 89, 93, 94, 95,& 96
Differential Description Land Use Codes
Residential These are rating units which have residential land uses or are used primarily for residential purposes 9, 90,91,92 & 97 - 99 (93 - 96 may also be treated as residential in certain circumstances) depending on circumstances)
Lifestyle These are rating units which have lifestyle land uses 2 & 20 - 29
Commercial These are rating units which have some form of commercial land use or are used primarily for commercial purposes
3 - 6, 8. 30 - 39, 40 - 49, 50-59, 60-69, 80-89, 93, 94 (95 & 96 may also be treated as commercial depending on circumstances)
DifferentialsGeneral Rate DifferentialsThe General Rate differentials are based on land use as set out following table below (Local Government (Rating) Act 2002, Schedule 2 Clause 1).
Roading Rate DifferentialsThe Roading Rate differentials are based on land use as set out following table below (Local Government (Rating) Act 2002, Schedule 2 Clause 1).

99Annual Plan 2013-14
Ward RateThe Ward Rate differentials are based on the ward within which each rating unit is located. They include:
• Te Hiku Ward • Bay of Islands – Whangaroa Ward • Kaikohe – Hokianga Ward
(Local Government (Rating) Act 2002 Schedule 2 Clause 6).
Stormwater Rate, Kerikeri Mainstreet Rate, Paihia Central Business District Development RateThe differential categories for each of these rates are based on land use, they include:
• General – all rating units which are not included in the commercial stormwater differential category.
• Commercial – all rating units which are charged the General Rate Commercial Differential (Local Government (Rating) Act 2002, Schedule 2 Clause 1).
Sewerage Rates These rates are set differentially according to availability of service as follows:
Connected – Any separately used or inhabited part of a rating unit that is connected either directly or indirectly to a public reticulated sewage disposal system.
Serviceable or Available – Any rating unit that is not connected to a public reticulated sewage disposal system but is within 30 metres of the reticulation, is within a defined “area of benefit” and Council will allow the rating unit to connect. (Local Government (Rating) Act 2002, Schedule 2 Clause 5)
Water RatesConnected – Any separately used or inhabited part of a rating unit that is connected either directly or indirectly to a public reticulated water supply system. (Local Government (Rating) Act 2002 Schedule 2 Clause 5).
Differential Description Land Use Codes
Commercial These are rating units which have some form of commercial land use or are used primarily for commercial purposes
3 - 6, 8. 30 - 39, 40 - 49, 50-59, 60-69, 80-89, 93, 94 (95 & 96 may also be treated as commercial depending on circumstances)
Industrial These are rating units which have some form of Industrial land use or are used primarily for industrial purposes 7, 70-79
Primary General These are rating units which have some form of primary or farming land use or are used primarily for farming purposes other than land used for dairy or horticulture
1, 10, 12-14, 16, 19
Horticulture These are rating units which have horticultural, market garden or other similar land uses 15
Dairy These are rating units which have dairy land uses 11
Forestry These are rating units which have forestry land uses but exclude land which is categorised under the Valuer General’s Rules as Indigenous forests or Protected forests of any type
17
Mining/Quarry These are rating units which have mining or quarry land uses 18
Other These are rating units where the defined land use is inconsistent or cannot be determined

101Annual Plan 2013-14The top place where talent wants to live, work and invest100
Funding Impact Statement
Serviceable or Available – Any rating unit that is not connected to a public reticulated water supply system but is within 100 metres of the reticulation, is within a defined “area of benefit” and Council will allow the rating unit to connect. (Local Government (Rating) Act 2002 Schedule 2 Clause 5).
Land Drainage RatesThe differential land drainage rates are set on the basis of location (Local Government (Rating) Act 2002 Schedule 2 Clause 6).
Exemptions to Land Use DifferentialsNotwithstanding the above, Council retains the right to apply a different differential where it can be demonstrated, to its satisfaction, that the actual use of the entire rating unit differs from that described by the current land use code.
Council also reserves the right to apply a different differential to any separately used or inhabited part of a rating unit if it can be demonstrated, to its satisfaction, that the actual use of that part differs from that described by the current land use code for the entire rating unit.
For Council to be able to apply two or more differentials to a single rating unit the area of the land that is used for each purpose must be capable of clear definition and separate valuation.
In some instances there may be two or more different uses taking place on the rating unit but it is not possible or practical to define the areas separately. In those instances, the differential category will be based on the “highest and best use” applied by the Council’s Valuation Service Provider and the rates will be set accordingly.
Where the area of the land used for the different purpose is only minimal or cannot be separately defined, Council reserves the right not to assess that part using a different differential.
In every instance where Council proposes to change the differential on a rating unit from one category to another category it will consult with the owner concerned and give them the opportunity to lodge an objection to that proposal.
Where any rating unit or separately used or inhabited part of a rating unit would normally be subject to the General Rate commercial differential but complies with one or more of the exceptions set out below, that rating unit will be subject to the General Rate general differential.
• Where the rating unit or part thereof is in receipt of a remission of rates pursuant to a policy adopted by Council and is not used for private pecuniary profit and is not subject to a licence for the sale of liquor
• Is used solely for the purposes of providing private rental accommodation. However this exclusion does not include properties such as hotels, motels or other forms of visitor accommodation except as excluded below
• Bed and breakfast establishments, home or farm stay operations or similar accommodation providers where less than six bedrooms are provided for guest accommodation. Such properties will however, be subject to any additional sewerage charges where additional toilets are provided for guest use, for example ensuite facilities.

101Annual Plan 2013-14
Rates for 2013-14Set out in the following tables are the rates which Council has set for the 2013-14 rating year. For comparison purposes the rates for the 2012-13 rating year are also shown.
Please note all rates include GST.
Rate Basis of AssessmentDifferential
Matters
2012-13 2013-14
Rate or Charge Total Rate Rate or Charge Total Rate
1. GENERAL RATES
1.1 Uniform Annual General Charge Per SUIP $411.40 $14,447,921 $417.00 $14,785,986
1.2 General Rate
1.2.1 General Land Differential Per $ of Land Value 1 0.0037855 $31,003,740 0.0036940 $30,280,207
1.2.2 Commercial Differential Per $ of Land Value 1 0.0113565 $5,006,020 0.0101586 $4,660,324
2. TARGETED WARD SERVICES RATE
2.1 Eastern Ward Differential Per SUIP 6 $314.02 $4,861,639 $314.86 $4,960,284
2.2 Northern Ward Differential Per SUIP 6 $264.58 $3,153,811 $266.06 $3,200,406
2.3 Western Ward Differential Per SUIP 6 $339.78 $2,551,055 $326.85 $2,508,558
3. TARGETED ROADING RATES
3.1 Uniform Roading Rate Per SUIP $100.00 $3,511,900 $100.00 $3,545,800
3.2 Roading Differential Rate
3.2.1 Residential Per $ of Land Value 1 $- $- $0.0001186 $377,259
3.2.2 Lifestyle Per $ of Land Value 1 $- $- $0.0001043 $257,427
3.2.3 Farming Gen Per $ of Land Value 1 $- $- $0.0001172 $208,258
3.2.4 Horticulture Per $ of Land Value 1 $- $- $0.0001178 $13,000
3.2.5 Dairy Per $ of Land Value 1 $- $- $0.0001901 $90,099
3.2.6 Forestry Per $ of Land Value 1 $- $- $0.0014144 $166,040

103Annual Plan 2013-14The top place where talent wants to live, work and invest102
Rate Basis of AssessmentDifferential
Matters
2012-13 2013-14
Rate or Charge Total Rate Rate or Charge Total Rate
3.2.7 Commercial Per $ of Land Value 1 $- $- $0.0002426 $88,684
3.2. Industrial Per $ of Land Value 1 $- $- $0.0002809 $24,456
3.2.9 Mining/Quarry Per $ of Land Value 1 $- $- $0.0083162 $51,485
3.2.10 Other Per $ of Land Value 1 $- $- $0.0001784 $12,871
4. STORMWATER TARGETED RATES
4.1 General Differential Per rating unit 1 $35.78 $418,197 $35.78 $431,364
4.2 Commercial Differential Per rating unit 1 $71.56 $87,017 $71.56 $90,523
5. TARGETED DEVELOPMENT RATES
5.1 Kerikeri Mainstreet Rate
5.1.1 General Differential Per SUIP 1 $9.20 $54,349 $9.20 $55,297
5.1.2 Commercial Differential Per SUIP 1 $27.60 $10,677 $27.60 $12,917
5.2 Paihia CBD Development Rate
5.2.1 General Differential Per SUIP 1 $9.20 $18,078 $18.00 $35,370
5.2.2 Commercial Differential Per SUIP 1 $27.60 $8,832 $56.00 $17,920
5.3 Kaitaia BID Rate Per $ of Land Value 0.0010171 $57,500 0.0010171 $57,500
6. PRIVATE ROAD SEALING RATE
6.1 Tanekaha Lane Road Sealing
6.1.1 Uniform Rate Per SUIP $- $- $310.78 $4,351
6.1.2 Area rate Per Hectare of land area $- $- $89.65 $4,351
7. SEWERAGE TARGETED RATES
7.1 Sewerage Capital Rates
Funding Impact Statement

103Annual Plan 2013-14
Rate Basis of AssessmentDifferential
Matters
2012-13 2013-14
Rate or Charge Total Rate Rate or Charge Total Rate
7.1.1 Connected Rates
7.1.1.1 Ahipara Per SUIP 5 $303.53 $146,728 $297.33 $143,908
7.1.1.2 Awanui Per SUIP 5 $258.55 $36,898 $298.89 $42,143
7.1.1.3 East Coast Per SUIP 5 $273.17 $359,642 $258.18 $342,863
7.1.1.4 Hihi Per SUIP 5 $499.86 $76,359 $719.86 $110,858
7.1.1.5 Kaeo Per SUIP 5 $697.62 $119,889 $756.09 $127,779
7.1.1.6 Kaikohe Per SUIP 5 $214.69 $357,089 $217.47 $361,218
7.1.1.7 Kaitaia Per SUIP 5 $258.55 $622,843 $298.89 $719,129
7.1.1.8 Kawakawa Per SUIP 5 $671.17 $386,503 $646.00 $371,450
7.1.1.9 Kerikeri Per SUIP 5 $394.49 $409,149 $417.13 $432,564
7.1.1.10 Kohukohu Per SUIP 5 $552.56 $47,758 $740.41 $63,675
7.1.1.11 Opononi Per SUIP 5 $300.53 $109,940 $296.72 $109,490
7.1.1.12 Paihia Per SUIP 5 $374.61 $659,598 $473.15 $838,895
7.1.1.13 Rangiputa Per SUIP 5 $298.37 $28,787 $321.53 $30,867
7.1.1.14 Rawene Per SUIP 5 $548.03 $127,228 $526.66 $121,132
7.1.1.15 Russell Per SUIP 5 $692.20 $368,700 $670.69 $348,759
7.1.1.16 Whangaroa Per SUIP 5 $449.36 $6,322 $545.49 $7,637
7.1.1.17 Whatuwhiwhi Per SUIP 5 $380.07 $241,023 $349.86 $223,910
7.1.2 Availability Rates
7.1.2.1 Ahipara Per SUIP 5 $303.53 $36,120 $297.33 $46,086
7.1.2.2 Awanui Per SUIP 5 $258.55 $2,586 $298.89 $2,690
7.1.2.3 East Coast Per SUIP 5 $273.17 $139,590 $258.18 $133,995
7.1.2.4 Hihi Per SUIP 5 $499.86 $16,995 $719.86 $20,876
7.1.2.5 Kaeo Per SUIP 5 $697.62 $7,674 $756.09 $7,561
105Annual Plan 2013-14The top place where talent wants to live, work and invest104
Rate Basis of AssessmentDifferential
Matters
2012-13 2013-14
Rate or Charge Total Rate Rate or Charge Total Rate
7.1.2.6 Kaikohe Per SUIP 5 $214.69 $17,175 $217.47 $17,398
7.1.2.7 Kaitaia Per SUIP 5 $258.55 $26,114 $298.89 $27,797
7.1.2.8 Kawakawa Per SUIP 5 $671.17 $6,041 $646.00 $6,460
7.1.2.9 Kerikeri Per SUIP 5 $394.49 $43,788 $417.13 $45,884
7.1.2.10 Kohukohu Per SUIP 5 $552.56 $5,526 $740.41 $8,145
7.1.2.11 Opononi Per SUIP 5 $300.53 $36,364 $296.72 $35,903
7.1.2.12 Paihia Per SUIP 5 $374.61 $70,427 $473.15 $95,576
7.1.2.13 Rangiputa Per SUIP 5 $298.37 $8,653 $321.53 $8,360
7.1.2.14 Rawene Per SUIP 5 $548.03 $19,729 $526.66 $18,960
7.1.2.15 Russell Per SUIP 5 $692.20 $119,058 $670.69 $113,347
7.1.2.16 Whangaroa Per SUIP 5 $449.36 $4,494 $545.49 $2,727
7.1.2.17 Whatuwhiwhi Per SUIP 5 $380.07 $189,655 $349.86 $172,481
7.1.3 Additional Pans
7.1.3.1 AhiparaPer pan for the 3rd and subsequent WC or Urinal in the SUIP
5 $182.12 $5,828 $178.40 $5,709
7.1.3.2 Awanui " 5 $155.13 $10,549 $179.33 $12,194
7.1.3.3 East Coast " 5 $163.90 $16,226 $154.91 $15,336
7.1.3.4 Hihi " 5 $299.92 $2,099 $431.92 $3,023
7.1.3.5 Kaeo " 5 $418.57 $38,927 $453.65 $42,189
7.1.3.6 Kaikohe " 5 $128.81 $96,608 $130.48 $97,860
7.1.3.7 Kaitaia " 5 $155.13 $103,317 $179.33 $119,434
7.1.3.8 Kawakawa " 5 $402.70 $62,419 $387.60 $60,078
7.1.3.9 Kerikeri " 5 $236.69 $60,829 $250.28 $64,322
Funding Impact Statement

105Annual Plan 2013-14
Rate Basis of AssessmentDifferential
Matters
2012-13 2013-14
Rate or Charge Total Rate Rate or Charge Total Rate
7.1.3.10 Kohukohu " 5 $331.54 $5,305 $444.25 $7,108
7.1.3.11 Opononi " 5 $180.32 $18,573 $178.03 $18,337
7.1.3.12 Paihia " 5 $224.77 $272,871 $283.89 $341,236
7.1.3.13 Rangiputa " 5 $179.02 $716 $192.92 $772
7.1.3.14 Rawene " 5 $328.82 $12,495 $316.00 $12,008
7.1.3.15 Russell " 5 $415.32 $53,992 $402.41 $52,313
7.1.3.16 Whangaroa " 5 $269.62 $2,966 $327.29 $3,600
7.1.3.17 Whatuwhiwhi " 5 $228.04 $3,649 $209.92 $3,359
7.2 Sewerage Operating Rate
7.2.1 Connected Rate Per SUIP $417.56 $4,875,048 $447.00 $5,222,331
7.2.2 Additional PansPer pan for the 3rd and subsequent WC or Urinal in the SUIP
$250.54 $916,726 $268.20 $978,131
8. WATER TARGETED RATES
8.1 Water Capital Rates
8.1.1 Connected Rates
8.1.1.1 Kaikohe Per SUIP 5 $171.43 $316,288 $208.54 $385,799
8.1.1.2 Kaitaia Per SUIP 5 $153.30 $386,929 $230.77 $585,002
8.1.1.3 Kawakawa Per SUIP 5 $172.70 $200,505 $218.69 $255,430
8.1.1.4 Kerikeri Per SUIP 5 $101.40 $222,573 $116.95 $257,758
8.1.1.5 Okaihau Per SUIP 5 $184.87 $31,798 $226.62 $38,979
8.1.1.6 Omapere/Opononi Per SUIP 5 $372.43 $138,916 $419.47 $158,140
8.1.1.7 Paihia Per SUIP 5 $124.74 $240,998 $139.62 $275,191
8.1.1.8 Rawene Per SUIP 5 $194.60 $59,937 $203.29 $62,613

107Annual Plan 2013-14The top place where talent wants to live, work and invest106
Rate Basis of AssessmentDifferential
Matters
2012-13 2013-14
Rate or Charge Total Rate Rate or Charge Total Rate
8.1.2 Availability Rates
8.1.2.1 Kaikohe Per rating unit 5 $171.43 $12,686 $208.54 $16,266
8.1.2.2 Kaitaia Per rating unit 5 $153.30 $11,651 $230.77 $18,231
8.1.2.3 Kawakawa Per rating unit 5 $172.70 $7,081 $218.69 $7,873
8.1.2.4 Kerikeri Per rating unit 5 $101.40 $17,035 $116.95 $17,192
8.1.2.5 Okaihau Per rating unit 5 $184.87 $924 $226.62 $1,360
8.1.2.6 Omapere/Opononi Per rating unit 5 $372.43 $38,360 $419.47 $42,366
8.1.2.7 Paihia Per rating unit 5 $124.74 $11,726 $139.62 $11,868
8.1.2.8 Rawene Per rating unit 5 $194.60 $4,476 $203.29 $4,066
8.2 Water Operating Rates
8.2.1 Water by Meter Rates
8.2.1.1 Potable WaterPer cubic metre of water consumed as recorded by a water meter
$3.00 $6,929,312 $3.06 $7,067,899
8.2.1.2 Non-potable Water $1.95 $1,950 $1.99 $1,989
8.3 Non-Metered Rates
8.3.1 Non-metered Potable RatePer rating unit or separatly used or inhabited part of the rating unit
$902.04 $116,363 $955.73 $127,113
8.3.2 Non-metered non-potable Rate $639.54 $9,593 $687.98 $4,816
9. DRAINAGE TARGETED RATES
9.1 Kaitaia Drainage Area Per Hectare of land area $6.90 $70,061 $6.90 $70,061
9.2 Kaikino Drainage Area
9.2.1 Differential A Per Hectare of land area 6 $9.41 $3,543 $9.41 $3,543
9.2.2 Differential B Per Hectare of land area 6 $4.71 $1,924 $4.71 $1,924
9.2.3 Differential C Per Hectare of land area 6 $1.57 $2,109 $1.57 $2,109
Funding Impact Statement

107Annual Plan 2013-14
Rate Basis of AssessmentDifferential
Matters
2012-13 2013-14
Rate or Charge Total Rate Rate or Charge Total Rate
9.3 Motutangi Drainage Area
9.3.1 Differential A Per Hectare of land area 6 $20.09 $7,492 $20.09 $7,492
9.3.2 Differential B Per Hectare of land area 6 $10.05 $5,051 $10.05 $5,051
9.3.3 Differential C Per Hectare of land area 6 $3.35 $4,908 $3.35 $4,908
9.4 Waiharara
9.4.1 Differential A Per Hectare of land area 6 $13.64 $1,955 $13.64 $1,955
9.4.2 Differential B Per Hectare of land area 6 $6.82 $3,707 $6.82 $3,707
9.4.3 Differential C Per Hectare of land area 6 $2.28 $1,127 $2.28 $1,127
Note: the differential matters refer to the Local Government (Rating) Act 2002 2nd Schedule1 - Land Use 5 - The provision or availability of a service 6 - Where the land is situated

109Annual Plan 2013-14The top place where talent wants to live, work and invest108
Funding Impact Statement
Example RatesSet out below and on the next 3 pages are examples of the rates on a range of land uses and property land values. Additionally examples are shown for different communities based on average values.
Ave Land Value
RATES AND CHARGES - 2013-14 (Rounded to the nearest $)
Property Example2012-13
Final RatesGeneral Rates UAGC
RoadingUAC
RoadingRate
Ward Rate
Storm UAC
Water Rate (ave)
Sewer Capital
Sewer Op
Other Rates
Final Rates
Change $
Change %
Property valuesHigh Value Residential $500,000 $3,665 $1,847 $417 $100 $59 $301 $36 $191 $376 $447 $- $3,774 $109 3.0%Average Value Residential $157,332 $2,368 $581 $417 $100 $19 $301 $36 $191 $376 $447 $- $2,468 $100 4.2%
Median Value Residential $124,000 $2,241 $458 $417 $100 $15 $301 $36 $191 $376 $447 $- $2,340 $99 4.4%
Low Value Residential $25,000 $1,867 $92 $417 $100 $3 $301 $36 $191 $376 $447 $- $1,963 $96 5.2%High Value Lifestyle $500,000 $2,707 $1,847 $417 $100 $52 $301 $- $- $- $- $- $2,717 $10 0.4%Average Value Lifestyle $271,649 $1,842 $1,003 $417 $100 $28 $301 $- $- $- $- $- $1,850 $7 0.4%Median Value Lifestyle $180,000 $1,495 $665 $417 $100 $19 $301 $- $- $- $- $- $1,502 $6 0.4%Low Value Lifestyle $118,000 $1,261 $436 $417 $100 $12 $301 $- $- $- $- $- $1,266 $5 0.4%High Value General Farming $620,000 $3,161 $2,290 $417 $100 $73 $301 $- $- $- $- $- $3,181 $20 0.6%Average Value General Farming $613,709 $3,137 $2,267 $417 $100 $72 $301 $- $- $- $- $- $3,157 $20 0.6%Median Value General Farming $325,000 $2,044 $1,201 $417 $100 $38 $301 $- $- $- $- $- $2,057 $12 0.6%Low Value General Farming $160,000 $1,420 $591 $417 $100 $19 $301 $- $- $- $- $- $1,428 $8 0.6%High Value Horticulture/Orchard $510,000 $2,745 $1,884 $417 $100 $60 $301 $- $- $- $- $- $2,762 $17 0.6%Average Value Horticulture/Orchard $469,878 $2,593 $1,736 $417 $100 $55 $301 $- $- $- $- $- $2,609 $16 0.6%Median Value Horticulture/Orchard $385,000 $2,271 $1,422 $417 $100 $45 $301 $- $- $- $- $- $2,285 $14 0.6%Low Value Horticulture/Orchard $295,000 $1,931 $1,090 $417 $100 $35 $301 $- $- $- $- $- $1,942 $12 0.6%High Value Dairy $1,368,750 $5,995 $5,056 $417 $100 $260 $301 $- $- $- $- $- $6,134 $139 2.3%Average Value Dairy $1,100,347 $4,979 $4,065 $417 $100 $209 $301 $- $- $- $- $- $5,092 $112 2.3%Median Value Dairy $880,000 $4,145 $3,251 $417 $100 $167 $301 $- $- $- $- $- $4,236 $91 2.2%Low Value Dairy $540,000 $2,858 $1,995 $417 $100 $103 $301 $- $- $- $- $- $2,915 $57 2.0%

109Annual Plan 2013-14
Ave Land Value
RATES AND CHARGES - 2013-14 (Rounded to the nearest $)
Property Example2012-13
Final RatesGeneral Rates UAGC
RoadingUAC
RoadingRate
Ward Rate
Storm UAC
Water Rate (ave)
Sewer Capital
Sewer Op
Other Rates
Final Rates
Change $
Change %
High Value Forestry $2,000,000 $8,385 $7,388 $417 $100 $2,829 $301 $- $- $- $- $- $11,035 $2,650 31.6%Average Value Forestry $278,330 $1,868 $1,028 $417 $100 $394 $301 $- $- $- $- $- $2,240 $372 19.9%Median Value Forestry $92,000 $1,162 $340 $417 $100 $130 $301 $- $- $- $- $- $1,288 $126 10.8%Low Value Forestry $75,000 $1,098 $277 $417 $100 $106 $301 $- $- $- $- $- $1,201 $103 9.4%High Value Commercial $250,000 $4,647 $2,540 $417 $100 $61 $301 $36 $191 $376 $447 $- $4,468 $(179) -3.9%Average Value Commercial $237,344 $4,503 $2,411 $417 $100 $58 $301 $36 $191 $376 $447 $- $4,336 $(167) -3.7%Median Value Commercial $110,000 $3,057 $1,117 $417 $100 $27 $301 $36 $191 $376 $447 $- $3,012 $(45) -1.5%Low Value Commercial $42,250 $2,288 $429 $417 $100 $10 $301 $36 $191 $376 $447 $- $2,307 $19 0.8%High Value Industrial $235,000 $4,477 $2,387 $417 $100 $66 $301 $36 $191 $376 $447 $- $4,321 $(156) -3.5%Average Value Industrial $205,631 $4,143 $2,089 $417 $100 $58 $301 $36 $191 $376 $447 $- $4,014 $(129) -3.1%Median Value Industrial $138,000 $3,375 $1,402 $417 $100 $39 $301 $36 $191 $376 $447 $- $3,308 $(67) -2.0%Low Value Industrial $72,000 $2,626 $731 $417 $100 $20 $301 $36 $191 $376 $447 $- $2,619 $(6) -0.2%High Value Mining/Quarry $2,500,000 $29,205 $25,397 $417 $100 $20,790 $301 $- $- $- $- $- $47,005 $17,800 60.9%Average Value Mining/Quarry $193,469 $3,011 $1,965 $417 $100 $1,609 $301 $- $- $- $- $- $4,392 $1,381 45.9%Median Value Mining/Quarry $97,000 $1,916 $985 $417 $100 $807 $301 $- $- $- $- $- $2,610 $694 36.2%Low Value Mining/Quarry $62,250 $1,521 $632 $417 $100 $518 $301 $- $- $- $- $- $1,968 $447 29.4%Other $310,467 $1,989 $1,147 $417 $100 $55 $301 $- $- $- $- $- $2,020 $31 1.6%

111Annual Plan 2013-14The top place where talent wants to live, work and invest110
Funding Impact Statement
Ave Land Value
RATES AND CHARGES - 2013-14 (Rounded to the nearest $)
Property Example2012-13
Final RatesGeneral Rates UAGC
RoadingUAC
RoadingRate
Ward Rate
Storm UAC
Water Rate (ave)
Sewer Capital
Sewer Op
Other Rates
Final Rates
Change $
Change %
Te Hiku Ward Awanui - Roll 15 44,816 $1,659 $166 $417 $100 $5 $266 $36 $- $299 $447 $- $1,736 $77 4.6% Kaitaia Township - Roll 33 48,261 $1,825 $178 $417 $100 $6 $266 $36 $231 $299 $447 $- $1,980 $155 8.5%
Ahipara West Coast Values - Roll 39 165,980 $2,162 $613 $417 $100 $20 $266 $36 $- $297 $447 $- $2,196 $34 1.6%
Karikari Peninsular Values - Roll 81 155,755 $1,366 $575 $417 $100 $18 $266 $- $- $- $- $- $1,377 $11 0.8% Rangiputa Values - Roll 81 258,088 $2,505 $953 $417 $100 $31 $266 $36 $- $322 $447 $- $2,571 $66 2.6% Whatuwhiwhi Values - Roll 81 132,937 $2,113 $491 $417 $100 $16 $266 $36 $- $350 $447 $- $2,123 $9 0.4% East Coast Bays Values - Roll 83 210,323 $2,299 $777 $417 $100 $25 $266 $36 $- $258 $447 $- $2,326 $27 1.2% Hihi Values - Roll 85 165,094 $2,355 $610 $417 $100 $20 $266 $36 $- $720 $447 $- $2,615 $260 11.0%
Bay of Islands-Whangaroa Ward Whangaroa Coastal - Roll 121 323,579 $2,050 $1,195 $417 $100 $38 $315 $- $- $- $- $- $2,066 $16 0.8% Whangaroa Township - Roll 123 235,810 $2,621 $871 $417 $100 $28 $315 $36 $- $545 $447 $- $2,759 $139 5.3% Kaeo Township - Roll 133 73,296 $2,254 $271 $417 $100 $9 $315 $36 $- $756 $447 $- $2,350 $96 4.2% Purerua Peninsular - Roll 211 186,705 $1,541 $690 $417 $100 $22 $315 $- $- $- $- $9 $1,553 $12 0.8% Kerikeri/Waipapa Coastal - Roll 213 219,732 $1,666 $812 $417 $100 $26 $315 $- $- $- $- $9 $1,679 $13 0.8% Kerikeri Township - Roll 215 168,418 $2,421 $622 $417 $100 $20 $315 $36 $117 $417 $447 $9 $2,500 $79 3.3% Puketona Road / Coastal - Roll 221 159,277 $1,437 $588 $417 $100 $19 $315 $- $- $- $- $18 $1,457 $20 1.4% Haruru Falls - Roll 223 135,412 $2,301 $500 $417 $100 $16 $315 $36 $140 $473 $447 $18 $2,462 $161 7.0% Paihia - Roll 225 229,391 $2,656 $847 $417 $100 $27 $315 $36 $140 $473 $447 $18 $2,820 $164 6.2% Russell Township - Roll 411 354,073 $3,311 $1,308 $417 $100 $42 $315 $36 $- $671 $447 $- $3,335 $324 0.7%
n RESIDENTIAL RATES BY WARD AND COMMUNITY

111Annual Plan 2013-14
Ave Land Value
RATES AND CHARGES - 2013-14 (Rounded to the nearest $)
Property Example2012-13
Final RatesGeneral Rates UAGC
RoadingUAC
RoadingRate
Ward Rate
Storm UAC
Water Rate (ave)
Sewer Capital
Sewer Op
Other Rates
Final Rates
Change $
Change %
Bay of Islands/ Rawhiti - Roll 413 351,498 $2,156 $1,298 $417 $100 $42 $315 $- $- $- $- $- $2,172 $16 0.8% Kawakawa Values - Roll 419 48,363 $2,306 $179 $417 $100 $6 $315 $36 $219 $646 $447 $- $2,364 $58 2.5% Opua - Roll 423 233,891 $2,664 $864 $417 $100 $28 $315 $36 $140 $473 $447 $- $2,819 $155 5.8% Moerewa - Roll 427 12,521 $1,081 $46 $417 $100 $1 $315 $36 $219 $- $- $- $1,134 $53 4.9% Southern Rural - Roll 431 21,236 $905 $78 $417 $100 $3 $315 $- $- $- $- $- $913 $7 0.8%
Kaikohe-Hokinaga Ward Kaikohe Township - Roll 523 54,505 $1,897 $201 $417 $100 $6 $327 $36 $209 $217 $447 $- $1,960 $63 3.3% Kaikohe Rural - Roll 527 101,127 $1,234 $374 $417 $100 $12 $327 $- $- $- $- $- $1,229 $(4) -0.4% Ngawha Township - Roll 529 64,746 $1,936 $239 $417 $100 $8 $327 $36 $209 $217 $447 $- $1,999 $63 3.3% Rawene Township - Roll 611 111,315 $2,469 $411 $417 $100 $13 $327 $36 $203 $527 $447 $- $2,481 $12 0.5% Opononi / Omapere - Roll 618 177,973 $2,652 $657 $417 $100 $21 $327 $36 $419 $297 $447 $- $2,721 $70 2.6% Hokianga Rural - Roll 655 41,877 $1,010 $155 $417 $100 $5 $327 $- $- $- $- $- $1,004 $(6) -0.6% Kohukohu - Roll 659 116,251 $2,298 $429 $417 $100 $14 $327 $36 $- $740 $447 $- $2,510 $212 9.2%

113Annual Plan 2013-14The top place where talent wants to live, work and invest112
Definition of a Separately Used or Inhabited Part of a Rating UnitWhere rates are calculated on each separately used or inhabited part of a rating unit, the following definitions will apply:
Any part of a rating unit that is used or occupied by any person, other than the ratepayer, having a right to use or inhabit that part by vir tue of a tenancy, lease, licence, or other agreement.
Any part or parts of a rating unit that are used or occupied by the ratepayer for more than one single use.
The following are considered to be separately used parts of a rating unit:
• Individual flats or apartments • Separately leased commercial areas which are leased on a rating unit basis
• Vacant rating units • Single rating units which contain multiple uses such as a shop with a dwelling
• A residential building or part of a residential building that is used, or can be used as an independent residence. An independent residence is defined as having a separate entrance, cooking facilities, living facilities and toilet/bathroom facilities.
The following are not considered to be separately used parts of a rating unit:
• A residential sleep-out or granny flat that does not meet the definition of an independent residence
• A hotel room with or without kitchen facilities • A motel room with or without kitchen facilities • Individual offices or premises of business partners.
Postponement ChargesPursuant to the Local Government (Rating) 2002 Act Council will a charge postponement fee on all rates that are postponed under any of its postponement policies. The Postponement fees will be as follows:
• Application Fee: $50 • Administration Fee: $50 pa • Management Fee on the Residential Postponement Policy: 1% on the outstanding balance
• Reserve Fund Fee on the Residential Postponement Policy: 0.25% on the outstanding balance
• Counselling Fee on the Residential Postponement Policy $300
• Financing Fee on all postponements: Currently set at 6.5% pa but may vary to match Council’s average cost of funds.
At Council’s discretion all these fees may be added to the total postponement balance.
Payment of RatesRatesWith the exception of water by meter charges, Council will charge the rates for the 2013-14 rating year by way of four instalments. Each instalment must be paid on or before the due dates set out below. Any rates paid after the due date will become liable for additional charges or penalties as set out below.
Rate instalment due dates
Rate Instalment Due DateFirst instalment due date: 20 August 2013
Second instalment due date: 20 November 2013
Third instalment due date: 27 February 2014
Fourth instalment due date: 20 May 2014
Funding Impact Statement
Other Rating Policy Statements

113Annual Plan 2013-14
NOTE: Where any due date falls on a weekend or public holiday, the due date will be the first working day following the due date.
Water by MeterWater meters are read on a six-month cycle and are payable on the 20th of the month following the issue of the invoice. If the invoicing dates do change the due date will always be the 20th of the month following the invoice date.
Penalties on RatesSections 57 and 58 of the Local Government (Rating) Act 2002 empower councils to charge penalties on the late payment of rates.
Pursuant to sections 57 and 58 of the Act, Council is proposing to impose the following penalties:
1. A ten percent (10%) penalty on any portion of each instalment of rates assessed in the 2013-14 financial year that is not paid on or by the due date for payment, as stated above.
2. A further ten percent (10%) penalty on any rates assessed in any financial year prior to 1 July 2013 that remain unpaid on 1 September 2013.
3. A further ten percent 10% penalty on any rates to which a penalty has been added under (2) above that remain unpaid on 1 March 2014.
Penalties on water charges1. A ten percent (10%) penalty on any portion of the
charge for the supply of water, as separately invoiced, that is not paid on or by the due date for payment as set out on the invoice.
Groups of Activity Funding Impact StatementsThe Local Government Act 2002 now requires Council to prepare Funding Impact Statements for every Activity Group. Set out on the following pages are the proposed Funding Impact Statements for each of the Activity Groups of Council included in this Annual Plan.

115Annual Plan 2013-14The top place where talent wants to live, work and invest114
Funding Impact Statement
LTP LTP Annual Plan 2012-13 2013-14 2013-14 $’000s Project Name $’000s $’000s
Sources of Operational Funding 11,558 General rates, uniform annual general charges, 11,517 10,508 rates penalties 4,026 Targeted rates (other than a targeted rate for water supply) 4,084 5,193 5,479 Subsidies and grants for operating purposes 6,144 5,579 792 Fees, charges, and targeted rates for water supply 818 731 27 Internal charges and overheads recovered 28 28 597 Local authority fuel tax, fines, infringement fees, 616 616 and other receipts
22,479 Total operating funding (A) 23,206 22,654
Applications of operating funding 13,533 Payments to staff and suppliers 13,691 13,203 961 Finance costs 1,101 872 935 Internal charges and overheads applied 963 891 Other operating funding applications
15,428 Total applications of operating funds (B) 15,754 14,967
7,050 Surplus(deficit)ofoperatingfunding(A-B) 7,452 7,687
Sources of capital funding 9,904 Subsidies and grants for capital expenditure 7,541 8,578 - Development and financial contributions - - 2,332 Increase (decrease) in debt 776 691 - Gross proceeds from sale of assets - - Lump sum contributions
12,237 Total sources of capital funding (C) 8,317 9,269
LTP LTP Annual Plan 2012-13 2013-14 2013-14 $’000s Project Name $’000s $’000s
Applications of capital funding Capital Expenditure 732 - to meet additional demand 1,139 1,163 6,195 - to improve the level of service 3,510 2,599 12,274 - to replace existing assets 10,128 13,341 86 Increase (decrease) in reserves 992 (147) - Increase (decrease) in investments - -
19,287 Total applications of capital funding (D) 15,769 16,956
(7,050) Surplus(deficit)ofcapitalfunding(C-D) (7,452) (7,687)
- Funding balance ((A - B) + (C - D)) - -
FUNdiNg iMPACt stAteMeNt FoR 2013-14 ANNUAL PLAN RoAdiNg ANd FootPAths

115Annual Plan 2013-14
LTP LTP Annual Plan 2012-13 2013-14 2013-14 $’000s Project Name $’000s $’000s
Sources of Operational Funding 2,125 General rates, uniform annual general charges, 2,225 2,167 rates penalties 517 Targeted rates (other than a targeted rate for water supply) 520 520 - Subsidies and grants for operating purposes - - - Fees, charges, and targeted rates for water supply - - - Internal charges and overheads recovered - - - Local authority fuel tax, fines, infringement fees, - - and other receipts
2,642 Total operating funding (A) 2,745 2,688
Applications of operating funding 899 Payments to staff and suppliers 927 948 339 Finance costs 356 301 298 Internal charges and overheads applied 303 299 Other operating funding applications
1,535 Total applications of operating funds (B) 1,585 1,547
1,107 Surplus(deficit)ofoperatingfunding(A-B) 1,159 1,140
Sources of capital funding - Subsidies and grants for capital expenditure - - - Development and financial contributions - - 286 Increase (decrease) in debt 251 286 - Gross proceeds from sale of assets - - Lump sum contributions
286 Total sources of capital funding (C) 251 286
LTP LTP Annual Plan 2012-13 2013-14 2013-14 $’000s Project Name $’000s $’000s
Applications of capital funding Capital Expenditure - - to meet additional demand - - 1,095 - to improve the level of service 980 980 300 - to replace existing assets 310 310 (2) Increase (decrease) in reserves 120 136 - Increase (decrease) in investments - -
1,393 Total applications of capital funding (D) 1,410 1,426
(1,107) Surplus(deficit)ofcapitalfunding(C-D) (1,159) (1,140)
- Funding balance ((A - B) + (C - D)) - -
FUNdiNg iMPACt stAteMeNt FoR 2013-14 ANNUAL PLAN stoRMWAteR

117Annual Plan 2013-14The top place where talent wants to live, work and invest116
Funding Impact Statement
LTP LTP Annual Plan 2012-13 2013-14 2013-14 $’000s Project Name $’000s $’000s
Sources of Operational Funding 206 General rates, uniform annual general charges, 212 212 rates penalties - Targeted rates (other than a targeted rate for water supply) - - - Subsidies and grants for operating purposes - - 7,756 Fees, charges, and targeted rates for water supply 9,068 8,213 - Internal charges and overheads recovered - - - Local authority fuel tax, fines, infringement fees, - - and other receipts
7,962 Total operating funding (A) 9,280 8,425
Applications of operating funding 3,470 Payments to staff and suppliers 4,505 3,657 903 Finance costs 937 910 837 Internal charges and overheads applied 855 818 - Other operating funding applications - -
5,211 Total applications of operating funds (B) 6,298 5,385
2,751 Surplus(deficit)ofoperatingfunding(A-B) 2,982 3,040
Sources of capital funding 413 Subsidies and grants for capital expenditure 184 184 - Development and financial contributions - - 597 Increase (decrease) in debt 137 2,832 - Gross proceeds from sale of assets - - - Lump sum contributions - -
1,010 Total sources of capital funding (C) 321 3,016
LTP LTP Annual Plan 2012-13 2013-14 2013-14 $’000s Project Name $’000s $’000s
Applications of capital funding Capital Expenditure - - to meet additional demand - - 1,808 - to improve the level of service 1,290 4,112 1,985 - to replace existing assets 2,408 1,054 (32) Increase (decrease) in reserves (394) 890 - Increase (decrease) in investments - -
3,761 Total applications of capital funding (D) 3,304 6,056
(2,751) Surplus(deficit)ofcapitalfunding(C-D) (2,982) (3,040)
- Funding balance ((A - B) + (C - D)) - -
FUNdiNg iMPACt stAteMeNt FoR 2013-14 ANNUAL PLAN WAteR sUPPLY
117Annual Plan 2013-14
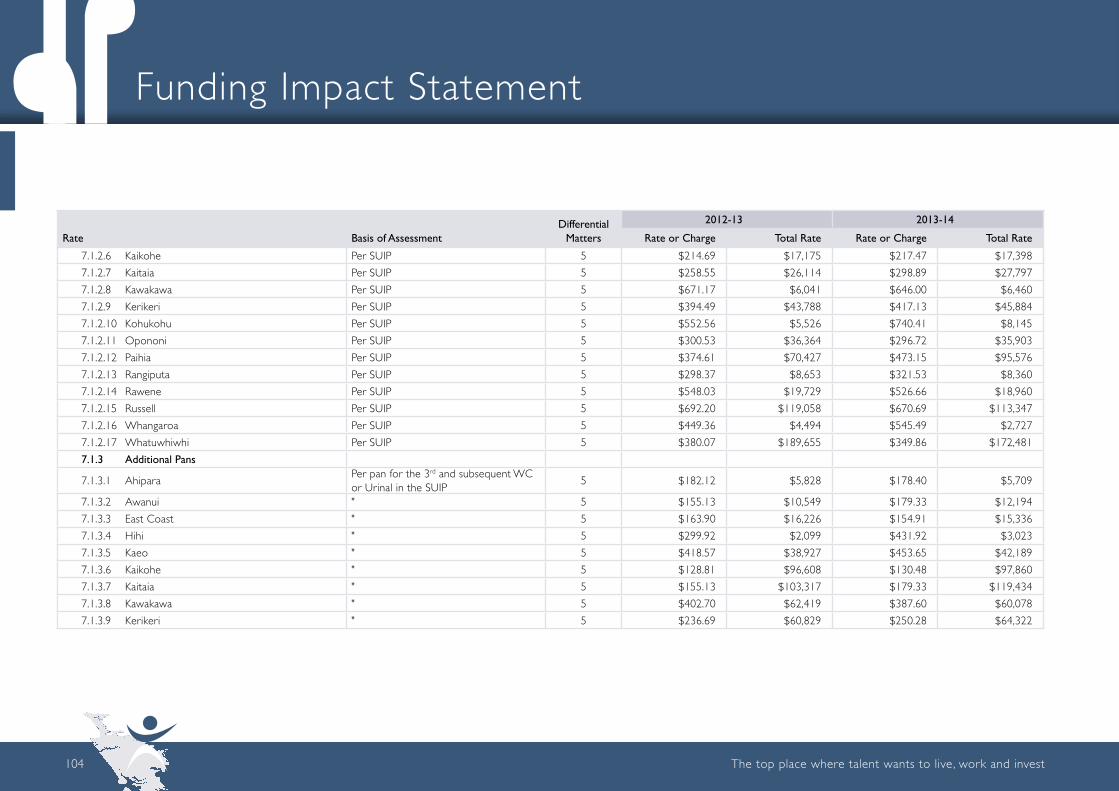
LTP LTP Annual Plan 2012-13 2013-14 2013-14 $’000s Project Name $’000s $’000s
Sources of Operational Funding 762 General rates, uniform annual general charges, 776 776 rates penalties 9,925 Targeted rates (other than a targeted rate for water supply) 10,896 10,626 - Subsidies and grants for operating purposes - - 231 Fees, charges, and targeted rates for water supply 334 282 4 Internal charges and overheads recovered 4 4 - Local authority fuel tax, fines, infringement fees, - - and other receipts
10,923 Total operating funding (A) 12,010 11,688
Applications of operating funding 4,234 Payments to staff and suppliers 4,454 4,691 1,711 Finance costs 2,101 1,681 981 Internal charges and overheads applied 1,006 939 Other operating funding applications
6,926 Total applications of operating funds (B) 7,561 7,311
3,996 Surplus(deficit)ofoperatingfunding(A-B) 4,448 4,376
Sources of capital funding 5,757 Subsidies and grants for capital expenditure 4,301 1,495 - Development and financial contributions - - 7,028 Increase (decrease) in debt 7,711 4,907 - Gross proceeds from sale of assets - - Lump sum contributions
12,785 Total sources of capital funding (C) 12,012 6,402
LTP LTP Annual Plan 2012-13 2013-14 2013-14 $’000s Project Name $’000s $’000s
Applications of capital funding Capital Expenditure - - to meet additional demand - - 15,750 - to improve the level of service 15,758 10,904 2,021 - to replace existing assets 258 1,215 (990) Increase (decrease) in reserves 444 (1,341) - Increase (decrease) in investments - -
16,782 Total applications of capital funding (D) 16,460 10,778
(3,996) Surplus(deficit)ofcapitalfunding(C-D) (4,448) (4,376)
- Funding balance ((A - B) + (C - D)) - -
FUNdiNg iMPACt stAteMeNt FoR 2013-14 ANNUAL PLAN seWeRAge

119Annual Plan 2013-14The top place where talent wants to live, work and invest118
Funding Impact Statement
LTP LTP Annual Plan 2012-13 2013-14 2013-14 $’000s Project Name $’000s $’000s
Sources of Operational Funding 4,216 General rates, uniform annual general charges, 4,273 4,150 rates penalties - Targeted rates (other than a targeted rate for water supply) - - - Subsidies and grants for operating purposes - - 916 Fees, charges, and targeted rates for water supply 946 921 - Internal charges and overheads recovered - - 166 Local authority fuel tax, fines, infringement fees, 166 166 and other receipts
5,297 Total operating funding (A) 5,385 5,236
Applications of operating funding 3,829 Payments to staff and suppliers 3,901 3,850 394 Finance costs 380 339 491 Internal charges and overheads applied 503 459 Other operating funding applications
4,714 Total applications of operating funds (B) 4,783 4,648
583 Surplus(deficit)ofoperatingfunding(A-B) 602 588
Sources of capital funding - Subsidies and grants for capital expenditure - - - Development and financial contributions - - (227) Increase (decrease) in debt (367) (361) - Gross proceeds from sale of assets - - Lump sum contributions
(227) Total sources of capital funding (C) (367) (361)
LTP LTP Annual Plan 2012-13 2013-14 2013-14 $’000s Project Name $’000s $’000s
Applications of capital funding Capital Expenditure - - to meet additional demand - - 215 - to improve the level of service 36 36 217 - to replace existing assets 245 177 (76) Increase (decrease) in reserves (46) 14 - Increase (decrease) in investments - -
356 Total applications of capital funding (D) 235 228
583) Surplus(deficit)ofcapitalfunding(C-D) (602) (588)
- Funding balance ((A - B) + (C - D)) - -
FUNdiNg iMPACt stAteMeNt FoR 2013-14 ANNUAL PLAN WAste

119Annual Plan 2013-14
LTP LTP Annual Plan 2012-13 2013-14 2013-14 $’000s Project Name $’000s $’000s
Sources of Operational Funding 9,652 General rates, uniform annual general charges, 9,937 9,654 rates penalties 8,334 Targeted rates (other than a targeted rate for water supply) 8,732 8,406 110 Subsidies and grants for operating purposes 115 115 2,108 Fees, charges, and targeted rates for water supply 2,176 2,118 13 Internal charges and overheads recovered 13 19 157 Local authority fuel tax, fines, infringement fees, 162 18 and other receipts
20,374 Total operating funding (A) 21,135 20,330
Applications of operating funding 11,593 Payments to staff and suppliers 11,869 11,620 1,200 Finance costs 1,243 1,025 4,177 Internal charges and overheads applied 4,246 3,908 - Other operating funding applications - -
16,970 Total applications of operating funds (B) 17,358 16,552
3,404 Surplus(deficit)ofoperatingfunding(A-B) 3,777 3,778
Sources of capital funding - Subsidies and grants for capital expenditure - - 113 Development and financial contributions 113 113 714 Increase (decrease) in debt 893 862 - Gross proceeds from sale of assets - - - Lump sum contributions - -
827 Total sources of capital funding (C) 1,006 975
LTP LTP Annual Plan 2012-13 2013-14 2013-14 $’000s Project Name $’000s $’000s
Applications of capital funding Capital Expenditure 170 - to meet additional demand 422 422 825 - to improve the level of service 813 873 5,954 - to replace existing assets 6,086 4,602 (2,718) Increase (decrease) in reserves (2,538) (1,145) - Increase (decrease) in investments - -
4,232 Total applications of capital funding (D) 4,783 4,752
(3,404) Surplus(deficit)ofcapitalfunding(C-D) (3,777) (3,778)
- Funding balance ((A - B) + (C - D)) - -
FUNdiNg iMPACt stAteMeNt FoR 2013-14 ANNUAL PLAN distRiCt FACiLities

121Annual Plan 2013-14The top place where talent wants to live, work and invest120
Funding Impact Statement
LTP LTP Annual Plan 2012-13 2013-14 2013-14 $’000s Project Name $’000s $’000s
Sources of Operational Funding 7,211 General rates, uniform annual general charges, 7,195 6,617 rates penalties - Targeted rates (other than a targeted rate for water supply) - - - Subsidies and grants for operating purposes - - 3,160 Fees, charges, and targeted rates for water supply 3,261 3,100 4 Internal charges and overheads recovered 4 (0) 92 Local authority fuel tax, fines, infringement fees, and other receipts 95 62
10,467 Total operating funding (A) 10,556 9,779
Applications of operating funding 7,774 Payments to staff and suppliers 7,874 7,325 177 Finance costs 176 121 2,352 Internal charges and overheads applied 2,347 2,188 Other operating funding applications
10,303 Total applications of operating funds (B) 10,397 9,634
164 Surplus(deficit)ofoperatingfunding(A-B) 159 145
Sources of capital funding - Subsidies and grants for capital expenditure - - - Development and financial contributions - - (23) Increase (decrease) in debt (23) (26) - Gross proceeds from sale of assets - - Lump sum contributions
(23) Total sources of capital funding (C) (23) (26)
LTP LTP Annual Plan 2012-13 2013-14 2013-14 $’000s Project Name $’000s $’000s
Applications of capital funding Capital Expenditure - - to meet additional demand - - 10 - to improve the level of service - - - - to replace existing assets - - 131 Increase (decrease) in reserves 136 119 - Increase (decrease) in investments - -
141 Total applications of capital funding (D) 136 119
(164) Surplus(deficit)ofcapitalfunding(C-D) (159) (145)
- Funding balance ((A - B) + (C - D)) - -
FUNdiNg iMPACt stAteMeNt FoR 2013-14 ANNUAL PLAN eNviRoNMeNtAL MANAgeMeNt
121Annual Plan 2013-14
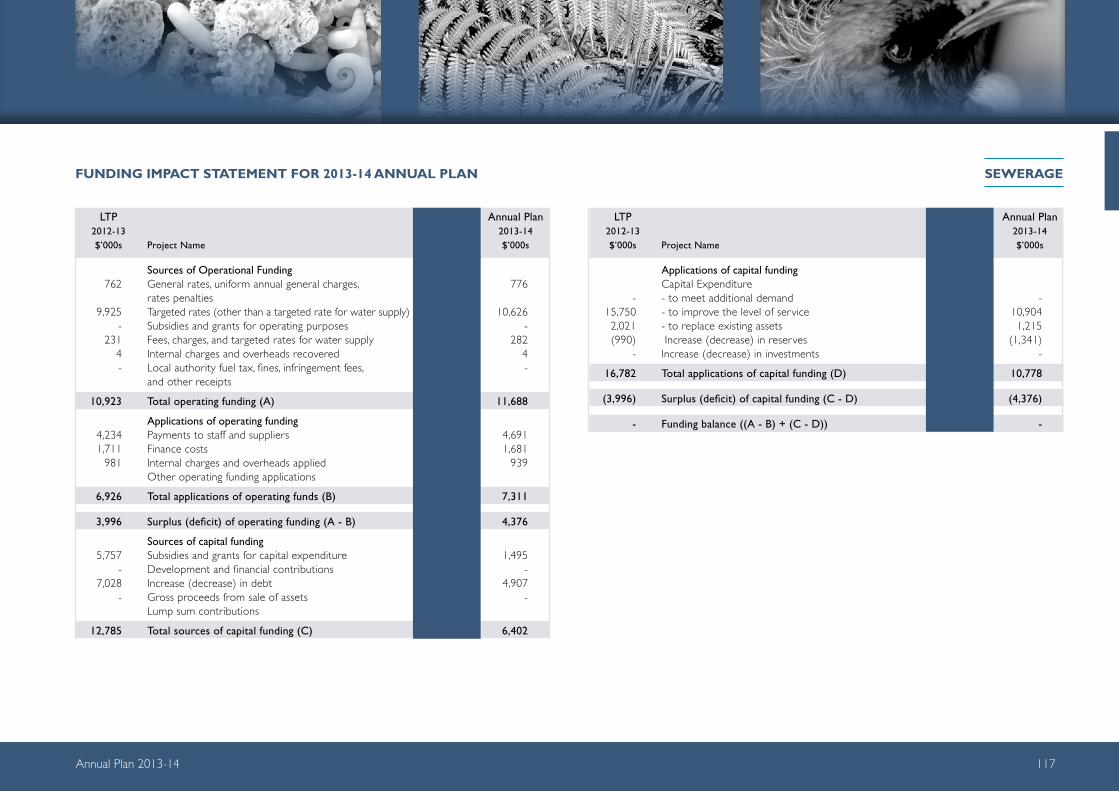
LTP LTP Annual Plan 2012-13 2013-14 2013-14 $’000s Project Name $’000s $’000s
Sources of Operational Funding 10,087 General rates, uniform annual general charges, 10,309 11,159 rates penalties - Targeted rates (other than a targeted rate for water supply) - - 32 Subsidies and grants for operating purposes 25 25 528 Fees, charges, and targeted rates for water supply 544 572 13 Internal charges and overheads recovered 102 102 280 Local authority fuel tax, fines, infringement fees, 289 295 and other receipts
10,940 Total operating funding (A) 11,269 12,152
Applications of operating funding 15,822 Payments to staff and suppliers 16,187 16,452 1,435 Finance costs 1,438 1,331 (10,072) Internal charges and overheads applied (10,222) (9,503) - Other operating funding applications - -
7,185 Total applications of operating funds (B) 7,404 8,279
3,755 Surplus(deficit)ofoperatingfunding(A-B) 3,866 3,873
Sources of capital funding - Subsidies and grants for capital expenditure - - 371 Development and financial contributions 379 374 54 Increase (decrease) in debt (35) (191) - Gross proceeds from sale of assets - - - Lump sum contributions - -
425 Total sources of capital funding (C) 345 184
LTP LTP Annual Plan 2012-13 2013-14 2013-14 $’000s Project Name $’000s $’000s
Applications of capital funding Capital Expenditure - - to meet additional demand - - 585 - to improve the level of service 439 258 1,285 - to replace existing assets 258 827 2,310 Increase (decrease) in reserves 3,514 2,972 - Increase (decrease) in investments - -
4,180 Total applications of capital funding (D) 4,210 4,057
(3,755) Surplus(deficit)ofcapitalfunding(C-D) (3,866) (3,873)
- Funding balance ((A - B) + (C - D)) - -
FUNdiNg iMPACt stAteMeNt FoR 2013-14 ANNUAL PLAN goveRNANCe ANd stRAtegY

123Annual Plan 2013-14The top place where talent wants to live, work and invest122
Funding Impact Statement
Kaitaia BID Rating Area - Area to be rated shown in red.

123Annual Plan 2013-14
Tanekaha Lane Rating AreaThe rating area for the Tanekaha Late rating area is shown on the following map. The rating area is highlighted in mauve.