Embed Size (px)
Citation preview

International Federation of Clinical Chemistry (IFCC)
Fundamentals for External Quality Assessment (EQA)
Guidelines for Improving Analytical Quality by Establishing and Managing EQAschemes. Examples from basic chemistry using limited resources.
Prepared by the Committee on Analytical Quality (CAQ) of the Education and Management Divisionof IFCC:Peter Hill (1) (UK), Adam Uldall (2) (DK), Peter Wilding (3) (US)
TABLE OF CONTENTS
1. Introduction .......................................................................................................................... 22. Scheme ................................................................................................................................. 3
2.1. Organizer........................................................................................................................ 32.2. Scope.............................................................................................................................. 32.3. Logistics.......................................................................................................................... 42.4. Designing an EQA scheme............................................................................................. 7
3. Materials................................................................................................................................. 83.1. Background for selection and preparation of sera for EQA scheme............................... 83.2. Acquisition of materials from industry............................................................................. 93.3. Establishing acceptable limits and target values............................................................. 10
4. Evaluation .............................................................................................................................. 11
5. Education............................................................................................................................... 125.1. Introduction..................................................................................................................... 125.2. Desirable performance standards................................................................................... 135.3. Statistical procedures...................................................................................................... 145.4. Trouble shooting............................................................................................................. 145.5. Help and advice.............................................................................................................. 14
Acknowledgements .................................................................................................................. 15
References................................................................................................................................. 15
AppendixA Handling of EQA samples in the participating laboratory and
submission of results...................................................................................................... 16B Statistical methods for assessing data........................................................................... 18C Methods for reporting to the participants........................................................................ 22D Useful addresses............................................................................................................ 27E Preparation of lyophilized bovine serum......................................................................... 28F Preparation of stabilized liquid control serum to be used in clinical chemistry............... 31
(1) Dept. of Chemical Pathology, Derbyshire Royal Infirmary, Derby, DE1 2QY, United Kingdom.(2) Dept. of Clinical Chemisty, Herlev University Hospital, DK-2730 Herlev, Denmark.(3) Dept. of Pathology and Laboratory Medicine, Hospital of the University of Pennsylvania, 7103Founders Pavillion, 3400 Spruce Street, Philadelphia, PA 19104-4283, USA.

1. INTRODUCTION
This document is written to assist colleagues in establishing and managing external quality assessment
(EQA) schemes at an early stage. The document deals with frequently performed clinical chemistry
analyses. However, many of the aspects described also apply to EQA in other branches of laboratory
medicine. Special attention has been paid to the resources needed so that the document can be used in
developing countries. We have also included basic educational material to enable scheme organizers to
help participants interpret their results, and to assist participants to use EQA data to support and
supplement internal quality control (IQC). The appendices of this document are arranged so that the
early appendices are of interest for many of our colleagues while the later appendices are mainly of
interest for colleagues specialising in EQA work.
Although the major topic of this document is EQA, we believe it is essential to encourage an
integrated view of quality in clinical laboratories, so that any aspect of quality is seen as a part of total
quality management. Thus IQC and EQA will be seen as components of an overall quality policy which
includes other quality issues such as turnround times, gross errors, the training of laboratory staff, staff
safety, and the appropriate use of the laboratory by clinicians including the interpretation of data.
The value of EQA in highlighting areas of analytical inadequacy and for stimulating
improvements in between-laboratory variation has been demonstrated in many countries. EQA surveys
in countries without EQA programmes or effective IQC have shown that up to 50 % of laboratory results
for basic clinical chemistry tests are so far from the target value as to be of no clinical use. The cost of
setting up an EQA programme must be viewed against the resources wasted in producing inaccurate
data and the improvement in patient care which can be achieved by improving the quality of laboratory
results. EQA must not be seen as either an alternative or a competitor to IQC: both are essential tools
for a clinical laboratory. IQC is used in the decision to accept or reject results on patients’ samples and
enables the laboratory to describe and monitor the quality of its work; EQA permits a comparison of
quality between laboratories and thus describes the “state of the art” for that area of laboratory work
encompassed by the EQA programme. Rightly used and understood, EQA programmes will stimulate
the development of quality assurance including IQC within participating laboratories.
Many EQA programmes are organized by the national professional scientific society or by
professionals on behalf of government, although others are run by commercial companies. Whichever
way it is organized several policy decisions need to be agreed professionally prior to the commencement
of the programme. For example, the level of anonymity of the data must be agreed. With the use of
computers it is possible to secure a very high level of confidentiality; however, this may entail an
inappropriate level of investment for some countries and agreement may be reached so that the scheme
organisers will have access to the performance of individual laboratories but maintain the confidentiality
of the results.
.
EQA programmes require running costs, for example, for provision of the material, mailing
expenses and clerical and professional time for administering the scheme. There needs to be agreement
within the country or area about the finance; will it be funded by participants, by government, or in some
other way.
Other issues also need agreement such as the frequency of specimen distribution and the
extent to which there will be interaction between the organisers and participants to ensure an
understanding of the scheme’s objectives and reports.
2
We believe that EQA schemes have great value for the assessment of quality, and rightly
constructed can provide data which can form a part of a national or regional laboratory certification,
accreditation, or licensing procedure. However, the limitations of EQA must also be identified and
understood. It should be stressed that there are many other potential sources of laboratory error apart
from those which may be detected or controlled through an EQA scheme. It is vital that these are
identified and that effective quality assurance procedures are in place to ensure that scarce laboratory
resources of materials and personnel are used to the best advantage for the care of patients.
For EQA schemes to be successful in providing independent, objective data and to act as an
educational stimulus to improvement, partipants must have confidence in the scientific validity of the
scheme design as well as the reliability of its operations. The scientific validity will include stable,
homogeneous specimens which behave like clinical specimens (proper commutability), and valid target
values; reliability involves keeping to a strict time schedule with
information after analysis, structured and intelligible reports, and a
rapid feedback of initial performance
cumulative data system.
2. SCHEME
2.1 Organizer
The selection or approval of an organizer and support facilities for an EQA scheme is an important
process that will, inevitably, affect the quality, scope and subsequent success of the scheme. Ideally,
this individual will have an established reputation in the field that the survey activities will cover.
However, it is more important that the individual is committed to energetic long term involvement in the
scheme, and demonstrates the qualities of vision and diplomacy that will be so important
difficult periods that an emerging or developing scheme will experience.
the
If the EQA scheme is to be supported by government or institutional funds, it is imperative that
the organizer has the “official” support of that agency. At the same time it is important that sponsoring
agencies do not “over-influence” or inhibit the development of a scheme, or create an environment
where potential participants are hesitant to be involved because of real, or apparent, disciplinary
consequences.
It is also important that an organizer has the support of, and has his/her activities monitored
by, an Advisory or Organizing Committee. With appropriate selection, the committee will serve to
eliminate the perception that arbitrary criteria are used to assess performance, and will aid greatly in the
important task of communication.
2.2 Scope
Determining the scope of an EQA scheme is crucial during the period when it is being established.
Inevitably, the success of a scheme will provide opportunity to widen the scope, but it is important to
note that most of the large schemes that operate successfully today in Western Europe and the United
States started in a very simple form. Therefore it is essential to draw up realistic, and practical, limits to
the field of analyte assessment (e.g. routine chemistry tests, haematology, toxicology or endocrinology).
If no experience exists in the country concerned, or if the organizer, or committee have limited
experience, it is far more practical to resolve the difficulties in mailing, packaging, report form
3.

design, result recording and the production of helpful reports without the added complication of
preparing complex materials for distribution.
The scope of the scheme also includes the number of potential participants, and their
geographical location. In the early stages of a scheme it is important to achieve success, for example
within the capital city, in conquering the logistic hurdles of specimen acquisition, specimen distribution
and fast turn around of meaningful results. However, circulation in more rural areas with less easy
communication should also be attempted to gain experience. Growth of the scheme to increase the
number of participating laboratories or the number and scope of analytes can come later..
At the commencement of the scheme, a well formulated plan addressing the frequency of
distribution must be determined by the organizer. The frequency of specimen distribution will affect the
cost of the scheme, the enthusiasm of the participants and the administrative workload of the organizer’s
office. Several alternatives exist, and choices should be made that optimize the distribution frequency
and turn- around time, see Table 1. Those intending to start a National External Quality Assessment
Scheme (NEQAS) are recommended to inform the Unit of Health Laboratory Technology, World Health
Organization, Geneva, Switzerland, see D5 in Appendix D.
Table 1. EQA scheme, examples of distribution frequencies and turn around times
Distribution frequency Turn Benefits Problemsof specimens a r o u n d
1. Assayed immediately
Quarterly* < 14 days Low administrative load Less benefit to laboratoryEasier specimenacquisition
> 30 days Turn around time is too long
Monthly < 14 days Frequent information Increased cost> 30 days Turn around time is too long
Every 2 weeks < 14 days Very frequent High costinformation Administration
Specimen acquisition
2. Delayed assays
Annually, but As soon as Low distribution and Specimen storagerequiring weekly possible packaging cost Specimen acquisitionor monthlyassays
* minimum frequency recommended
2.3 Logistics
The most successful schemes are those in which participants can expect regular dispatch of speci-
mens and fast turn around of results. Accordingly, operation of the organizer’s office must be efficient to
prepare, or acquire specimens, arrange their packaging and distribution and deal expeditiously with the
documentation that is the basis of an EQA scheme.
4

2.3.1 Planning
Table 2 provides a list of questions that need to be considered before implementing an EQA scheme.
’ The questions are designed to ensure that the creators of new schemes explore the full consequences of
their choices and anticipate as many problems as possible.
Table 2. Check list for use before starting a EQA scheme.
XXXYYY External Quality Assessment Scheme
What field? (e.g. Chemistry/Toxicology/Endocrinology)
How many laboratories?
What geographical area?
Is anonymity assured
Who holds the key to the code?
Check
Yes N o
Yes No
What analytes, initially?
What type of specimen? (serum/other; liquid/lyophilized)
With what frequency will specimens be distributed?
What “turn around time” is required?
Who will design the forms?
Does the Organizer have access to computer and software to facilitaterecord keeping?
Where will the specimens come from?Will Organizer manufacture?Can they be donated by Industry?Will they be purchased?Is there a need for Import License?
What containers will be used for specimen distribution?
What are Postal Regulations relating to shipping of biological specimens?
Will forms be pre-paid for return of results?
How will results be recorded and results calculated?
What criteria will be used to determine “range of acceptable results”?
What will be the format of the report sent to participants?
Is participation in the scheme mandatory according to regulation?
What is the budget for the EQA Scheme?
List
/Year
Days
Yes N o
Yes N oYes N oYes N oYes N o
Check
Yes N o
Yes N o
Do sponsors specify conditions? For what period is the scheme guaranteed support?
Are participants required to pay?
How much?
Yes
Yes
N o
Years
N o
5

2.3.2 Specimens
It is recommended that early distributions of specimens employ commercial quality control products if
these can be acquired, see section 3.2. There are several methods of preparing serum/plasma for
distribution. Attention is drawn to the method described in Appendix F for the low cost production of
ethanediol stabilized serum, particularly for organizers with limited budgets or those subject to import
restrictions. Such materials are also suitable for IQC of many procedures. This topic is addressed more
fully in Section 3, which also gives advice on the acquisition of commercial quality control products from
industry.
2.3.3 Instructions
The provision of well written information and instructions is fundamental to the efficient operation of an
EQA scheme and adequate advanced information should be given to all potential participants, possibly
through a workshop before the scheme starts. Experience has shown that participants will frequently
carry out incorrect assays, or fail to meet time limitations unless good communication is achieved. The
information provided to potential participants must describe in full the aims and objectives of the
scheme, and ensure that all understand the following:
- the scope of the scheme (i.e. number and geographical distribution of participants);
- the need for regular participation;
- the method of result assessment;
- procedures and criteria to be used for peer comparison;
- sources of advice for laboratories experiencing problems with assays.
The instructions given to participants regarding the assays should ideally accompany each
specimen that is distributed to ensure that conditions on storage, handling, timing, and assay are all met.
An example of sample handling is presented in Appendix A.
Liaison with participants is important for a successful scheme and should be promoted through
regular (e.g. annual) reports and requests for feedback, and, if possible an annual meeting on quality
assurance bringing together the organizers and participants. Participants should view the scheme as
theirs, rather than one imposed by a distant bureaucracy.
2.3.4 Distribution
The frequency of distribution will be dictated largely by economics; however, the following need to be
considered when assessing the distribution operation:
- postal regulations governing-shipment of biological materials as well as mass and outer
1 . dimension of the package;
- type, number and volume of specimens to be distributed;
- package that can accomodate all specimens and forms needed
- package that facilitates opening and closing without destruction of container or forms;
-- clearly labelled specimens;
- package addressing.
Special attention should be paid to the mailing container, the inner container should be secure;
furthermore the outer container should contain sufficient porous material to accommodate all the liquid
material in case of any damage of the inner container; re-use may reduce costs.
2.3.5 Forms
Forms for the collection/recording of data that accompany the specimen should be as simple as possible
to reduce confusion in entering and reading data and facilitate its entry into the data bank of the EQA
scheme. Laboratories should be identified only by code (e.g. by number), and space should be provided
to record date of receipt and specimen analysis. If it is anticipated that the scheme will increase the
number of analytes being tested per distribution or the number of participants, the forms should be
designed accordingly. The constant use of a single format will reduce errors and greatly ease data
recording.
The outline of a record ing form is given in Appendix A.
2.3.6 Data analysis and reporting
These aspects of the scheme and reporting procedure are addressed in Section 4 and Appendices B and
C .
2.4 Designing an EQA scheme
EQA schemes may have different designs
Type 1.
in order to serve different purposes, for example:
EQA designed to document current analytical performance to a third party, e.g. authorities,
accreditation bodies, or the public (not the primary target of these guidelines).
This type of scheme ideally requires the expected value to be completely unknown to the
participants. This may be achieved by using a selection of codes to identify a given sample
and by having different samples running simultaneously within the same scheme. Only small
amounts- of serum should be available in each vial, so that multiple determinations cannot be
carried out. The sample should resemble fresh human serum and should ideally be labelled in
the same way as patient samples.
Type 2. Those designed to inform individual laboratories about their current analytical performance.
The requirement for doing the check in a “blind” manner is basically the same as in type 1.
However, because there are no external consequences (“punishment”) for bad results, it is
unlikely that the laboratory would analyse the sample differently from routine work. Therefore
the identity of the sample need not be hidden. Education of participants so that they
understand the importance-of doing the analyses on these samples in the same way. as usual
patients samples will further decrease the need for hiding the identity of the sample.
Type 3. Those designed to support quality improvement by evaluating different sources of error, e.g. at
different concentration levels, random error, systematic error, and certain types of
nonspecificity.
This type of EQA scheme is intended for supporting the laboratory by revealing the causes of
errors. The evaluation requires a variety of control samples. Several measurements obtained
on the same sample in different runs are essential in order to obtain statistically sound
7
If only one sample is circulated in schemes
information. For suitable data presentation consult Appendix C. In this type of EQA scheme
“blind” controls are probably unnecessary.
erroneous result is caused by imprecision
of
or
type 1 or 2, the user
bias. Two samples
cannot know whether an
at different concentration levels may
provide more useful data. Type 2 schemes provide more informative data especially if the same
specimens are measured on several occasions and cumulative reports are prepared. The last type of
scheme is most helpful to the individual laboratory and provides information which is easy to
understand. However, it requires several materials and measurements, and it is probably difficult to
operate consistently in a developing country. In many cases schemes are used for a combination of
these purposes.
3. MATERIALS
3.1 Background for selection and preparation of sera for EQA schemes
Control serum should resemble fresh human serum as closely as possible in order to avoid interference
from the matrix or other components. Although in principle the use of human serum has advantages, its
use is only recommended when animal serum is inappropriate, for example, methods involving the use
of antibodies against human protein or when major matrix effects are evident. Ethical consideration may
prevent use of human donors for supplying material for analytical control if blood is required for clinical
purposes and because of the risk of human serum incorporating agents that cause infection (for
example, hepatitis, AIDS, etc.) The organiser needs to balance the cost, availability and risk in the
choice of serum for EQA.
All control sera (human or animal origin) must be stable. Stability may be achieved by
sterilisation (filtration), by the addition of chemicals or by lyophilisation.
In preparing EQA serum samples a range of concentrations are needed, see Table 3.
A recommended low cost procedure involves stabilising serum with ethanediol (Appendix F).
Lyophilisation produces a dry material that is stable for several years when stored correctly, it is however
expensive to produce and requires reconstitution with an exact volume of water. Lyophilised bovine
serum (see Appendix E) has been widely used in low cost quality control schemes because of its
availability and robust lipoproteins. There are some matrix interferences but for those components
shown in Table 3, there are few problems with bovine serum stabilised either with ethanediol or by
lyophilisation, although total protein and albumin show small matrix interferences. Electrode assemblies
in direct ISE instruments may be damaged by ethanediol.
8

Table 3. Examples of desirable concentrations of analytes in sera for EQA scheme.
Analyte in blood or Recommended range* of Typical reference rangeplasma concentration of components in in blood or plasma
the control sera
Alanineaminotransferase
Alkalinephosphatase
Amylase
Aspartateaminotransferase
Total bilirubin
Calcium
Creatinine
Urea
Glucose
Potassium
Total protein
Albumin
Sodium
20-125 U/L
40-250 U/L
200-700 U/L
20-125 U/L
20-200 umol/L
2.00-2.90 mmol/L
80-500 umol/L
3-20 mmol/L
2.5-25 mmol/L
3.0-6.0 mmol/L
40-90 g/L
20-55 g/L
120-160 mmol/L
< 42 U/L
20-90 U/L
70-340 U/L
< 42 U/L
2-21 umol/L
2.25-2.60 mmol/L
60-130 umol/L (male)40-110 umol/L (female)
3.3-7.7 mmol/L
non-fasting 3.5-7.4 mmol/Lfasting 3.6-6.4 mmol/L
3.5-5.2 mmol/L
60-80 g/L
30-45 g/L
135-l 46 mmol/L
*The recommended concentration range of the analyte in the control sera is appropriate tomethods with the reference range shown
3.2 Acquisition of materials from industry
Possible sources of materials or specimens for distribution to scheme participants are the commercial
suppliers of quality control products to laboratories. However, it is important to establish that the
approach is not meant to undermine the sales activities of the companies concerned. Requests should
be realistic and when possible, products from several different companies should be sought.
As the prime aim of most EQA schemes is to determine between-laboratory variation the key
criterion that must be met is between-specimen variation. For most analytes this can still be met with
material that is approaching, or has passed, the expiry date placed on the product by the manufacturers,
or by government regulations. If there is doubt about the homogeneity, the between-specimen variation
should be investigated for any analyte before the circulation of samples. Careful observation of the
distribution of between-laboratory results for a particular batch of control sera in relation to earlier
experience may confirm the homogeneity or give clues to deterioration.
When appropriate requests are made to companies for the provision of such materials,
accompanied by a clear statement of the intended use, then it is possible that products may be donated,
or provided at significantly lower cost. In such cases, it is appropriate to provide the sponsor with detaiis
of the results obtained in the surveys using their material, as this may aid them with information
regarding stability.,
9
Requests for aid of this type should be made to directors of marketing and/or sales groups in
companies operating (or contemplating operation) in the regions concerned. Advice on making
approaches to industry can also be obtained from the IFCC Committee on Analytical Quality, see
section 5.5. and D2 in Appendix D.
3.3 Establishing acceptable limits and target values
In an EQA scheme, results submitted by individual participants are assessed and compared
either against a target value assigned by the organizing or reference laboratory or more often assessed
against the consensus value (“trimmed mean value”) derived from all results submitted by participants in
the scheme for that analyte.
The value (or range of results) against which comparisons are made must be as reliable as
possible or participants will lose confidence in the scheme.
Practical experience has shown that the consensus value usually agrees closely with the “true
value” in schemes with a large number of participants but it may not be valid in schemes involving small
numbers of laboratories. It is not a valid approach where a large proportion of participants have a
significant analytical bias.
The consensus value (“trimmed mean”) is the mean of all results after removal of outliers that
will distort the distribution and hence ‘affect the mean. A choice must be made between the overall
consensus value and the method related consensus value. In most cases it is preferable to use the
method related consensus value (essential for enzyme activity assays), although for some analytes and
methods there should be no significant difference between them (e.g. glucose oxidase and o-toluidine
methods for plasma glucose). However the extent of the agreement between method related and overall
consensus values depends on the methods in use and the type of control material.
A general approach to calculating method related consensus values is as follows:
Organise the data by analyte and by methods; preferably groups of more than 20 results,
and avoid forming groups of less than 10 results;
For small schemes, scrutinise the data and exclude any results that are obviously wrong;
Calculate the mean and standard deviation (SD) for each group;
Reject any result outside the range +/- 3SD; (use +/- 2SD if n = less than 20)
Recalculate the mean and SD for the remaining values;
Repeat steps 4 and 5 until all values fall within the range determined in step 4.
The mean of this last group (ie with no outliers) is the method related consensus value.
Acceptability criteria .
Many EQA schemes use the “state of the art” approach for describing “acceptable limits”.
Having calculated the method related consensus value, the acceptable limits may then be set to the
range encompassed by +/- 2 CV% (mean +/- 2SD). It may be apparent that because of poor performance,
the SD exceeds recommended or attainable levels (Table 4). In such cases, and by agreement with
professional colleagues, the acceptable limits may have to be narrower than mean +/- 2SD; however,
local analytical capability must by considered so that unachievable limits are avoided See also section
5.2, Table 4, and D2 in Appendix D.
.10

Limitations of the consensus approach
The procedure described will identify and exclude outliers but it will not separate two different
populations of data (e.g. from two methods with different means). To identify such problems the data
must be displayed as a histogram looking for deviation from a normal distribution, e.g. bimodal
distribution which may be the case for data derived from two different methods.
Validating the consensus value
The consensus value may be validated by analysing the distributed control material by reference
methods although this should only be attempted in laboratories with adequate training and experience of
such methods. Some reference laboratories in Western Europe or North America may be willing to
provide assistance.
The routine methods used by participants in the scheme may also be used but the laboratories
assigning the values must be confident of their bias and precision. Recovery studies can be helpful here.
An alternative approach is to compare the consensus values obtained for the same control material from
different schemes in for example different countries or regions. It may be possible to obtain limited
quantities of materials which have been distributed in EQA schemes in Western Europe or North
America to assist in scheme validation.
4. EVALUATION
There are numerous styles and formats used for presenting results of EQA schemes. Many of the well
established schemes of Western Europe and North America are relatively complex and reports are
produced by computer from large data banks. Common to all, however, is a requirement that
participants must easily confirm their submitted values and that interpretation of their performance is
clear and concise.
Developing schemes are recommended not to attempt incorporation of algorithms that assess
overall, or long term performance, unless clear instructions are provided that facilitate understanding by
all participants. It is far more important to provide rapid information that clearly illustrates, for each
analyte being studied, the deviation of the laboratory’s results from the overall consensus mean and
I from the appropriate method (or instrument) consensus mean. As an alternative to the usual units, the
deviation from overall or method mean can be expressed as number of standard deviations or as the
percentage of laboratories achieving results within the acceptable interval.
Report(s) produced must communicate the following:
- confirmation of submitted value(s);
- comparison of result(s) with all participants (often depicted by use of histograms);
- comparison of result(s) with relevant method/instrument mean (often depicted by use of
histograms);
- clearly illustrate the performance limits established for the scheme;
- recommend that laboratories demonstrating unacceptable performance take corrective
action, or seek advice;
- provide information on long term performance, or trends, for each analyte when appropriate.
Note: This information can be provided in a separate report or periodically.
Some example reports are provided in Appendix C.
11

5. EDUCATION
5.1 Introduction
EQA schemes generate a large amount of data which can be used by scheme organisers to assist in the
education of participants and potential participants. Perhaps the most important aspect is that frequently
EQA data can be used to convince colleagues about the need to introduce or improve quality assurance
including IQC. EQA alone is unlikely to yield improvements in the absence of effective quality assurance
and IQC.
In designing the EQA scheme and the associated documentation, consideration must be given
to the degree of interaction between organizers and participant. Will the organizer, for example,
- report back statistical data only?
- assist in the interpretation of data?
- advise on changes of calibrators or methods when consistent bias is detected?
An interactive programme is likely to be more effective in improving quality, particularly where there is
not a high level of training for laboratory staff. EQA organisers must accept an educational role and this
section of the document and the material in the Appendices are designed to assist them in that function.
Some basic educational information can be included with participants’ reports - for example,
how to compare an individual result with the target value and the “acceptable interval”, etc. It may be
possible to design some distributions to provide particular educational information; for example, the
quality of calibrators has been a problem in many countries and the distribution of a stable calibrator (as
a sample) and’ an EQA sample together permits an assessment of the reliability of the participants’
calibrator for the analyte of interest. Another example is the circulation of photometer controls such as
solutions of a dye or a chemical.
A further educational benefit of EQA data is that analytical methods with poor performance can
be identified and participants encouraged to use recommended methods, however, the possible
contribution of matrix effect to poor performance should not be overlooked.
Workshops can be of great benefit in assisting individuals from participating laboratories, and
should include the following:
- the importance of quality assessment;
- methods of quality assessment;
- preparation of calibrators;
- definitions and basic statistics in quality control;
- interpreting IQC and EQA results and resolving problems;
- preparation of QC materials;
- pre- and post-analytical factors that affect the quality of patients’ results.
In some countries, the use of video film may be possible, but whatever educational method is
used, there must be time for audience participation. Furthermore the course must be appropriate to the
audience, to the culture, and to the existing analytical capability. It is’ important that institutions and
individuals recognize the significance of quality assurance in all aspects of laboratory operation. At the
same time it should be emphasized that successful application of quality assurance procedures can be
achieved at low cost.
12

5.2 Desirable performance standards
This document is based on, and recommends, performance standards based on analytical variation.
Other systems, based on biological variation or clinical strategies are not recommended during the early
stages of an EQA scheme.
Table 4 provides an elementary guide and examples of the performance standards that are
observed in EQA schemes in developed and developing countries. It is recommended that the values
achieved by established EQA schemes in the developed countries (column 1) be employed as an index
of proficiency; note, lower values may be achieved.
Table 4. Examples of performance standards*
Analyte in blood or Performance (CV%) in Performance (CV%) in DEVELOPING Countries
plasma Developed Countries
Early stage of EQA Established EQA**schemes schemes (> 10 years)
Alanine 9 25-75 10aminotransferase
Alkaline 7 25-75 10phosphatase
A m y l a s e 4 25-75 -
Aspartate 6 25-75 10aminotransferase
Creatinine 5 I 12-20 10
Urea 5 15-23 8
Glucose 4 8-18 7
Total bilirubin 8 15 12
Calcium 3 8-15 6
Potassium 3 6-8 5
Sodium 1.5 4 2
Total protein 3 4-10 5
Albumin 5 6-10 6
* Values are dependent on concentration and matrix of control sample, selection of methods includedin the calculation, and procedures for eliminating outliers which differ from scheme to scheme.
**** Data provided by EQA scheme of the Association of Clinical Biochemists of India.
13

5.3 Statistical procedures
Some EQA schemes have never proceeded beyond the planning stage because of the belief that a
computer is required to cope with the statistical evaluation of the data. The basic statistics however, are
not difficult and even quite large schemes can be managed using a scientific calculator. Similarly, IQC
data can be assessed and analysed using a hand held scientific calculator.
The statistical component of an educational programme, should reflect what participants need
to know in order to:
- interpret EQA data;
- understand, implement and interpret IQC.
Bias and imprecision must be defined and the statistical methods for assessing them
explained. The concept of a “Gaussian” (“normal”) distribution and the calculation of mean, standard
deviation and coefficient of variation should be described using examples from the participants’ daily life
experience when appropriate, before moving on to examples from laboratory measurements. The use of
calculated indices to assess variation in EQA schemes should be explained.
In describing the assessment of control data it is essential to start from the perspective of
“What is acceptable performance?” Too many laboratory workers have wrongly understood that the
mean +/- 2SD always represents acceptable performance, regardless of the extent of the variation.
Examples of the definitions and statistical calculations are given in Appendix B.
5.4 Trouble Shooting
Any educational material or training programmes must include practical information on trouble shooting
and on the interpretation of EQA (and IQC) data, to enable participants to distinguish poor perform
due to imprecision and other factors from that due to bias. A plot showing the results (y) against target
values (x) will often be helpful in illustrating problems.
5.5 Help and advice
Help and advice to scheme organizers may be obtained through a request to the current chairman of the
Committee on Analytical Quality under IFCC’s Education and Management Division or to the organizers
of the appropriate WHO International EQA scheme, who may also be able to advise on training etc. to
assist with establishing the scheme; see D2, D3, and D4 in Appendix D.
14
ACKNOWLEDGEMENTS
Colleagues throughout the world who commented on or aided in the translation of the draft version of the
manuscript are thanked for their extremely valuable input, especially Dr. A. Baadenhuijsen (The
Netherlands), Dr. D. Bullock (United Kingdom), Dr. M-M Galteau (France), Prof. Zou Guangmei (China),
Dr. Daniel Mazziotta (Argentina), Dr. MM El Nageh (WHO EMRO), Dr. F. Sardi Satyawirawan & Dr.
Erwin Silman (Indonesia). Thanks are due to WHO for permission to reprint the document presented in
Appendix F. The authors are indebted to secretary Marianne Jensen for excellent assistance.
NOTE: This document utilizes conventional definitions, nomenclature, and style. The readers, however,
are encouraged to study recommendations issued from ISO, IFCC and IUPAC where definitions and
nomenclature of a more systematic nature are found; see D2, and D5 in Appendix D.
REFERENCES
1 . de Cediel N, Deom A, Hill PG, Sarkar AK. Methods recommended for essential clinical
chemical and haematological tests for intermediate hospitals laboratories. WHO LAB/86. 3.
World Health Organization Geneva, 1986 (127 pp).
2 .
3 .
4 .
5 .
Kenny AP, Eaton RH. Practical guidelines for the preparation of quality control sera for use in
clinical chemistry. WHO LAB/81.4, World Health Organization, Geneva, 1981 (33 pp).
WHO. El-Nageh MM, Heuck CC, Appel W, Vandepitte J, Engbaek K, Gibbs WN. WHO
Regional Publication, Eastern Mediterranean Series 2. Basics of Quality Assurance for
intermediate and peripheral laboratories. WHO EMRO, Alexandria, 1992 (208 pp).
Sharma KB, Agarvval DS, Arya SC, Bullock DG, Lewis SM et al. Practice of Quality Assurance
in Laboratory Medicine in Developing Countries, In: Health Laboratory Service in support of
Primary Health Care in Developing Countries. WHO Regional Publication, SEARO, No. 24,
1994.
lSO/REMCO N263. The international harmonized protocol for proficiency testing of (chemical)
analytical laboratories. Geneva 1992. See also Pure & Appl Chem 1993; 65 no 9: 2123-44.
15

APPENDIX A. HANDLING OF EQA SAMPLES IN THE PARTICIPATING LABORATORY AND
SUBMISSION OF RESULTS
Al. HANDLING OF EQA SAMPLES. INSTRUCTION FOR LYOPHILIZED CONTROL SERUM.
The unopened vials of lyophilized control serum should be stored in a refrigerator. For long term storage
-20 ºC is advantageous. The following instructions illustrate the type of procedures and precautions
necessary for reconstituting and storing control serum:
- ensure that the lyophilized material (the “cake”) is at the bottom of the vial;
- remove the metal seal; .
- release the vacuum in the vial by slowly removing the stopper so that the lyophilized material
is not blown out when the vial is opened;
- add 20,0 ml (or 10,0 ml or 5,00 ml or 1 ,OO ml as appropriate) distilled water at room
temperature with a certified bulb pipette*;
- cap the vial and keep in the dark at room temperature for 15 min.;
- mix carefully by inverting the vial 20 times;
- ensure visually that all the lyophilized material is dissolved;
- store in a refrigerator in the dark.
* Note: The accuracy of the volume of water added should be checked by weight.
16

A2. OUTLINE OF A RECORDING FORM FOR SUBMISSION OF ANALYTICAL DATA.
An example, partly filled in
XXXXYYYY EXTERNAL QUALITY ASSESSMENT SCHEME
Laboratory number0358
Date Analyzed: / /
Date of Receipt of specimen: / /
ANALYTEMETHOD
CODECORRECT
Y/NNEW METHOD
CODERESULT UNITS
SODIUM 4 mmol/L
!POTASSIUM 17 mmol/L
CHLORIDE 22 mmol/L
!UREA 32 mmol/L
!GLUCOSE 9 mmol/L
Room Temp "Storage requirements:
4ºC
Note: it is imperative that instructions for specimen treatment and analysis are followed correctly – SEE INSTRUCTIONS FOR EQA SCHEME PARTICIPANTS Deadline: Return the results to the below EQA scheme organizer before: / /
ENQUIRIES REGARDING THE SCHEME SHOULD BE SENT TO: Dr. XXXXMMMM P.O.Box 234 SMITHVILLE, etc.
Keep a copy in the laboratory. Filled in by:
Reserved for the EQA scheme organizer Date of receipt of this recording form: Date Stamp
17

APPENDIX B. STATISTICAL METHODS FOR ASSESSING DATA
B1 Basic statistical calculation in quality control
All laboratory measurements show some variation or “error”. The greater the variation, then the wider
will be the spread of results around the average value. The statistical calculations that are used enable
the variation to be described and thus compared with other sets of results.
There are three basic statistical terms which are used to describe the measurement variations
encountered in quality control. These are:
- The average or mean value ( x ) this is the sum of the individual results in a series of
measurements divided by the number of results. The mean is thus the best estimate
representing that series of results. It is expressed in the same units as the individual
measurements. A reference method may provide an estimate of the “trueness”, often named
the conventional true value. The difference between this and the obtained mean value ( x ) is
called the bias;
- the standard deviation (SD): any series of measurements will be spread around the mean
value. The standard deviation describes the spread or distribution of results around the mean
value. Like the mean, SD is described in the same units as the individual measurements
- coefficient of variation (CV): this is the SD expressed as a percentage of the mean so that the
spread of different series of results can be compared even though the mean values may be
very different.
These three statistical terms are used to describe and compare the imprecision and bias of
analytical methods within a laboratory when methods are being assessed, for routine within-laboratory
quatity control and for comparing performance between groups of laboratories in EQA schemes.
Calculation of the mean, SD and CV
The example here is for a series of 15 albumin measurements made on the same sample:
- list the individual results (column xi in Table B1)
- to calculate the mean: add up all results in column xi to obtain the sum of xi, (Σ xi); divide
this value by the number of results (15)
mean ( x ) 516 = 34.4 g/L15
- for each result, calculate (xi - x ) and enter in the column marked (xi - x );
- calculate the square of (xi - x) ie, (xi - x ) 2
- divide the sum of (xi - x)2 for all results by the number of results less one (n - 1), which is 14,
thus: 29.6 = 2.1;14
18
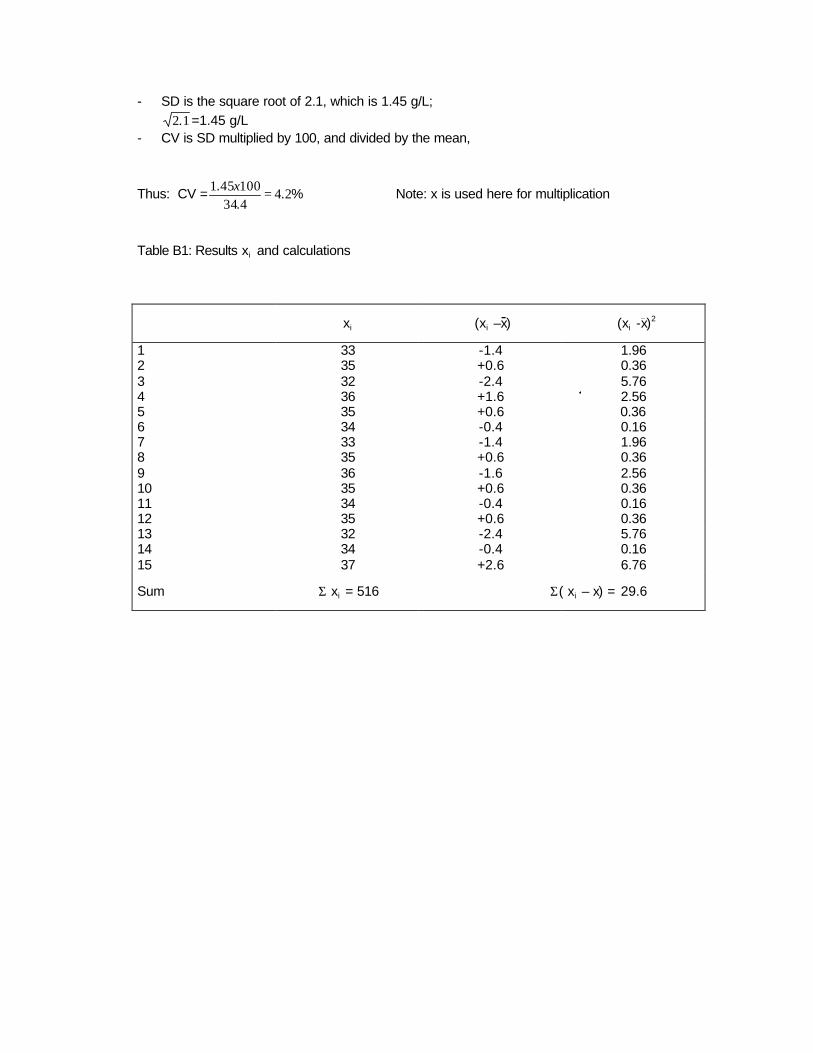
- SD is the square root of 2.1, which is 1.45 g/L;
1.2 =1.45 g/L - CV is SD multiplied by 100, and divided by the mean,
Thus: CV = %..
.24
434100451 =x
Note: x is used here for multiplication
Table B1: Results xi and calculations
xi (xi –x) (xi -x)2
1 33 -1.4 1.96 2 35 +0.6 0.36 3 32 -2.4 5.76 4 36 +1.6 2.56 5 35 +0.6 0.366 34 -0.4 0.16 7 33 -1.4 1.96 8 35 +0.6 0.36 9 36 -1.6 2.56 10 35 +0.6 0.36 11 34 -0.4 0.16 12 35 +0.6 0.36 13 32 -2.4 5.76 14 34 -0.4 0.16 15 37 +2.6 6.76
Sum Σ xi = 516 Σ( xi – x) = 29.6

B2. Systems for evaluating EQA scheme data
Control-rule system
The simplest systems for evaluating EQA-schemes are based on pass/fail rules similar to those
employed in internal quality control. They require definition of performance standards, and for each type
of control sample, a target value and acceptable limits. The set of control rules should be optimized in
such a way that the probability of error detection is high and the frequency of false alarm is low. The
type of control rule which is applied should indicate the type of error. This is particularly true when more
than one result is validated. Repeated application of an EQA -scheme may assist the laboratory in
improving its proficiency, and may also provide opportunity for education. Each time an alert is
operated, the laboratory should consider what steps it should take to improve its analytical quality.
Theoretically, the control rule system is easy to understand and should fit well with usual
analytical work in the laboratory. However, to date there has been little application of sophisticated sets
of control rules.
When using the control rule system, some information about uncertainty may be lost, but the
EQA-scheme data collected in a laboratory over a long period will allow for independent calculation of
estimates of bias and random error, so long as the target values are traceable to a reference method
and a reference material. Only relative bias can be detected if there is a lack of traceability.
Scoring systems
The basic concept of most scoring systems is the expression of an individual EQA result as the
deviation (d) from the target value, divided by the standard deviation (s).
This is termed the z-score
Formula A z d=s
Often the standard deviation (s) used for this purpose is provided by the EQA-scheme. In this case it
reflects a “between laboratory” deviation. Typically, the score is -2 to +2 when based on 95 % of all
results (i.e. +/- 2 S D ) or -3 to +3 when based on 99,9 % of all results.
Other ways of establishing the standard deviation (s) can also be relevant. One method
frequently used is to select a value for “s” that is constant for a given analyte. This permits convenient
assessment and comparison of all participants; the use of this method in the WHO International EQA
scheme is described below.
In surveys using multiple samples (n), the outcome of the survey can be assessed by
determination of the average of the z-scores.
Formula B [Σ(z)]/n
Note that in Formula B all z-scores should be treated as positive. Ideally the value of s should be
derived from clinical requirements or analytical goals but a constant value based on the state of the art
can be useful.
20

Alternatively, the scores may be combined as variances. However, the outcome will be dependent on
the number of observation.
Formula C
Combination of scores with time for multiple surveys or even for multiple analytes is possible. These
types of calculations are included in the ISO/IUPAC/AOAC guide on EQA schemes (5). The guide
acknowledges the utility of combined scores but warns of the potential for misinterpretation or abuse by
inexperienced users.
An example of a scoring system which has been applied widely, including WHO’s International EQAS, is
Variance Index. Here the z score uses a constant s term, based on an assumption of a constant CV
(derived from state of the art) across the concentration range assessed. The score is multiplied by 100
to yield a Bias Index Score (BIS) as a scaled deviation from the target which is limited to + / - 400 by
truncation of extreme deviations.
Cumulation over time (typically 6 months or 10 scores) of the BIS and Variance Index Scores (VIS; the
absolute value of BIS, ignoring its sign) yields three performance indicators for each analyte:
Accuracy (total error) MRVIS Mean Running VIS
Trueness (bias) MRBIS Mean Running BIS
Consistency of bias (variability) SDBIS Standard Deviation of BIS
Contributions to variability come from several factors (eg, concentration-dependent bias; time-related
changes in bias, specimen-dependent (matrix) effects) in addition to imprecision.
The use of an s term derived from the state of the art also permits cumulation across analytes yielding
an Overall Mean Running VIS (OMRVIS) based on all the laboratory’s results over (typically) the
previous 6 distributions. This may be used as a practically useful indicator of the laboratory’s general
standard of performance and of changes with time.
Scoring systems such as this have been extremely useful in many national and international schemes
and are not demanding to apply. However, it is essential to note that:
it is possible for a satisfactory OMRVIS to conceal unsatisfactory performance for one or more
individual analytes, and assessment should not be limited to an overall score.
a full assessment for an analyte showing performance difficulties must include examination of
the relationship between individual resuls and target values (preferably graphically), not just
appraisal of MRBIS and SDBIS. Non-analytical (eg, transcription or transposition) errors and
failure to return results should be assessed separately from analytical performance.
21

APPENDIX C. METHODS FOR REPORTING TO THE PARTICIPANTS.
The style and complexity of the report to participants will depend upon the facilities available to the
organizers, particularly the accessibility of computer programmes for data handling and graphics.
However, valid data interpretation is possible using a handheld calculator able to compute mean and
standard deviation.
The minimum data reported to participants must include: the number of laboratories in the
method group, the mean value (or target value) and SD of the submitted results, the results submitted
by the participant, the acceptable limits, and possibly some type of score. Each laboratory can thus
compare their result with the mean (or other target value) and distribution of all results obtained using
that method. Comments on the results should be given when they are outside the acceptable limits; the
first comment could be: “check the value”; when there are frequent deviations the comments could be
“analytical problems, contact the EQAS organizer”.
The use of a computer allows histograms to be produced which. assist in the comparison of an
individual result with all results submitted.
Examples of report formats are shown in C1, C2, C3, C4 and C5.
C 1. AN EXAMPLE OF A REPORT WHICH MAY BE PREPARED WITH A HANDHELD
CALCULATOR AND A TYPEWRITER.
ANALYTE
Glucose(mmol/L)
Urea(mmol/L)
Calcium(mmol/L)
METHODUSED
All 303GOD-POD 221o-toluidine 49Folin & Wu 32Other 1
AllDAM-TSCUrease-BerthelotUrease-GLDH
AllCPC-AMPCPC-DEAEDTA-titrationOther
n MEAN SD
284140c
112 18.3 2.9
32 18.1 2.9
208 2.47 0.2535 2.42 0.1549 2.39 0.16
121 2.52 0.203 2.70 0.35
8.48.29.18.49.5
19320.0
1.20.91.01.1
, 3.23.0
YOUR ACCEPTABLERESULT LIMITS
9 4.
23.2 16.1 - 20.5 446
2.44 2.27 - 2.77 -63
7.3 - 10.9
SCORE
33
22
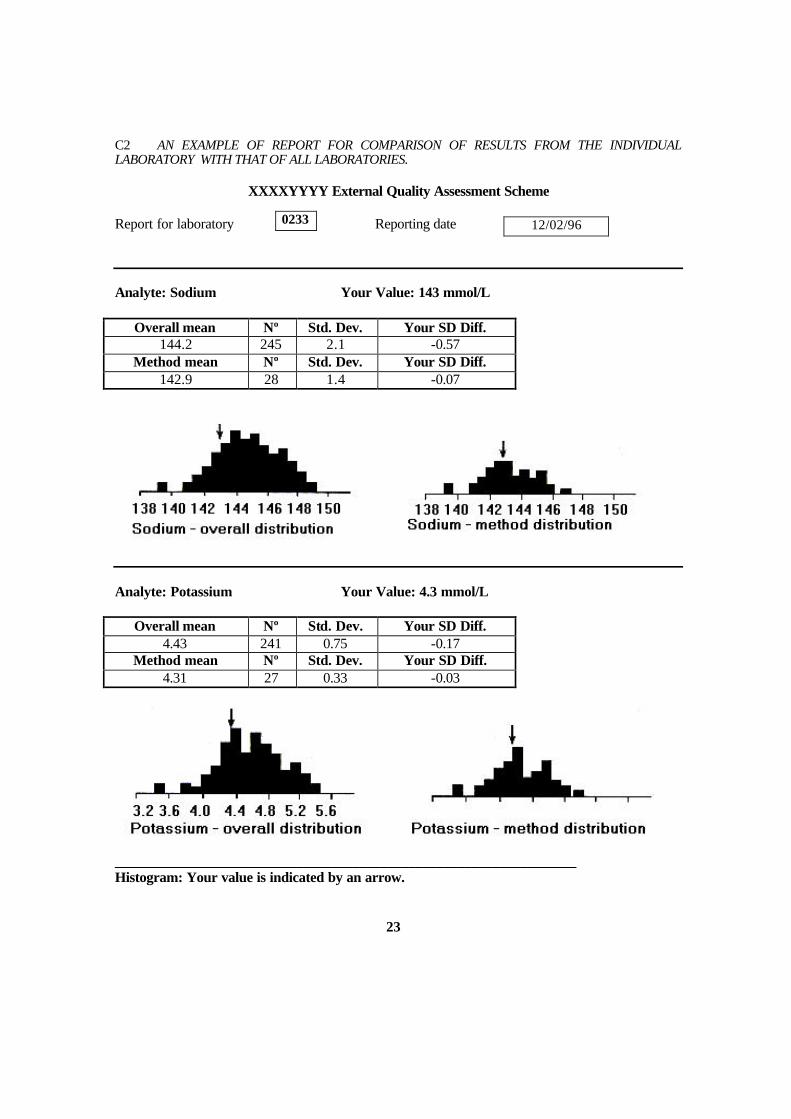
C2 AN EXAMPLE OF REPORT FOR COMPARISON OF RESULTS FROM THE INDIVIDUAL LABORATORY WITH THAT OF ALL LABORATORIES.
XXXXYYYY External Quality Assessment Scheme
Report for laboratory Reporting date Analyte: Sodium Your Value: 143 mmol/L
Overall mean Nº Std. Dev. Your SD Diff. 144.2 245 2.1 -0.57
Method mean Nº Std. Dev. Your SD Diff. 142.9 28 1.4 -0.07
Analyte: Potassium Your Value: 4.3 mmol/L
Overall mean Nº Std. Dev. Your SD Diff. 4.43 241 0.75 -0.17
Method mean Nº Std. Dev. Your SD Diff. 4.31 27 0.33 -0.03
__________________________________________________________________ Histogram: Your value is indicated by an arrow. 23
0233 12/02/96

C3. AN EXAMPLE FOR COMPARISON OF RESULTS FROM THE INDIVIDUAL LABORATORY WITH THAT OF ALL LABORATORIES, THE REFERENCE METHOD VALUE AND THE ACCEPTABLE INTERVAL.
VVVVYYYY External Quality Assessment Scheme Report for laboratory Reporting date ___________________________________________________________________________ Analyte: Sodium Units: mmol/L Your Value: 143
Overall mean Std. Dev. Nº Acceptable % 144.2 2.1 245 73
Method mean Std. Dev. Nº Acceptable (%) 142.9 1.4 28 92
Analyte: Sodium Unit: mmol/L Your Value: 4. 30
Overall mean Std. Dev. Nº Acceptable % 4,43 0,75 241 73
Method mean Std. Dev. Nº Acceptable % 4,31 0,33 28 92
Analyte: Urea Unit: mmol/L Your value: 4,1
Overall mean Std. Dev. Nº Acceptable % 4,4 0,75 241 65
Method mean Std. Dev. Nº Acceptable % 4,1 0,33 27 48
Histogram : Your value is indicated by an arrow 24
12/02/96 0238
Reference method value: 143.1 Acceptable interval: 140 - 146
Reference method value: 4,45 Acceptable interval: 4,00 - 4,90
Reference method value: 4,5 Acceptable interval 4,1 - 4,9

c4. AN EXAMPLE Of PRESENTATION FOR THE INDIV IDUAL LABORATORY OF
CONCENTRATION DEPENDENT DATA SET (LONG TERM DATA).
The data presentation shown here, Fig C4.1, is designed to provide as much useful information as
possible from a series of EQA data in order to assist in trouble shooting. The presentation is suited to an
EQA scheme where established target values are available. The plot uses concentration of the target
value as x-axis, and the deviation from the target as y-axis showing the systematic error (bias plot). The
plot typically accumulates EQA data from many series. The plot may be prepared by each participant
manually or produced centrally on a computer.
mmol/Lxxxxxxxxxxx Reference interval~~~~~...~~.~~~~ Regression line
0 Last period
0 This period
I
6 00 mmol/L
Last result
2 0. 4 0Targei value
Fig. C4.1. The figure shows a dotted line which is the regression line calculated by the computer. Slope
(b) and intercept of the regression line are key parameters. The plot shows as an example a systematic
error of 0.4 mmol/L minus 9% (b = -0.09) of the target value. Ideally each value should be zero. The plot
may be supplemented by another bias plot showing the results in historical sequence.
2 5
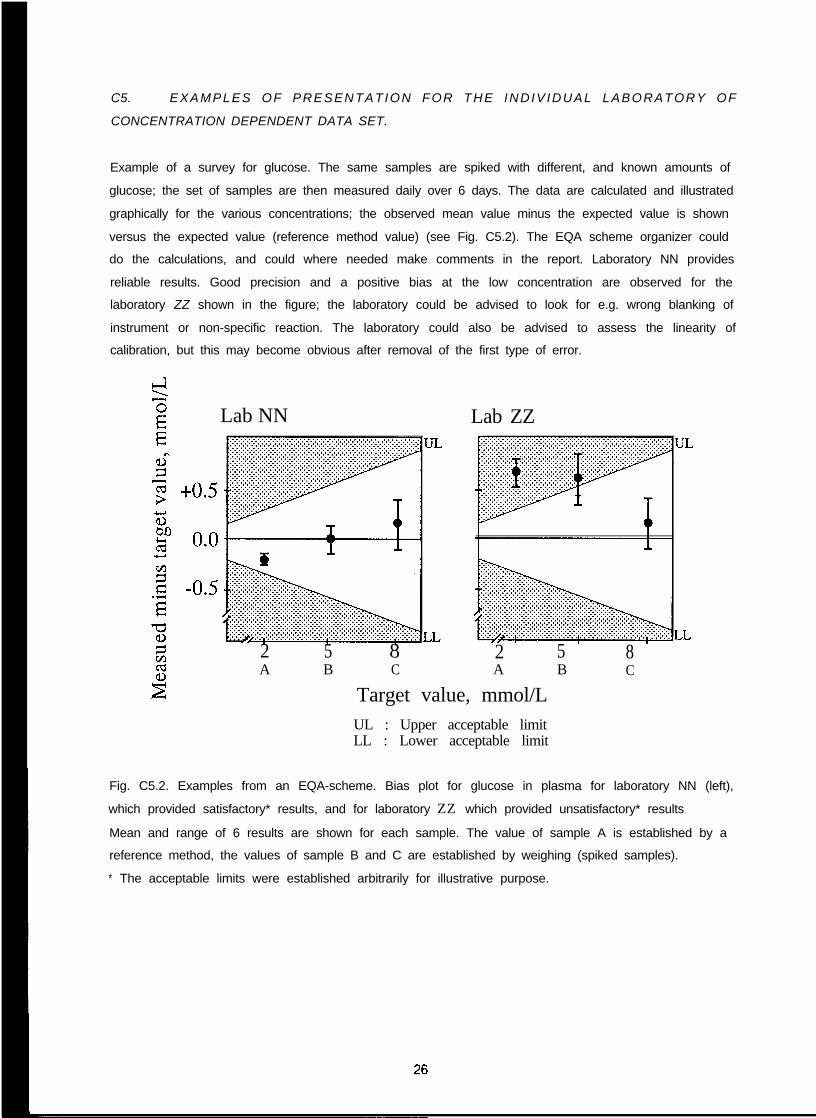
C5. EXAMPLES OF PRESENTATION FOR THE INDIV IDUAL LABORATORY OF
CONCENTRATION DEPENDENT DATA SET.
Example of a survey for glucose. The same samples are spiked with different, and known amounts of
glucose; the set of samples are then measured daily over 6 days. The data are calculated and illustrated
graphically for the various concentrations; the observed mean value minus the expected value is shown
versus the expected value (reference method value) (see Fig. C5.2). The EQA scheme organizer could
do the calculations, and could where needed make comments in the report. Laboratory NN provides
reliable results. Good precision and a positive bias at the low concentration are observed for the
laboratory ZZ shown in the figure; the laboratory could be advised to look for e.g. wrong blanking of
instrument or non-specific reaction. The laboratory could also be advised to assess the linearity of
calibration, but this may become obvious after removal of the first type of error.
Lab NN Lab ZZ
2 5 r 8A B C
2 5 8A B C
Target value, mmol/LUL : Upper acceptable limitLL : Lower acceptable limit
Fig. C5.2. Examples from an EQA-scheme. Bias plot for glucose in plasma for laboratory NN (left),
which provided satisfactory* results, and for laboratory ZZ which provided unsatisfactory* results
Mean and range of 6 results are shown for each sample. The value of sample A is established by a
reference method, the values of sample B and C are established by weighing (spiked samples).
* The acceptable limits were established arbitrarily for illustrative purpose.

APPENDIX D. USEFUL ADDRESSES; how to obtain additional informationDI. /FCC Technical Secretariat
Centre du MedicamentUniversite de Nancy 130, rue LionnoisF-54000 Nancy, FranceFax: 33 83 32 13 22
D2.Types of request: /FCC publications, name and addresses of national representative./FCC. Education and Management Division.Committee on Analytical Qualify (CAQ)
Peter HillDept. of Chemical Pathology, Derbyshire Royal infirmary,Derby, DE1 2QY, United KingdomFax: +44 1332 254 924
Adam U/da/l (chair)Dept. of Clinical ChemistryHerlev University HospitalDK 2730 Herlev, DenmarkFax: +45 44 53 53 32
Peter WildingDept. of Pathology and Laboratory Medicine3400 Spruce Street, 7103 Founders PavillionHospital of the University of PennsylvaniaPhiladelphia, PA 19 104-4284, USAFax: +1 215 662 7529
D3.
Types of request to members of CAQ: Bibliographic information, nomenclature, desirableperformance standards, definitions of analytical terms and qualify terms, advice on design ofscheme, supply of control sera and target values (when possible), world wide contact to EQASorganizers.World Health Organization (WHO)Unit of Health Laboratory TechnologyCH-1211 Geneva 27 SwitzerlandFax: +41 22 79 10 746
D4.
D5.
Type of request: Availability of WHO sponsored EQA schemes; registration of national orregional EQA schemesWHO Collaborating Center for Research & Reference services in clinical chemistryInternational EQAS for Clinical Chemistry, Wolfson EQA Laboratory,Queen Elizabeth Medical CentreP.0. Box 3909Birmingham B15. 2UE, UK.Fax: +44 12 14 14 11 79Types of request: Participation in the scheme, advice on scoring systems.IUPAC-IFCC/C-QU(CC)Henrik OlesenDept. of Clinical BiochemistryRigshospitaletTagensvej 9DK-2200 Copenhagen NV, Denmark.Tel: +45 35 45 76 42Fax: +45 35 45 27 45Type of request: Names of quantities.

APPENDIX E. PREPARATION OF LYOPHILIZED BOVINE SERUM
A detailed description of the preparation of lyophilised bovine serum and procedures for
adjusting the concentrations in the final product is given in WHO LAB/81.4 (2). The information provided
below is compiled from WHO LAB/81.4 and other literature.
Collection of blood and separation of serum
Ideally, serum is obtained from manufacturers of bacteriological culture media. When this is
not possible, fresh blood from a slaughter house may be used. It should be collected using as aseptic
conditions as possible. The blood must be collected into dry containers.
Achieving the desired concentration
Concentrations of analytes in the serum may be adjusted by several techniques. The simplest
is dilution with water to decrease the concentrations.
Calcium, sodium and potassium may be added as salts, for example, chlorides; and urea,
creatinine and glucose added to increase the concentrations of these analytes (see also Appendix F).
Bilirubin and uric acid can be added after dissolving in potassium or sodium hydroxide (0.1 mmol/L).
Apparent triglyceride concentrations can be increased by the addition of glycerol although such
material will not be suitable for methods involving extraction. There is no simple procedure for
increasing cholesterol concentrations.
Adjustment with enzymes will in general lead to method dependent final activities because the
enzymes used may behave differently from normal human serum enzymes with different methods.
Sterile filtered (pore size <0.2 µm) human saliva may be used to increase amylase activity. Appendix F
of this document describes the preparation of placental alkaline phosphatase and also indicates
alternative commercial sources.
If the desired concentrations cannot be obtained by simple dilution or addition of selected
analytes, then “cryoconcentration” as described in Appendix F and in WHO LAB/81.4 may be helpful..Alternatively, for some centres ultrafiltration/dialysis using disposable kidneys may be possible.
When the serum is required for monitoring carbonate and carbon dioxide, then a special
hydrogen carbonate reconstitution fluid must be provided.
Filtration and dispensing into vials
After the additions have been made, the serum must be filtered before dispensing into vials. The less
contaminated the product, the better it will keep. Complete sterility is difficult to achieve and adds
considerably to the expense of production. However, the best level of purity which can be achieved
locally should be the goal. Turbid contaminated materials need filtration through one or more deep filters
followed by a membrane filter (pore size < 0.6 µm is often sufficient).
A variety of filtration systems are available. The serum is best forced from a vessel with an
oval internally fitted lid, pressurized with nitrogen gas, 10 to 25 Ibs per in2 (70 to 140 kNlmL) through a
supported pad, cartridge or membrane filter either directly or employing a cascade system, the latter
reducing particle size by stages. Cognisance must be taken of the total volume of serum to be filtered
2 8
per batch and the fact that serum is more difficult to filter than simple aqueous solutions. Small losses
occur during this stage e.g. absorption of bilirubin onto filter material.
For dispensing supplies of vials, stoppers and aluminium closure rings are required. The vial
for the lyophilized serum should have a total volume 2,5 times that of the serum dispensed, e.g. 25 ml
vials are required for 10 ml serum and 50 ml vials when 20 mL are dispensed. Amber glass vials are
preferable to clear glass.
Each batch of serum must be thoroughly mixed before dispensing starts. For repetitive
deliveries an automatic dispenser capable of a consistent precision of 0.2 % or better of the volume
dispensed should be used. Because of the proteinaceous nature and dissolved gases in serum, difficulty
is experienced with certain syringe type automatic dispensers and it is essential to check the volume
delivered throughout a run in at least one tenth of the vials by weighing before and after delivery.
Records should be kept of vial positions in the filling and lyophilization processes. In this way
any deficiencies in the processes can be detected.
Lyophilization
The principle and operation of a typical freeze drier is described elsewhere. A temperature probe
(thermistor) is placed in one of the vials to monitor the drying process and this vial is placed at the core
of each batch. The tray carrying the vials containing the dispensed serum is placed in a deep freeze and
the serum frozen for a period of several hours after which it is placed in the freeze drier and the
operation started with a minimun of delay. Where facilities allow, it is desirable to cap the vials under
vacuum or under an atmosphere of nitrogen while still in the chamber in order to minimize problems due
to oxidation. Alternatively on removal from the chamber at the conclusion of the drying process, the
vials are capped immediately and aluminium closure rings placed above the rubber stoppers and
compressed by a hand crimper.
Control of stability
It is essential to check the stability when establishing the production of control sera and every time
changes are made to the production procedure. Alanine aminotransferase and glucose should be studied
because they are the most vulnerable components. Bilirubin may also be included. Complete stability of
the components in the sera is not achievable and the stability may vary from one batch of control serum
to another.
The checks should be done on the lyophilized product stored at 4 ºC and at 25 ºC over its life
time. A study of stability at 35 ºC e.g. for one month, is also relevant in hot countries to simulate mailing
conditions. Confirmation of stability may be achieved by the comparison of consensus mean values
obtained on repeated testing of the batch in the same region.
Check of homogeneity
Initial test. Vials to test for homogeneity should be selected so that the extreme conditions are covered.
The first, the middle, and the last vial in the filling line should be selected as well as two vials from the
middle and two from outer positions of the lyophilization chamber. A sample from each vial is measured
three times within one series of analysis ensuring that all vials will be equally affected by any possible
2 9
drift with time in the analytical system. The following components should be checked: sodium, calcium,
total protein, bilirubin, glucose and alanine aminotransferase. Analysis of variance may be used to show
whether a significant between-vial variation is present.
Confirmatory investigation. If the initial test indicates a significant between-vial variation this
may be confirmed by a more complete investigation covering one or two percent of all vials and of one
or more critical components, such as glucoses and alanine aminotransferase.
Preparation of labels
Labels are prepared which carry explicit information of the name of the manufacturing laboratory, date
of manufacture, batch number, the type of matrix, the recommended storage conditions and where
appropriate the volume of distilled water (or other reconstitution fluid) to be added, together with any
other relevant information.
Storage
Lyophilized sera should be stored in a refrigerator within the temperature range 2-8 º C Storage at
-20 ºC improves long term stability.
Distribution
Lyophilized material can be transported throughout the world if carried as air freight and immediately
stored under refrigerated conditions on arrival at its destination. Where ambient temperature is high,
de lay can resul t in lowering of certain assigned values particularly glucose and alanine
aminotransferase.
30
WORLD HEALTH ORGANIZATION APPENDIX F LAB/86.4
PREPARATION OF STABILISED LIQUID QUALITY CONTROL SERUM TO BE USED IN CLINICAL CHEMISTRY
by
Mr. D M Borwning, Laboratory Manager Department of Clinical Chemistry Wolfson Research Laboratories Queen Elizabeth Medical Centre
Birmingham, England
Dr P G Hill, Top Grade Biochemist Derbyshire Royal Infirmary
Derby, England
Dr D A Vazquez Olazabal, Scientist Health Laboratory Technology
WHO Headquarters, Switzerland
CONTENTS
Page SUMMARY …………………………………………………………………………………………………. 32 1 MATERIALS FOR EVALUATING LABORATORY PERFORMANCE ……………………… 32 1.1 Stabilisation by sterilization ……………………………………………………………. 32 1.2 Stabilisation by lyophilization ………………………………………………………….. 32 1.3 Stabilisation by chemicals ……………………………………………………………… 33 2 CHOICE OF STARTING MATERIALS ………………………………………………………… 33 3 METHODS OF PREPARING STABILISED LIQUID SERUM ………………………………. 34 4 METHODS FOR THE PREPARATION OF SERUM USING ETHYLENE GLYCOL (ETHANEDIOL)…………………………………………………………………………………… 34 4.1 Preparation of a preliminary batch ……………………………………………………. 35 4.2 Preparation of a medium concentration quality control serum …………………….. 35 4.3 Preparation of a low concentration quality control serum ………………………….. 38 4.4 Preparation of a high concentration quality control serum …………………………. 39 GENERAL NOTES ………………………………………………………………………………………… 42 Appendix 1: PREPARATION OF ENZYME CONCENTRATES ………………………………….. 43 Appendix 2: SOME POSSIBLE COMMERCIAL SOURCES OF ENZYMES…………………….. 44 ACKNOWLEDGEMENTS …………………………………………………………………………………. 45 Reproduced, by permission, from: “Preparation of stabilized liquid quality control serum to be used in clinical chemistry”. Geneva, World Health Organisation technical document LAB/86.4. The issue of this document does not constitute
formal publication. It should not be reviewed, abstracted, quoted or translated without the agreement of the World Health Organization. Authors alone are responsible for views expressed in signed articles.
Ce document ne constitue pas une publication. Il ne doit faire l’objet d’aucun compte rendu ou resume ni d’aucune citation ou tradution sans l’autorisation de l’Organisation mondiale de la Sante. Les opinions experimees dans les articles signes n’engagent que leurs auteurs.
Page 32
SUMMARY
The use of Internal Quality Control (IQC) and External Quality Assessment (EQA) to continuously
monitor laboratory performance are accepted as essential parts of the function of any health laboratory.
Laboratories in many countries are disadvantaged by virtue of the non availability or high cost of
commercial quality control sera. The WHO document (LAB/81.4) was prepared to encourage local
production of quality control materials to ensure their availability. Guidelines for the preparation of
lyophilised and liquid control sera are given in that document.
This publication extends document LAB/81.4 by describing the preparation of liquid control sera
stabilised with ethylene glycol (ethanediol) which expands the suitability of the material to include the
control of commonly measured enzymes in addition to other analytes. The material described in this
document can be used for IQC and EQA of the clinical chemistry methods described in “Methods
Recommended for Essential Clinical Chemical and Haematological Tests in Intermediate Hospital
Laboratories” (LAB/86.3).
1 MATERIALS FOR EVALUATING LABORATORY PERFORMANCE
IQC and EQA are required in all laboratories in developed and developing countries. They involve
the use of analytical results obtained when suitable materials, usually serum, are analysed in the same way
as specimens from patients. The results are used (i) to decide whether a batch of tests is acceptable and
can therefore be reported to the requesting doctor (IQC) and (ii) to observe analytical comparability
between laboratories within a region, country or internationally (EQA).
The control materials used for these purposes must be stable; this has been achieved in the
following three ways:
11.
several
(1) Liquid serum can be stabilised by sterilisation (filtration).
(2) Liquid serum can be dispensed into ampoules and then lyophilised.
(3) Liquid serum can be stabilised by the addition of chemicals.
Stabilisation by sterilisation
This method produces serum which contains no viable bacteria and which is stable at 4ºC for
weeks. Serum prepared in this way is stable for 2-3 weeks at 20-25ºC but is unstable in warmer
climates. A major problem with the preparation of this material is the provision of a suitable sterile
environment and of dry sterile bottles.
1.2 Stabilisation by lyophilisation
This method produces a stable product which is widely used in more developed countries. Serum
is filtered and then lyophilised. In its dried state it is stable for several years when correctly stored. There
are several disadvantages to this method, viz:
(a) The serum must be accurately and precisely dispensed prior to lyophilisation.
(b) It is an expensive process, requiring significant capital expenditure.
(c) It requires considerable expertise to obtain a satisfactory product
(d) Reconstitution of the material with an exact volume of water is necessary prior to use.
(e) Matrix changes occur during lyophilisation and the reconstituted serum may be significantly
turbid.
Page 33
It is doubtful if developing countries with limited resources could afford the expense of total reliance
on lyophilised material. However, there will always be a requirement for small amounts as a stable
reference material. In some instances it may be more cost effective to purchase these from a suitable
commercial source.
1.3 Stabilisation by chemicals
This method produces a cheap source of stable liquid serum suitable for IQC and EQA. A variety
of compounds have been used to stabilise serum and serum preserved in this way will remain stable for
several weeks when stored correctly. The major advantage of this method are:
(a) Low cost.
(b) It is a simple process requiring normal laboratory expertise.
(c) No reconstitution is required prior to use.
(d) Little or no obvious matrix effects on subsequent analysis by manual methods.
However, the preservatives chosen should not interfere with methods in common use. Laboratories
can prepare a range of sera with different concentrations of common analytes thus enabling the laboratory
worker to check the analytical process over a wide concentration range.
2 CHOICE OF STARTING MATERIAL
The use of animal sera is strongly recommended rather than human sera for the following reasons:
(a) The serious risk of incorporating infectious human sera into the material with agents that
cause serum hepatitis and acquired immune deficiency syndrome, etc.
(b) The use of human donors to supply large quantities of general purpose control serum is
not justifiable.
(c) For the purpose envisaged in this document, viz, the quality control of most tests
including those listed in LAB/86.3, the use of animal serum is satisfactory.
Bovine serum is the best source in many countries; however, in some countries its use may not be
acceptable. Some alternative materials are porcine and equine although other animal sources may also be
acceptable. Table 1 compares the approximate concentrations of some common analytes in human,
bovine, equine and porcine serum. Details for the collection of animal blood may be found in the WHO
document LAB/81.4.

Page 34
TABLE 1 - APPROXIMATE CONCENTRATIONS OR ACTIVITY OF ANALYTES IN HUMAN AND
SOME ANIMAL SERA (SI UNITS)*
ANALYTE
Albumin (BCG)Alk Phos**Amylase **AST**BicarbonateBilirubinCalciumCreatinineGlucose
(fasting)PotassiumSodiumTotal proteinUrea
UNIT HUMAN
g/lU/IU/IU/I
m mol/lµmol/l
m mol/lµmol/l
mmol/l
m mol/lmmol/l
g/lmmol/l
4 35 5
1802 62 5
72,58 0
5 0,
4,31 4 1
7 04 7,
BOVINE EQUINE PORCINE
3 25 6158 5
3 02,68
9 72 8,
4 3142
6 84,3
103,08
9 741,
4 0139
6 84,7
2 62,49
8 83 9,
4,6148
8 05 0,
* The comma (,) has been used to indicate the decimal fraction as recommended in theSI for the Health Professions, World Health Organisation, 1977.
Measured by the methods described in LAB/86.3
3 METHODS OF PREPARING STABILISED LIQUID SERUM
It is essential that all laboratories have reasonably large volumes of stable quality control serum
available. These need to be of good quality but cheap and easy to produce.
Of the methods available the one chosen must utilise cheap and widely available chemicals. Some
compounds are known to invalidate enzyme assays and should not be used if the material is to be used for
enzyme measurements. Thiomersal, borate, fluoride, azide and antibiotics have all been used as
preservatives but have been found to be less satisfactory then ethylene glycol. In serum containing 15%
ethylene glycol, all of the constituents listed in Table 2 are stable at -2OºC for at least 8 months. At 4ºC,
alkaline phosphatase, AST and bilirubin are stable for 4 months and all other constituents listed in Table 2
are stable for at least 8 months. Serum containing 15% ethylene glycol is also stable at higher
temperatures for shorter periods. Initial studies indicate that all of the serum constituents described in
Table 2 are stable at 25ºC for six days and at 37ºC for three days. The stability at these temperatures is
likely to be variable depending on the level of contamination by microorganisms. Serum prepared in this
way may therefore be distributed at ambient temperature for external quality assessment programmes in
addition to its use for internal quality control.
4 METHODS FOR THE PREPARATION OF SERUM USING ETHYLENE GLYCOL (ETHANEDIOL)
The addition of any liquid to serum results in a dilution of the concentration of all analytes. For
many analytes this is undesirable and involves the laboratory in the addition of several compounds to
restore the concentration of some constituents. To avoid this it is best to start by preparing a carefully
mixed serum pool which is then frozen. On thawing, the top layer will contain very low concentrations of all
constituents. A volume, equivalent to 15% of the total, is removed and replaced with the same volume of

Page 35
ethylene glycol. It is then mixed carefully and thoroughly. At this stage the serum may be assayed for any
constituent and compounds added to elevate the concentration of certain analytes.
4.1 Preparation of a preliminary batch
It is important that laboratories have available to them batches of quality control sera in the low,
medium and high concentrations of all analytes likely to be measured as recommended in WHO document
LAB/86.3. These materials enable laboratories to carry out quality control checks over a wide analytical
and physiological range. However, we strongly recommend the preparation of a small practice batch with
the concentration of most analytes in the medium range. This helps the laboratory gain expertise and
avoids the possible loss of valuable serum. When familiar with the techniques the laboratory can prepare
larger volumes at low, medium and high concentrations and this will involve more extensive additions of
various materials.
Start with a batch of 250 ml;
4.2
Start with 250 ml of fresh bovine (porcine or equine) serum. Human serum is not
recommended (see Section 2).
Carefully mix to ensure homogeneity and freeze completely at -2OºC. Since it is important
to avoid possible deterioration of this serum by allowing it to remain at ambient temperature
too long, the remainder of the process must be completed within one working day.
Allow to thaw at room temperature.
When completely thawed carefully remove 38 ml of the top layer of fluid. This is 15% of
the total volume and consists mainly of water or very dilute serum.
Replace this volume by adding 38 ml of ethylene glycol.
Mix very carefully and filter through non absorbent cotton wool
aggregates.
The glucose and urea concentrations will be too low for a seru
to remove any large
n of medium concentration
and must be raised by adding 140 mg of glucose and 44 mg of urea. These solids must be
dissolved and the preparation carefully and thoroughly mixed to ensure homogeneity.
The serum can then be dispensed into clean, dry, well capped bottles or vials and stored in
the refrigerator.
Before use the serum should be removed from the refrigerator and allowed to rise to
ambient temperature; mix gently and thoroughly before use.
Preparation of a medium concentration quality control serum
1 Start with 1 litre of fresh bovine (porcine or equine) serum.
2 Carefully mix to ensure homogeneity and freeze at -2OºC. It is important to avoid possible
deterioration of this serum by allowing it to remain at ambient temperature too long. The
remainder of the process must be completed within one working day.
3 Allow to thaw at room temperature.
4 When completely thawed remove 150 ml of the top layer of fluid. This is 15% of the total
volume and consists mainly of water or very dilute serum.
5 Replace this volume of fluid by adding 150 ml of ethylene glycol.
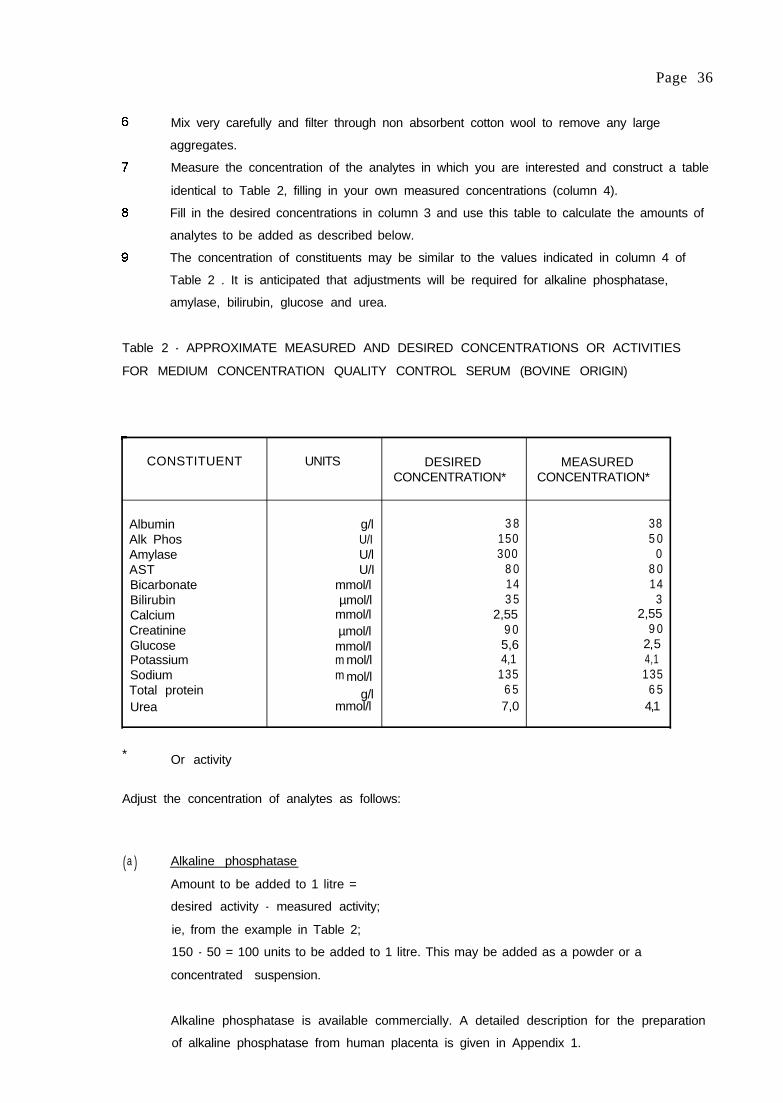
Page 36
Mix very carefully and filter through non absorbent cotton wool to remove any large
aggregates.
Measure the concentration of the analytes in which you are interested and construct a table
identical to Table 2, filling in your own measured concentrations (column 4).
Fill in the desired concentrations in column 3 and use this table to calculate the amounts of
analytes to be added as described below.
The concentration of constituents may be similar to the values indicated in column 4 of
Table 2 . It is anticipated that adjustments will be required for alkaline phosphatase,
amylase, bilirubin, glucose and urea.
Table 2 - APPROXIMATE MEASURED AND DESIRED CONCENTRATIONS OR ACTIVITIES
FOR MEDIUM CONCENTRATION QUALITY CONTROL SERUM (BOVINE ORIGIN)
CONSTITUENT UNITS DESIRED MEASUREDCONCENTRATION* CONCENTRATION*
Albumin g/l 3 8 38Alk Phos U/I 150 5 0Amylase U/l 300 0AST U/I 8 0 8 0Bicarbonate mmol/l 14 14Bilirubin µmol/l 3 5 3Calcium mmol/l 2,55 2,55Creatinine µmol/l 9 0 9 0Glucose mmol/l 5,6 2 5Potassium m mol/l 4,1 4,1Sodium m mol/l 135 135Total protein g/l 6 5 6 5Urea mmol/l 7,0 4,1
* Or activity
Adjust the concentration of analytes as follows:
( )a Alkaline phosphatase
Amount to be added to 1 litre =
desired activity - measured activity;
ie, from the example in Table 2;
150 - 50 = 100 units to be added to 1 litre. This may be added as a powder or a
concentrated suspension.
Alkaline phosphatase is available commercially. A detailed description for the preparation
of alkaline phosphatase from human placenta is given in Appendix 1.

Page 37
(b) Amylase
Amount to be added to 1 litre =
desired activity - measured activity;
ie, from the example in Table 2;
300 - 0 = 300 units to be added to 1 litre.
Human saliva contains about 1000 units amylase/ml, so 0,3 ml contains 300 units. Collect
about 1 ml of saliva, centrifuge at about 2500 rpm for 10 minutes then add 0,3 ml of
supernatant to 1 litre of stabilised control serum. Measure the amylase activity of the
control serum at 37ºC to confirm that it is approximately 300 U/I.
(c) Bilirubin
Amount to be added to 1 litre =
desired concentration - measured concentration;
ie, from the example in Table 2;
35 - 3 = 32 µmol (1 µmol/l = 0,59 mg)
32 x 0,59 = 19 mg to be added to 1 litre.
Weigh out 19 mg of bilirubin (32 µmol), dissolve in 4,0 ml of 0,1 mol/l sodium hydroxide to
produce a clear red solution; when the bilirubin has completely dissolved, add the solution,
with constant stirring, to the 1 litre of stabilised control serum. The procedure should not be
carried out in a brightly lit place and, after adding the bilirubin to the control serum, it must
be protected from light to avoid destruction of the bilirubin.
(d) Glucose
Amount to be added to 1 litre =
desired concentration - measured concentration;
ie, from the example in Table 2;
5,6 - 2,5 = 3,1 mmol (1 mmol = 180 mg)
3,1 x 180 = 558 mg.
Weigh out 558 mg of glucose and add it to 1 litre of stabilised serum, mix gently and
thoroughly to dissolve.
( )e Urea
Amount to be added to 1 litre =
desired concentration - measured concentration;
ie, from the example in Table 2;
7,0 - 4,1 = 2,9 mmol (1 mmol = 60 mg)
2,9x60=174mg.
Weigh out 174 mg of urea and add it to 1 litre of stabilised serum, mix gently and
thoroughly to dissolve.
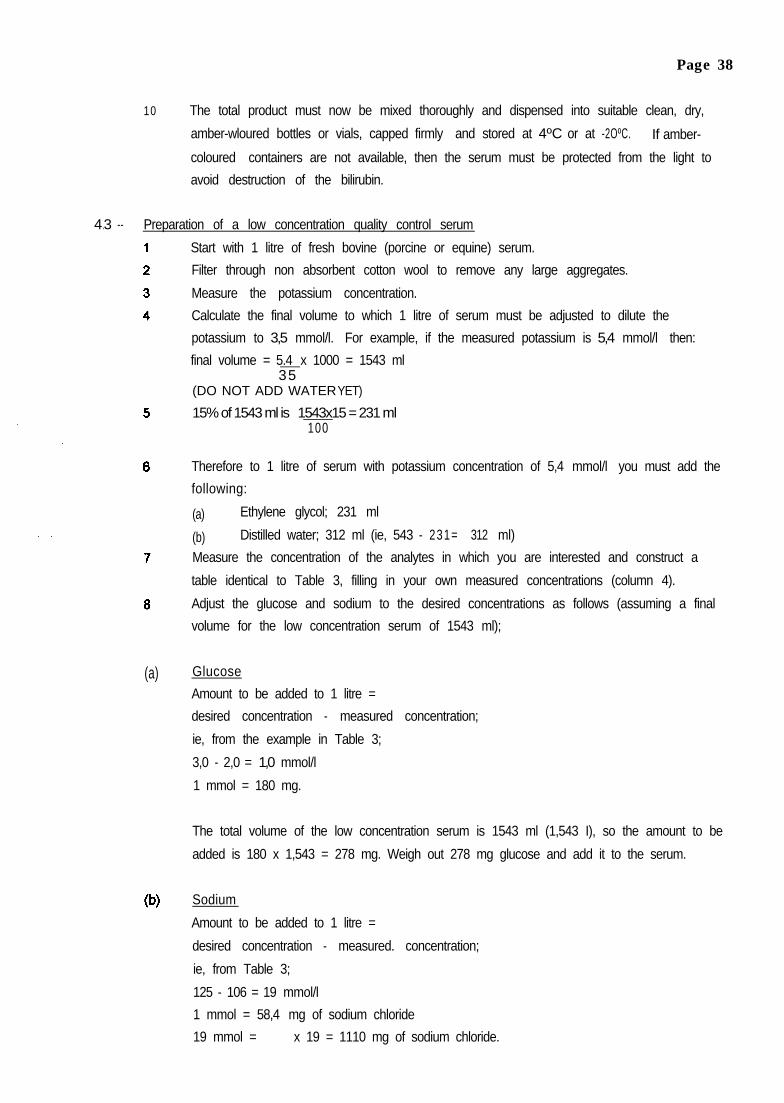
Page 38
10 The total product must now be mixed thoroughly and dispensed into suitable clean, dry,
amber-wloured bottles or vials, capped firmly and stored at 4ºC or at -2OºC. If amber-
coloured containers are not available, then the serum must be protected from the light to
avoid destruction of the bilirubin.
43 --. Preparation of a low concentration quality control serum
(a)
Start with 1 litre of fresh bovine (porcine or equine) serum.
Filter through non absorbent cotton wool to remove any large aggregates.
Measure the potassium concentration.
Calculate the final volume to which 1 litre of serum must be adjusted to dilute the
potassium to 3,5 mmol/l. For example, if the measured potassium is 5,4 mmol/l then:
final volume = 5.4 x 1000 = 1543 ml35
(DO NOT ADD WATERYET)
15% of 1543 ml is 1543x15 = 231 ml100
Therefore to 1 litre of serum with potassium concentration of 5,4 mmol/l you must add the
following:
(a) Ethylene glycol; 231 ml
(b) Distilled water; 312 ml (ie, 543 - 231= 312 ml)
Measure the concentration of the analytes in which you are interested and construct a
table identical to Table 3, filling in your own measured concentrations (column 4).
Adjust the glucose and sodium to the desired concentrations as follows (assuming a final
volume for the low concentration serum of 1543 ml);
Glucose
Amount to be added to 1 litre =
desired concentration - measured concentration;
ie, from the example in Table 3;
3,0 - 2,0 = 1,0 mmol/l
1 mmol = 180 mg.
The total volume of the low concentration serum is 1543 ml (1,543 I), so the amount to be
added is 180 x 1,543 = 278 mg. Weigh out 278 mg glucose and add it to the serum.
Sodium
Amount to be added to 1 litre =
desired concentration - measured. concentration;
ie, from Table 3;
125 - 106 = 19 mmol/l
1 mmol = 58,4 mg of sodium chloride
19 mmol = 58,4 x 19 = 1110 mg of sodium chloride.
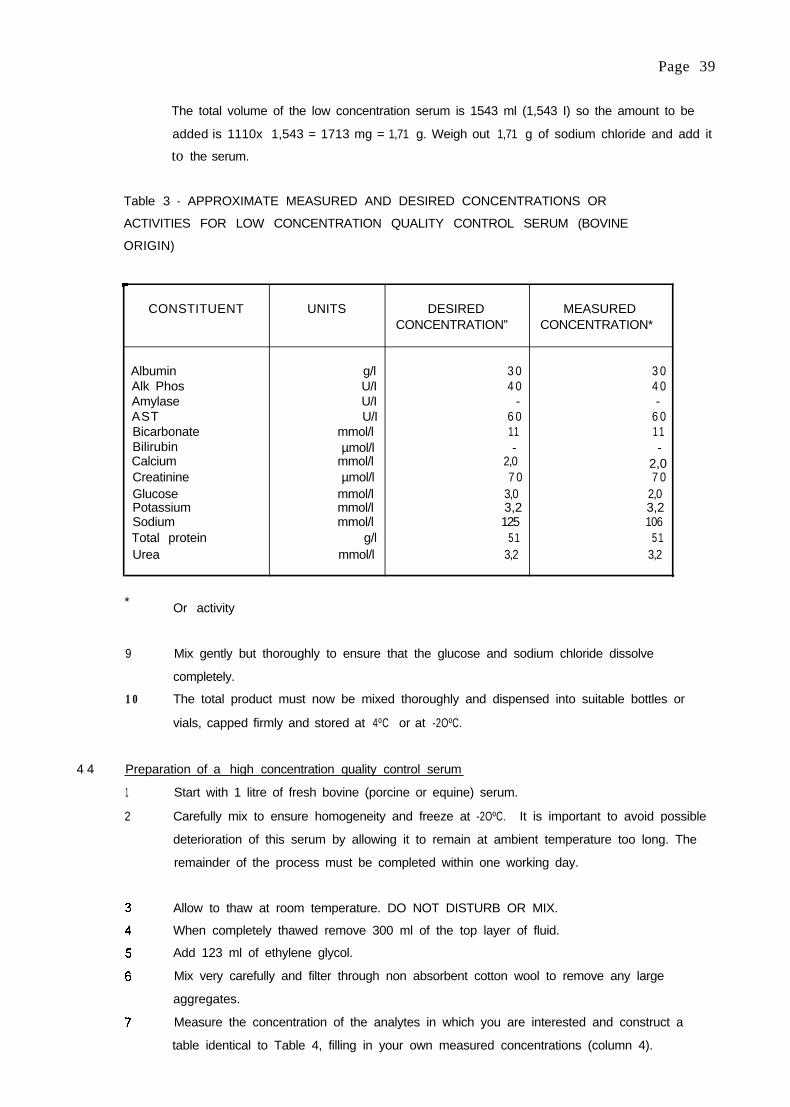
Page 39
The total volume of the low concentration serum is 1543 ml (1,543 I) so the amount to be
added is 1110x 1,543 = 1713 mg = 1,71 g. Weigh out 1,71 g of sodium chloride and add it
to the serum.
Table 3 - APPROXIMATE MEASURED AND DESIRED CONCENTRATIONS OR
ACTIVITIES FOR LOW CONCENTRATION QUALITY CONTROL SERUM (BOVINE
ORIGIN)
CONSTITUENT UNITS DESIRED MEASUREDCONCENTRATION” CONCENTRATION*
AlbuminAlk PhosAmylaseASTBicarbonateBilirubinCalciumCreatinineGlucosePotassiumSodiumTotal proteinUrea
g/l 3 0 3 0U/I 4 0 4 0U/I - -U/I 6 0 6 0
mmol/l 11 1 1µmol/l - -
mmol/l 2,0 2,0µmol/l 7 0 7 0
mmol/l 3,0 2,0 mmol/l 3,2 3,2mmol/l 125 106
g/l 5 1 5 1mmol/l 3,2 3,2
* Or activity
9 Mix gently but thoroughly to ensure that the glucose and sodium chloride dissolve
completely.
10 The total product must now be mixed thoroughly and dispensed into suitable bottles or
vials, capped firmly and stored at 4ºC or at -2OºC.
4 4. Preparation of a high concentration quality control serum
1 Start with 1 litre of fresh bovine (porcine or equine) serum.
2 Carefully mix to ensure homogeneity and freeze at -2OºC. It is important to avoid possible
deterioration of this serum by allowing it to remain at ambient temperature too long. The
remainder of the process must be completed within one working day.
Allow to thaw at room temperature. DO NOT DISTURB OR MIX.
When completely thawed remove 300 ml of the top layer of fluid.
Add 123 ml of ethylene glycol.
Mix very carefully and filter through non absorbent cotton wool to remove any large
aggregates.
Measure the concentration of the analytes in which you are interested and construct a
table identical to Table 4, filling in your own measured concentrations (column 4).

Page 40
Fill in the desired concentrations in column 3 and use that table to calculate the amounts of
analytes to be added as described below.
The concentrations may be similar to the values given in column 4 of Table 4 with the
desired concentrations indicated in column 3. It is anticipated that adjustments will be
required for alkaline phosphatase, amylase, bilirubin, creatinine, glucose and urea. The
adjustments are based on a final volume of 858 ml (ie, 700 ml concentrated serum, 123 ml
ethylene glycol, 30 ml from bilirubin and creatinine adjustments and 5 ml extra ethylene
glycol).
Table 4 - APPROXIMATE DESIRED AND MEASURED CONCENTRATIONS OR ACTIVITIES
FOR HIGH CONCENTRATION QUALITY CONTROL SERUM (BOVINE ORIGIN)
CONSTITUENT UNITS DESIRED MEASUREDCONCENTRATION* CONCENTRATION”
AlbuminAlk PhosAmylaseASTBicarbonateBilirubinCalciumCreatinineGlucosePotassiumSodiumTotal proteinUrea
g/l 4 5 4 5U/I 250 6 0U/I 700 0U/I 9 5 9 5
m mol/l 17 17µmol/l 150 5
m mol/l 3,00 3,00µmol/l 450 110
m mol/l 2 0 3,0mmol/l 6,0mmol/l 159
4,8159
7 6 7 6g/lmmol/l 15 4,8
* Or activity
10 Adjust the concentration of analytes as follows:
(a) Alkaline phosphatase
Amount to be added to 1 litre = desired activity - measured activity;
ie, from the example in Table 4;
250 - 60 = 190 units to be added to 1 litre
volume of high concentration serum is 858 ml (0,858 I)
190 x 0,858 = 163 units
163 units of alkaline phosphatase must be added to the high concentration serum; this
may be added as a powder or a concentrated suspension. See Appendix 1 for details
of the preparation of human placental alkaline phosphatase and Appendix 2 for possible
commercial sources of the enzyme.

Page 41
(b) Amvlase
Amount to be added to 1 litre = desired activity - measured activity;
ie, from the example in Table 4;
700 - 0 = 700 units to be added to 1 litre
volume of high concentration serum is 858 ml (0,858 I)
700 x 0,858 = 601 units
601 units of amylase must be added to the high concentration serum.
Human saliva contains about 1000 units of amyiase/ml, so that 0,6 ml contains 600 units.
Collect about 1 ml of saliva, centrifuge at about 2500 rpm for 10 minutes, then add 0,6 ml
to the high concentration serum. Mix thoroughly. Measure the amylase activity of the
serum at 37°C to confirm that it is approximately 700 U/I.
(c) Bilirubin
Amount to be added to 1 litre =
desired concentration - measured concentration;
ie, from the example in Table 4;
150 - 5 = 145 µmol/l (1 µmol = 0,59 mg)
145 x 0,59 = 85,6 mg to be added to 1 litre
volume of high concentration serum is 858 ml (0,858 I)
85,6 x 0,858 = 73 mg.
Weigh out 73 mg of bilirubin, dissolve in 15 ml of 0,1 mol/l sodium hydroxide to produce a
clear red solution; when the bilirubin has completely dissolved, add the solution, with
constant stirring, to the high concentration serum. The procedure should not be carried out
in a brightly lit place and, after adding the bilirubin to the control serum, it must be
protected from light to avoid destruction of the bilirubin. Mix thoroughly.
(d) Creatinine
Amount to be added to 1 litre =
desired concentration - measured concentration;
ie, from the example in Table 4;
450 - 110 = 340 µmol/l (1 µmol = 0,113 mg)
340 x 0,113 = 38 mg to be added to 1 litre
volume of high concentration serum is 858 ml (0,858 I)
38 x 0,858 = 33 mg.
Weigh out 33 mg of creatinine, dissolve in 15 ml of 0,1 mol/l hydrochloric acid and when
completely dissolved add the solution to the high concentration serum. Mix thoroughly.

Page 42
(e) Glucose
Amount to be added to 1 litre =
desired concentration - measured concentration;
ie, from the example in Table 4;
20 - 3 = 17 mmol/l (1 mmol = 180 mg)
17 x 180 = 3,06 g to be added to 1 litre
volume of high concentration serum is 858 ml (0,858 I)
3,06 x 0,858 = 2,63 g.
Weigh out 2,63 g of glucose, add it to the high concentration serum, mix gently to dissolve.
Mix thoroughly.
(f) Urea
Amount to be added to 1 litre =
desired concentration - measured concentration;
ie, from the example in Table 4;
15 - 4,8 = 10,2 mmol/l (1 mmol = 60 mg)
10,2 x 60 = 612 mg to be added to 1 litre
volume of high concentration serum is 858 ml (0,858 I)
612 x 0,858 = 525 mg.
Weigh out 525 mg of urea, add it to the high concentration serum, mix gently to dissolve.
Mix thoroughly.
(g) Final adiustment of ethvlene glvcol concentration
The final concentration of ethylene glycol must be 15%. It is therefore necessary to add a
further 5,O ml ethylene glycol because the total volume has been increased by 30 ml
through the addition of the bilirubin and creatinine solutions. Mix very thoroughly.
1 1 The total product must now be mixed thoroughly and dispensed into suitable clean, dry, amber-
coloured bottles or vials, capped firmly and stored at 4°C or at -20°C. If amber-coloured containers
are not available, then the serum must be protected from light to avoid destruction of the bilirubin.
GENERAL NOTES
We recommend that when possible clean and aseptic techniques should be used to reduce the
possibilities of contamination.
Prior to analysis the serum should be allowed to rise to ambient temperature, and mixed carefully.
It should be kept in the dark to avoid destruction of the bilirubin.
Serum preserved with ethylene glycol may not be suitable for methods employing dialysis.
Page 43
APPENDIX 1
PREPARATION OF ENZYME CONCENTRATES’
This section gives a detailed description of the preparation of a number of enzyme concentrates from tissue
sources which can be used to fortify batches of control serum.
(i) ALKALINE PHOSPHATASE, ALP (EC 3.1.3.1)
ALP is prepared from human placenta using a method based on the extraction procedure of Morton
(1950). The placenta is homogenised using 2 ml water per g tissue, then n-butanol is added 1 ml per g
tissue and stirred for about one hour. After centrifugation the aqueous layer is fractionated with acetone at
4ºC, the precipitate formed between 33% and 50% (v/v) acetone is retained, dissolved in 0,01 mol/l tris-HCI
buffer, pH 7,7 and dialysed overnight against the same buffer. The average yield is 52 units per g tissue
and the ALP:AST ratio is greater than 57:1 and ALT activity is undetectable.
This enzyme and all other enzyme preparations described below are distributed in small vials and
stored at -20°C until required. The activity of each is measured by the difference before and after addition
using a suitable dilution in serum.
(ii) ALANINE AMINOTRANSFERASE, ALT (EC 2.6.2.2)
ALT is prepared from human liver using a procedure based on the method published by Owen et al
(1974) for the extraction of ALT from dolphin muscle. Human liver, classified as normal by the pathologist,
is homogenised in 0,05 mol/l tris-HCI buffer, pH 7,0 containing 10 mmol/l 2-mercaptoethanol and
10 mmol/l EDTA, 3 ml buffer being used per g of tissue. After centrifugation, the supernatant is placed in a
water-bath at 60°C, brought to 52ºC, then rapidly cooled in an ice-bath. The heat treated sample is
fractionated with ammonium sulfate at 4°C. The precipitate formed when a further 16 g ammonium sulfate
per 100 ml are added contains most of the ALT activity and should be separated, dissolved in and dialysed
overnight against 0,015 mmol/l tris-HCI buffer, pH 7,25, containing 2 mmol/l EDTA and 10 mmol/l 2-
mercaptoethanol. The supernatant from this latter step is retained for AST preparation. The average yield
is 14 units per g tissue and the ALT:AST ratio 4,5:1. The ALP activity in this preparation is negligible.
Ox, pig and horse livers do not yield satisfactory ALT preparations, the ratio of AST:ALT activity in
the initial extract being very much greater, about 10:1 compared with 2:l in human liver.
(iii) ASPARTATE AMINOTRANSFERASE, AST (EC 2.6.1 .1)
AST may also be extracted from human liver by the above procedure. A further 14 g ammonium
sulphate per 100 ml are added to the supernatant from the ALT preparation. The precipitate formed
contains most of the AST activity. The precipitate is dissolved in and dialysed against 0,015 mol/l tris
buffer, to remove ammonium sulfate and is then suitable for addition to quality control material. The
average yield is 25 units per g tissue and the AST:ALT ratio 25:1.
1 Reprinted from Practical Guidelines for the Preparation of Quality Control Sera for Use in Clinical
Chemistry by A P Kenny & R H Eaton, WHO document LAB/81.4.
Page 44
APPENDIX 2
SOME POSSIBLE COMMERCIAL SOURCES OF ENZYMES
ALKALINE PHOSPHATASE
Sigma Chemical Company
Catalogue number P5521
BDH Chemical s Limited
Catalogue number 39035
Merck
Catalogue number 1607L
AST
Sigma Chemical Company
Catalogue number G2751
AMYLASE
Sigma Chemical Company
Catalogue number
BDH Chemicals Limited
Catalogue number
Merck
Catalogue number
Al 031
39118
1329
The products satisfactorily used for the evaluation of this procedure were from Sigma Chemical
Company listed above.

Page 45
ACKNOWLEDGEMENTS
The authors would like to express their appreciation to Miss L Morris, Mr D Bullock and
Mr I Surplice of the WHO Collaborating Centre for Research and Reference Services in Clinical Chemistry,
Birmingham, UK for their invaluable work, and to Dr R H Eaton, Biochemistry Department, Victoria
Infirmary, Glasgow, UK for her kind cooperation in the preparation of this document. They would also like
to extend their appreciation to Dr P Premachandra, Medical Research Institute, Colombo, Sri Lanka,
Dr H Mehta, Department of Medical Education, Rohtak, Chandigarh, India, and Dr T Nath, Biochemistry
Department, GB Plant Hospital, New Delhi, India, who carried out a substantial amount of work for testing
the methods and materials described in this document.