Embed Size (px)
Citation preview
K. V. Lakshmi
Department of Chemistry and Chemical Biology
Rensselaer Polytechnic Institute
Troy, NY 12180
Fundamentals and Applications of Electron
Paramagnetic Resonance Spectroscopy
Second Penn State Bioinorganic Chemistry Workshop
May 31-June 9, 2012
• Magnetic moments of nuclei No mixing of nuclear wave functions Very weak interactions Very small magnetic moments • Consequences: All nuclei of a particular type resonate at
about the same frequency • Nuclear wave functions do not overlap
• All nuclear wave functions can be treated equivalently
NMR Spectroscopy

• Magnetic moments of unpaired electrons • Unpaired electrons are usually the valence electrons • Greatly affected by bonding
• Electronic wave functions do overlap
• Treat different cases separately
EPR Spectroscopy
Outline
• Single unpaired electron (the Zeeman interaction)
• Single electron spin plus nuclear spins (hyperfine interactions)
• Two or more electron spins (spin-spin interactions)
• Single electron spin with spin orbit coupling • Half-integer high spin systems
• Applications

References:
Carrington and McLachlan (1967) “Introduction to Magnetic Resonance” Abragam and Bleaney (1970) “Electron Paramagnetic Resonance of Transition Ions” Pilbrow (1990) “Transition Ion Electron Paramagnetic Resonance” Poole (1983) “Electron Spin Resonance: A Comprehensive Treatise on Experimental Techniques”

The Zeeman Interaction

EPR Line Shapes
g
• Detection is limited by noise components • Phase-sensitive amplitude detection • Small amplitude sinusoidal field is modulated during a scan • Detects signals that change amplitude as the field changes • Allows for amplification using AC techniques • Results in derivative line shapes • Enhanced sensitivity, improved signal-to-noise level and resolution
• It is an inherent property of an unpaired spin
• Similar to the chemical shift in NMR
• Measures how far the magnetic environment of the spin differs from a free gas-phase electron
• The g value for a single unpaired electron is: ge = 2.002
• The g value for an S = 1/2 system is usually near ge (with exceptions)
What is g?!

Sensitivity
• EPR detects net absorption • Absorption is proportional to the number of spins in the lower
energy level • Emission is proportional to the number of spins in the upper
energy level • Net Absorption depends on N– and N+
• Ratio of populations at equilibrium is given by the Boltzmann distribution
• EPR sensitivity increases with decreasing temperature and increasing magnetic field strength
N-/N+ = e geb
eH/kT
Saturation
• AT RT, the energy levels are nearly equally populated • Intense radiation will tend to equalize the population of spins • Leads to a decrease in net absorption • Effect is called "saturation” • Spin system returns to thermal equilibrium via energy transfer
to surroundings • Known as spin-lattice relaxation with time constant, T1 • Spins with a long T1 are easily saturated • Spins with shorter T1 are more difficult to saturate • Spin-orbit coupling provides an important energy transfer
mechanism

mS=1/2
mS=-1/2
I=1/2 S=1/2 B
Electron
Nucleus
Hyperfine Interaction Between an Electron and Nucleus

Hyperfine Interaction Between an Electron and Nucleus
• Isotropic component provides information on chemical bonding
• Dipolar component provides information about location of the
nucleus
Electron
Nucleus r
Y(r)
Aiso ~ [Y(r)]2
Electron
Nucleus
r
Q
T~ (1-3cos2q)/r3
Through-space dipolar interaction
B
Isotropic contact interaction

Spin-spin Interactions
• Isotropic exchange interaction requires overlap of the electron wave
functions. J is very small for inter-spin distances > ~ 1 nm
• Dipolar interaction depends on inter-spin distance and angle of the inter-
spin vector with external magnetic field
S1
Y1(r)
Hex ~ JS1S2
r
Q
D ~ (1-3cos2q)/r3
Through-space dipolar interaction
B
Exchange interaction
Y2(r)
S1
S2
S2

Spin Orbit Couplings
• The coupling between the electron spin and the orbital
angular momentum • In the reference frame of the electron, the nucleus is moving
charge that generates a magnetic field • The magnetic field interacts with the spin magnetic moment • These are relativistic effects • Effects are small for organic radicals • The heavier atoms (e.g. transition metals) have spin orbit
couplings much larger than the Zeeman interaction • This leads to significant g anisotropy • Spin-orbit coupling provides an important energy transfer
mechanism
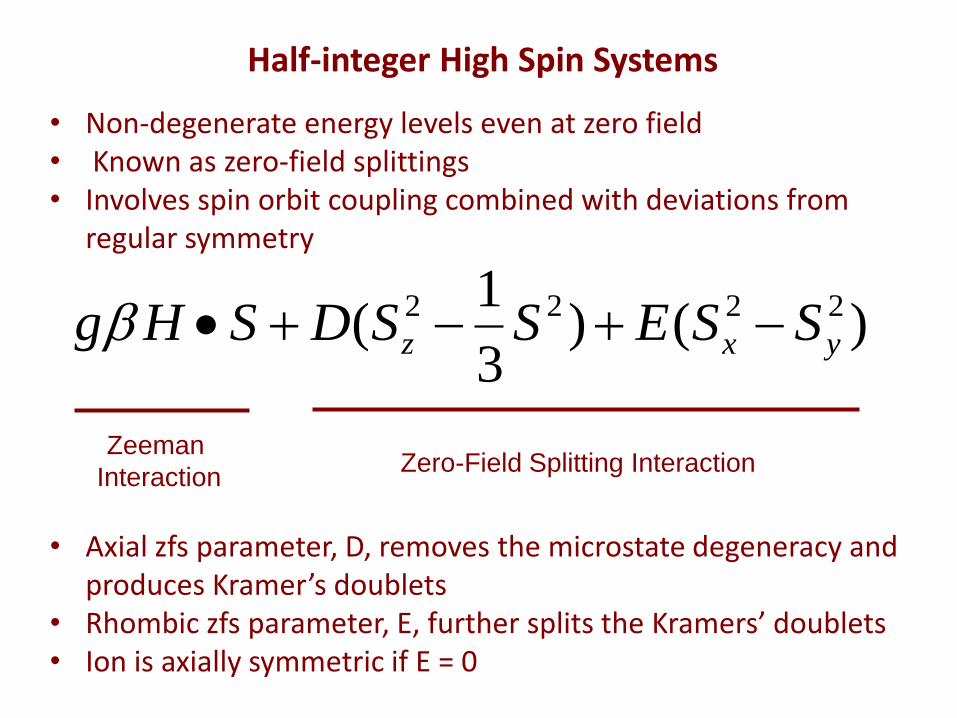
Half-integer High Spin Systems • Non-degenerate energy levels even at zero field • Known as zero-field splittings • Involves spin orbit coupling combined with deviations from
regular symmetry
2 2 2 21( ) ( )
3z x yg H S D S S E S Sb
Zeeman
Interaction Zero-Field Splitting Interaction
• Axial zfs parameter, D, removes the microstate degeneracy and produces Kramer’s doublets
• Rhombic zfs parameter, E, further splits the Kramers’ doublets • Ion is axially symmetric if E = 0
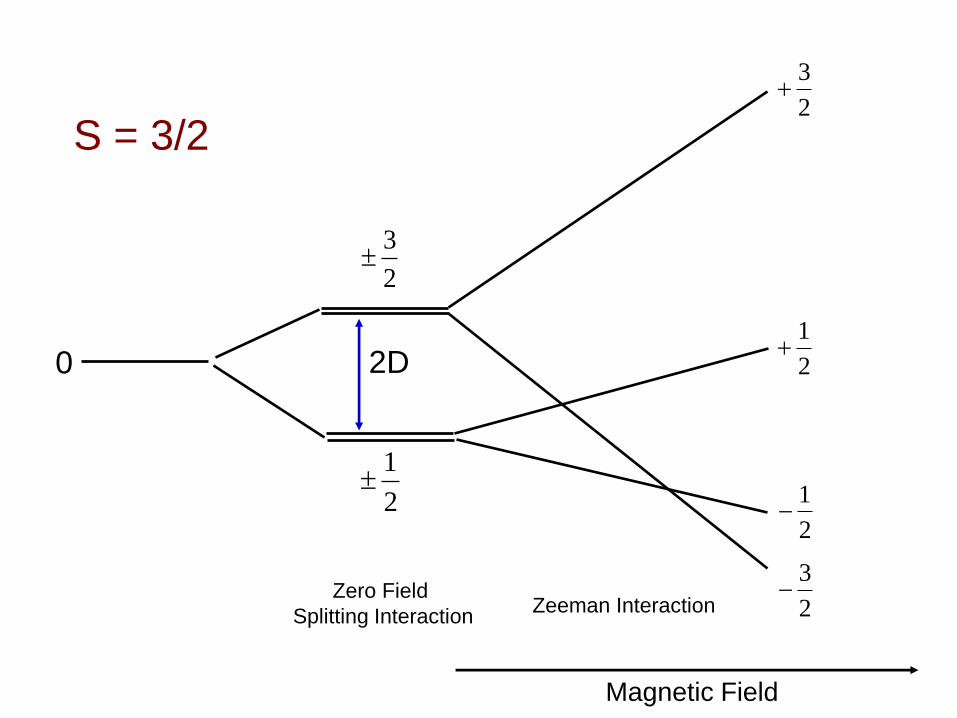
S = 3/2
0 2D
Zero Field
Splitting Interaction Zeeman Interaction
3
2
3
2
1
2
1
2
Magnetic Field
1
2
3
2

S = 5/2
0 4D
Zero Field
Splitting Interaction Zeeman Interaction
5
2
1
2
5
2
5
2
1
2
1
2
Magnetic Field
3
2
3
2
3
2
2D
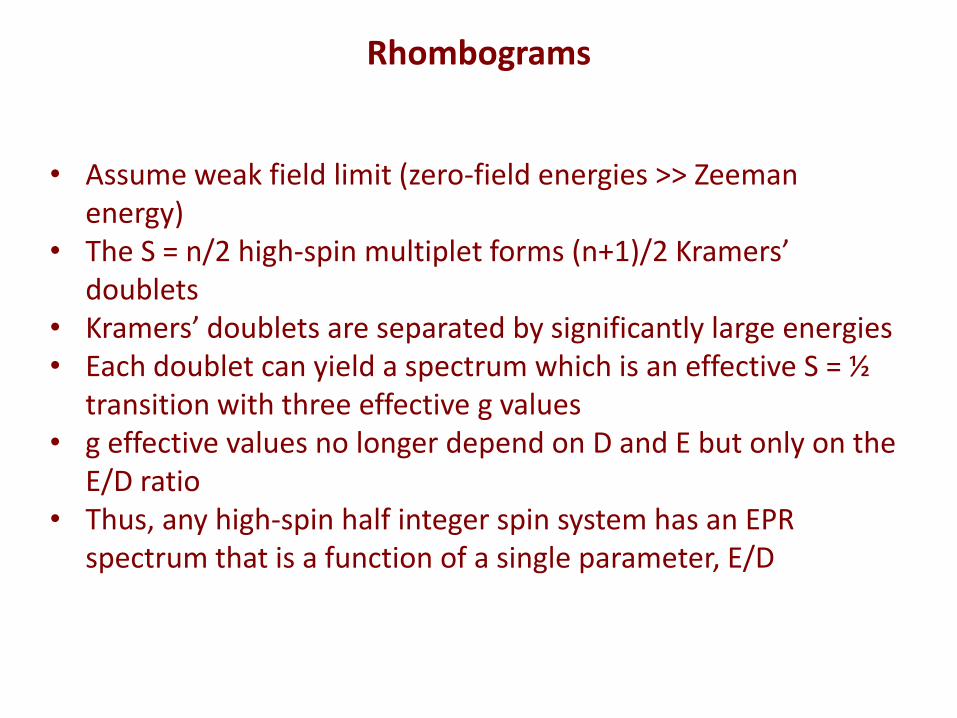
Rhombograms
• Assume weak field limit (zero-field energies >> Zeeman
energy) • The S = n/2 high-spin multiplet forms (n+1)/2 Kramers’
doublets • Kramers’ doublets are separated by significantly large energies • Each doublet can yield a spectrum which is an effective S = ½
transition with three effective g values • g effective values no longer depend on D and E but only on the
E/D ratio • Thus, any high-spin half integer spin system has an EPR
spectrum that is a function of a single parameter, E/D
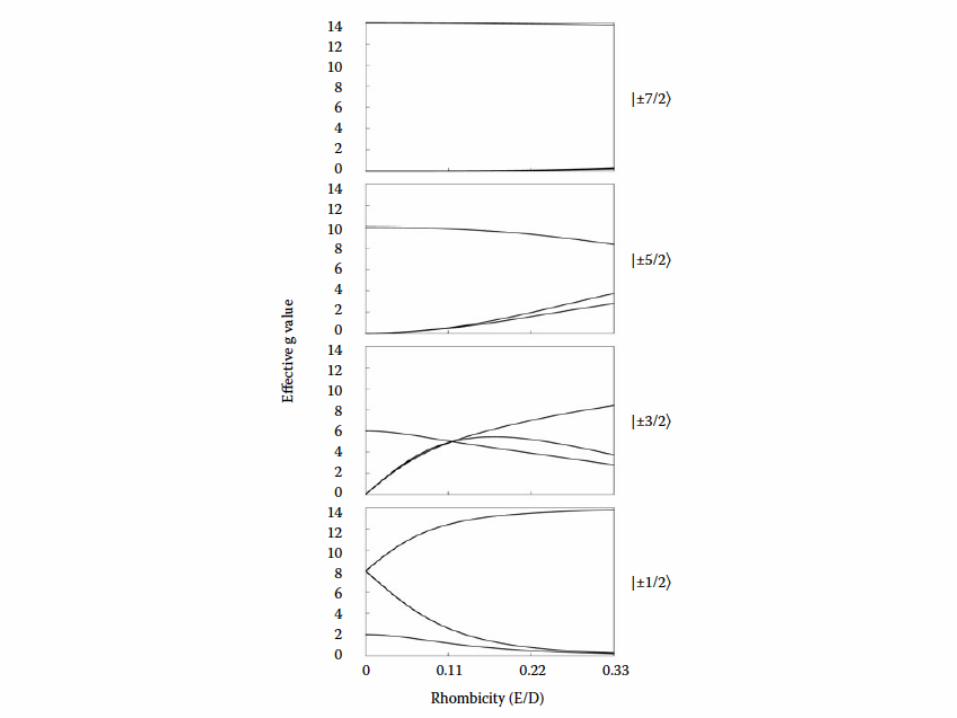

Reading of Rhombograms
• All possible g values for a subspectrum from a Kramers’
doublet are represented by three curves • Spectral analysis means moving horizontally and matching the
g effective values • A given rhombicity should reproduce the experimentally
observed g values • The g effective values can then be reproduced by numerical
simulations • Note that not all transitions are observed in the experimental
system

3305 3306 3307 3308 3309
Magnetic field (Gauss)
High-Frequency EPR Spectroscopy
12460 12480 12500
Magnetic field (Gauss)
46360 46400 46440
Magnetic field (Gauss)
X-band
9.28 GHz
Q-band
35.5 GHz
D-band
130 GHz
• Enhanced resolution
• Increased sensitivity
• Smaller spin concentrations
Simulated semiquinone EPR signals
gX
gY
gZ
gX
gY
gZ

Bruker 95 GHz 3T Spectrometer
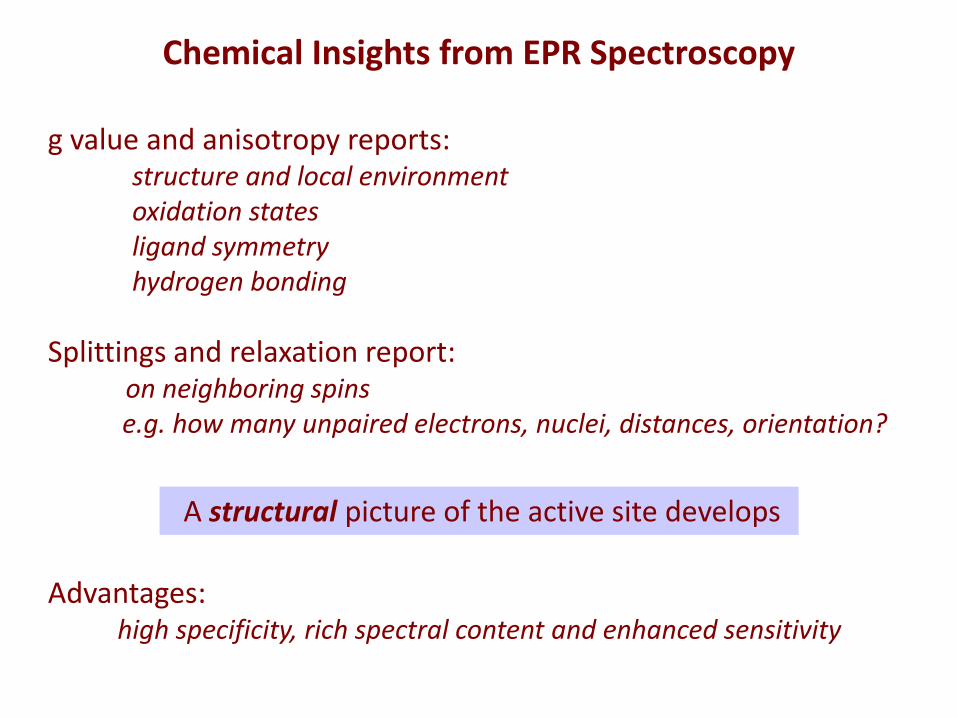
g value and anisotropy reports: structure and local environment oxidation states ligand symmetry hydrogen bonding
Advantages: high specificity, rich spectral content and enhanced sensitivity
Splittings and relaxation report: on neighboring spins e.g. how many unpaired electrons, nuclei, distances, orientation?
A structural picture of the active site develops
Chemical Insights from EPR Spectroscopy

Spectrometer Arrangement
I. Microwave System 1. Source 2. Components to direct microwaves to and from the
resonant cavity 3. Resonant cavity 4. Detector 5. Amplifier 6. Computer
II. Field Modulation System III. Magnet System: Electromagnet to provide a stable, linearly variable, homogeneous magnetic field

Schematic of an EPR Spectrometer
Source Circulator Detector
electromagnet Modulation coils Resonator (cavity)
http://www.acert.cornell.edu

X-Band 9 GHz EPR Spectrometer

Applications of EPR Spectroscopy
• Interstitial hydrogen atoms in metal oxides • Tyrosyl radicals in photosystem II and RNR • Manganese monomers, dimers and tetramers • Interaction spectra of photosystem II • Heme centers in cytochromes • Iron sulfur centers in photosystem I • Interaction spectra of photosystem I • High-spin iron centers in transferrins • Copper (II) centers • Progressive power saturation

Interstitial Hydrogen Atoms in Metal Oxides: Indium Oxide Nanotubes
Kumar, Chatterjee, Milikisiyants, Lakshmi, Mehta, Singh and Singh (2009) Appl. Phys. Lett., 95, 13102.
~ 45 G ~ 45 G

Tyrosyl Radicals of Photosystem II (PSII)
Stromal Surface
Lumenal Surface
O2 + 4H++ 4e- 2H2O
Q
QH2
Ferreira, Iverson, Maghlaoui, Barber and Iwata (2004) Science, 303, 1831. Umena, Kawakami, Shen and Kamiya (2011) Nature, 473, 55.
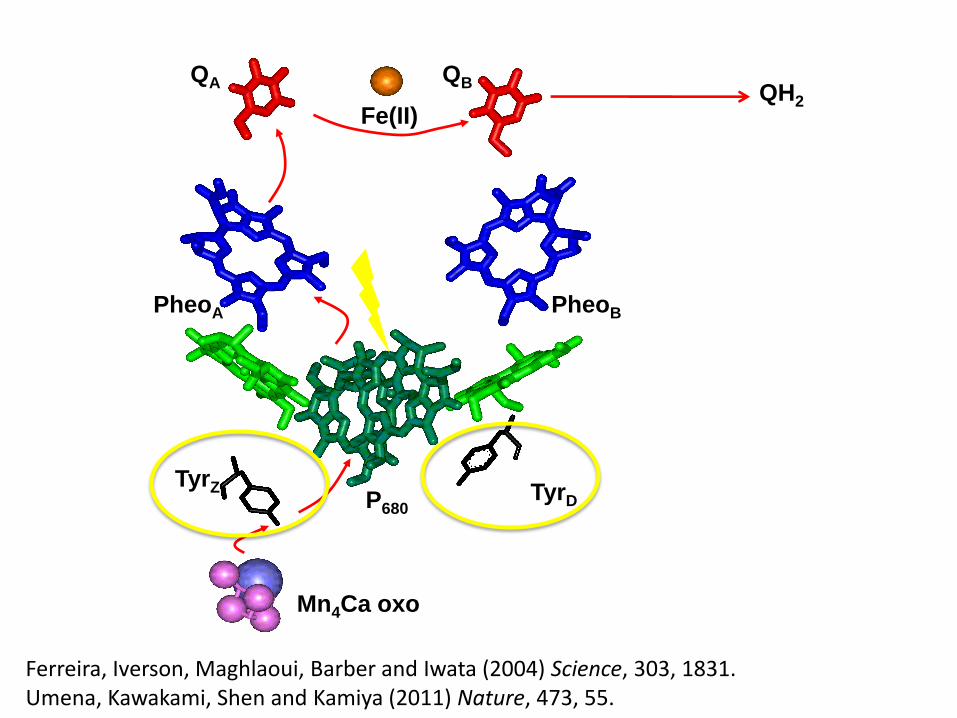
Mn4Ca oxo
TyrZ
PheoA PheoB
QA QB
TyrD P680
Fe(II) QH2
Ferreira, Iverson, Maghlaoui, Barber and Iwata (2004) Science, 303, 1831. Umena, Kawakami, Shen and Kamiya (2011) Nature, 473, 55.

3400 3440 3480
Magnetic Field (G)
EPR Spectrum of Tyrosine D
Hoganson and Babcock (1992) Biochemistry, 31, 11874.

Tyrosyl Radicals of Ribonucleotide Reductase (RNR)
Norlund and Eklund (1994) J. Mol. Biol., 232, 123.
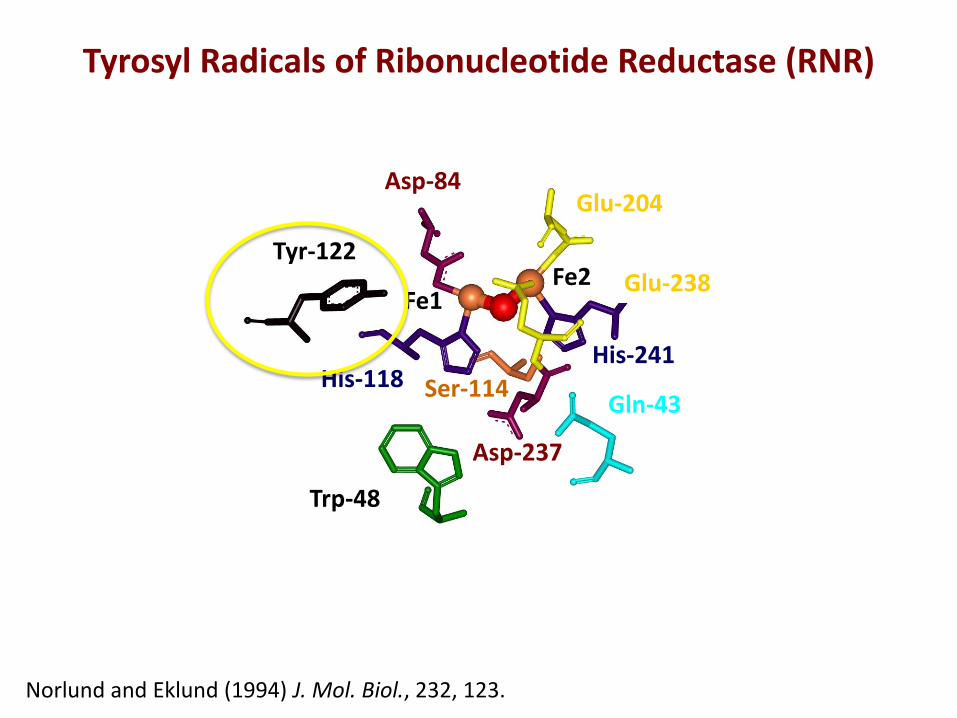
Tyrosyl Radicals of Ribonucleotide Reductase (RNR)
Trp-48
Gln-43
Tyr-122
Asp-84 Glu-204
Glu-238
His-241
Asp-237
His-118 Ser-114
Fe1 Fe2
Norlund and Eklund (1994) J. Mol. Biol., 232, 123.

Tyrosyl Radicals of Ribonucleotide Reductase
3300 3350 3400 3450
Magnetic Field (G) Courtesy Prof. Carsten Krebs
Bender et al. (1989) J. Am. Chem. Soc., 111, 8076.

• Tyrosyl line shapes are very sensitive to the relative orientation of the b-methylene protons
pZ

High-frequency D-band (130 GHz) EPR Spectroscopy of Tyrosyl Radicals
46300 46350 46400 46450
Field (Gauss)
125 G
30 G
gx
gz
gy
YD• at X-band (9 GHz)
YD• at D-band (130 GHz)
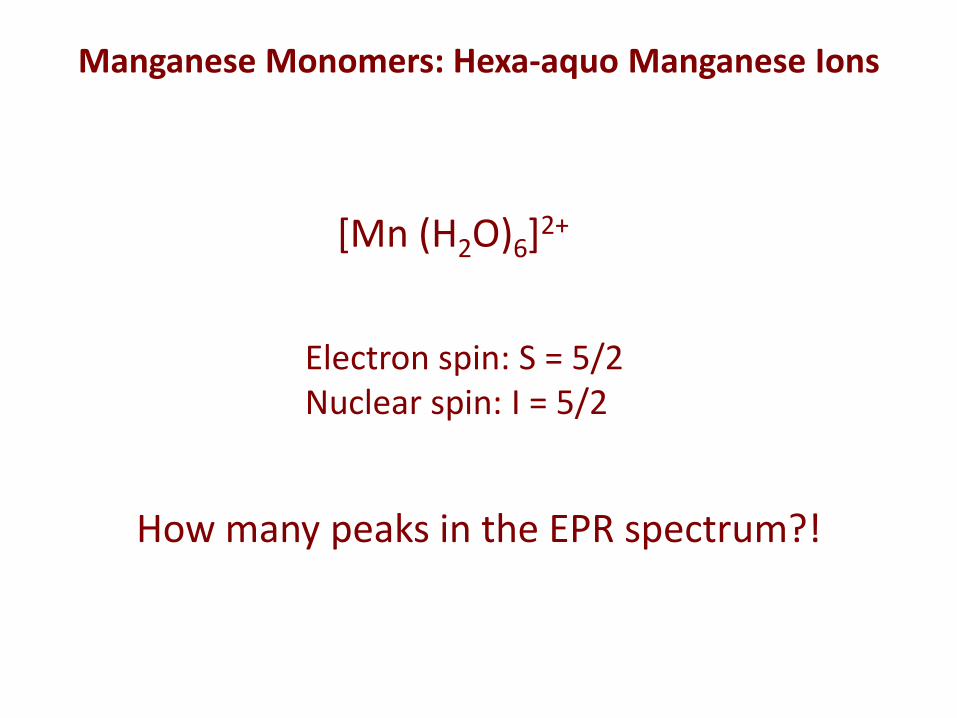
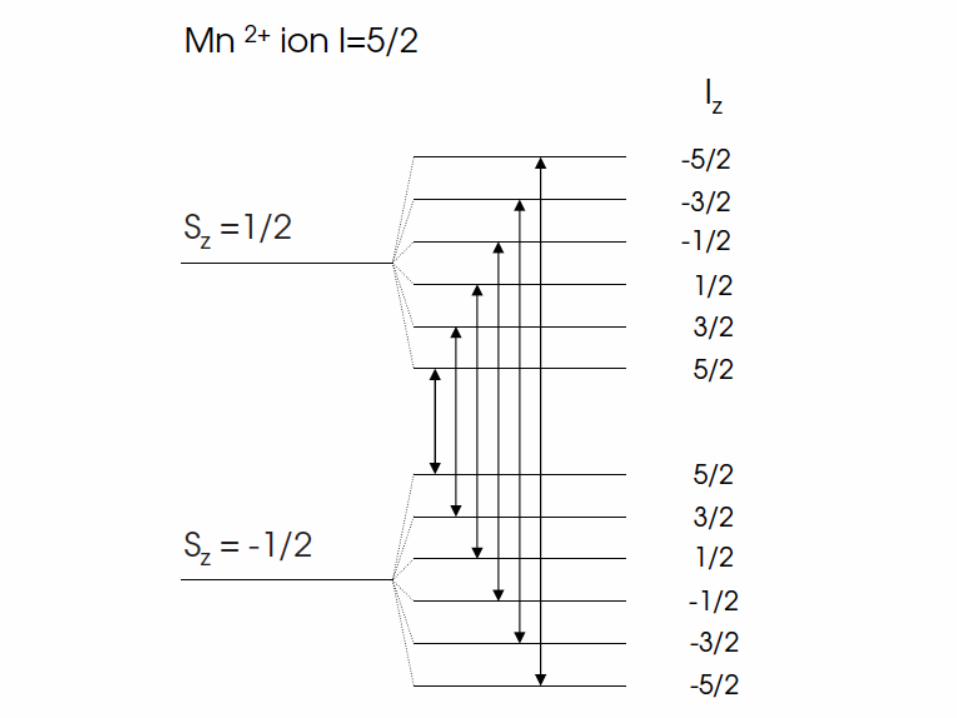
Manganese Monomers: Hexa-aquo Manganese Ions
How many peaks in the EPR spectrum?!
[Mn (H2O)6]2+
Electron spin: S = 5/2 Nuclear spin: I = 5/2
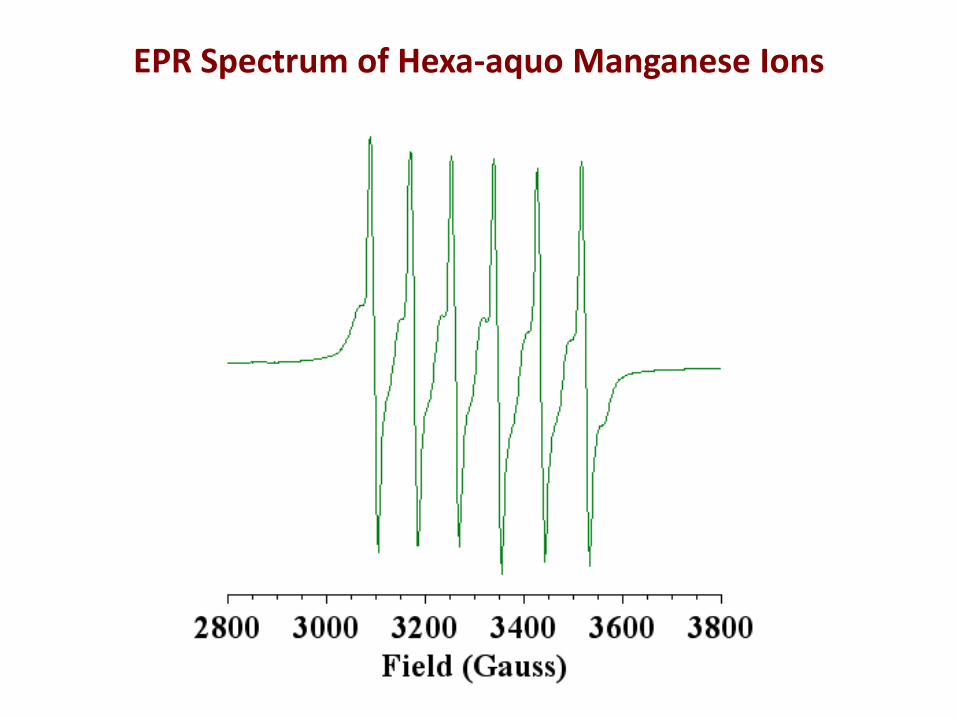
EPR Spectrum of Hexa-aquo Manganese Ions

Manganese Dimers: Dimanganese ‘di-m’ Oxo Complexes
[H2O(terpy)MnIII(m-O)2MnIV(terpy)OH2](NO3)3 [(bpy)2MnIII(m-O)2MnIV(bpy)2](NO3)3
Cooper and Calvin (1977) J. Am. Chem. Soc., 99, 6623. Limburg, Vrettos, Liable-Sands, Rheingold, Crabtree and Brudvig (1999) Science, 283, 1524.
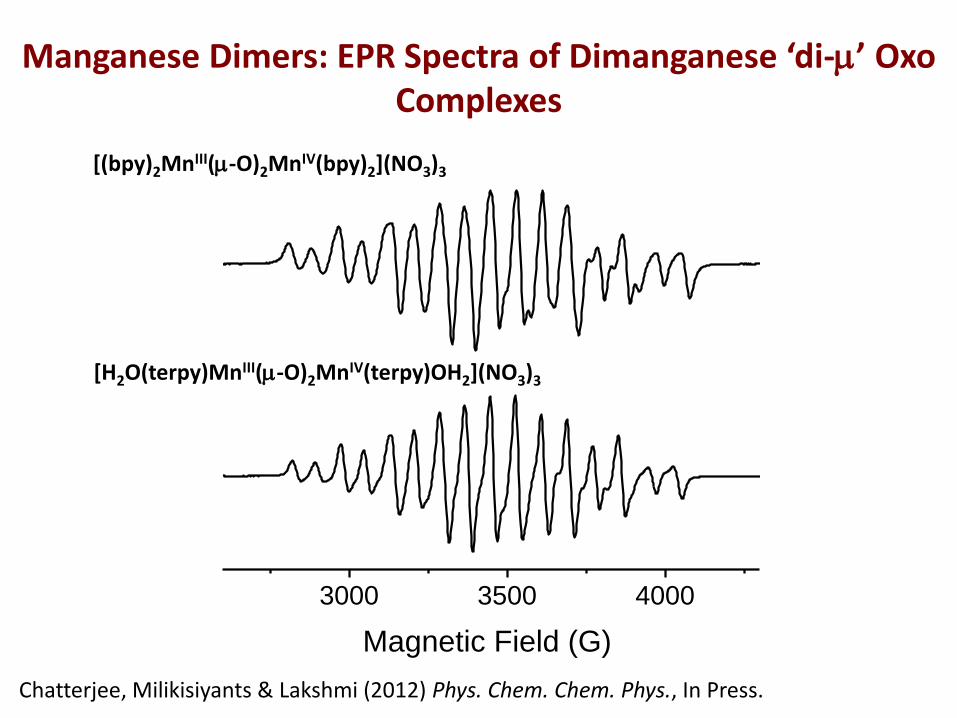
Manganese Dimers: EPR Spectra of Dimanganese ‘di-m’ Oxo Complexes
3000 3500 4000
Magnetic Field (G)
[(bpy)2MnIII(m-O)2MnIV(bpy)2](NO3)3
[H2O(terpy)MnIII(m-O)2MnIV(terpy)OH2](NO3)3
Chatterjee, Milikisiyants & Lakshmi (2012) Phys. Chem. Chem. Phys., In Press.

S-state cycle
S0 S1
S3
S2 S4
O2
2H2O
H+
2H+
H+
e-
e- e-
e-
hν
hν hν
hν
The Oxygen-Evolving Complex of Photosystem II
Umena, Kawakami, Shen and Kamiya (2011) Nature, 473, 55.
Kok, Forbush and McGloin (1970) Photochem. Photobiol., 11, 457.

Manganese Tetramers: The S2 State of Photosystem II
hnhnhnhnS4S3S2S1S0
2H2OO2 + 4H+
Dark State
Dark spectrum of PSII
Light spectrum of PSII
Light - dark difference spectrum
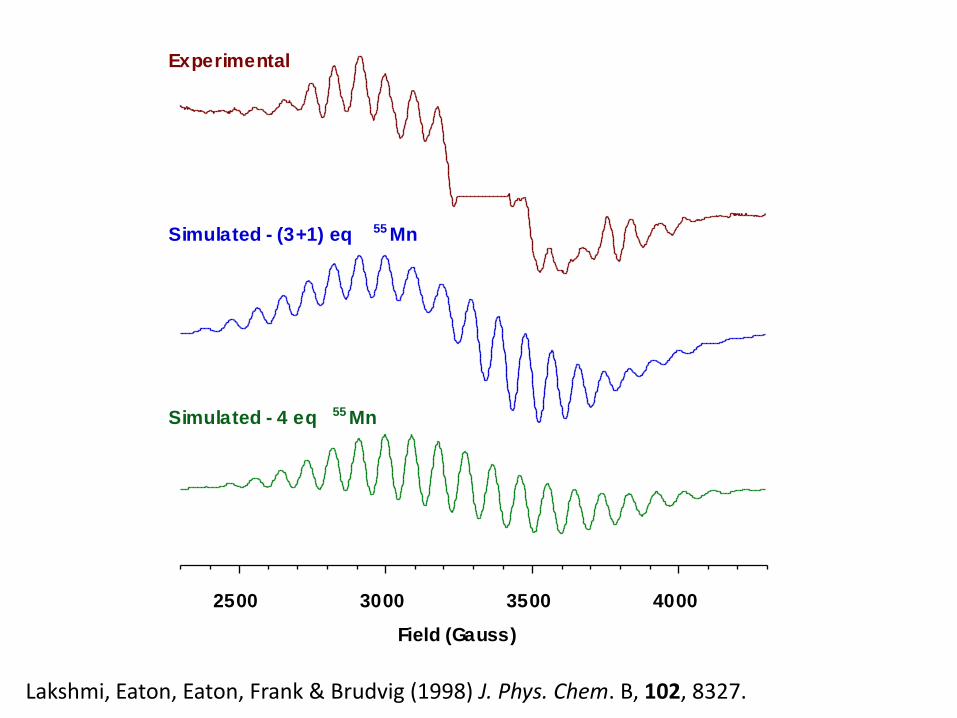
Why so many lines?!
S2 state of PS II S = 1/2

PS II: [Mn4]
S = ½ I = 5/2 * 4
2500 3000 3500 4000
Field (Gauss)
Experimental
Simulated - 4 eq 55 Mn
Simulated - (3+1) eq 55 Mn
Lakshmi, Eaton, Eaton, Frank & Brudvig (1998) J. Phys. Chem. B, 102, 8327.
2500 3000 3500 4000
Field (Gauss)
Experimental
Simulated - 4 eq 55 Mn
Simulated - (3+1) eq 55 Mn
Lakshmi, Eaton, Eaton, Frank & Brudvig (1998) J. Phys. Chem. B, 102, 8327.
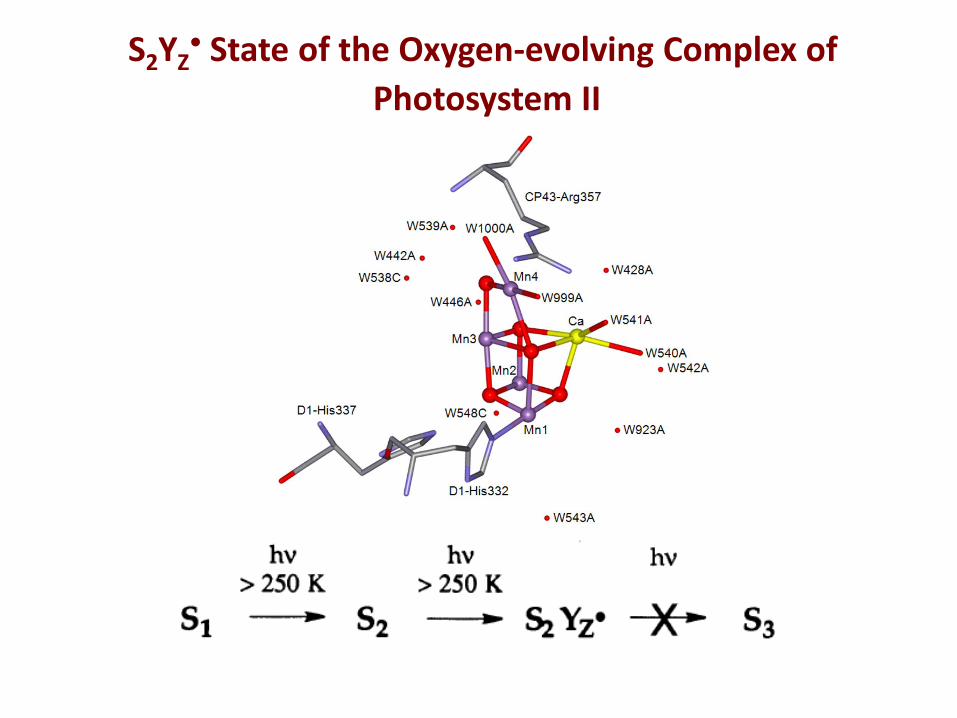
S2YZ• State of the Oxygen-evolving Complex of
Photosystem II
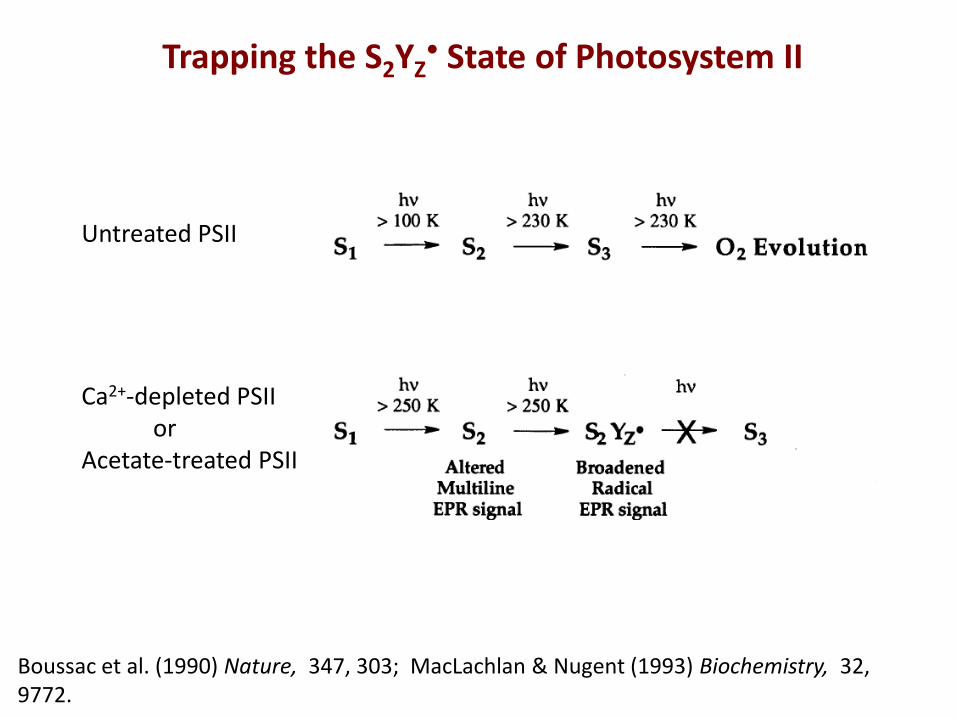
Trapping the S2YZ• State of Photosystem II
Boussac et al. (1990) Nature, 347, 303; MacLachlan & Nugent (1993) Biochemistry, 32, 9772.
Untreated PSII
Ca2+-depleted PSII or Acetate-treated PSII

S2YZ• EPR Spectrum from Acetate-Inhibited Photosystem II
Szalai, Kühne, Lakshmi & Brudvig (1998) Biochemistry, 37, 13594; Tang et al. (1996) J. Am. Chem. Soc., 118, 7638; van Vliet et al. (1994) Biochemistry, 33, 12998.

Experimental and Simulated S2YZ• EPR Spectra
Lakshmi, Eaton, Eaton, Frank & Brudvig (1998) J. Phys. Chem. B, 102, 8327.
R = 7.7 ± 0.3 Å; J = - 0.028 cm-1

Lakshmi, Eaton, Eaton, Frank & Brudvig (1998) J. Phys. Chem. B, 102, 8327.

Szalai, Kühne, Lakshmi & Brudvig (1998) Biochemistry, 37, 13594.
Comparison of S2, S2YZ• and S2YZ-NO EPR Spectra
S2
S2YZ•
S2
S2YZ-NO

Szalai, Kühne, Lakshmi & Brudvig (1998) Biochemistry, 37, 13594.
Temperature Dependence of the S2YZ• EPR Spectra

Szalai, Kühne, Lakshmi & Brudvig (1998) Biochemistry, 37, 13594.
Temperature Dependence of the S2YZ• EPR Spectra
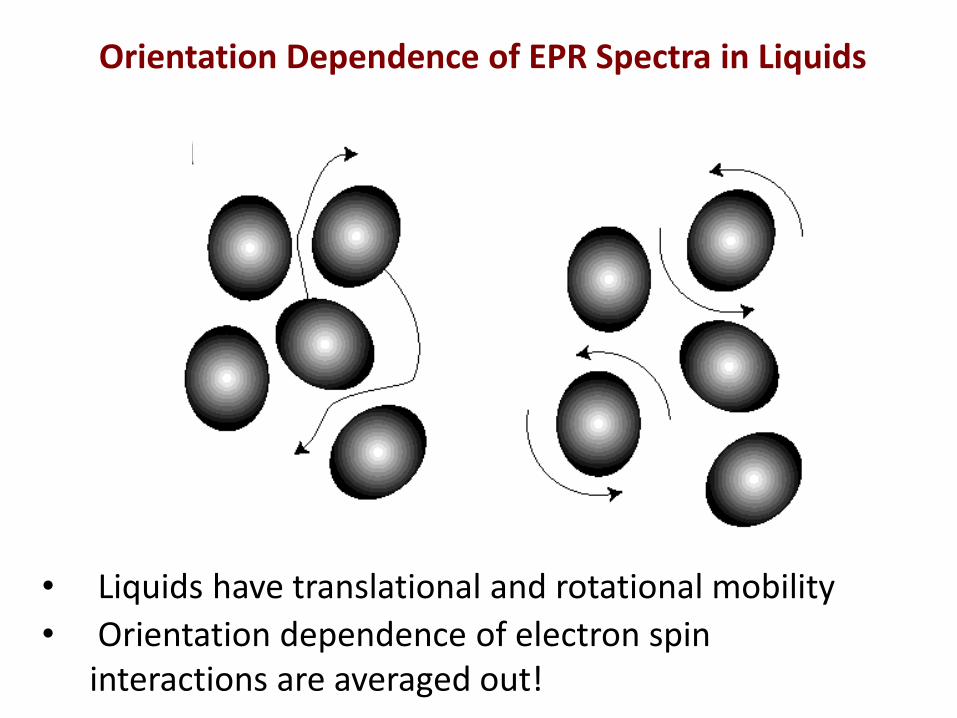
• Liquids have translational and rotational mobility
• Orientation dependence of electron spin interactions are averaged out!
Orientation Dependence of EPR Spectra in Liquids
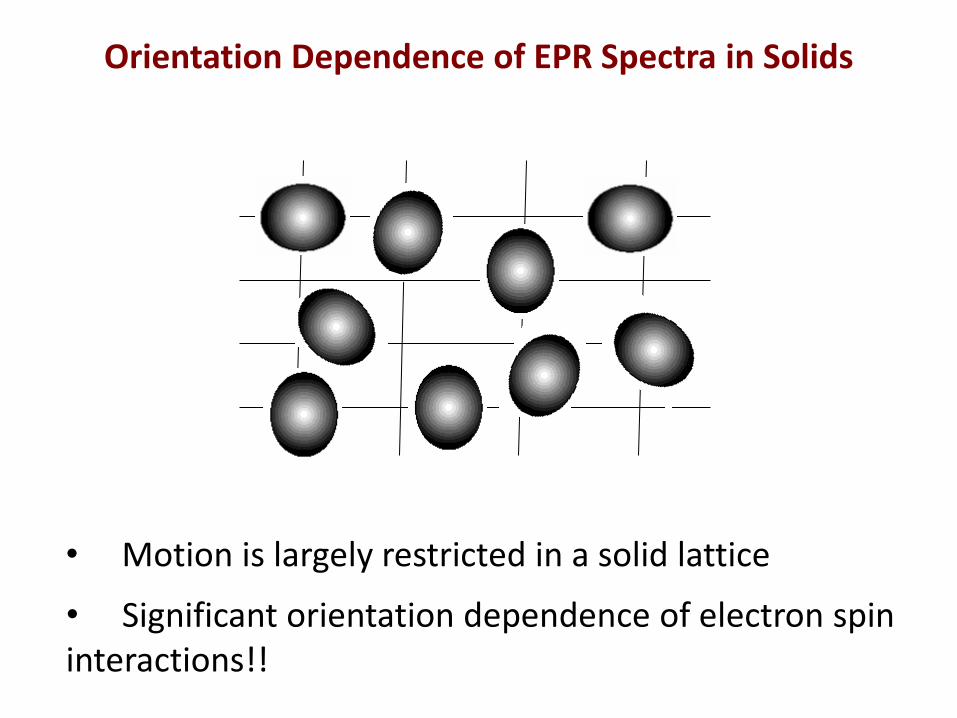
Orientation Dependence of EPR Spectra in Solids
• Motion is largely restricted in a solid lattice
• Significant orientation dependence of electron spin interactions!!

90° 0°
H0 r
H0 H0
r r q
w (q)
w (q) ~ 1/2 (3 Cos2 q 1)
Orientation Dependence of Electron-Electron Couplings in Solids
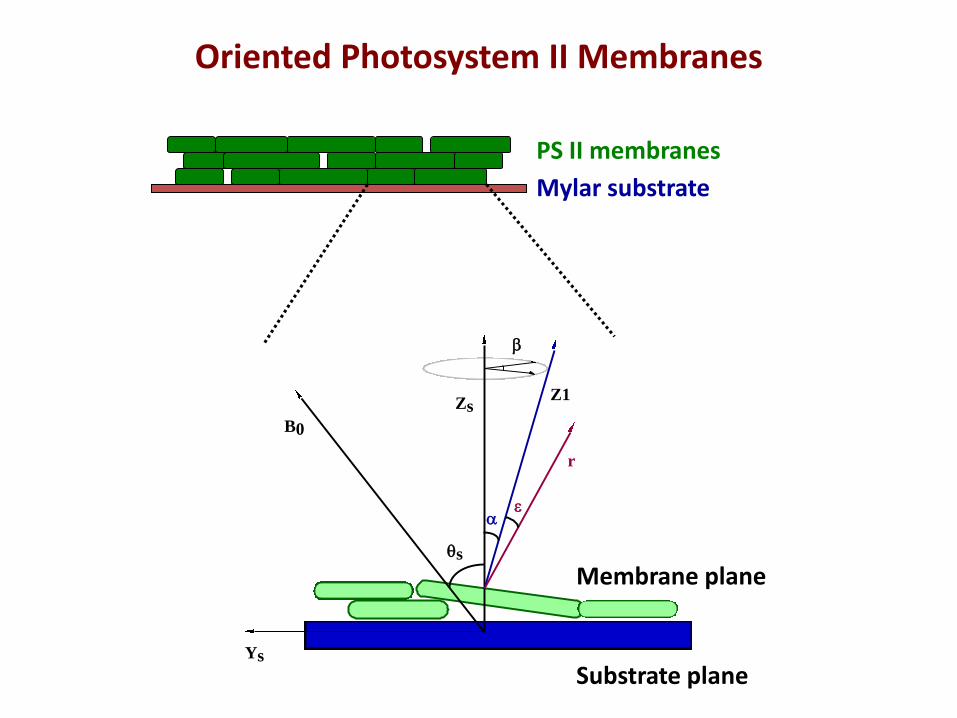
substrate plane
membrane plane
ZsZ1
B0
b
qs
r
Ys
Mylar substrate
PS II membranes
Oriented Photosystem II Membranes
Membrane plane
Substrate plane

Orientation Dependence of the EPR Spectrum of Tyrosine D in Photosystem II
Lakshmi, Eaton, Eaton & Brudvig (1999) Biochemistry, 38, 12758.
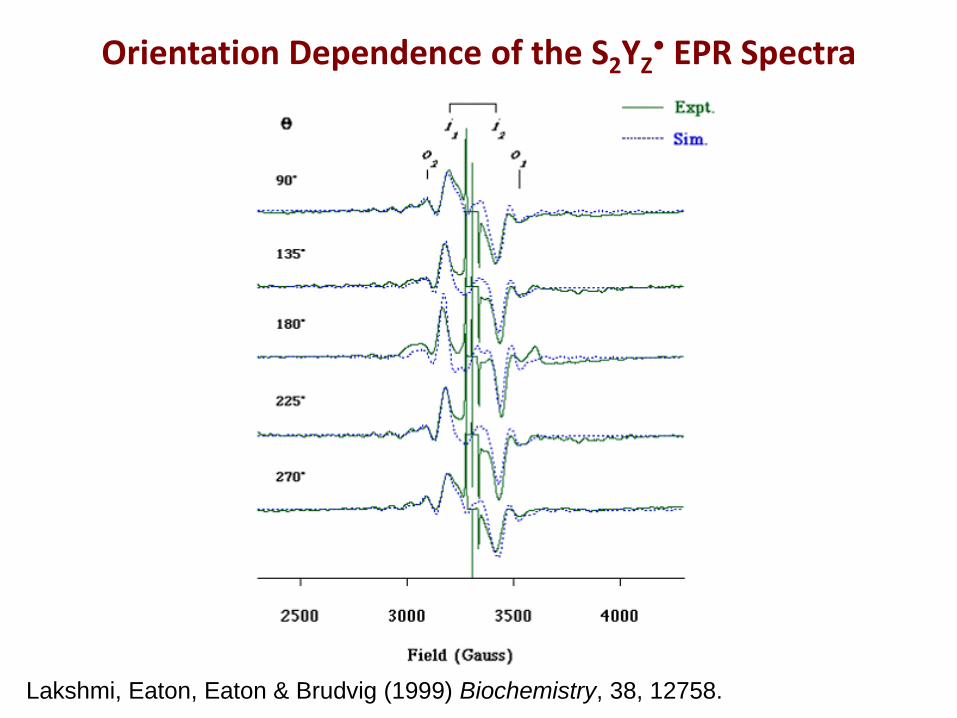
Orientation Dependence of the S2YZ• EPR Spectra
Lakshmi, Eaton, Eaton & Brudvig (1999) Biochemistry, 38, 12758.

Orientation Dependence of S2YZ• EPR Signals
Lakshmi, Eaton, Eaton & Brudvig (1999) Biochemistry, 38, 12758.
3160
3180
3200
3220
3240
50 100 150 200 250 300
Pea
k i
1 p
osi
tion
(G
au
ss)
Q (degrees)
Simulation Parameters: R = 7.9 ± 0.1 Å, Q = 70°, J = - 0.028 cm-1
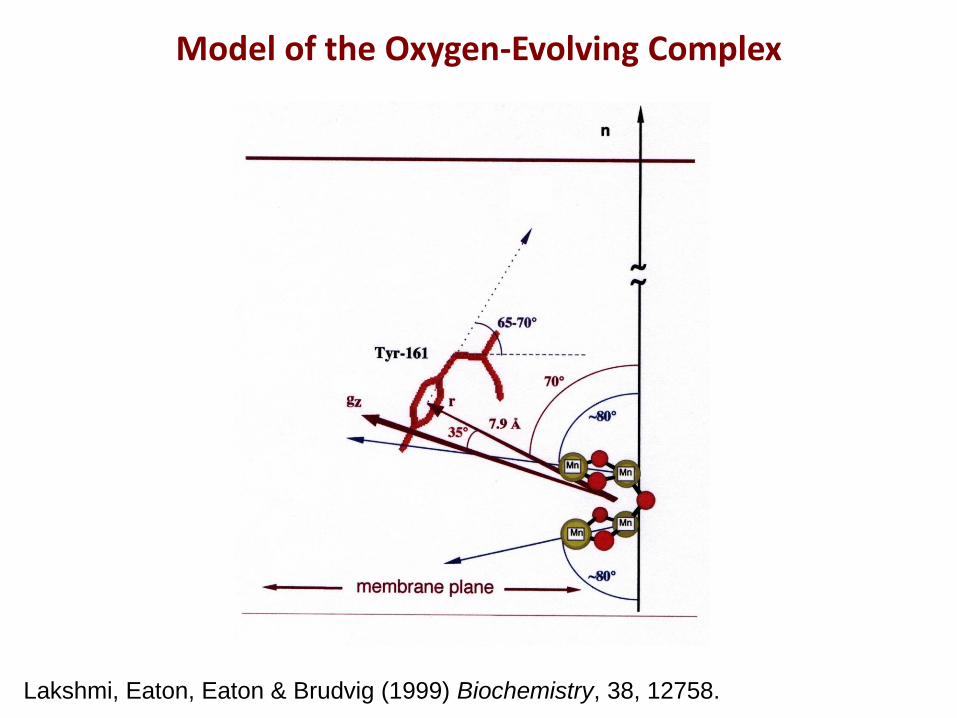
Lakshmi, Eaton, Eaton & Brudvig (1999) Biochemistry, 38, 12758.
Model of the Oxygen-Evolving Complex

Iron(III) Center of Cytochrome C

Iron(III) Center of Cytochrome C
2000 4000 6000 8000
Magnetic Field (G)
gX
gY
gZ

[4Fe4S] Clusters of Photosystem I
A1A A1B
A0A A0B
AB
P700
FX
FA
FB
Jordan et al. (2001) Nature, 411, 909.
AA
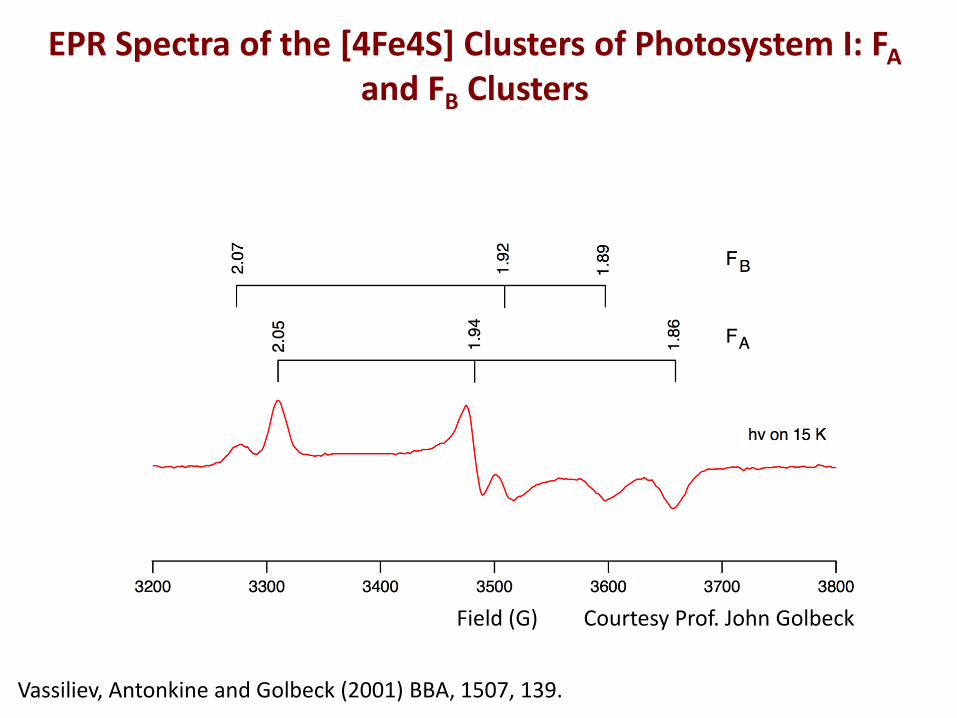
EPR Spectra of the [4Fe4S] Clusters of Photosystem I: FA and FB Clusters
Courtesy Prof. John Golbeck Field (G)
Vassiliev, Antonkine and Golbeck (2001) BBA, 1507, 139.

FA
FB
12 Å
The FA and FB Clusters of Photosystem I
Jordan et al. (2001) Nature, 411, 909.
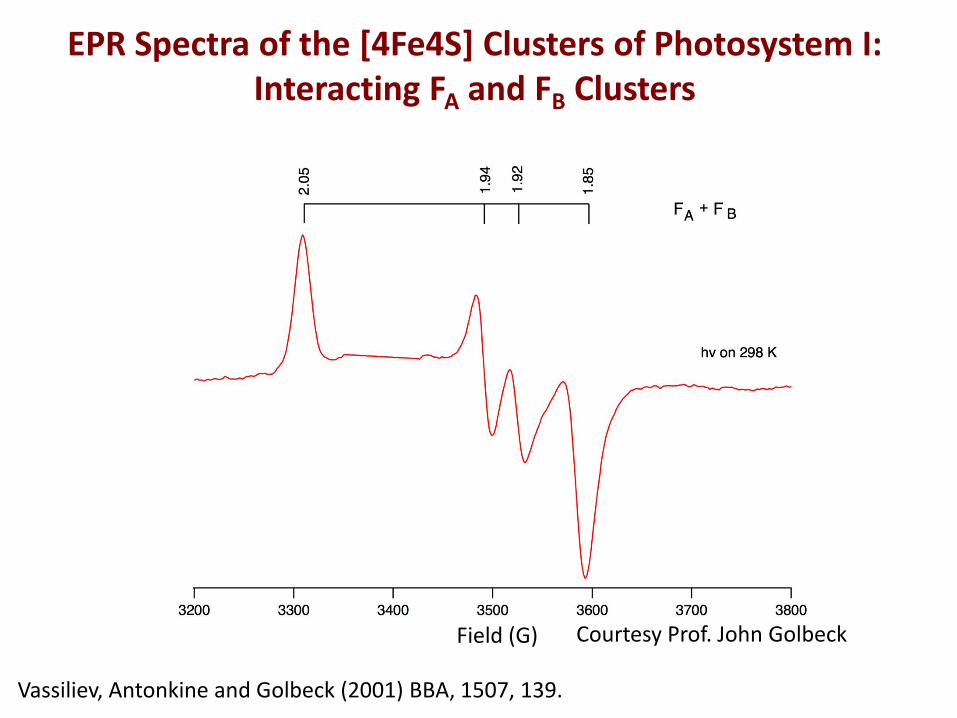
EPR Spectra of the [4Fe4S] Clusters of Photosystem I: Interacting FA and FB Clusters
Courtesy Prof. John Golbeck Field (G)
Vassiliev, Antonkine and Golbeck (2001) BBA, 1507, 139.

EPR spectrum of Copper (II) Sulfate
2500 3000 3500
Magnetic Field (G)
gperp gpara [Cu (H2O)6]2+
Electron spin: S = ½ Nuclear spin: I = 3/2

High Spin Iron(III) Center of Human Serum Transferrin
Sun et al. Acta Crystallogr., Sect.D 1999, 55, 403-407.
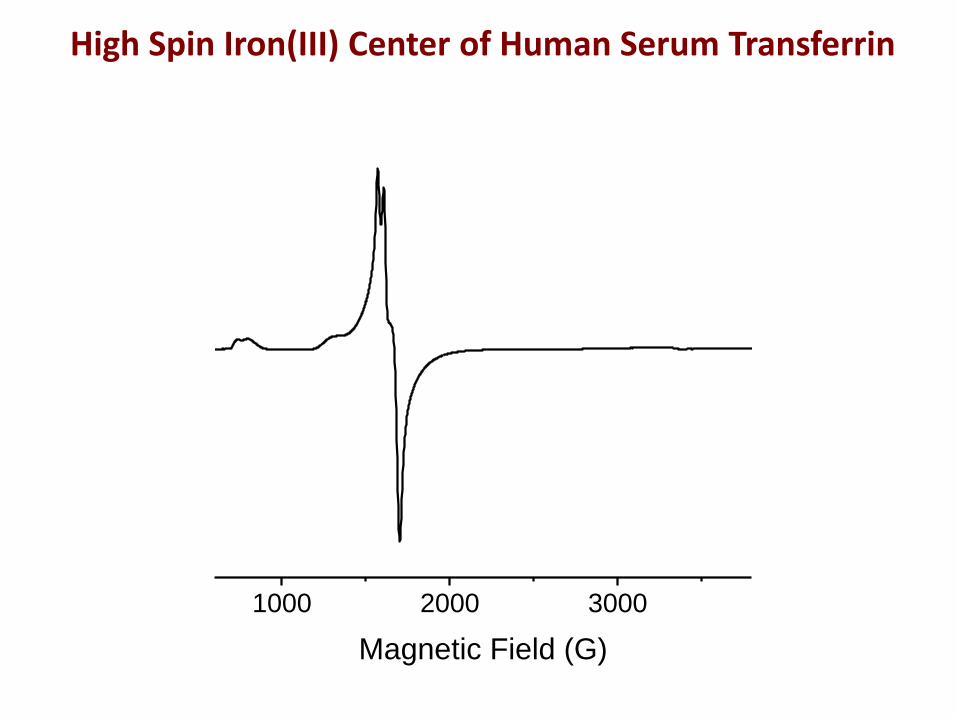
High Spin Iron(III) Center of Human Serum Transferrin
1000 2000 3000
Magnetic Field (G)

Progressive Power Saturation: The P700+ Center of
Photosystem I
3400 3420 3440 3460 3480
Magnetic Field (G)
Lakshmi, Jung, Golbeck & Brudvig (1999) Biochemistry, 38, 13210.

P1/2 1/g2 (T1 T2)
• P1/2 is half power at which a spin saturates
• Depends on spin-spin and spin-lattice relaxation • Signal amplitude is related to P1/2
A = K P1/2 (1 + P/P1/2)b/2
log (A/P1/2) = -b/2 log (P1/2 + P) + constant
Galli, C., Innes, J. B., Hirsh, D. J., and Brudvig, G. W. (1996) J. Magn. Reson. B, 110, 284.

0.0 0.1 0.2 0.3 0.4 0.5
0.0
0.7
1.4
Sig
na
l
Inte
ns
ity
(a
.u.)
Sqrt Power (mW)
Progressive Power Saturation of P700+

• Power saturation experiments of P700+ in aerobic (●) and anaerobic (○ ) conditions
• In some cases, oxygen enhances relaxation of observed spin
P700+FX
-
P700+FA
-FB-
P700+
P700+FA
-

I(t) = Intensity of Saturation-
Recovery EPR Signal
= 1 - N õó
0
p
(e-{k1int + k1q}t) sinq dq
where: k1i = Intrinsic Rate isotropic
k1q = Dipolar Rate orientation dependent
s
f
H0
q
s
f
H0
q
Dipolar Model
6r/11k q
P1/2 (observed ) = P1/2 (intrinsic) + P1/2 (dipolar)
P1/2 (dipolar) = constant/r6
Hirsh and Brudvig (2007) Nature Protocols, 2, 1770.
Lakshmi, Jung, Golbeck & Brudvig (1999) Biochemistry, 38, 13210.
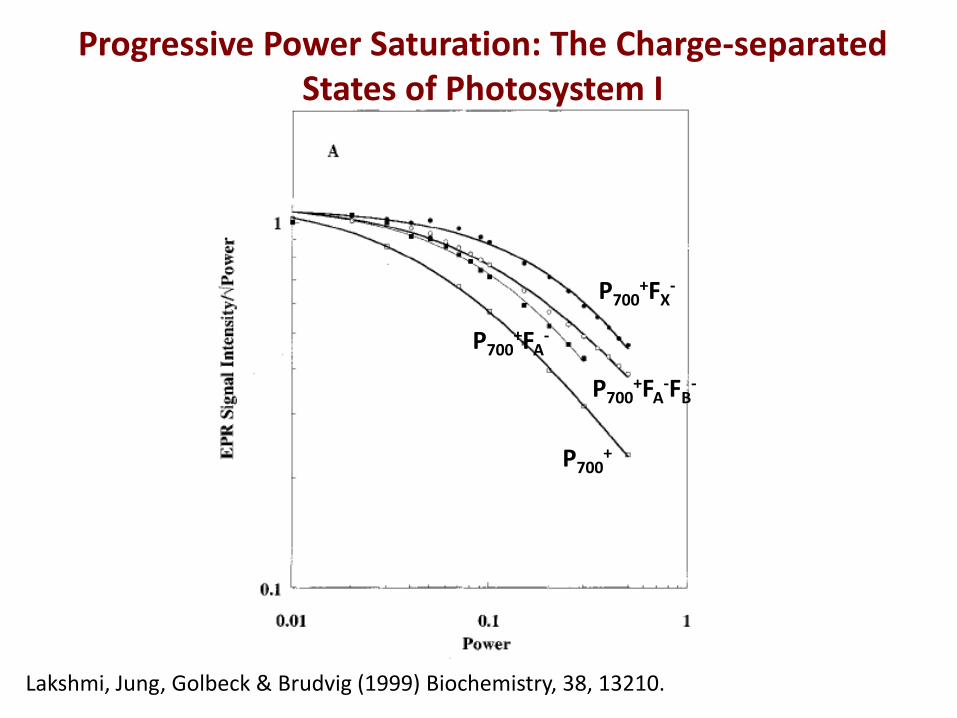
P700+FX
-
P700+FA
-FB-
P700+
P700+FA
-
Progressive Power Saturation: The Charge-separated States of Photosystem I
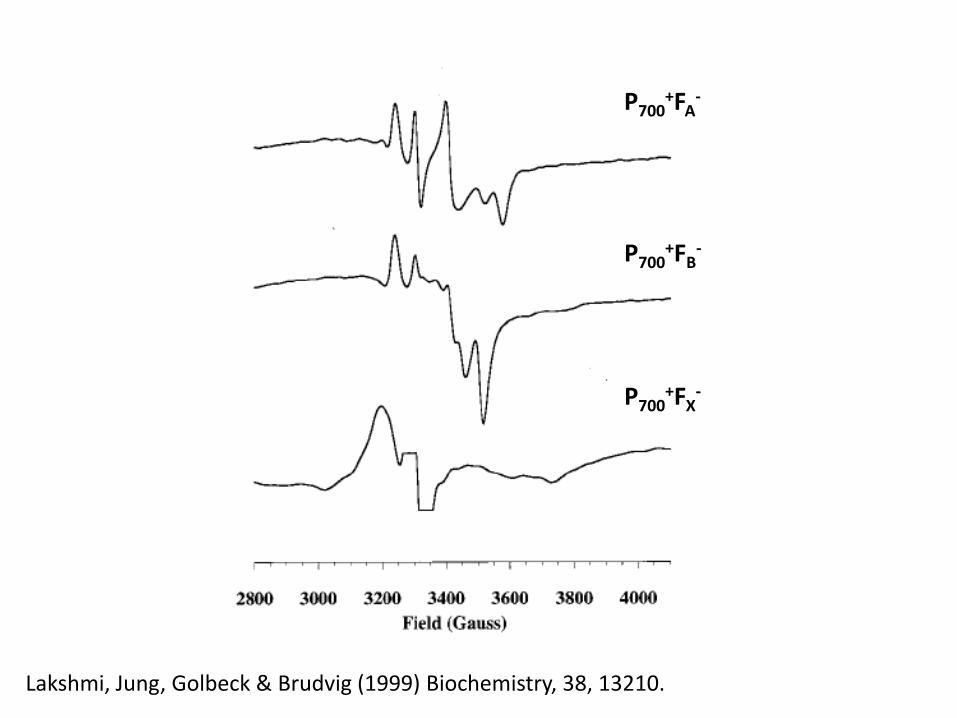
Lakshmi, Jung, Golbeck & Brudvig (1999) Biochemistry, 38, 13210.
P700+FA
-
P700+FB
-
P700+FX
-

Lakshmi, Jung, Golbeck & Brudvig (1999) Biochemistry, 38, 13210.

P700
FX
FA
FB
32 Å
10 Å
22 Å
Lakshmi, Jung, Golbeck & Brudvig (1999) Biochemistry, 38, 13210.
EPR Ruler

Tyrosine D
S2YZ
Progressive Power Saturation: The Tyrosine D and S2YZ
State Photosystem II
Szalai, Kühne, Lakshmi & Brudvig (1998) Biochemistry, 37, 13594.
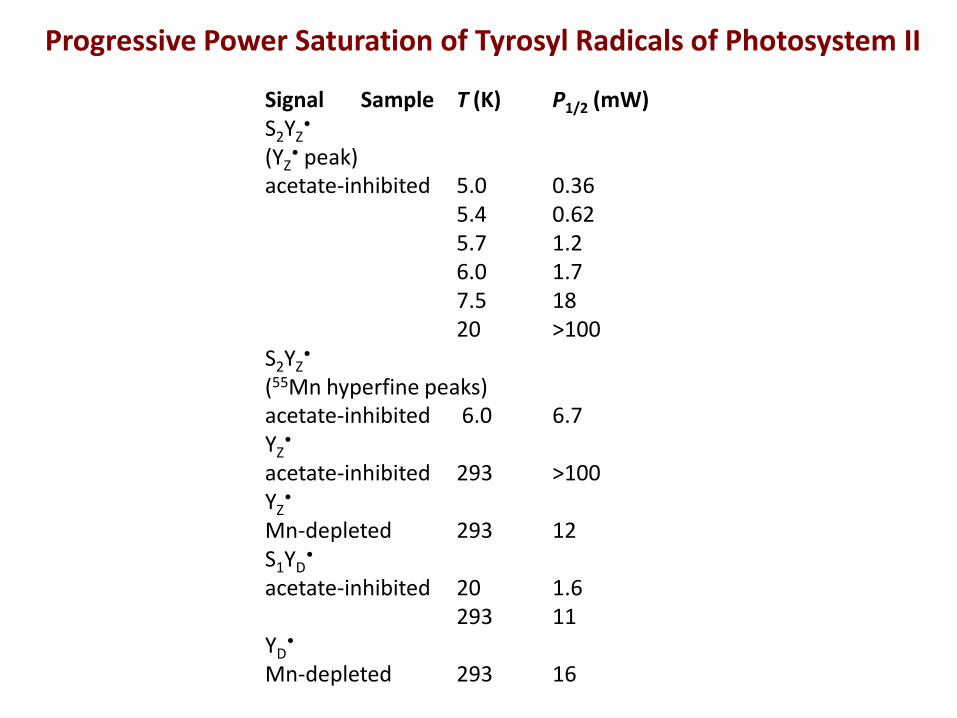
Signal Sample T (K) P1/2 (mW) S2YZ
• (YZ
• peak) acetate-inhibited 5.0 0.36 5.4 0.62 5.7 1.2 6.0 1.7 7.5 18 20 >100 S2YZ
• (55Mn hyperfine peaks) acetate-inhibited 6.0 6.7 YZ
• acetate-inhibited 293 >100 YZ
• Mn-depleted 293 12 S1YD
• acetate-inhibited 20 1.6 293 11 YD
• Mn-depleted 293 16
Progressive Power Saturation of Tyrosyl Radicals of Photosystem II