Embed Size (px)
Citation preview

JULY 2016
FUND FACTSHEET

HOW TO READ THE FACTSHEET?
July 2016
Fund Manager : An employee of the asset management company such as a mutual fund or life insurer, who manages investments of
the scheme. He is usually part of a larger team of fund managers and research analysts.
Application Amount for Fresh Subscription : This is the minimum investment amount for a new investor in a mutual fund scheme.
Minimum Additional Amount : This is the minimum investment amount for an existing investor in a mutual fund scheme.
Yield to Maturity : The Yield to Maturity or the YTM is the rate of return anticipated on a bond if held until maturity. YTM is expressed
as an annual rate. The YTM factors in the bond’s current market price, par value, coupon interest rate and time to maturity.
SIP : SIP or systematic investment plan works on the principle of making periodic investments of a fixed sum. It works similar to a
recurring bank deposit. For instance, an investor may opt for an SIP that invests Rs 500 every 15th of the month in an equity fund
for a period of three years.
NAV : The NAV or the net asset value is the total asset value per unit of the mutual fund after deducting all related and permissible
expenses. The NAV is calculated at the end of every business day. It is the value at which the investor enters or exits the mutual
fund.
Benchmark : A group of securities, usually a market index, whose performance is used as a standard or benchmark to measure
investment performance of mutual funds, among other investments. Some typical benchmarks include the Nifty, Sensex,
BSE200, BSE500, 10-Year Gsec.
Entry Load : A mutual fund may have a sales charge or load at the time of entry and/or exit to compensate the distributor/ agent.
Entry load is charged at the time an investor purchases the units of a mutual fund. The entry load is added to the prevailing NAV at
the time of investment. For instance, if the NAV is Rs. 100 and the entry load is 1%, the investor will enter the fund at Rs 101.
Exit Load : Exit load is charged at the time an investor redeems the units of a mutual fund. The exit load is deducted from the
prevailing NAV at the time of redemption. For instance, if the NAV is Rs 100 and the exit load is 1%, the redemption price would
be Rs 99 Per Unit.
Modified Duration : Modified duration is the price sensitivity and the percentage change in price for a unit change in yield
Standard Deviation : Standard deviation is a statistical measure of the range of an investment’s performance. When a mutual fund
has a high standard deviation, its means its range of performance is wide, implying greater volatility.
Sharpe Ratio : The Sharpe Ratio, named after its founder, the Nobel Laureate William Sharpe, is a measure of risk-adjusted returns.
It is calculated using standard deviation and excess return to determine reward per unit of risk.
Beta : Beta is a measure of an investment’s volatility vis-à-vis the market. Beta of less than 1 means that the security will be less
volatile than the market. A beta of greater than 1 implies that the security’s price will be more volatile than the market.
AUM : AUM or assets under management refers to the recent / updated cumulative market value of investments managed by a
mutual fund or any investment firm.
Holdings : The holdings or the portfolio is a mutual fund’s latest or updated reported statement of investments/securities. These
are usually displayed in terms of percentage to net assets or the rupee value or both. The objective is to give investors an idea of
where their money is being invested by the fund manager.
Nature of Scheme : The investment objective and underlying investments determine the nature of the mutual fund scheme. For
instance, a mutual fund that aims at generating capital appreciation by investing in stock markets is an equity fund or growth
fund. Likewise, a mutual fund that aims at capital preservation by investing in debt markets is a debt fund or income fund. Each of
these categories may have sub-categories.
Rating Profile : Mutual funds invest in securities after evaluating their creditworthiness as disclosed by the ratings. A depiction of the
mutual fund in various investments based on their ratings becomes the rating profile of the fund. Typically, this is a feature of debt
funds.
1

2
Inflation
Retail inflation as measured by CPI (consumer price index) for June 2016 was flat at 5.77% as compared to that of May 2016 which was at
5.76%. Like before, continuing food inflation, especially in cereals pulses vegetables and sugar, was major cause which prevented
inflation from dipping. Above average monsoon and active steps taken by government especially in removing the bottlenecks on the
supply side should help rein in the food inflation in coming months. WPI (wholesale price index) rose sharply and again hit a new high by
coming at 1.62% as compared to 0.79% in May.
Macros
India’s Index of Industrial Production (IIP) Industrial growth, recorded 1.2% growth in May 2016, after declining 1.3% (revised from -0.8%
earlier) in the previous month. Manufacturing sector, which is bulk of IIP gave a positive growth of 0.7%, after declining consecutively in
the previous two months. Trade deficit came at just below 8.2 billion dollars. After a long time, exports witnessed a growth, coming in at
1.3% as compared to -0.80 % previously. Imports slipped -7.3%.
Liquidity and Rates
As compared to borrowing from RBI’s to the tune of approximately 40,000 crores in previous month, July witnessed a reversal of sorts and
it was lent approximately 10,000 crores. RBI’s commitment to keep the liquidity in comfortable zone is working out. Regular government
spending and regular liquidity infusion all these combined kept the call rates below the repo rate of 6.50%. Infact to prevent the rates from
falling too low, RBI conducted reverse repo auctions. A bit of pressure due to indirect tax outflow and state loan auctions, aided to keep
the rates in a narrow band. 1-2 months CD were down from 7.00 to 6.50 levels as is usually seen during the quarter crossing. Aided by
sufficient liquidity rates remained lower. 1 year CDs were down from 7.40 levels to 7.20 levels. Long dated gilts and corp bonds also were
riding a good rally and markets witnessed a sizeable fall in market yields. 10 year gilt, the benchmark closed the month at 7.16 levels,
which was very sharp and profitable fall in yields.
Outlook
Good monsoon, downward pressure on global oil prices, uncertain global economic outlook, negative interest rates policy followed by
ECB and BOJ, and reluctance on part of US FED to raise rates- all these will make sure that RBI maintains it’s accommodative stance
going ahead. Monsoon has been above average, and food inflation should trend down in months to come, add to that lower oil prices will
control inflation as well as control the deficit. With things moving ahead on GST front, one of the biggest structural reforms taking concrete
steps to finishing line-things look good going ahead. Even if rates are not cut in august, the accommodative policy along with comfortable
liquidity is going to be the way forward of RBI for near future. There might be phases of temporary volatility and bouts of weakness,
however yields seem to be on a downwards trend. Existing investors are recommended to stay invested in medium to long duration space.
For new investors short term fund offers a wonderful vehicle to earn high constant accrual and a chance to participate in rate action led
capital appreciation. Liquid and ultra short term fund, as always will be vehicles for smart utilisation of temporary surpluses.
July
Overnight Rate (NSE MIBOR)
10 year Gsec
3 month CDs
6M CDs
12 month CDs
Currency
10 Year US Treasury
Month Opening
6.40
7.42
7.00
7.15
7.40
67.32
1.46
Intra Month High
6.59
7.43
7.00
7.15
7.40
67.46
1.60
Intra Month Low
6.25
7.16
6.60
6.90
7.22
66.91
1.37
Month Closing
6.59
7.16
6.60
6.90
7.22
67.00
1.46
DEBT MARKET COMMENTARY
Malay Shah
Head – Fixed Income
July 2016

EQUITY MARKET COMMENTARY
Key Domestic News
• After being subject to months of debate and bargaining, Rajya Sabha finally passed the Goods & Services Tax (GST)
Amendment bill, which is a first step towards final clearance of GST Bill likely to be passed in winter session. It would
improve the ‘ease of doing business’ considerably and has potential of upping the GDP growth by 1-2%.
• After a deficient June, July saw the country receive 6.6% more rains than the normal long-period average (LPA). Rainfall as
a whole is expected to be 107% of the LPA for August-September. Sowing also picked up strongly. According to the
agriculture ministry, cumulative sowing as on July 29 stood at 799.51 lh, higher than the 752.29 lh last year.
• Indirect tax collections for Q1FY17 rose by 30.8% y-o-y, substantially above the 10% y-o-y full-year budget target,
reflecting better growth and also higher tax rates. This should offset some of the fiscal concerns from the seventh pay
commission wage hikes and the government’s ambitious asset sales targets.
Key Domestic Economic Data
• India’s manufacturing PMI improved to 51.8 in July from 51.7 in June. The new orders index rose to 53.2 in July from 52.9
in June, its fastest pace of expansion since March, supported by both stronger domestic as well as external demand.
• CPI inflation remained high at 5.8% y-o-y in June, running well above the RBI’s target of 5% by March 2017. April-June
average CPI is at 5.7% vs. 5.1% last year.
• Index of Industrial Production (IIP) for the month of May came in at 1.2% versus a contraction of -1.35% in April. FYTD, IIP
growth is -0.1% vs. 2.8% last year.
• India's core sector expanded 5.2% in June compared with a 2.8% rise in May. Coal output grew the fastest at 12% followed
by cement whose output rose 10.3%. Crude oil and natural gas were the only two sectors where production declined in
June by 4.3% and 4.5%, respectively.
Key Global Events
• China's economy grew 6.7% Q2CY16, steady from the previous period and slightly better than forecasts as a string of
government stimulus measures helped shore up demand. While fears of a hard landing have eased, mixed activity data for
June released along with GDP pointed to the risk of slowing economic momentum later in the year.
• As expected, US FOMC left the policy unchanged - the Fed Funds rate remaining at 0.25-0.5%. According to Fed
watchers, statement was slightly hawkish. Statement like "Near-term risks to the economic outlook have diminished."
Indicate that policy action in September meeting is clearly on the table
• US GDP growth came in at 1.2% in Q2CY16 after rising by a downwardly revised 0.8% in the first quarter. Economists
polled had forecast GDP growth rising at a 2.6% in the last quarter.
Outlook
• Global liquidity conditions continue to remain benign, we expect expanded QE from ECB and Bank of England. We expect
US and Japan to start fiscal stimulus as well.
• India is one of the best placed among large economies in the world in terms of demographics, demand, growth etc. Indian
economy is well on track to its slow & steady recovery.
• Strong domestic macros, progress on big ticket economic reforms(GST), early signs of demand recovery, huge long term
opportunity and benign global liquidity environment augur well for Indian equities over medium to long term.
• We maintain our positive stance on Indian equities. Any short term volatility around global factors should be utilized by
investors to build high quality portfolio in Indian equities.
• Follow-on effects of BREXIT, uncertainty around China, and a reversal in crude oil prices continue to be key risk to our
outlook.
Sumit Bhatnagar, CFA
Fund Manager - Equity
3
July 2016

Indiabulls Liquid Fund(An Open-ended Liquid Scheme)
PORTFOLIO
RatingName of Instrument%
of Assets
CERTIFICATE OF DEPOSITState Bank Of PatialaCorporation BankPunjab & Sind BankVijaya BankState Bank Of HyderabadIndusind Bank LimitedCanara BankHDFC Bank LtdICICI Bank LtdAndhra BankDena BankFederal Bank LtdRatnakar BankThe South Indian Bank LtdAxis Bank LimitedOriental Bank Of CommerceSub-TotalTreasury BillsSub-Total
FIXED DEPOSITLakshmi Vilas Bank LtdHDFC Bank LtdSub-Total
COMMERCIAL PAPERSNational Bank for Agriculture and Rural DevelopmentONGC Mangalore Petrochemicals LimitedPTC India Financial Services Ltd.Housing and Urban Development Corporation Ltd
A1+A1+A1+A1+A1+A1+A1+A1+A1+A1+A1+A1+A1+A1+A1+A1+
SOV
AAA
A1+
A1+A1+
A1+
3.98%3.97%3.70%2.79%2.67%2.65%1.99%1.99%1.99%1.72%0.94%0.80%0.67%0.66%0.66%0.66%0.53%0.27%0.19%0.13%
51.04%
0.05%0.05%
4.48%
100.00%
INVESTMENT OBJECTIVE
To provide a high level of liquidity with returns commensurate with low risk through a portfolio of money market and debt securities with maturity of upto 91 days. However, there can be no assurance that the investment objective of the scheme will be achieved.
Mr. Malay ShahTotal Work Experience: More than 14 years
FUND MANAGER
BENCHMARK
25 October 2011
DATE OF ALLOTMENT
Direct Plan
Growth Option
Daily Dividend Option
Weekly Dividend Option
Monthly Dividend Option
Existing Plan
Growth Option
Daily Dividend Option
Weekly Dividend Option
Monthly Dividend Option
` 1516.3407
` 1001.06
` 1001.7447
` 1035.3895
` 1511.221
` 1001.1451
` 1002.4319
` 1006.6447
Entry Load : Not ApplicableExit Load : Nil
LOAD INFORMATION
` 4396.12 Crores
AVG. AUM MONTHLY
` 3740.91 Crores
LATEST AUM AS ON MONTH END
LATEST NAV PER UNIT
CRISIL Liquid Fund Index
EXPENSE RATIO
Regular
Direct
0.38%
0.28%
FUND STYLE
Credit Quality
Hig
hM
idL
ow
High Mid Low
Interest Rate Sensitivity
4
Credit Quality Rating CRISIL AAAmfs ^July 2016
MATURITY AND YIELD
Average Maturity
Modified Duration
Gross YTM
32.38 Days
30.12 Days
7.50%
THIS PRODUCT IS SUITABLE FOR INVESTORS WHO ARE SEEKING*
• High level of liquidity with commensurate
returns over short term.
• Through investment in money market &
debt securities with maturity of upto 91days.
• Low Risk
*Investors should consult their financial advisers if in doubt about whether the product is suitable for them.
% of Assets
7.45%3.98%2.67%2.66%2.26%2.00%1.99%1.99%1.46%1.33%1.33%0.67%0.67%0.66%0.40%0.32%
31.84%10.31%
10.31%
2.01%0.27%
2.28%
5.07%
4.64%4.38%
3.99%
Rating
A1+A1+A1+A1+A1+A1+A1+A1+A1+A1+A1+A1+A1+A1+A1+A1+A1+A1A1+A1+
AA-
Piramal Enterprises LimitedReligare Finvest LtdSBI Global Factor LtdSmall Industries Development Bank of IndiaEdelweiss Commodities Services LtdReliance Jio Infocomm LtdReliance Home Finance LimitedReligare Enterprises LtdS D Corporation Private Ltd.Afcons Infrastructure LtdAadhar Housing Finance Limited.Dalmia Bharat Ltd.Kotak Commodity Services Pvt LtdEXIMPower Finance Corporation LimitedTV 18 Broadcast LtdForbes and Company LtdHCL Infosystems LtdShapoorji Pallonji & Company Pvt Ltd.Steel Authority Of IndiaSub-Total
FIXED RATES BONDS - CORPORATEReligare Finvest LtdSub-Total
CBLO/Reverse Repo/Net Current Assets
GRAND TOTAL
Name of Instrument
RATING PROFILE
A1+/SOV/FD
AA-
A1
95.20%
0.05%
0.27%
CBLO/Reverse Repo/Net Current Assets of 4.48%

Indiabulls Ultra Short Term Fund(An Open-ended Debt scheme)
CRISIL Liquid Fund Index
INVESTMENT OBJECTIVE
To provide liquidity with return commensurate with low risk through a portfolio of money market and debt securities. However, there can be no assurance that the investment objective of the scheme will be achieved.
Mr. Malay ShahTotal Work Experience: More than 14 years
FUND MANAGER
BENCHMARK
6 January 2012
DATE OF ALLOTMENT
Direct PlanGrowth Option Daily Dividend Option Fortnightly Dividend OptionWeekly Dividend OptionMonthly Dividend Option Existing PlanGrowth Option Daily Dividend Option Weekly Dividend Option Monthly Dividend Option
` 1521.4856 ` 1004.3508` 1002.1567` 1002.5861` 1001.7083
` 1494.8585 ` 1002.6239` 1002.5339` 1002.0345
Entry Load : Not ApplicableExit Load : Nil
LOAD INFORMATION
` 665.20 Crores
AVG. AUM MONTHLY
` 774.15 Crores
LATEST AUM AS ON MONTH END
PORTFOLIO
RatingName of Instrument%
of Assets
LATEST NAV PER UNIT
EXPENSE RATIO
Regular
Direct
0.74%
0.24%
5
CERTIFICATE OF DEPOSITSAxis Bank LimitedCanara BankOriental Bank Of CommerceCorporation BankState Bank Of HyderabadIDBI Bank LimitedNational Bank for Agriculture and Rural DevelopmentICICI Bank LtdSub-Total
FIXED DEPOSITLakshmi Vilas Bank LtdSub-Total
COMMERCIAL PAPERSNational Bank for Agriculture and Rural DevelopmentHCL Infosystems LtdAfcons Infrastructure LtdShapoorji Pallonji & Company Pvt Ltd.Reliance Jio Infocomm LtdPTC India Financial Services Ltd.Religare Enterprises LtdSub-Total
FIXED RATE BONDS - CORPORATEIL&FS Transportation Networks LtdReliance Jio Infocomm LtdCapital First Ltd.Adani Ports & Special Economic ZoneLIC Housing Finance LtdPiramal Enterprises LimitedHDFC LtdSub-Total
ZERO COUPON BONDS - CORPORATEIDFC Bank LtdDewan Housing Finance Corp. LtdSub-Total
CBLO/Reverse Repo/Net Current Assets
GRAND TOTAL
8.51%5.71%4.89%4.47%3.73%3.12%3.11%3.10%
36.64%
3.23%3.23%
6.24%5.12%5.03%4.94%4.00%3.86%3.21%
32.40%
3.88%2.60%2.60%1.97%1.95%1.95%0.65%
15.60%
2.37%2.03%
4.40%
7.73%
100.00%FUND STYLE
Credit Quality
Hig
hM
idLo
w
High Mid Low
Interest Rate Sensitivity
July 2016
A1+A1+A1+A1+A1+A1+A1+A1+
A1+A1A1+A1+A1+A1+A1+
AAAAAA+AA+AAAAAAAA
AAAAAA
Credit Quality Rating CRISIL AAAmfs ^^
MATURITY AND YIELD
Average Maturity
Modified Duration
Gross YTM
194.69 Days
180.30 Days
7.98%
THIS PRODUCT IS SUITABLE FOR INVESTORS WHO ARE SEEKING*
• Liquidity with commensurate returns over
short term.
• Through investment in money market and
debt securities.
• Moderately Low Risk
*Investors should consult their financial advisers if in doubt about whether the product is suitable for them.
RATING PROFILE
A1+/FD/SOV
AAA
AA+AA
A
A1
67.15%
9.60%
4.57%1.95%3.88%
5.12%
Note: CBLO/Reverse Repo/Net Current Assets of 7.73%

Indiabulls Short Term Fund(An Open-ended Debt scheme)
CRISIL Short-Term Bond Fund Index
INVESTMENT OBJECTIVE
The Scheme will endeavor to generate stable returns over short term with a low risk strategy while maintaining liquidity through a portfolio comprising debt and money market instruments. However, there can be no assurance that the investment objective of the scheme will be achieved.
Mr. Malay ShahTotal Work Experience: More than 14 years
FUND MANAGER
BENCHMARK
13 September 2013
DATE OF ALLOTMENT
Direct PlanGrowth Option Fortnightly Dividend OptionWeekly Dividend OptionMonthly Dividend Option
Regular PlanGrowth Option Weekly Dividend OptionMonthly Dividend Option
` 1334.7826` 1008.0435` 1003.4222` 1010.9687
` 1286.5144` 1011.4543` 1011.0557
Entry Load : Not ApplicableExit Load : Nil
LOAD INFORMATION
` 622.80 Crores
AVG. AUM MONTHLY
` 716.07 Crores
LATEST AUM AS ON MONTH END
PORTFOLIO
RatingName of Instrument% of Assets
CERTIFICATE OF DEPOSITAxis Bank LimitedNational Bank for Agriculture and Rural DevelopmentState Bank Of HyderabadCorporation BankVijaya BankCanara BankSub-TotalCOMMERCIAL PAPERSHCL Infosystems LtdPTC India Financial Services Ltd.Afcons Infrastructure LtdAadhar Housing Finance Limited.Shapoorji Pallonji & Company Pvt Ltd.Sub-TotalFIXED RATE BONDS - CORPORATEIL&FS Transportation Networks LtdIndiabulls Real Est. LtdPiramal Enterprises LimitedJanalakshmi Financial Services LtdReliance Big Entertainment Private LimitedCapital First Ltd.Reliance broadcast network limitedONGC Mangalore Petrochemicals LimitedLIC Housing Finance LtdReligare Finvest LtdReliance Jio Infocomm LtdPetronet Lng LimitedFortis Healthcare Holdings Pvt LtdSteel Authority Of IndiaSub-TotalZERO COUPON BONDS - CORPORATETrent LtdDewan Housing Finance Corp. LtdIDFC Bank LtdSub-TotalCBLO/Reverse Repo/Net Current Assets
GRAND TOTAL
A1+A1+A1+A1+A1+A1+
A1A1+A1+A1+A1+
AAA-AA
A+AA+ SO
AA+AAA SO
AAAAAAAA-AAA
AA+AAA
AAAAAAAA
6.43%3.36%2.69%1.88%1.34%0.54%
16.24%
9.55%4.86%2.74%2.09%1.75%
20.99%
9.78%9.53%6.59%6.52%3.52%3.51%3.03%2.84%2.80%1.85%0.70%0.70%0.51%0.29%
52.17%
2.04%1.10%0.64%
3.78%6.82%
100.00%
LATEST NAV PER UNIT
EXPENSE RATIO
Regular
Direct
1.64%
0.63%
6
MATURITY AND YIELD
Average Maturity
Modified Duration
Gross YTM
0.81 Years
0.70 Years
9.13%FUND STYLE
Credit Quality
Hig
hM
idLo
w
High Mid Low
Interest Rate Sensitivity
THIS PRODUCT IS SUITABLE FOR INVESTORS WHO ARE SEEKING*
• Stable returns over short term while
maintaining liquidity.
• Through investment in debt and money
market instruments.
• Moderate Risk
*Investors should consult their financial advisers if in doubt about whether the product is suitable for them.
July 2016
RATING PROFILE
Note: CBLO/Reverse Repo/Net Current Assets of 6.82 %
A1+ 27.68%
AAA 11.11%
AA+ 7.73%AA 8.92%
AA- 11.38%A+ 6.52%
A 10.29%
A1 9.55%

Indiabulls Income Fund(An Open-ended Debt scheme)
CRISIL Composite Bond Fund Index
INVESTMENT OBJECTIVE
To generate a steady stream of income and/or medium to long term capital appreciation/ gain through investment in fixed income securities. However, there can be no assurance that the investment objective of the scheme will be achieved.
Mr. Malay ShahTotal Work Experience: More than 14 years
FUND MANAGER
BENCHMARK
4 March 2013
DATE OF ALLOTMENT
Direct PlanGrowth Option Monthly Dividend Option Quarterly Dividend Option Half Yearly Dividend Option Regular PlanGrowth Option Monthly Dividend Option Quarterly Dividend Option Half Yearly Dividend Option
` 13.3167` 10.6040` 11.4237` 11.3961
` 12.8007` 10.3531` 11.5325` 11.2016
Entry Load : Not ApplicableExit Load : Nil
LOAD INFORMATION
` 399.03 Crores
AVG. AUM MONTHLY
` 419.23 Crores
LATEST AUM AS ON MONTH END
PORTFOLIO
RatingName of Instrument%
of Assets
LATEST NAV PER UNIT
EXPENSE RATIO
Regular
Direct
0.91%
0.39%
7
CERTIFICATE OF DEPOSITAxis Bank LimitedSub-Total
FIXED RATES BONDS - CORPORATEPower Grid Corporation of India LimitedPower Finance Corporation LimitedReliance Jio Infocomm LtdNHPC LtdHDFC LtdNTPC LtdTata Sons LtdLIC Housing Finance LtdRural Electrification Corporation LimitedNuclear Power Corporation of India LimitedONGC Mangalore Petrochemicals LimitedSub-Total
FIXED RATE BONDS - GOVERNMENT7.59% GOI - 20-Mar-20297.88% GOI 19-Mar-20307.59% GOI - 11-Jan-20267.61% GOI 09-May-20308.27% GOI 09-Jun-20208.18% Haryana SDL SpecialSub-Total
ZERO COUPON BONDS - CORPORATEDewan Housing Finance Corp. LtdNorth Karnataka ExpresswayICICI Bank LtdSub-Total
CBLO/Reverse Repo/Net Current Assets
GRAND TOTAL
-3.98%
3.98%
9.88%7.35%7.27%4.92%3.66%3.64%3.62%2.47%2.45%1.23%1.21%
47.70%
9.81%3.76%3.68%2.47%1.25%3.65%
24.62%
8.18%5.95%5.63%
19.76%
3.94%
100.00%
FUND STYLE
Credit Quality
Hig
hM
idLo
w
High Mid Low
Interest Rate Sensitivity
July 2016
-A1+
AAAAAAAAAAAAAAAAAAAAAAAAAAAAAAAAA
SOVEREIGNSOVEREIGNSOVEREIGNSOVEREIGNSOVEREIGNSOVEREIGN
AAAAAAAAA
MATURITY AND YIELD
Average Maturity
Modified Duration
Gross YTM
5.06 Years
3.58 Years
8.01%
RATING PROFILE
A1+ 3.98%
AAA 67.46%
SOV 24.62%
Note: CBLO/Reverse Repo/Net Current Assets of 3.94%
THIS PRODUCT IS SUITABLE FOR INVESTORS WHO ARE SEEKING*
• Regular income and/or capital appreciation
over medium to long term.
• Through investment in fixed income securities.
• Moderate Risk
*Investors should consult their financial advisers if in doubt about whether the product is suitable for them.
Credit Quality Rating CARE (AAAmfs) ^^

Indiabulls Gilt Fund(An Open-ended Gilt scheme)
I-Sec Composite Index
INVESTMENT OBJECTIVE
The scheme seeks to generate income and cap i ta l apprec ia t ion by i nves t i ng predominantly in sovereign securities issued by Central Government (including Treasury Bills) and/or by State Government, without any restriction on the maturity of the portfolio. However, there is no assurance that the investment objective of the scheme will be realized and the scheme does not assure or guarantee any returns.
Mr. Malay ShahTotal Work Experience: More than 14 years
FUND MANAGER
BENCHMARK
10 January 2013
DATE OF ALLOTMENT
Direct PlanGrowth OptionFortnightly Dividend Option Monthly Dividend OptionIndirect PlanGrowth Option Fortnightly Dividend Option Weekly Dividend OptionMonthly Dividend Option
` 1443.1107` 1083.5426` 1095.424
` 1391.3049` 1189.0889` 1067.1173` 1049.5877
Entry Load : Not ApplicableExit Load : 1%, if redeemed/ switched out within 1 year from the date of allotment; Nil, if redeemed/ switched out after 1 year from the date of allotment.
LOAD INFORMATION
` 23.04 Crores
AVG. AUM MONTHLY
` 16.11 Crores
LATEST AUM AS ON MONTH END
PORTFOLIO
RatingName of Instrument%
of Assets
LATEST NAV PER UNIT
EXPENSE RATIO
Regular
Direct
1.25%
0.45%
FIXED RATES BONDS - GOVERNMENT7.88% GOI 19-Mar-20307.59% GOI - 11-Jan-2026Sub-Total
CBLO/Reverse Repo/Net Current Assets
GRAND TOTAL
-62.10%31.97%
94.07%
5.93%
100.00%
FUND STYLE
Credit Quality
Hig
hM
idLo
w
High Mid Low
Interest Rate Sensitivity
July 2016
MATURITY AND YIELD
Average Maturity
Modified Duration
Gross YTM
11.65 years
7.23 years
7.26%
RATING PROFILE
SOV
94.07%
Note: CBLO/Reverse Repo/Net Current Assets of 5.93%
-SOVSOV
THIS PRODUCT IS SUITABLE FOR INVESTORS WHO ARE SEEKING*
• Income and capital appreciation over
medium to long term.
• Through investment in sovereign securities
issued by Central Government (including
Treasury Bills) and/ or by State Government,
without any restriction on the maturity of the
portfolio.
• Moderate Risk
*Investors should consult their financial advisers if in doubt about whether the product is suitable for them.
8

Indiabulls Monthly Income Plan(An Open-ended Debt Scheme) (Monthly Income is not assured and is subject to availability of distributable surplus)
PORTFOLIO
Company Name
NCD - NON CONVERTIBLE DEBENTURESDalmia Cement Bharat LtdIndiabulls Real Est. LtdHero Wind Energy LtdEdelweiss Commodities Services LtdDewan Housing Finance Corp. LtdJanalakshmi Financial Services LtdTotalCP - COMMERCIAL PAPERSHCL Infosystems LimitedTotalEQU - EQUITY SHARESBeml LtdEicher Motors Ltd.Capital First Limited
11.60%11.53%
8.66%8.63%7.52%2.71%
50.65%
11.40%11.40%
0.90%0.83%0.80%
Industry/Rating
% of Assets
CRISIL MIP Blended Index
INVESTMENT OBJECTIVE
The primary objective of the Scheme is to generate regular monthly returns through investment primarily in debt securities. The secondary objective of the Scheme is to generate long-term capital appreciation by investing a portion of the Scheme's assets in equity securities. Monthly Income is not assured and is subject to availability of distributable surplus. However, there can be no assurance that the investment objective of the scheme will be achieved.
Mr. Malay ShahTotal Work Experience: More than 14 years
Mr. Sumit BhatnagarTotal Work Experience: 14 years
FUND MANAGERS
BENCHMARK
02 December 2015
DATE OF ALLOTMENT
Direct PlanGrowth Option Dividend Option
Existing PlanGrowth Option Dividend Option
` 10.6823` 10.6761
` 10.5904` 10.5904
Entry Load : Not ApplicableExit Load : 1%, if redeemed/ switched out within 1 year from the date of allotment;Nil, if redeemed/ switched out after 1 year from the date of allotment.
LOAD INFORMATION
` 20.81 Crores
AVG. AUM MONTHLY
` 17.40 Crores
LATEST AUM AS ON MONTH END
LATEST NAV PER UNIT
EXPENSE RATIO
Regular
Direct
1.75%
0.43%
FUND STYLE
Investment Style
Larg
eM
ediu
mSm
all
Growth Blend Value
Capitalisation
July 2016
QUANTITATIVE/VOLATILITY MEASURES
Standard Deviation Beta Sharpe Ratio Portfolio Turnover
N.A.N.A.N.A.N.A.
THIS PRODUCT IS SUITABLE FOR INVESTORS WHO ARE SEEKING*
• Capital appreciation and provide regular
income over a long period of time.
• Investment primarily in debt securities to generate
regular returns and investment of a portion of the
Scheme's assets in equity securities to generate
long-term capital appreciation.
• Medium Risk
*Investors should consult their financial advisers if in doubt about whether the product is suitable for them.
MATURITY AND YIELD
Average Maturity
Modified Duration
Gross YTM
1.85 Years
1.48 Years
8.05%
ICRA AA-BWR AA-ICRA AICRA AACARE AAAICRA A
ICRA A1 Industrial Capital GoodsAutoFinance
Company Name
Navkar Corporation LimitedSML Isuzu LimitedBharat Petroleum Corporation Ltd.Aegis Logistics LtdJK Tyre & Industries LtdSRF LimitedBayer Cropscience LtdTotalGSEC - GOVT SECURITIES(GSE)7.88%GSEC2030ITotalCash & Cash EquivalentsNet Receivable/PayableTotalGRAND TOTAL
0.80%0.77%0.75%0.74%0.72%0.71%0.70%
15.02%
3.03%3.03%
19.90%
19.90%100.00%
Industry/Rating
% of Assets
TransportationAutoPetroleum ProductsGasAuto AncillariesTextile ProductsPesticides Sovereign
RATING PROFILE
Note: CBLO/Reverse Repo/Net Current Assets of 34.92%
AAA AA
AA-
A
A1
7.52% 8.63%
23.13%
11.37%
11.40%
SECTORAL ALLOCATION
PharmaceuticalsBanksAutoTextile ProductsPetroleum ProductsConsumer Non DurablesIndustrial Capital Goods FinanceTransportationGasAuto AncillariesPesticidesCement Software Industrial Products
1.91%
1.69%
1.59%
1.35%
1.33%
1.17%
0.90%
0.80%
0.80%
0.74%
0.72%
0.70%
0.60%
9
0.28%
0.44%

Indiabulls Arbitrage Fund(An Open-ended Equity Scheme)
CRISIL Liquid Fund Index
INVESTMENT OBJECTIVE
To generate income by predominantly investing in arbitrage opportunities in the cash and derivative segments of the equity markets and the arbitrage opportunities available within the derivative segment and by investing the balance in debt and money market instruments. There is no assurance or guarantee that the investment objective of the scheme will be realized.
Mr. Sumit BhatnagarTotal Work Experience: 14 years
Mr. Malay ShahTotal Work Experience: More than 14 years
FUND MANAGERS
BENCHMARK
December 19, 2014
DATE OF ALLOTMENT
Direct PlanGrowth Option Dividend Option
Regular PlanGrowth Option Dividend Option
` 11.3833` 10.4923
` 11.2619` 10.3763
Entry Load : Not ApplicableExit Load : 0.25%, if redeemed/ switched out within one month from the date of allotment;Nil, if redeemed/ switched out after one month from the date of allotment.
LOAD INFORMATION
` 181.96 Crores
AVG. AUM MONTHLY
` 139.27 Crores
LATEST AUM AS ON MONTH END
LATEST NAV PER UNIT
EXPENSE RATIO
Regular
Direct
PORTFOLIO
Company Name
HDFC Bank LtdAshok Leyland LimitedSun Pharmaceuticals LtdReliance Industries LimitedIDFC LtdInfosys LtdAurobindo Pharma LimitedReliance Capital LtdHousing Development Finance Corporation LimitedNational Thermal Power Corp LtdOil & Natural Gas Corporation LimitedMaruti Suzuki India LimitedTotalMARGIN FIXED DEPOSITSDEBT SECURITIESDewan Housing Finance Corp. LtdSub-totalCash & Cash Equivalents/CBLO
Grand Total
9.84%9.72%9.51%9.47%9.38%8.83%4.18%2.99%2.17%1.41%1.15%0.46%
69.11%19.73%
6.57%6.57%4.59%
100.00%
% of Assets
BANKSAUTO
PHARMACEUTICALSPETROLEUM PRODUCTS
FINANCESOFTWARE
PHARMACEUTICALSFINANCEFINANCEPOWER
OILAUTO
Industry/Rating
1.00%
0.38%
July 2016
PharmaceuticalsAutoBanksPetroleum ProductsSoftwarePowerOil
Finance
SECTORAL ALLOCATION
14.55%
10.18%
8.83%
QUANTITATIVE/VOLATILITY MEASURES
Standard Deviation Beta Sharpe Ratio Portfolio Turnover
N.A.N.A.N.A.N.A.
THIS PRODUCT IS SUITABLE FOR INVESTORS WHO ARE SEEKING*
• To generate reasonable returns over short to medium term.• Investment predominantly in arbitrage opportunities in the cash and derivative segments of the equity markets and the arbitrage opportunities available within the derivative segment and by investing the balance in debt and money market instruments. • Moderately Low Risk
*Investors should consult their financial advisers if in doubt about whether the product is suitable for them.
13.69%
9.84%
9.47%
10
1.40%
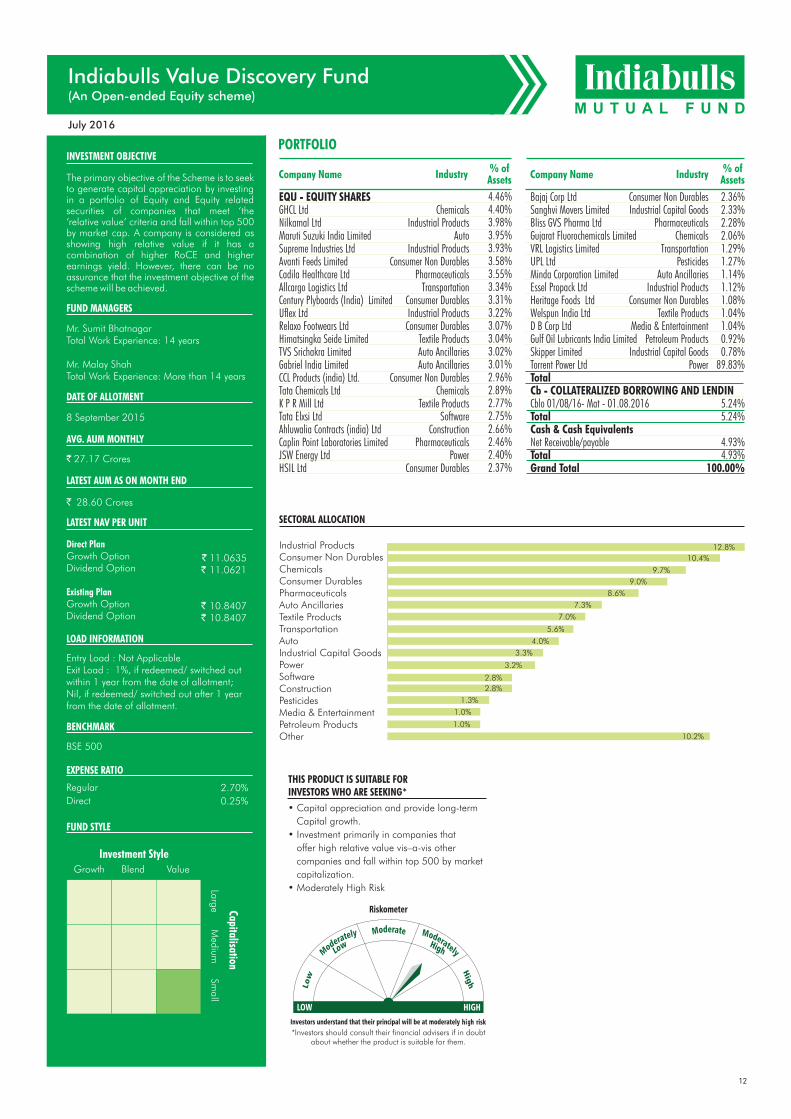
Indiabulls Value Discovery Fund(An Open-ended Equity scheme)
PORTFOLIO
Company Name
EQU - EQUITY SHARESGHCL LtdNilkamal LtdMaruti Suzuki India LimitedSupreme Industries LtdAvanti Feeds LimitedCadila Healthcare LtdAllcargo Logistics LtdCentury Plyboards (India) LimitedUflex LtdRelaxo Footwears LtdHimatsingka Seide LimitedTVS Srichakra LimitedGabriel India LimitedCCL Products (india) Ltd.Tata Chemicals LtdK P R Mill LtdTata Elxsi LtdAhluwalia Contracts (india) LtdCaplin Point Laboratories LimitedJSW Energy LtdHSIL Ltd
-Chemicals
Industrial ProductsAuto
Industrial ProductsConsumer Non Durables
PharmaceuticalsTransportation
Consumer DurablesIndustrial ProductsConsumer Durables
Textile ProductsAuto AncillariesAuto Ancillaries
Consumer Non DurablesChemicals
Textile ProductsSoftware
ConstructionPharmaceuticals
PowerConsumer Durables
4.46%4.40%3.98%3.95%3.93%3.58%3.55%3.34%3.31%3.22%3.07%3.04%3.02%3.01%2.96%2.89%2.77%2.75%2.66%2.46%2.40%2.37%
Industry% of Assets
BSE 500
INVESTMENT OBJECTIVE
The primary objective of the Scheme is to seek to generate capital appreciation by investing in a portfolio of Equity and Equity related securities of companies that meet ‘the ‘relative value’ criteria and fall within top 500 by market cap. A company is considered as showing high relative value if it has a combination of higher RoCE and higher earnings yield. However, there can be no assurance that the investment objective of the scheme will be achieved.
Mr. Sumit BhatnagarTotal Work Experience: 14 years
Mr. Malay ShahTotal Work Experience: More than 14 years
FUND MANAGERS
BENCHMARK
8 September 2015
DATE OF ALLOTMENT
Direct PlanGrowth Option Dividend Option
Existing PlanGrowth Option Dividend Option
` 11.0635` 11.0621
` 10.8407` 10.8407
Entry Load : Not ApplicableExit Load : 1%, if redeemed/ switched out within 1 year from the date of allotment;Nil, if redeemed/ switched out after 1 year from the date of allotment.
LOAD INFORMATION
` 27.17 Crores
AVG. AUM MONTHLY
` 28.60 Crores
LATEST AUM AS ON MONTH END
LATEST NAV PER UNIT
EXPENSE RATIO
Regular
Direct
2.70%
0.25%
FUND STYLE
Investment Style
Larg
eM
ediu
mSm
all
Growth Blend Value
Capitalisation
THIS PRODUCT IS SUITABLE FOR INVESTORS WHO ARE SEEKING*
• Capital appreciation and provide long-term
Capital growth.
• Investment primarily in companies that
offer high relative value vis–a-vis other
companies and fall within top 500 by market
capitalization.
• Moderately High Risk
*Investors should consult their financial advisers if in doubt about whether the product is suitable for them.
July 2016
2.36%2.33%2.28%2.06%1.29%1.27%1.14%1.12%1.08%1.04%1.04%0.92%0.78%
89.83%
5.24%5.24%
4.93%4.93%
100.00%
% of Assets
Consumer Non DurablesIndustrial Capital Goods
PharmaceuticalsChemicals
TransportationPesticides
Auto AncillariesIndustrial Products
Consumer Non DurablesTextile Products
Media & EntertainmentPetroleum Products
Industrial Capital GoodsPower
IndustryCompany Name
Bajaj Corp LtdSanghvi Movers LimitedBliss GVS Pharma LtdGujarat Fluorochemicals LimitedVRL Logistics LimitedUPL LtdMinda Corporation LimitedEssel Propack LtdHeritage Foods LtdWelspun India LtdD B Corp LtdGulf Oil Lubricants India LimitedSkipper LimitedTorrent Power LtdTotalCb - COLLATERALIZED BORROWING AND LENDINCblo 01/08/16- Mat - 01.08.2016 TotalCash & Cash EquivalentsNet Receivable/payableTotalGrand Total
SECTORAL ALLOCATION
Industrial ProductsConsumer Non DurablesChemicalsConsumer DurablesPharmaceuticalsAuto AncillariesTextile ProductsTransportationAutoIndustrial Capital GoodsPowerSoftwareConstructionPesticidesMedia & EntertainmentPetroleum ProductsOther
12.8%
10.4%
9.7%
9.0%
8.6%
7.3%
7.0%
5.6%
4.0%
3.3%
3.2%
2.8%
2.8%
1.3%
1.0%
1.0%
10.2%
12

Indiabulls Blue Chip Fund(An Open-ended Equity Scheme)
Nifty 50 Index
BENCHMARK
To provide long-term capital appreciation from a portfolio that is invested predominantly in equity and equity-related securities of blue-chip large-cap companies. However there can be no assurance that the investment objective of the scheme will be achieved.
INVESTMENT OBJECTIVE
Mr. Sumit BhatnagarTotal Work Experience: 14 years
FUND MANAGER
10 February 2012
DATE OF ALLOTMENT
Entry Load : Not ApplicableExit Load : 1%, if redeemed/ switched out within 1 year from the date of allotment;Nil, if redeemed/ switched out after 1 year from the date of allotment.
LOAD INFORMATION
` 38.48 Crores
AVG. AUM MONTHLY
` 38.78 Crores
LATEST AUM AS ON MONTH END
Direct PlanGrowth Option Dividend Option
Existing PlanGrowth Option Dividend Option
` 16.64` 14.1
` 15.81` 13.61
LATEST NAV PER UNIT
EXPENSE RATIO
Regular
Direct
2.50%
0.73%
Standard Deviation Beta Sharpe Ratio Portfolio Turnover
PORTFOLIO
Company Name Industry% of
Assets
EQU - EQUITY SHARESHDFC Bank LtdReliance Industries LimitedLarsen & Toubro LimitedMaruti Suzuki India LimitedFortis Healthcare Ltd.Srikalahasthi Pipes LtdTata Motors Limited -DVRInfosys LtdKansai Nerolac Paints LimitedICICI Bank LtdIndusind Bank LtdHousing Development Finance Corporation LimitedHero Motocorp LtdEicher Motors Ltd.Ultratech Cement LtdSanofi India LimitedAsian Paints LtdAurobindo Pharma LimitedNavkar Corporation LimitedCentrum Capital LtdBharat Petroleum Corporation Limited
-Banks
Petroleum ProductsConstruction Project
AutoHealthcare Services
Ferrous MetalsAuto
SoftwareConsumer Non Durables
BanksBanks
FinanceAutoAuto
CementPharmaceuticals
Consumer Non DurablesPharmaceuticals
TransportationFinance
Petroleum Products
-7.07%5.25%5.24%4.91%4.30%4.04%4.00%3.91%3.06%2.92%2.87%2.85%2.81%2.80%2.48%2.34%2.27%2.21%2.21%2.17%2.13%
% of Assets
Oil & Natural Gas Corporation LimitedAditya Birla Nuvo Ltd.State Bank Of IndiaBharat Electronics LimitedThe Ramco Cements LimitedSyngene International LtdBayer Cropscience LtdHCL Technologies Ltd.ITC LimitedPower Grid Corporation of India Ltd.Capital First LimitedHindustan Unilever LimitedArvind LimitedDewan Housing Finance Corp. LtdBritannia Industries LimitedPunjab National BankTotalCash & Cash EquivalentsNet Receivable/payableTotalGrand Total
OilServices
BanksIndustrial Capital Goods
CementPharmaceuticals
PesticidesSoftware
Consumer Non DurablesPower
FinanceConsumer Non Durables
Textile ProductsFinance
Consumer Non DurablesBanks
-2.12%1.97%1.93%1.86%1.84%1.83%1.63%1.54%1.47%1.40%1.21%1.20%1.10%1.09%1.05%0.59%
95.67%
4.33%4.33%
100.00%
QUANTITATIVE/VOLATILITY MEASURES
FUND STYLE
Investment Style
Larg
eM
ediu
mSm
all
Growth Blend Value
Capitalisation
IndustryCompany Name
THIS PRODUCT IS SUITABLE FOR INVESTORS WHO ARE SEEKING*
• Capital appreciation over long-term
• A portfolio that is invested predominantly in equity and
equity-related securities of blue-chip large-cap companies.
• High Risk
*Investors should consult their financial advisers if in doubt about whether the product is suitable for them.
July 2016
SECTORAL ALLOCATION
Banks Consumer Non DurablesFinanceSoftwareCementFerrous MetalsOilIndustrial Capital GoodsPowerOther
15.4%
9.1%
7.3%
5.5%
4.3%
4.0%
2.1%
1.9%
1.4%
4.3%
11
4.5763 0.96180.1327
2.71

SCHEME PERFORMANCE
Indiabulls Liquid Fund(G)
Indiabulls Liquid Fund(G)-Direct Plan
Crisil Liquid Fund Index
Crisil 1 Yr T-Bill Index
Indiabulls Ultra Short Term Fund(G)
Indiabulls Ultra Short Term Fund(G)-Direct Plan
Crisil 1 Yr T-Bill Index
Crisil Liquid Fund Index
Indiabulls ST Fund(G)
Indiabulls ST Fund(G)-Direct Plan
Crisil Short Term Bond Fund Index
Crisil 1 Yr T-Bill Index
Indiabulls Income Fund-Reg(G)
Indiabulls Income Fund(G)-Direct Plan
Crisil Composite Bond Fund Index
Indiabulls Gilt(G)
Indiabulls Gilt(G)-Direct Plan
I-Sec Composite Gilt Index
Crisil 1 Yr T-Bill Index
Indiabulls Arbitrage Fund-Reg(G)
Indiabulls Arbitrage Fund(G)-Direct Plan
Crisil Liquid Fund Index
Crisil 1 Yr T-Bill Index
Indiabulls Value Discovery Fund@
Indiabulls Monthly Income Plan@
Indiabulls Blue Chip Fund(G)
Indiabulls Blue Chip Fund(G)-Direct Plan
NIFTY 50
S&P BSE SENSEX
Last 7 days till
31st July 2016
Last 15 days till
31st July 2016
Last 30 days till
31st July 2016
31st July 2015 till 31st July
2016
Since Inception (CAGR)
Since Inception (Value #)
INR
NAV/Index Value (As of
31st July 2016)
31st July 2013 till 31st July
2016
1,511.78
1,516.91
2,570.65
4,563.63
1,494.86
1,521.49
4,563.63
2,570.65
1,286.51
1,334.78
2,732.08
4,563.63
12.80
13.32
2,662.46
1,391.3049
1,443.1107
8,427.4900
4,563.6252
11.2619
11.3833
2,570.65
4,563.63
N.A.
N.A.
15.81
16.64
8638.50
28051.86
15,117.85
15,169.15
13,472.60
12,961.75
14,948.59
15,214.86
12,961.75
13,472.60
12,865.14
13,347.83
13,117.71
12,550.47
12,800.70
13,316.70
13,652.94
13,913.05
14,431.11
13,883.95
12,975.24
11,261.90
11,383.30
11,347.46
11,321.84
N.A.
N.A.
15,810
16,640
14,516
14,326
8.9075
9.0169
8.9057
8.2459
9.1651
9.7726
8.2188
8.9093
N.A.*
N.A.*
9.8987
8.2188
8.6676
9.9288
10.7093
10.0245
11.1079
11.0529
8.2188
N.A.
N.A.
N.A.
N.A.
N.A.
N.A.
15.0788
16.8319
13.9805
12.6949
8.1954
8.3035
7.8262
7.6150
8.4788
9.1708
7.6243
7.8349
9.4029
10.8664
9.3642
7.6243
8.7736
10.1105
11.4514
13.3771
14.2337
12.1406
7.6243
6.8183
7.5557
7.8349
7.6243
N.A.
N.A.
3.8765
5.9198
3.1457
1.7720
7.4772
7.5782
7.3204
7.7769
9.6144
10.1253
7.8955
7.7238
10.0307
11.0436
15.4454
7.8955
18.0960
18.6173
29.1331
46.2227
47.0505
29.9138
7.8955
N.A.
N.A.
N.A.
N.A.
N.A.
N.A.
N.A.
N.A.
N.A.
N.A.
7.3758
7.4767
6.9446
6.9571
8.8197
9.3296
7.1827
6.9667
9.4923
10.5034
13.5313
7.1827
18.0975
18.5966
26.5822
55.8558
56.6824
28.2716
7.1827
N.A.
N.A.
N.A.
N.A.
N.A.
N.A.
N.A.
N.A.
N.A.
N.A.
7.3037
7.4048
6.5497
7.5259
9.0188
9.5300
7.5300
6.5133
10.4892
11.4931
15.0182
7.5300
25.2960
25.7739
33.0917
50.1984
51.0269
35.0318
7.5300
N.A.
N.A.
N.A.
N.A.
N.A.
N.A.
N.A.
N.A.
N.A.
N.A.
9.0511
8.9118
8.6735
7.5076
9.2076
9.4850
7.5195
8.6873
9.1527
10.4951
9.8831
8.2090
7.5198
8.7748
9.5662
9.7471
10.8829
9.6745
7.6051
7.6559
8.3748
8.1484
7.9972
N.A.
N.A.
10.7946
13.1158
10.9779
10.5695
Funds Managed by Mr. Malay Shah
Notes:
NA - Not Applicable
Returns shown for 7 days, 15 days and 30 days are computed only for Indiabulls Liquid Scheme on Simple Annualised basis, Greater than/ equal to 1 year
returns are Compounded Annualised Returns (CAGR). Past performance may or may not be sustained in future.
# Based on investment of Rs. 10,000 made at inception. All returns are for Growth Option only. Since inception returns have been calculated from the date of
allotment till July 31, 2016
* Since Indiabulls Short Term Fund is in existence for less than 3 years, scheme returns for the period 31st July 2013 till 31st July 2016 is not required.
@Since Indiabulls Value Discovery Fund and Indiabulls Monthly Income Plan have been in existence for less than 1 year as on 31st July, 2016, past
performance has not been provided.
Period
July 2016
Funds Managed by Mr. Sumit Bhatnagar & Mr. Malay Shah
Funds Managed by Mr. Sumit Bhatnagar
13

SCHEME PERFORMANCE
SIP RETURNS - Indiabulls Blue Chip Fund - Regular Plan (Growth Option)
Period
Total Amount Invested (Rs.)
Total Value as on July 31, 2016 (Rs.)
Returns (In %)
Total Value of S&P BSE Sensex
S&P BSE Sensex Returns (In %)
Total Value of Nifty 50
Nifty 50 Returns (In %)
1-year 3-year 5-year 7-year 10-year Since Inception
120,000
130,801
9.00
129,632
8.03
131,102
9.25
360,000
435,550
20.99
409,421
13.73
419,325
16.48
600,000
N.A.
N.A.
N.A.
N.A.
N.A.
N.A.
840,000
N.A.
N.A.
N.A.
N.A.
N.A.
N.A.
1,200,000
N.A.
N.A.
N.A.
N.A.
N.A.
N.A.
530,000
704,732
32.97
669,319
26.29
683,243
28.91
N.A. - Not Applicable
The above table indicates the results for the scenario of an investor who would have invested Rs. 10,000 every month in Indiabulls Blue Chip Fund - Regular Plan (Growth Option) & Indiabulls Arbitrage Fund - Regular Plan (Growth Option)
Note: Past performance may or may not be sustained in future. Returns greater than 1 year period are compounded annualized. Dividends assumed to be reinvested.
Load is not taken into consideration. On account of difference in the type/category, asset allocation or investment strategy, inception dates, performances of thesefunds are not strictly comparable.
Since Indiabulls Value Discovery Fund has been in existence for less than 1 year as on July 31, 2016, past performance has not been provided.
July 2016
SIP Returns - Indiabulls Arbitrage Fund - Regular Plan (Growth Option)
Period
Total Amount Invested (Rs.)
Total Value as on July 31, 2016 (Rs.)
Returns (In %)
Total Value of Crisil Liquid Fund Index
Crisil Liquid Fund Index Returns (In %)
1-year 3-year 5-year 7-year 10-year Since Inception
120,000
124,324
3.60
125,062
4.22
360,000
N.A.
N.A.
N.A.
N.A.
600,000
N.A.
N.A.
N.A.
N.A.
840,000
N.A.
N.A.
N.A.
N.A.
1,200,000
N.A.
N.A.
N.A.
N.A.
190,000
201,102
5.84
202,567
6.61
14

DIVIDEND HISTORY
INDIABULLS VALUE DISCOVERY FUND No Dividend has been declared in this scheme
July 2016
INDIABULLS MONTHLY INCOME PLAN No Dividend has been declared in this scheme
15
INDIABULLS LIQUID FUND - MONTHLY OPTION
` 1000
` 1000
` 1000
` 1,029.3612
` 1,029.3612
` 1,029.3612
` 4.7863
` 4.8496
` 4.8941
Face ValueRecord Date
01-08-2016
01-07-2016
01-06-2016
` 4.5875
` 4.6510
` 4.7045
` 1,000.8667
` 1,000.8667
` 1,000.8667
RegularDirectRegular DirectNAV Dividend/Unit
` 1000
` 1000
` 1000
` 1,008.2032
` 1,008.2553
` 1,007.4681
` 5.5486
` 5.4573
` 4.9734
Face ValueRecord Date
25-07-2016
27-06-2016
25-05-2016
` 5.3066
` 5.1962
` 4.7428
` 1,008.2384
` 1,008.2635
` 1,007.5232
RegularDirectRegular DirectNAV Dividend/Unit
` 1000
` 1000
` 1000
` 1,017.7813
` 1,018.1173
` 1,016.6913
` 6.0039
` 6.0695
` 5.1406
25-07-2016
27-06-2016
25-05-2016
` 5.4352
` 5.4132
` 4.5371
` 1,017.1921
` 1,017.4068
` 1,016.0539
RegularDirectRegular DirectDividend/Unit
INDIABULLS BLUE CHIP FUND - DIVIDEND HISTORY
` 10.00 ` 14.4600 ` 2.2500
Face ValueRecord Date
23-03-2016 ` 1.9000` 13.8200
RegularDirectRegular DirectNAV Dividend/Unit
Pursuant to payment of dividend, the NAV of the scheme will fall to the extent of dividend distribution and statutory levy (if any). Past performance may or may not be sustained in future.
DIVIDEND HISTORY
INDIABULLS LIQUID FUND
Pursuant to payment of dividend, the NAV of the scheme will fall to the extent of dividend distribution and statutory levy (if any). Past performance may or may not be sustained in future.
INDIABULLS ULTRA SHORT-TERM FUND
Pursuant to payment of dividend, the NAV of the scheme will fall to the extent of dividend distribution and statutory levy (if any). Past performance may or may not be sustained in future.
INDIABULLS SHORT-TERM FUND
Pursuant to payment of dividend, the NAV of the scheme will fall to the extent of dividend distribution and statutory levy (if any). Past performance may or may not be sustained in future.
INDIABULLS INCOME FUND
INDIABULLS BLUE CHIP FUND
Pursuant to payment of dividend, the NAV of the scheme will fall to the extent of dividend distribution and statutory levy (if any). Past performance may or may not be sustained in future.
INDIABULLS ARBITRAGE FUND
INDIABULLS VALUE DISCOVERY FUND No Dividend has been declared in this scheme
Pursuant to payment of dividend, the NAV of the scheme will fall to the extent of dividend distribution and statutory levy (if any). Past performance may or may not be sustained in future.
INDIABULLS GILT FUND
July 2016
INDIABULLS MONTHLY INCOME PLAN No Dividend has been declared in this scheme
15
DIVIDEND HISTORY - MONTHLY OPTION (EXISTING PLAN)
` 1000
` 1000
` 1000
` 1,029.3612
` 1,029.3612
` 1,029.3612
` 4.7863
` 4.8496
` 4.8941
Face ValueRecord Date
01-08-2016
01-07-2016
01-06-2016
` 4.5875
` 4.6510
` 4.7045
` 1,000.8667
` 1,000.8667
` 1,000.8667
RegularDirectRegular DirectNAV Dividend/Unit
DIVIDEND HISTORY - MONTHLY OPTION (EXISTING PLAN)
` 1000
` 1000
` 1000
` 1,008.2032
` 1,008.2553
` 1,007.4681
` 5.5486
` 5.4573
` 4.9734
Face ValueRecord Date
25-07-2016
27-06-2016
25-05-2016
` 5.3066
` 5.1962
` 4.7428
` 1,008.2384
` 1,008.2635
` 1,007.5232
RegularDirectRegular DirectNAV Dividend/Unit
DIVIDEND HISTORY - MONTHLY OPTION (EXISTING PLAN)
` 1000
` 1000
` 1000
` 1,017.7813
` 1,018.1173
` 1,016.6913
` 6.0039
` 6.0695
` 5.1406
Face ValueRecord Date
25-07-2016
27-06-2016
25-05-2016
` 5.4352
` 5.4132
` 4.5371
` 1,017.1921
` 1,017.4068
` 1,016.0539
RegularDirectRegular DirectNAV Dividend/Unit
DIVIDEND HISTORY - MONTHLY OPTION (EXISTING PLAN)
` 1000
` 1000
` 1000
` 10.6888
` 10.6462
` 10.6330
` 0.0918
` 0.0582
` 0.0482
Face ValueRecord Date
25-07-2016
27-06-2016
25-05-2016
` 0.0867
` 0.0534
` 0.0440
` 10.4323
` 10.3901
` 10.3776
RegularDirectRegular DirectNAV Dividend/Unit
DIVIDEND HISTORY - MONTHLY OPTION (EXISTING PLAN)
` 1000
` 1000
` 1000
` 1,085.6120
` 1,051.0680
` 1,024.1240
-
-
-
Face ValueRecord Date
25-07-2016
27-06-2016
28-03-2016
` 23.2816
` 20.6020
` 17.4577
` 1,072.5510
` 1,067.8654
` 1,066.6307
RegularDirectRegular DirectNAV Dividend/Unit
DIVIDEND HISTORY
` 1000 ` 14.4600 ` 2.2500
Face ValueRecord Date
23-03-2016 ` 1.9000` 13.8200
RegularDirectRegular DirectNAV Dividend/Unit
DIVIDEND HISTORY
` 1000
` 1000
` 1000
` 10.5425
` 10.5323
` 10.5040
` 0.0500
` 0.0500
` 0.0500
Face ValueRecord Date
26-07-2016
28-06-2016
24-05-2016
` 0.0500
` 0.0500
` 0.0500
` 10.4271
` 10.4222
` 10.4007
RegularDirectRegular DirectNAV Dividend/Unit
INDIABULLS ARBITRAGE FUND - DIVIDEND HISTORY
` 10.00
` 10.00
` 10.00
` 10.5425
` 10.5323
` 10.5040
` 0.0500
` 0.0500
` 0.0500
Face ValueRecord Date
26-07-2016
28-06-2016
24-05-2016
` 0.0500
` 0.0500
` 0.0500
` 10.4271
` 10.4222
` 10.4007
RegularDirectRegular DirectNAV Dividend/Unit
For all above Pursuant to payment of dividend, the NAV of the scheme will fall to the extent of dividend distribution and statutory levy (if any). Past performance may or may not be sustained in future.
` 10.00
` 10.00
` 10.00
` 10.6888
` 10.6462
` 10.6330
` 0.0918
` 0.0582
` 0.0482
Face ValueRecord Date
25-07-2016
27-06-2016
25-05-2016
` 0.0867
` 0.0534
` 0.0440
` 10.4323
` 10.3901
` 10.3776
RegularDirectRegular DirectNAV Dividend/Unit
` 10.00
` 10.00
` 10.00
` 10.1411
` 10.1408
` 10.0000
` 0.2178
` 0.2792
` 0.1513
Face ValueRecord Date
25-03-2015
26-12-2014
25-09-2014
` 0.2323
` 0.2726
` 0.1331
` 10.4095
` 10.4401
` 10.2953
RegularDirectRegular DirectNAV Dividend/Unit
INDIABULLS INCOME FUND- QUARTERLY OPTION
` 10.00
` 10.00
` 10.00
` 10.1168
` 10.0000
` 10.0000
` 0.5226
` 0.4509
` 0.2218
Face ValueRecord Date
25-03-2015
25-09-2014
25-03-2014
` 0.5008
` 0.4011
` 0.1199
` 10.1073
` 10.0000
` 10.0000
RegularDirectRegular DirectNAV Dividend/Unit
INDIABULLS INCOME FUND - HALF YEARLY OPTION
INDIABULLS INCOME FUND - MONTHLY OPTION
INDIABULLS ULTRA SHORT-TERM FUND - MONTHLY OPTION
INDIABULLS SHORT-TERM FUND - MONTHLY OPTION
Face ValueRecord DateNAV
` 1,085.6120
` 1,051.0680
` 1,024.1240
-
-
-
Face ValueRecord Date
` 23.2816
` 20.6020
` 17.4577
` 1,072.5510
` 1,067.8654
` 1,066.6307
RegularDirectRegular DirectNAV Dividend/Unit
INDIABULLS GILT FUND - MONTHLY OPTION
25-07-2016
27-06-2016
28-03-2016
` 1000
` 1000
` 1000

Mutual Fund Investments are subject to market risks, read all scheme related documents carefully.
Indiabulls Asset Management Company LimitedCIN: U65991DL2008PLC176627
Registered Office:M - 62 & 63, 1st Floor, Connaught Place, New Delhi - 110 001. Tel: (011) 3025 2900; Fax: (011) 3025 2901Corporate Office:Indiabulls Finance Centre Tower - 1, 11th Floor, Senapati Bapat Marg, Elphinstone West, Mumbai 400 013. Tel: (022) 6189 1300; Fax: (022) 6189 1320
Call: 1800-2666-002 SMS: ‘IBAMC’ to 56161Email: [email protected] Website: www.indiabullsamc.com
AMC Branches:Ahmedabad: Radhika House, 1st Floor, C/o. Indiabulls Housing Finance Co Ltd., Opp. Mayor Banglow, Law Garden, Navrangpura, Ahmedabad - 380 006. Tel: (079) 3048 4589Bangalore: No. 103, 2nd Floor, Samskruthi Chambers, K. H. Road, Bangalore – 560 027 Tel: (080) 4635 1522Chennai: No. 20, Apex Chambers, 3rd Floor, Sir Theyagaraya Road, Pondy Bazaar, T Nagar, Chennai - 600 017. Tel: (044) 3007 0779Hyderabad: Park City Plaza, 3rd Floor, Road No. 1, Banjara Hills, Hyderabad – 500 034. Tel: (040) 4757 9911.Kolkata: Constantia Building, Ground Floor, 11, Dr. U. N. Brahmchari Street I, Kolkata – 700 017. Tel: (033) 3997 4717.Mumbai: Indiabulls Finance Centre, Tower – 1, 11th Floor, Senapati Bapat Marg, Elphinstone (West), Mumbai – 400 013. Tel: : (022) 6189 1300.New Delhi: M - 62 & 63, 1st Floor, Connaught Place, New Delhi - 110 001. Tel: (011) 3015 6974.Pune: No. 115, City Mall, 1st Floor, University Road, Opp. Pride House, Shivajinagar, Pune – 411 007. Tel: (020) 3018 6714.
^CRISIL Disclaimer: A CRISIL credit quality rating on a bond fund reflects CRISIL's current opinion on the degree of protection offered by the rated instrument from losses related to credit defaults. It does not constitute an audit by CRISIL of the fund house, the scheme, or companies in the scheme's portfolio. CRISIL ratings are based on information provided by the issuer or obtained by CRISIL from sources it considers reliable. CRISIL does not guarantee the completeness or accuracy of the information on which the rating is based. A CRISIL rating is not a recommendation to buy, sell or hold the rated scheme: it does not comment on the market price or suitability for a particular investor. All CRISIL ratings are under surveillance. CRISIL reserves the right to suspend, withdraw or revise its rating at any time, on the basis of any new information or unavailability of information or any other circumstances, which CRISIL believes may have an impact on the rating. For the latest rating information on any instrument of any company rated by CRISIL, please contact CRISIL RATlNG DESK at [email protected] or at (+91 22) 3342 3001- 09.
^^CARE Disclaimer: CARE’s fund credit quality rating is not a recommendation to purchase, sell or hold a security / fund. It neither comments on the current market price, suitability for a particular investor nor on the prospective performance of the fund with respect to appreciation, volatility of net asset value (NAV), or yield of the fund. The ratings do not address the funds ability to meet the payment obligations to the investors. The ratings are based on current information furnished to CARE by the issuer or obtained by CARE from sources it considers reliable. CARE does not, however, guarantee the accuracy, adequacy or completeness of any information and is not responsible for any errors or omissions or for the results obtained from the use of such information. CARE does not perform an audit in connection with any rating and may, on occasion, rely on unaudited information. The ratings may be changed, suspended or withdrawn as a result of changes in, or unavailability of, such information, or based on other circumstances. Funds rated by CARE have paid a rating fee.