Embed Size (px)
Citation preview

ROOT Lecture 6Functions and Fitting
It still runs ROOT!!

Lecture 5Ntuples and Trees
Exercise 1)
Download the root-file on the website:http://kvir03.kvi.nl/rootcourse/.
Inside you’ll find a tree containing histograms and an arrayof Double_t’s. Write a macro that draws the histogram ofthe third entry and prints the values of the array.

WARNING
The root-file is made with ROOT version 4.03. Thosewho are trying to open this file using an older versionof ROOT will likely encounter problems.
ROOT is - in general - NOT downwards compatible!

new TBrowser

new TBrowser

new TBrowser

new TBrowser

{ gROOT->Reset(); TFile *f = new TFile("Lec5Ex1.root"); TTree *mytree = f->Get("mytree");
// Declaration of leaves types TH1D* histo = NULL; Double_t array[5];
// Set branch addresses. mytree->SetBranchAddress("histoBranch",&histo); mytree->SetBranchAddress("arrayBranch",&array);
Int_t nentries = mytree->GetEntries();
// Loop over all entries for (Int_t i=0; i<nentries;i++) { mytree->GetEntry(i); cout << i << “ “ << array[0] << “/” << array[1] << “/” << array[2] << “/” << array[3] << “/” << array[4] << endl; if (i==2) histo->Draw(); }}
myMacro.C

root [1] .x myMacro.C0 1/50/20/0/01 1/-0.0045516/0/0/02 1/64.4/0.4/4.4/0.223 1/0.015528/2.5/0.227273/4.54545root [4]

Lecture 5Ntuples and Trees
Exercise 2)
Download the ascii file from the root-course website andconvert it into an Ntuple. Make a 2D histogram with thesecond value on the x-axis and the fourth on the y-axis.Plot it with a smooth surface and label the axes. Send methe postscript file of this plot….

{ gROOT->Reset();#include "Riostream.h"
ifstream in; in.open("/Users/messchendorp/Desktop/Lec5Ex2.dat");
Float_t v1,v2,v3,v4,v5; Int_t nlines = 0; TNtuple *ntuple = new TNtuple("ntuple","Ntuple example","v1:v2:v3:v4:v5");
while (1) { in >> v1 >> v2 >> v3 >> v4 >> v5; if (!in.good()) break; ntuple->Fill(v1,v2,v3,v4,v5); nlines++; } printf(" found %d points\n",nlines);
in.close();}
Macro “basic.C” :derived from tutorials of ROOT

root [1] .x basic.C found 10000 pointsroot [2] ntuple->Draw(“v4:v2>histo”,””,”cont4”)root [3] histo->GetXaxis()->SetTitle(”value v2")root [4] histo->GetYaxis()->SetTitle(”value v4")root [5] c1->Update()

Lecture 6Functions and Fitting

1-Dim Function Class TF1class TF1 : public TFormula, public TAttLine, public TAttFill, public TAttMarker
Class Description
A TF1 object is a 1-Dim function defined between a lower and upper limit. The function may be a simple function or a precompiled user function. The function may have associated parameters.
The following types of functions can be created:
A- Expression using variable x and no parameters
B- Expression using variable x with parameters
C- A general C function with parameters

TF1 with “simple” expressions TF1(const char* name, const char* formula, Double_t xmin=0, Double_t xmax=1)
Examples :
root [1] TF1 *f = new TF1(“myfunc”, ”x*sin(x)”, 0., 6.3)
root [2] f->Draw()

TF1 with “simple” expressions TF1(const char* name, const char* formula, Double_t xmin=0, Double_t xmax=1)
Examples :
root [1] TF1 *f = new TF1(“myfunc”, ”TMath::BreitWigner(x,0,1)”, -3, 3)
root [2] f->Draw()
TMath Class contains avariety of encapsulatedmathematical functions andconstants, accessible via
TMath::Function(…)

TF1 with “simple” expressions TF1(const char* name, const char* formula, Double_t xmin=0, Double_t xmax=1)
Examples :
root [1] TF1 *f1 = new TF1(“myf1”,”sin(0.01745*x)”, 0, 360)
root [2] TF1 *f2 = new TF1(“myf2”,”0.5*myf1”, 0, 360)
root [3] f1->SetLineColor(kBlue)
root [4] f2->SetLineColor(kRed)
root [5] f1->Draw()
root [6] f2->Draw(“SAME”)

TF1 with parameters TF1(const char* name, const char* formula, Double_t xmin=0, Double_t xmax=1)
Examples :
root [1] TF1 *f = new TF1(“myfunc”,”[0]*sin([1]*x)”, 0, 6.3)
root [2] f->SetParameter(0, 1.0)
root [3] f->SetParameter(1, 2.0)
root [4] f->SetParName(0, “Amplitude”)
root [5] f->SetParName(1, “Frequency”)
root [6] f->Draw()

TF1 with user-defined function TF1(const char* name, void* fcn, Double_t xmin, Double_t xmax, Int_t npar)
Double_t fcn(Double_t *x, Double_t *param)
Example :Double_t myFunction(Double_t *x, Double_t *par){ return (par[0]*sin(par[1]*x[0]);} testFunction.c
root [1] .L testFunction.c
root [2] TF1 *f = new TF1(“myfunc”, myFunction, 0, 6.3, 2)
root [3] f->SetParameter(0, 1.0); f->SetParameter(1, 2.0)

Pre-defined 1-Dim functions
expo - exp([0]+[1]*x)gaus - [0]*exp(-0.5*((x-[1])/[2])**2)gausn- [0]*exp(-0.5*((x-[1])/[2])**2)/(sqrt(2*pi)*[2]))polN - [0]+[1]*x+[2]*x**2+…+[N]*x**N

Beyond 1-Dim functions
class TF2 : public TF1
class TF3 : public TF2
2-Dim functions
3-Dim functions
Example :root [1] TF2 *f = new TF2(“myfunc”,”sin(x)*cos(y)”, 0, 6.3, 0, 6.3)
root [2] f->Draw(“surf3”)

Things you can do with TFn objectsWhat? How?
Draw f->Draw()Print f->Print()Evaluate values f->Eval(1.4)Integrate f->Integral(0.2,1.7)Differentiate f->Derivative(0.4)Change line attributes f->SetLineColor(kRed)
f->SetLineStyle(2)f->SetLineWidth(1)
Set titles and axis f->SetTitle(“My Function”)f->GetXaxis()->SetTitle(“x-axis”)f->GetYaxis()->SetTitle(“y-axis”)
Set parameters and names f->SetParameters(1,4)f->SetParNames(“par1”,”par2”)
Set ranges f->SetRange(0,10)
……… (many more)

Things you can do with TFn objects
…. and use for Fitting!!

A couple of words about FittingFitting in a nut-shell:
A mathematical procedure to find parameter values ofa TFn function, f, describing the best your histogram orgraph (x,y). The most commonly used criteria for anoptimum fit is to minimize the χ2-function:
…but there is much much more to fitting and statisticaldata analysis, which fills a course by itself…
Thumb rule for Goodness of Fit: χ2/NDF ~ 1

Fitting a histogram (professor style)
Minimum χ2-fit with pre-defined TF1 function expo (2 parameters)

Minimum χ2-fit with pre-defined TF1 function expo (2 parameters)
Fitting a histogram (professor style)

Fitting a histogram TH1::Fit(const char* fname, Option_t* option, Option_t* goption, Axis_t xmin, Axis_t xmax)
fname - function nameoption - Fitting options:
"W" Set all errors to 1 "I" Use integral of function in bin instead of value at bin center "L" Use Loglikelihood method (default is chisquare method) "LL" Use Loglikelihood method and bin contents are not integers) "U" Use a User specified fitting algorithm (via SetFCN) "Q" Quiet mode (minimum printing) "V" Verbose mode (default is between Q and V) "E" Perform better Errors estimation using Minos technique "B" Use this option when you want to fix one or more parameters and the fitting function is like "gaus","expo","poln","landau". “M" More. Improve fit results "R" Use the Range specified in the function range "N" Do not store the graphics function, do not draw "0" Do not plot the result of the fit. "+" Add this new fitted function to the list of fitted functions.
goption - Graphical optionsxmin-xmax - Fitting range

Fitting a histogramAn example
Q: Find the position, width, and strength of the signal !
Signal of interest
Background

Fitting a histogramAn example
Gaussian with 3 parameters: gaus
Signal of interest
0-order polyn.+exp., 3 parameters: pol0 + expo(1)
Background
6 parameters:gaus + pol0(3) + expo(4)
Signal + Background
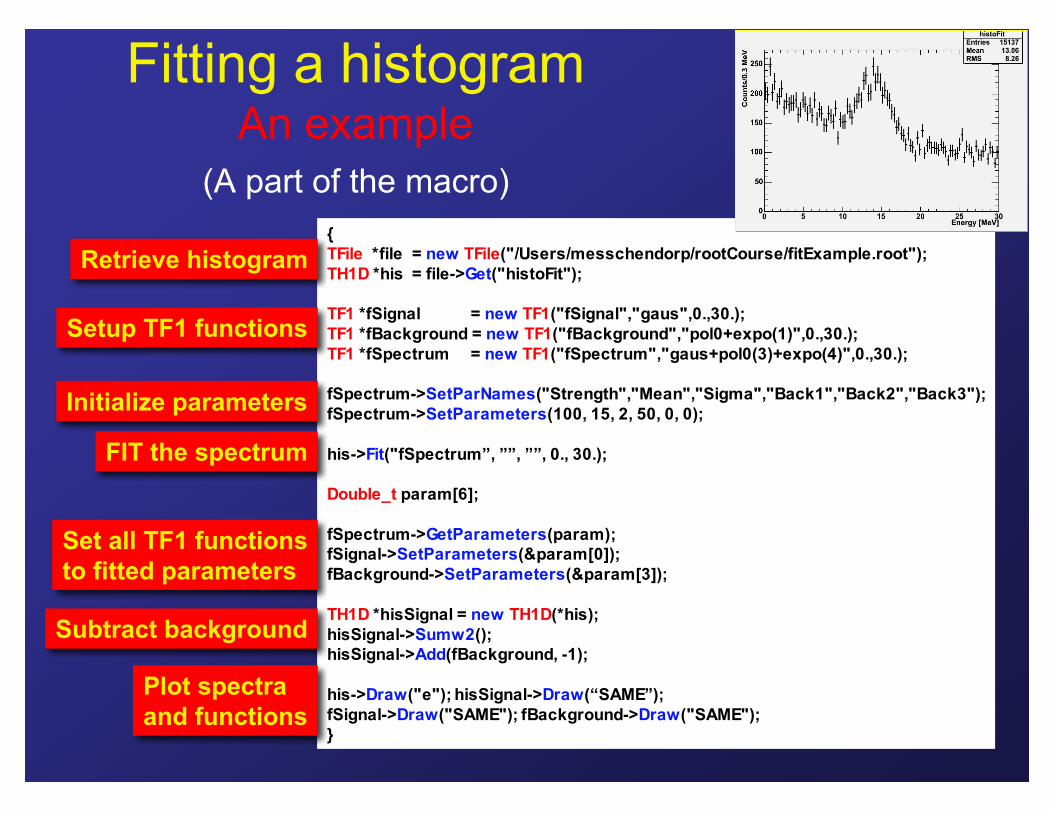
{TFile *file = new TFile("/Users/messchendorp/rootCourse/fitExample.root");TH1D *his = file->Get("histoFit");
TF1 *fSignal = new TF1("fSignal","gaus",0.,30.);TF1 *fBackground = new TF1("fBackground","pol0+expo(1)",0.,30.);TF1 *fSpectrum = new TF1("fSpectrum","gaus+pol0(3)+expo(4)",0.,30.);
fSpectrum->SetParNames("Strength","Mean","Sigma","Back1","Back2","Back3");fSpectrum->SetParameters(100, 15, 2, 50, 0, 0);
his->Fit("fSpectrum”, ””, ””, 0., 30.);
Double_t param[6];
fSpectrum->GetParameters(param);fSignal->SetParameters(¶m[0]);fBackground->SetParameters(¶m[3]);
TH1D *hisSignal = new TH1D(*his);hisSignal->Sumw2();hisSignal->Add(fBackground, -1);
his->Draw("e"); hisSignal->Draw(“SAME”);fSignal->Draw("SAME"); fBackground->Draw("SAME");}
FIT the spectrum
Set all TF1 functionsto fitted parameters
Subtract background
Plot spectra and functions
Setup TF1 functions
Initialize parameters
Fitting a histogramAn example
Retrieve histogram
(A part of the macro)

Fitting a histogramAn example
The result…

Access to Fit Parameters and ResultsBy default: Fitting a histogram makes the associatedfit function a part of the histogram object. The functionand therefore the results of the fit can be accessed viaTH1::GetFunction() method.
Example:
root [1] his->Fit(“fSpectrum”);root [2] TF1 *fitResult = his->GetFunction(“fSpectrum”);root [3] fitResult->GetParameter(1);(const Double_t)1.41112959451275266e+01root [4] fitResult->GetParError(1);(const Double_t)1.11549835948657111e-01root [5] fitResult->GetChisquare();(const Double_t)8.86253580822090470e+01root [6] fitResult->GetNDF();(const Int_t) 94

Fitting more than 1 functionMore than one TFn fit-function can be stored in yourhistogram using option: TH1::Fit(fitFunc,”+”,…).
Example:
root [1] TF1 *fSpectrum=new TF1("fSpectrum","gaus+pol0(3)+expo(4)",0.,30.);root [2] TF1 *fSpectrum2=new TF1("fSpectrum2","gaus+pol1(3)",0.,30.);root [3] …root [7] his->Fit(“fSpectrum”);root [8] his->Fit(“fSpectrum2”,”+”);root [9] his->GetFunction(“fSpectrum”)->SetLineColor(kBlue);root [10] his->GetFunction(“fSpectrum2”)->SetLineColor(kRed);root [11] his->Draw();

Useful fitting-related methodsWhat? How?
Perform a fit TH1::Fit(“fitFunction”,..)Obtain the fitted TF1 function TH1::GetFunction(“fitFunction”)Get Nr of parameters TF1::GetNpar()Set fit parameters TF1::SetParameter(parNo,value)
TF1::SetParameters(val1,val2,…)Get fit parameters TF1::GetParameter(parNo)
TF1::GetParameters(parArray)Set parameter errors TF1::SetParError(parNo,value)
TF1::SetParErrors(val1,val2,…)Get parameter errors TF1::GetParError(parNo)
TF1::GetParErrors(eParArray)Get χ2 of fit TF1::GetChisquare()Get Nr of Degrees of Freedom TF1::GetNDF()Fix a parameter TF1::FixParameter(parNo)Limit parameter range TF1::SetParLimits(parNo,min,max)
……… (many more)

Beyond fitting histograms…
Graphs: TGraph::Fit(…)identical to TH1::Fit(…)
Ntuples/Trees: TTree::Fit(…)TTree::UnbinnedFit(…)
Most general minimalization TMinuit/TFitterpackage: (derived from PACKLIB)
Neural Networks: TMultiLayerPerceptron

Exercises for Lecture 6Exercise 1)
Download the root-file on the website:http://kvir03.kvi.nl/rootcourse/.Inside you’ll find a 1-Dim histogram showing a Gaussiandistributed signal on top of a - to-be determined -background signal. Write a macro that fits this spectrumusing a user-defined function.
Exercise 2)
Figure out how to obtain the error matrix (i.e. the co-variance matrix) of thefit performed in Exercise 1. Hint: Explore the global gMinuit instance afterfitting.
Send your results to [email protected]