Embed Size (px)
Citation preview

University of Kentucky University of Kentucky
UKnowledge UKnowledge
Theses and Dissertations--Chemical and Materials Engineering Chemical and Materials Engineering
2007
FUNCTIONALIZED POLYMERIC MEMBRANES FOR FUNCTIONALIZED POLYMERIC MEMBRANES FOR
BIOSEPARATION AND BIOCATALYSIS BIOSEPARATION AND BIOCATALYSIS
Saurav Datta University of Kentucky, [email protected]
Right click to open a feedback form in a new tab to let us know how this document benefits you. Right click to open a feedback form in a new tab to let us know how this document benefits you.
Recommended Citation Recommended Citation Datta, Saurav, "FUNCTIONALIZED POLYMERIC MEMBRANES FOR BIOSEPARATION AND BIOCATALYSIS" (2007). Theses and Dissertations--Chemical and Materials Engineering. 26. https://uknowledge.uky.edu/cme_etds/26
This Doctoral Dissertation is brought to you for free and open access by the Chemical and Materials Engineering at UKnowledge. It has been accepted for inclusion in Theses and Dissertations--Chemical and Materials Engineering by an authorized administrator of UKnowledge. For more information, please contact [email protected].

STUDENT AGREEMENT: STUDENT AGREEMENT:
I represent that my thesis or dissertation and abstract are my original work. Proper attribution
has been given to all outside sources. I understand that I am solely responsible for obtaining
any needed copyright permissions. I have obtained needed written permission statement(s)
from the owner(s) of each third-party copyrighted matter to be included in my work, allowing
electronic distribution (if such use is not permitted by the fair use doctrine) which will be
submitted to UKnowledge as Additional File.
I hereby grant to The University of Kentucky and its agents the irrevocable, non-exclusive, and
royalty-free license to archive and make accessible my work in whole or in part in all forms of
media, now or hereafter known. I agree that the document mentioned above may be made
available immediately for worldwide access unless an embargo applies.
I retain all other ownership rights to the copyright of my work. I also retain the right to use in
future works (such as articles or books) all or part of my work. I understand that I am free to
register the copyright to my work.
REVIEW, APPROVAL AND ACCEPTANCE REVIEW, APPROVAL AND ACCEPTANCE
The document mentioned above has been reviewed and accepted by the student’s advisor, on
behalf of the advisory committee, and by the Director of Graduate Studies (DGS), on behalf of
the program; we verify that this is the final, approved version of the student’s thesis including all
changes required by the advisory committee. The undersigned agree to abide by the statements
above.
Saurav Datta, Student
Dr. D. Bhattacharyya, Major Professor
Dr. B. Knutson, Director of Graduate Studies

ABSTRACT OF DISSERTATION
Saurav Datta
The Graduate School
University of Kentucky
2007

FUNCTIONALIZED POLYMERIC MEMBRANES FOR BIOSEPARATION AND BIOCATALYSIS
ABSTRACT OF DISSERTATION
A dissertation submitted in partial fulfillment of the
requirements for the degree of Doctor of Philosophy in the College of Engineering
at the University of Kentucky
By Saurav Datta
Lexington, Kentucky
Director: Dr. Dibakar Bhattacharyya, Alumni Professor of Chemical Engineering
Lexington, Kentucky
2007 Copyright © Saurav Datta 2007

ABSTRACT OF DISSERTATION
FUNCTIONALIZED POLYMERIC MEMBRANES
FOR BIOSEPARATION AND BIOCATALYSIS
Functionalized polymeric membrane based techniques are becoming increasingly
popular in biotechnology, food and pharmaceutical industries due to their versatility and hydrodynamic benefits over traditional materials and methods. This research work has been directed towards the development of functionalized polymeric membranes, extensive experimental and theoretical analyses of some of the fundamental aspects of accessibility, membrane fouling and enzyme catalysis, and applications in affinity based bioseparation and biocatalysis. In this research work, the impact of different types of functionalization techniques, such as functionalization of different membrane materials, covalent and electrostatic immobilization, on interaction of various biomolecules and active sites in membrane has been studied in detail.
Avidin was used as model biomolecule, and covalently immobilized within acyl
anhydride derivatized nylon based membrane. Quantification of the accessibility of covalently immobilized avidin sites was carried out by model biotinylated probe molecules, such as biotin 4-amidobenzoic acid and biotinylated-BSA. This study has been further extended to separate and purify a target protein, HIV-Tat, from a complex mixture of proteins (97-99 % unwanted protein) using avidin-biotin affinity interaction. It has been demonstrated that covalent immobilization of avidin in membranes reduces the accessibility of active sites for probe molecules. Accessibility decreases further for the biotinylated target protein present in the mixture of other unwanted proteins. Affinity based membrane separation of proteins is also associated with decrease in permeate flux due to fouling in membrane structure. Fouling in the membrane has been discussed by analyzing the characteristics of adsorbed protein layer in membrane.
In order to improve the accessibility and fouling behavior of affinity separation of
Tat protein, a pre-filtration step has been introduced prior to affinity separation. Significant enhancement in accessibility and reduction in fouling has been observed for pre-filtered cases as it removes unwanted proteins prior to affinity interaction. Contribution of the pre-filtration step in reduction of fouling has been elucidated by

simple model equations. Improvement in accessibility and fouling behavior reflects in higher separation efficiency (protein recovery) and lower processing time for the pre-filtered cases. Quality of membrane purified Tat protein was examined by different analytical techniques, such as SDS-PAGE, Western Blot and biotin analysis, and then compared with that purified by traditional packed-bead column chromatography. It has been demonstrated that membrane based technique was able to isolate superior quality of pure monomeric Tat protein compare to column chromatographic technique.
The other study carried out as a part of this dissertation, has involved
development of high capacity, highly active, stable and reusable functionalized membrane domains for electrostatic immobilization of enzymes. Glucose oxidase (GOX) was used as a model enzyme to study the oxidation of glucose to gluconic acid and hydrogen peroxide under convective flow condition. Two different approaches of functionalization of membranes have been presented. In the first approach, alternative electrostatic attachment of cationic and anionic polyelectrolytes was carried out using Layer-By-Layer (LBL) assembly technique within a functionalized nylon based membrane. In the second one, a hydrophobic PVDF membrane was functionalized by in-situ polymerization of acrylic acid. Kinetics of glucose oxidation, effect of pH and flow rate on the activity of GOX was discussed. A comparative study was presented between the activity of free GOX, electrostatically immobilized GOX and covalently immobilized GOX, along with the advantage of convective mode of operation over soaking mode. A novel study has also been conducted on detachment and reattachment of GOX in the same membrane matrix.
Further study has been directed towards implementation of the above mentioned
immobilized enzymatic system for oxidative dechlorination of chloro-organics. A first time attempt was made to use a 2-stack functionalized membranes system for simultaneous enzymatic production of hydrogen peroxide in first membrane, and oxidative dechlorination of 2, 4, 6-trichlorophenol (TCP) in the Fe+2 immobilized (by ion exchange) second membrane by Fenton reaction. The technique was efficient in destruction of TCP as evident from the overall dechlorination of 70-80 %. This technique provides additional benefit of reusing the same membrane matrices by reattaching fresh GOX and Fe+2.
KEYWORDS: Functionalized Membranes, Affinity Based Bioseparation, HIV-TAT
Protein, Biocatalysis, Glucose Oxidase
SAURAV DATTA
o
12/13/2007 o

FUNCTIONALIZED POLYMERIC MEMBRANES FOR BIOSEPARATION AND BIOCATALYSIS
By
Saurav Datta
DR. D. BHATTACHARYYA o
Director of Dissertation
DR. B. KNUTSON o
Director of Graduate Studies
12/13/2007 o
Date

RULES FOR THE USE OF DISSERTATIONS
Unpublished dissertations submitted for the Doctor's degree and deposited in the University of Kentucky Library are as a rule open for inspection, but are to be used only with due regard to the rights of the authors. Bibliographical references may be noted, but quotations or summaries of parts may be published only with the permission of the author, and with the usual scholarly acknowledgements. Extensive copying or publication of the dissertation in whole or in part also requires the consent of the Dean of the Graduate School of the University of Kentucky. A library that borrows this dissertation for use by its patrons is expected to secure the signature of each user. Name Date

DISSERTATION
Saurav Datta
The Graduate School
University of Kentucky
2007

FUNCTIONALIZED POLYMERIC MEMBRANES FOR BIOSEPARATION AND BIOCATALYSIS
DISSERTATION
A dissertation submitted in partial fulfillment of the requirements for the degree of Doctor of Philosophy in the
College of Engineering at the University of Kentucky
By Saurav Datta
Lexington, Kentucky
Director: Dr. Dibakar Bhattacharyya, Alumni Professor of Chemical Engineering
Lexington, Kentucky
2007
Copyright © Saurav Datta 2007

ACKNOWLEDGEMENTS
I would like to express heartfelt gratitude to my advisor Prof. Dibakar
Bhattacharyya for his guidance, support and motivation during my PhD research studies.
His ingenious ideas, unending passion and dedication to the field of membrane science &
biotechnology have left an indelible impression in me. Thanks to my PhD dissertation
committee members, Prof. A. Butterfield, Prof. B. Knutson, Dr. C. Crofcheck and Dr. J.
Zack Hilt for their technical inputs.
A special thanks to our DGS, Prof. Knutson for her invaluable help in transferring
my wife from Colorado State University.
I would also like to express my gratitude to all of the faculty members at
University of Calcutta and Indian Institute of Technology, Kanpur for giving me the basic
knowledge of Chemical Engineering and for motivating me to pursue higher study.
I would like to thank Philip D. Ray, Research Analyst, Department of Anatomy
and Neurobiology and John May, Research Analyst, Environmental Research and
Training Laboratory (ERTL) for their help in different analyses. Special thanks to Dr.
Sumita Raha and Ms. Robin Ehrick for helping in SDS-PAGE and Western Blot analyses.
I would like to thank my colleagues in DB’s lab, Aaron, Abhay, Ajay, Andrew,
Dave, Deepak, Jian, Morgan, Noah, Peter, Scott, Tee, Vasile and Yongchao for their
support and maintaining nice working atmosphere. Thanks to Caitlyn Cecil and Melody
Morris for their respective experimental contributions as a part of NSF-REU program. I
would also like to thank Mr. Bruce Cole and Mr. Jerome Vice for their help. Thanks to all
of my friends for making my stay at Lexington memorable.
I would also like to mention the contributions of my wife, Gargi, my mother,
Namita Datta, my father, Late Sankar Datta, my elder brother, Sudip Datta and all of my
other family members in the form of their unconditional love and support.
Finally, I would like to acknowledge Dr. A. Nath, Johns Hopkins University, Dr.
Michal J. Toborek, Department of Surgery, University of Kentucky, and National
Institute of Health (NIH) for financial support in the bioseparation project. I would also
like to acknowledge National Institute of Environmental Health Science (NIEHS-SBRP)
for financial support in the biocatalysis project.
iii

Table of Contents
ACKNOWLEDGEMENTS............................................................................................... iii
Table of Contents............................................................................................................... iv
List of Tables ................................................................................................................... viii
List of Figures..................................................................................................................... x
List of Files ..................................................................................................................... xvii
Chapter 1 Introduction................................................................................................. 1
1.1 Functionalized membranes for affinity based bio-separation: research objectives .................................................................................................... 1
1.2 Functionalized membranes for enzymatic catalysis: research objectives... 3
Chapter 2 Background................................................................................................. 5
2.1 Membrane and membrane based processes ................................................ 5
2.2 Functionalized membranes ......................................................................... 9
2.2.1 Development of functionalized polymeric membranes .............................. 9
2.2.2 Further attachment of groups/molecules................................................... 14
2.2.3 Applications of functionalized membranes .............................................. 18
2.3 Bioseparation ............................................................................................ 19
2.3.1 Proteins ..................................................................................................... 19
2.3.2 TAT protein .............................................................................................. 20
2.3.3 Column chromatographic separation of proteins...................................... 22
2.3.4 Membrane based separation of proteins ................................................... 25
2.4 Biocatalysis ............................................................................................... 33
2.4.1 Enzyme ..................................................................................................... 33
2.5 Concluding remarks .................................................................................. 38
Chapter 3 Experimental and Analytical Procedures.................................................. 39
3.1 Equipments ............................................................................................... 39
3.2 Materials ................................................................................................... 39
3.2.1 Membranes................................................................................................ 39
3.2.2 Chemicals.................................................................................................. 40
3.3 Analytical procedures ............................................................................... 41
3.4 Functionalization of membranes............................................................... 43
iv

3.4.1 Covalent immobilization of avidin in anhydride activated nylon membrane................................................................................................................... 43
3.4.2 Functionalization of anhydride activated nylon membranes based on LBL technique for electrostatic immobilization of GOX.................................. 45
3.4.3 Functionalization of PVDF membrane by in-situ polymerization of acrylic acid for electrostatic immobilization of GOX .......................................... 48
3.4.4 Functionalization of other unactivated base membranes .......................... 50
3.5 Separation and purification of HIV-Tat protein in avidin functionalized membranes ................................................................................................ 55
3.5.1 Accessibility of covalently immobilized avidin sites in nylon membrane by biotin moieties present in different species.......................................... 55
3.5.2 Affinity separation of HIV-Tat protein from bacterial lysate (BL) .......... 56
3.6 Effect of pre-filtration on affinity membrane separation of Tat ............... 63
3.6.1 Pre-filtration.............................................................................................. 63
3.6.2 Affinity membrane separation of Tat from pre-filtered BL feed.............. 63
3.7 Enzymatic oxidation of glucose by electrostatically immobilized GOX in LBL assembled nylon membrane and functionalized PVDF membrane.. 64
3.7.1 Activity study of electrostatically immobilized GOX in LBL functionalized nylon membrane................................................................ 64
3.7.2 Activity study of electrostatically immobilized GOX in functionalized PVDF membrane ...................................................................................... 66
Chapter 4 Functionalization of Membranes .............................................................. 68
4.1 Results and discussion .............................................................................. 68
4.1.1 Covalently immobilized avidin in anhydride activated nylon membrane 68
4.1.2 Electrostatically immobilized GOX in LBL assembled nylon membrane and functionalized PVDF membrane........................................................ 69
4.1.3 Determination of extent of functionalization in other membranes (RC, CA, nylon) ........................................................................................................ 81
4.2 Conclusions............................................................................................... 84
Chapter 5 Affinity Based Separation of HIV-TAT Protein: Analysis of Accessibility of Avidin Sites and Fouling in Membranes ...................................................................... 85
5.1 Results and discussion .............................................................................. 86
5.1.1 Accessibility of covalently immobilized avidin sites ............................... 86
5.1.2 Study of associated fouling in avidin immobilized nylon membrane..... 103
5.1.3 Separation and purification of Tat .......................................................... 118
5.2 Conclusions............................................................................................. 130
v

Chapter 6 Enzymatic Oxidation of Glucose to Gluconic Acid and H2O2 by Electrostatically Immobilized Glucose Oxidase in Functionalized Membranes ............ 132
6.1 Results and discussion ............................................................................ 132
6.1.1 Steady state experiment .......................................................................... 132
6.1.2 Importance of O2..................................................................................... 134
6.1.3 Kinetics of glucose oxidation by GOX................................................... 134
6.1.4 Effect of residence time, i.e., flow rate ................................................... 145
6.1.5 Effect of pH............................................................................................. 148
6.1.6 Stability ................................................................................................... 150
6.1.7 Reusability of membrane matrix by detachment and reattachment of GOX................................................................................................................. 150
6.2 Conclusions............................................................................................. 152
Chapter 7 Oxidative Dechlorination of Trichlorophenol (TCP) by Functionalized 2-Stack Membranes Containing Electrostatically Immobilized GOX and Fe+2 ................ 153
7.1 Introduction and background studies ...................................................... 153
7.2 Experimental and analytical procedures ................................................. 154
7.2.1 Equipment and materials......................................................................... 154
7.2.2 Analytical procedures ............................................................................. 155
7.2.3 Electrostatic immobilization of GOX in functionalized PVDF membrane................................................................................................................. 156
7.2.4 Immobilization of Fe+2 in functionalized PVDF membrane by ion exchange ................................................................................................. 156
7.2.5 Experimental procedure for dechlorination of TCP................................ 157
7.3 Results and discussions........................................................................... 157
7.3.1 Electrostatically immobilized GOX in functionalized PVDF membrane157
7.3.2 Fe+2 in functionalized PVDF membrane................................................. 158
7.3.3 Dechlorination of TCP............................................................................ 158
7.4 Conclusions............................................................................................. 164
Chapter 8 Conclusions............................................................................................. 165
8.1 Overall scientific and technological advancements................................ 165
8.2 Specific accomplishments....................................................................... 166
8.2.1 Functionalized membranes for affinity based bioseparation .................. 166
8.2.2 Functionalized membranes for biocatalysis............................................ 167
Nomenclature.................................................................................................................. 168
vi

References....................................................................................................................... 173
Vita.................................................................................................................................. 202
vii

List of Tables
Table 2.1 A comparative study of types of solid matrix used and kinetic parameters obtained for different GOX immobilization techniques reported in literature. MUDA = mercaptoundecanoic acid, EDC = N-ethyl-N’-(3-dimethylaminopropyl) carbodiimide, NHS = N-hydroxysuccinimide, PMMA = poly(methylmethacrylate), PSt = poly(styrene), GMA = Glycidolmethacrylate, APTES = 3-aminopropyltrimethoxysilane, PAA = poly(acrylic acid), PVDF = polyvinylidene fluoride, AAc = acrylic acid, CA = cellulose acetate ............................................................................................................................... 37 Table 4.1 Characterization of LBL assembled nylon membrane by calculating the amount of repeat units immobilized in subsequent layers. Molecular weight of repeat units of different polyelectrolytes is as follows: PLL 164.5, PSS 206, and PAH 93.5. External membrane area = 13.2 cm2, Membrane thickness = 165 µm, pH = 6 .............................. 72 Table 4.2 Characterization of functionalized PVDF membrane by calculating the amount of repeat units immobilized in subsequent domains. Molecular weight of repeat units of different polyelectrolytes / polymers is as follows: PAH 93.5 and PAA 72. External membrane area = 13.2 cm2, Membrane thickness = 165 µm, pH = 6 .............................. 75 Table 4.3 Amount of active groups attached for functionalization of different base membranes, such as regenerated cellulose (RC), cellulose acetate (CA) and nylon. ECH = epichlorohydrin, BDDE = 1, 4-butanediol diglycidol ether, CDI = 1, 1’-carbonyldiimidazole, PABA = para-aminobenzoic acid .................................................. 82 Table 5.1 Accessibility of avidin sites for the permeation of biotin 4-amidobenzoic acid (BABA) through avidin immobilized nylon membrane (Pore dia. = 0.45 µm) at 0.34 bar. Single membrane was used for this case........................................................................... 90 Table 5.2 Accessibility of avidin sites for permeation of biotinylated-BSA (BBSA), BBSA + Gamma Globulin (GG, Non-biotinylated) and Tat in unfiltered bacterial lysate (UNF BL) through avidin immobilized nylon membrane (Pore dia. = 0.45 µm) at 0.34 bar. Single membrane was used for BBSA and BBSA+GG, whereas, 4-stack membranes were used for Tat in BL............................................................................................................. 94 Table 5.3 Effect of pre-filtration (UF and MF) on BL feed. Concentration of total protein in pre-filtration feed = 1120 µg/ml. Concentration of total biotin (exposed + entangled) in pre-filtration feed = 3.8 x 10⁻³ µmole/ml (i.e. 32 µg/ml Tat). UF: 100 KDa MWCO regenerated cellulose membrane, ∆P = 1.36 bar, MF: 0.1 µm pore size hydrophilized PVDF membrane, ∆P = 0.34 bar ...................................................................................... 98 Table 5.4 Effect of pre-filtration on accessibility of avidin sites for BL permeation. For proper comparison, results of Table 5.2 are reproduced here along with the MF BL and UF BL results. Single membrane was used for BBSA and BBSA+GG, whereas, 4-stack membranes were used for Tat in BL............................................................................... 102
viii

Table 5.5 Calculated resistance and thickness of protein layer formed due to the permeation of BSA, Biotinylated-BSA (BBSA), BBSA + Gamma Globulin (GG) and UNF BL feed through avidin immobilized membrane (Pore dia. = 0.45 µm) at 0.34 bar. RP = Resistance of protein layer, δp= Effective thickness of protein layer..................... 105
ix

List of Figures
Figure 2.1 Different operating streams involved in a typical membrane separation process............................................................................................................................................. 6 Figure 2.2 Filtration spectrum describing the classification of membrane processes based on diameter of the pore of membrane. Figure also indicates the proper choice of membrane process in order to separate some common molecules, based solely on size. RO = Reverse osmosis, NF = nanofiltration, UF = ultrafiltration, MF = microfiltration... 7 Figure 2.3 Chemical structures of building blocks of different membranes used in this research study.................................................................................................................... 11 Figure 2.4 Different schemes of immobilization of biomolecules in membrane ............. 15 Figure 2.5 Primary structure of HIV-Tat1-72 protein showing the amino acid residues. Figure also indicates the salient features of Tat in terms of structure, isolation and further therapeutic applications .................................................................................................... 21 Figure 2.6 Different types of column chromatographic separation of proteins................ 23 Figure 2.7 Classification of membrane separation of proteins based on size, charge and interaction ......................................................................................................................... 26 Figure 2.8 (a) Structure of biotin and (b) partial primary structure of avidin showing the tryptophan (Trp) amino acid residues. .............................................................................. 29 Figure 2.9 Enzymatic oxidation of glucose to gluconolactone by Glucose Oxidase (GOX). Gluconolactone immediately converts to gluconic acid. Cofactor of GOX, FAD, first converts to reduced form, FADH2, and then oxidized to FAD by O2 .............................. 35 Figure 3.1 Reaction scheme for covalent immobilization of primary amine group containing molecule (:NH2-R’) in activated nylon membrane. (:NH2-R’') could be avidin or poly(L-Lysine) or GOX................................................................................................ 44 Figure 3.2 Schematic of formation of 7-layers of polyelectrolytes inside an anhydride activated nylon based membrane using Layer-By-Layer (LBL) technique followed by electrostatic immobilization of GOX................................................................................ 46 Figure 3.3 Schematic of functionalized PVDF membrane by PAA (shown here as a single chain for illustration purposes) and electrostatic attachment of PAH, followed by electrostatic immobilization of GOX................................................................................ 49 Figure 3.4 Reaction schemes showing functionalization of unactivated base membranes by different active groups. CA: Cellulose Acetate, RC: Regenerated Cellulose, ECH:
x
Epichlorohydrin, CDI: 1, 1’-carbonyldiimidazole, BDDE: 1, 4-butanediol diglycidol ether........................................................................................................................................... 51 Figure 3.5 Reaction of carbonyl, carbonyl imidazole and epoxide activated membranes with primary amine containing molecules (R-NH2), such as PABA, avidin, PAH, etc. .. 53 Figure 3.6 Schematics of basic steps involved in affinity based membrane separation of a target protein from mixture of proteins............................................................................. 57 Figure 3.7 Schematic of separation of Tat protein from bacterial lysate using avidin-biotin interaction in a functionalized membrane pore. Biotinylated-Tat (Bio-F-Tat) forms a complex (Tat-F-Bio-Av-Mem) with avidin immobilized membrane (Av-Mem). Tat is then isolated by cleaving the Tat-Fusion protein bond with Factor Xa ............................ 59 Figure 3.8 Experimental steps for the separation and purification of Tat from Bacterial Lysate (BL) using avidin-biotin interaction in functionalized stacked membranes. In few experiments, a pre-filtration step (shown as a dotted box) was introduced to remove unwanted proteins and impurities prior to the affinity separation .................................... 60 Figure 4.1 Calculated cumulative thickness of layers after electrostatic immobilization of polyelectrolytes inside nylon membrane pore. Hagen Poiseuiile’s equation was used to calculate layer thickness. Inset Figure shows the decrease in permeability due to formation of layers inside membrane pores. Pore radius of pure nylon membrane = 225 nm, water permeability of pure nylon membrane = 570 x 10-4 cc/cm2-s-bar, permeability after GOX immobilization = 52 x 10-4 cc/cm2-s-bar, external membrane area = 13.2 cm2, membrane thickness = 165 µm, pH of water used for permeability measurement = 6, NaCl concentration used to form layers = 0.25 M............................................................ 73 Figure 4.2 Effect of functionalization on PVDF membrane as depicted by the permeate flux vs pressure curve. Pore radius of pure PVDF membrane = 225 nm, pore radius of PVDF-PAA-PAH-GOX membrane = 100 nm. Water (pH 6) permeability values for different steps of functionalized membrane are given by the slope of the curves. External membrane area = 13.2 cm2, membrane thickness = 125 µm ............................................ 77 Figure 4.3 Effect of pH on permeate water flux for PAA-functionalized PVDF membrane in Na-form. Flux was normalized with maximum flux for this experiment (330 x 10-4 cc/cm2-s) at a pH of 2.5 and pressure of 1.38 bar. Pore radius of pure PVDF membrane = 225 nm, pore radius of PVDF-PAA-PAH-GOX membrane = 100 nm, external membrane area = 13.2 cm2, membrane thickness = 125 µm.............................................................. 78 Figure 4.4 SEM images of cross section of (a) unmodified PVDF membrane and (b) PAA-functionalized PVDF membrane with immobilized Fe+2. The figure also shows SEM-EDX analysis of different elements present in (c) virgin PVDF membrane and (d) PAA-functionalized PVDF membrane with immobilized Fe+2 ........................................ 80
xi

Figure 5.1 Schematic of different ways of attachment of avidin molecules in functionalized membranes and its effect on interaction with biotin moieties. (a) avidin in homogeneous phase. Four sites are available for biotin, (b) covalently immobilized avidin in membrane, (c) multiple attachment of avidin molecules by different amine groups, (d) blockage of avidin sites by next layer of immobilized avidin due to protein-protein interaction, and (e) blockage of avidin sites by big molecules of protein (biotinylated as well as non-biotinylated)................................................................................................... 87 Figure 5.2 Comparison of breakthrough curves for permeation of different biotin 4-amidobenzoic acid (BABA) solutions through avidin immobilized (3.8 x 10⁻² - 5.1 x 10⁻²
µmoles / ml bed volume) single nylon membrane (Pore dia. = 0.45 µm) at 0.34 bar. Avidin functionalized membrane permeability = 4 x 10⁻³- 7 x 10⁻³ cm3/cm2.s.bar. CP = conc. of biotin in permeate, Cf = conc. of biotin in feed .................................................. 88 Figure 5.3 Comparison of breakthrough curves for permeation of different biotinylated-BSA (BBSA) solutions through avidin immobilized (3.8 x 10⁻² - 5.1 x 10⁻² µmoles/ml bed volume) single nylon membrane (Pore dia. = 0.45 µm) at 0.34 bar. Avidin functionalized membrane permeability = 5 x 10⁻³ – 7 x 10⁻³ cm3/cm2.s.bar. CP = Conc. of biotin in permeate, Cf = Conc. of biotin in feed .............................................................................. 92 Figure 5.4 Comparison of accessibility of the avidin sites (3.8 x 10⁻² - 5.1 x 10⁻²
µmoles/ml bed volume) immobilized in single nylon membrane (Pore dia. = 0.45 µm) for different biotinylated-BSA (BBSA) solutions at 0.34 bar. Avidin functionalized membrane permeability = 5 x 10⁻³ - 7 x 10⁻³ cm3/cm2.s.bar ............................................. 93 Figure 5.5 Comparison of normalized accessibility vs. biotin permeated for biotin 4-amidobenzoic acid (BABA), biotinylated-BSA (BBSA) and BBSA + Gamma Globulin (GG, non-biotinylated protein) through avidin immobilized (3.8 x 10⁻² - 5.1 x 10⁻²
µmoles/ml bed volume) single nylon membrane (0.45 µm) at 0.34 bar. Avidin functionalized membrane permeability = 4 x 10⁻³ - 5 x 10⁻³ cm3/cm2.s.bar ..................... 96 Figure 5.6 Normalized flux vs cumulative volume for pre-filtration experiments. UF: 100KDa MWCO regenerated cellulose membrane, ∆P = 1.36 bar, Permeability = 4x10⁻³ cm3/cm2-s-bar. MF: 0.1 µm pore size hydrophilized PVDF membrane, ∆P = 0.34 bar, Permeability = 20 x 10-3 cm3/cm2-s-bar. Dotted curves represent trend lines for experimental data. Volume of pre-filtration feeds = 300 cm3 .......................................... 99 Figure 5.7 SDS-PAGE images of feed and permeate streams of pre-filtration experiments prior to affinity separation. Total protein concentration in pre-filtration feed (UF/MF F) = 1120 µg/ml, in microfiltration permeate (MF P) = 465 ± 10 µg/ml, and in ultrafiltration permeate (UF P) = 155 ± 5 µg/ml................................................................................... 100 Figure 5.8 Comparison of normalized flux (Jv/Jv0) for permeation of BSA, BBSA, BBSA + gamma globulin (GG) and bacterial lysate (BL) through avidin immobilized nylon membranes (pore dia. = 0.45 µm) at 0.34 bar. Normalized flux = ratio of flux at any time of permeation to initial flux. Jv0 = 14 x 10-4 – 24 x 10-4 cm3/cm2.s................................. 104
xii

Figure 5.9 Comparison of effective thickness of protein layer formed within the membrane while permeating BSA, BBSA, BBSA + Gamma Globulin (GG) and bacterial lysate (BL) through avidin immobilized nylon membranes (Pore dia. = 0.45 µm) at 0.34 bar ................................................................................................................................... 109 Figure 5.10 SEM images (6K magnification) of the surface of the nylon based MF membranes (Pore dia. = 0.45 µm). (a) Bare Immunodyne membrane, (b) Topmost membrane of the 4-stack nylon membranes matrix through which UNF BL1, wash buffer and cleavage buffer were permeated at 0.34 bar............................................................. 110 Figure 5.11 Schematic of adsorption of protein (a) both within the pores and on the external surface of the membranes: combined model, and (b) only within the pores of the membranes: standard model. The thickness of adsorbed protein layer formed at a distance r from the center of pore at any time interval of ∆t is ∆r ................................................ 112 Figure 5.12 Kinetics of total protein adsorption for UNF BL2 feed. The solid curves represent the best fitted values according to Equation 5.13 for total adsorption and according to Equation 5.14 for surface adsorption, respectively.................................... 114 Figure 5.13 Normalized flux vs cumulative permeate volume for the affinity separation of different BL feeds through avidin-immobilized 4-stack Immunodyne membranes at 0.34 bar. The solid curves represent the Standard Blocking Model calculated values according to Equation 5.18, whereas, the broken curve represents the Combined Model calculated values according to Equation 5.11. UNF BL2 = Unfiltered BL2, UF BL = Ultrafiltered BL, MF BL = Microfiltered BL...................................................................................... 117 Figure 5.14 Effect of dilution on free available Tat by diluting bacterial lysate with 0.1 M (0.1 x 10³ µmoles/ml) NaCl............................................................................................ 119 Figure 5.15 Effect of ionic strength on free available Tat by diluting bacterial lysate (dilution factor = 10) with different concentrations of NaCl.......................................... 120 Figure 5.16 Characteristic flux vs. time curve for permeation of unfiltered bacterial lysate (UNF BL2), wash buffer 1 (WB 1), wash buffer 2 (WB 2) and cleavage buffer (CB) through avidin immobilized 4-stack functionalized membranes. Permeate flux is normalized by dividing with initial flux through avidin immobilized 4-stack membranes.......................................................................................................................................... 122 Figure 5.17 Concentration of total protein in permeate for different solution streams in affinity separation of Tat from UNF BL2 feed through 4-stack avidin immobilized functionalized membranes. UNF BL2 = unfiltered bacterial lysate with 1120 µg/ml total protein concentration in feed, WB 1 = wash buffer 1, WB 2 = wash buffer 2 and CB = cleavage buffer................................................................................................................ 123 Figure 5.18 SDS-PAGE images of different streams for the separation of Tat from bacterial lysate (UNF BL2) using avidin-biotin interaction in avidin immobilized 4-stack
xiii

nylon membranes (F = Feed, P = Permeate, R = Retentate, WB = wash buffer, CB = cleavage buffer, E = Tat eluate). Conc. of total protein in feed = 1120 µg/ml............... 124 Figure 5.19 SDS-PAGE images of purified Tat eluates separated from bacterial lysate (BL) using different techniques. E = Tat eluate, UNF BL1 = unfiltered BL 1, UNF BL2 = unfiltered BL 2, MF BL = microfiltered BL, UF BL = ultrafiltered BL, CC = column chromatography, RC ECH = Tat separated using RC-ECH functionalized membrane . 126 Figure 5.20 Western Blot analysis of different purified Tat eluates from bacterial lysate (BL). E = Tat eluates, UNF BL1 = unfiltered BL 1, UNF BL2 = unfiltered BL 2, MF BL = microfiltered BL, UF BL = ultrafiltered BL, CC = column chromatography ............. 127 Figure 5.21 Comparison of total processing time for unfiltered BL feed (UNF BL2 feed), microfiltered BL feed (MF BL feed) and ultrafiltered BL feed (UF BL feed) in separation and purification of Tat from BL. For all cases, external membrane area = 33.2 cm2, volume of BL feed = 250 cm3 with 95 % permeate water recovery; Amount of biotinylated-Tat fed = 0.55 µmole, maximum possible Tat recovery = 0.18 µmole (1500 µg)................................................................................................................................... 129 Figure 6.1 Determination of the steady state concentration of H2O2 produced in LBL assembled nylon membrane for fixed flow rate and substrate concentration. Two different substrate concentrations, 15 mM and 75 mM glucose, were studied. Amount of GOX immobilized = 1.5 mg, permeate flux = 140 x 10-4 cc/cm2.s, residence time = 0.6 s, pore radius of LBL assembled nylon membrane = 125 nm, external membrane area = 13.2 cm2, membrane thickness = 165 µm, pH = 5.5, Temperature = 25 0C ................................... 133 Figure 6.2 Importance of O2 in enzymatic oxidation of glucose by GOX immobilized in LBL assembled nylon membrane. Activity is calculated based on concentration of H2O2 produced, and normalized by dividing with maximum activity for this experiment, which is [H2O2] / [H2O2]max. Concentration of glucose fed = 0.75 mM, Amount of GOX immobilized = 1.5 mg, permeate flux = 140 x 10-4 cc/cm2.s, residence time = 0.6 s, pore radius of LBL assembled nylon membrane = 125 nm, external membrane area = 13.2 cm2, membrane thickness = 165 µm, pH = 5.5, temperature = 25 0C..................................... 135 Figure 6.3 Rate (v) vs substrate concentration (s) for free GOX in homogeneous phase batch reaction. Concentration of glucose solution = 0.75 - 75 mM, reactor volume = 25 cm3, amount of GOX = 0.25 mg, temperature = 25 0C, pH of NaOAc-HCl buffer = 5.5......................................................................................................................................... 137 Figure 6.4 Lineweaver-Burke plot for free GOX in homogeneous phase batch reaction. Concentration of glucose solution = 0.75-75 mM (1/s = 1.33 - 0.013 mM-1), reactor volume = 25 cm3, amount of GOX = 0.25 mg, temperature = 25 0C, pH of NaOAc-HCl buffer = 5.5 ..................................................................................................................... 138 Figure 6.5 Schematic diagram of electrostatically immobilized GOX in polyelectrolyte / polymer domain for both LBL-GOX and PVDF-GOX membranes. There are two distinct
xiv

regions; one containing GOX and the other devoid of GOX. The first region is responsible for the catalytic action of the membrane, whereas, the latter one is associated with core leakage ............................................................................................................ 140 Figure 6.6 Rate of oxidation of glucose as a function of substrate concentration for different GOX immobilization experiments. Amount of GOX immobilized = 1.8 mg, 1.5 mg and 1 mg for PVDF membrane, LBL membrane and covalent immobilization, respectively. Residence time for all experiments were around 0.6 s, temperature = 25 0C, pH of NaOAc-HCl buffer = 5.5 ...................................................................................... 142 Figure 6.7 Lineweaver-Burke plot for GOX immobilized in functionalized LBL (LBL-GOX-convective) and PVDF (PVDF-GOX-convective) membranes. Concentration of glucose solution = 0.75 - 75 mM (1/s = 1.33 - 013 mM-1), amount of GOX immobilized = 1.5 and 1.8 mg for LBL and PVDF membranes, respectively, temperature = 25 0C, pH of NaOAc-HCl buffer = 5.5. Inset figure shows Lineweaver-Burke plot for the substrate concentration range of 15 - 75 mM (1/s = 0.067 - 0.013 mM-1)..................................... 144 Figure 6.8 Effect of flow rate, i.e. residence time, on conversion of glucose and rate of formation of H2O2 for 15 mM glucose solution fed in LBL assembled nylon membrane. Rate and conversions are calculated from equations (6.3) and (6.5). Model values are calculated based on equation of PFR (equation 6.4). Amount of GOX immobilized = 1.5 mg, volume of LBL membrane reactor 0.122 cm3, pH = 5.5, temperature = 25 0C, permeate flux = (75 - 265) x 10-4 cm3/cm2-s, residence time = 0.4 - 1.25 s ................... 146 Figure 6.9 Effect of flow rate, i.e. residence time, on conversion of glucose and rate of formation of H2O2 for 15 mM glucose solution fed in functionalized PVDF membrane. Rate and conversions are calculated from equations (6.3) and (6.5). Model values are calculated based on equation of PFR (equation 6.4). Amount of GOX immobilized = 1.8 mg, volume of PVDF membrane reactor = 0.1 cm3, pH = 5.5, temperature = 25 0C, permeate flux = (60 - 200) x 10-4 cm3/cm2-s, residence time varied from 0.4 - 1.25 s... 147 Figure 6.10 Effect of pH on activity for both free GOX and immobilized GOX in LBL assembled membrane. Activity is calculated based on concentration of H2O2 in permeate and is normalized by dividing with maximum activity, i.e., (CPH2O2)/ (CPH2O2) max. Amount of GOX immobilized = 1.5 mg, volume of LBL membrane reactor = 0.122 cm3, permeate flux = 140 x 10-4 cc/cm2.s, residence time = 0.6 s, external membrane area = 13.2 cm2, membrane thickness = 165 µm, pH = 5.5, Temperature = 25 0C, concentration of glucose fed = 0.75 - 75 mM........................................................................................ 149 Figure 6.11 Stability of GOX immobilized in LBL assembled nylon membrane as well as PVDF-PAA-PAH membrane based on the change in activity over a period of time. The stability is compared with that reported (Ahuja 2006; Ozyilmaz et al. 2005) for free GOX. Activity is calculated based on concentration of H2O2 and is normalized by dividing with the activity on first day of immobilization at pH = 5.5................................................... 151
xv

Figure 7.1 Schematic of formation of 2-stack functionalized membranes system for oxidative dechlorination of TCP by Fenton reaction. Membrane 1 and 2 were functionalized with electrostatically immobilized GOX and Fe+2, respectively ............ 159 Figure 7.2 Breakthrough curve for H2O2 in the permeate of 2-stack functionalized-PVDF membranes system used for dechlorination of TCP. Y-axis represents the ratio of concentration of H2O2 in permeate at time t ([H2O2]P) to the concentration of H2O2 produced in first membrane under steady state condition ([H2O2]ss). Inset figure represents the breakthrough curve of TCP for the same experiment. Y-axis of inset figure represents the ratio of concentration of TCP in permeate ([TCP]P) at time t to the concentration of TCP in feed ([TCP]F). [H2O2]ss = 0.1 mM, [TCP]F = 0.07 mM (15 ppm), Fe loading = 0.09 mmole, residence time in the first membrane = 2.7 s, residence time in the second membrane = 2 s............................................................................................. 161 Figure 7.3 The conversion of TCP during the dechlorination reaction as a function of cumulative amount of TCP permeated. Conversion of TCP is the ratio of cumulative amount of TCP dechlorinated at any time to cumulative amount of TCP permeated at that time. Steady state concentration of H2O2 from the first membrane is around 0.1 mM, Fe loading = 0.09 mmole, residence time in the first membrane = 2.7 s, residence time in the second membrane = 2 s................................................................................................... 162 Figure 7.4 Total amount of Cl- formed as a function of total amount of TCP converted during the dechlorination reaction. The dotted line is constructed by considering 1 mole of TCP conversion corresponds to maximum of 3 mole of chloride formation. Slope of the solid lines represent experimentally obtained ratio of chloride formed to TCP converted. Steady state concentration of H2O2 from the first membrane is around 0.1 mM, Fe loading = 0.09 mmole, residence time in the first membrane = 2.7 s, residence time in the second membrane = 2 s............................................................................................. 163
xvi

List of Files
Saurav Dissertation.pdf ……………………………………………………………2 MB
xvii

Chapter 1 Introduction
This section summarizes the contents of the dissertation. The research areas
studied in this dissertation are also broadly described along with the objectives.
Functionalized polymeric membranes are used in various fields of research, such as,
bioseparation, biocatalysis, biosensor, bioremediation, metal capture, etc. This research
work has been directed towards the development and applications of functionalized
polymeric membranes in bio-separation (affinity based) and bio-catalysis.
Chapter 2 contains background information on different aspects of functionalized
membranes and their applications in bioseparation and biocatalysis. All experimental and
analytical procedures are described in Chapter 3. Chapter 4 describes the results and
discussions of functionalization of different membranes used in this study along with
their characterization. Chapter 5 includes the results, discussions and important findings
for the research on affinity based separation of HIV-TAT protein, using functionalized
membranes, and effect of pre-filtration on the affinity separation. Accessibility of
covalently immobilized avidin sites and fouling in the membrane are highlighted. Chapter
6 contains the details of the research on enzymatic oxidation of glucose with the enzyme,
glucose oxidase (GOX), electrostatically immobilized in functionalized membranes.
Chapter 6 is followed by the description of a practical application of the above mentioned
immobilized enzymatic system for dechlorination of a chlorinated organic molecule, in
the form of Chapter 7. Finally, all scientific accomplishments of this research work are
summarized in Chapter 8.
1.1 Functionalized membranes for affinity based bio-separation: research objectives
Separation and purification of a protein from mixture of proteins require high
selectivity, and incur a major part of the total production cost of the protein (Thoemmes
and Kula 1995). Conventional packed-bead column chromatography is widely used for
this type of separation (Lundberg et al. 2006). However, functionalized polymeric
membrane based separation processes are emerging as cost effective and
hydrodynamically favorable alternative to conventional column chromatography.
1

The overall objective of this research study was to improve the efficacy of the
affinity membrane separation of proteins by better understanding the fundamental aspects
of accessibility of avidin sites and fouling in membrane matrix. In this research work,
HIV-Tat protein was used as a model protein. Although avidin is also a protein, now
onwards, unless mentioned otherwise, the term “protein” will only be used to denote any
biotinylated (BBSA, HIV-Tat) / non-biotinylated (BSA, GG) protein other than avidin.
Separation of biotin-tagged Tat protein from a fermentation broth was demonstrated
using avidin-biotin affinity interaction in an avidin-immobilized membranes system. The
specific objectives were:
• To develop avidin-functionalized membranes system by covalent interaction.
• To determine the accessibility of covalently immobilized avidin sites by biotin
moieties present in different species, such as, (i) a small biotinylated-compound, biotin 4-
amidobenzoic acid (BABA), (ii) a biotinylated-protein, biotinylated-BSA (BBSA), and
(iii) a mixture of BBSA and a non-biotinylated protein, gamma globulin (GG).
• To study the fouling associated with separation of proteins in membranes.
• To study the effect of pretreatment of bacterial lysate (BL) on available free
Tat in solution.
• To characterize the membrane purified Tat protein by different analytical
techniques, such as SDS-PAGE, Western Blot, ELISA.
• To compare the quality of the membrane purified Tat protein with column
chromatographically purified Tat protein.
• To introduce a pre-filtration step to remove unwanted high molecular weight
proteins and other impurities from BL feed prior to the affinity separation step.
• To study the effects of pre-filtration step on permeate flux, recovery of protein
and processing time.
• To quantify the fouling in the affinity separation step by model equations.
• To quantify Tat protein present in different streams by a simple technique of
biotin analysis.
2

1.2 Functionalized membranes for enzymatic catalysis: research objectives
Bio-catalytic reactions with free enzyme in homogeneous phase possess the
advantage of higher activity, but its use is limited due to lower stability and lack of
reusability. As a potential alternative, a novel approach has been proposed for the
immobilization of enzyme in functionalized (Layer-By-Layer assembled and in-situ
polymerized) polymeric membranes using electrostatic interactions.
Two different approaches of functionalization of polymeric membranes based on
electrostatic interaction are presented. Glucose oxidase (GOX), which catalyses the
oxidation of glucose to gluconic acid and hydrogen peroxide, was used as a model
enzyme. A novel study has also been carried out on reusability of the same membrane
matrix. Beside these, oxidative dechlorination of a chloro-organic molecule has been
performed on 2-stack functionalized PVDF membranes using Fenton reaction.
The overall objective of this bio-catalysis research work was the development of
high capacity, highly active, stable and reusable GOX immobilized (electrostatically)
polymeric membranes for the oxidation of glucose to gluconic acid and hydrogen
peroxide under convective flow condition. The specific objectives were:
• To develop a functionalized membrane system by alternative attachment of
cationic and anionic polyelectrolytes based on Layer-By-Layer (LBL) technique inside
anhydride activated nylon membrane.
• To develop a functionalized membrane system by in-situ polymerization of
acrylic acid inside hydrophobic PVDF membrane.
• To characterize the functionalized domain created inside the membranes by
different techniques.
• To immobilize the enzyme, Glucose oxidase (GOX), inside the above
mentioned functionalized membranes using electrostatic interaction.
• To study the activity and kinetics of electrostatically immobilized GOX for
the oxidation of glucose to gluconic acid and hydrogen peroxide under convective flow
condition.
• To compare the activity of GOX present in different attachment forms.
3

• To study the effect of residence time and pH on the activity of GOX.
• To study the stability of the electrostatically immobilized GOX in the
functionalized membranes.
• To detach the used GOX from the membrane matrix, check the activity after
detachment, and then reattach it in the same membrane.
• To form a 2-stack functionalized PVDF membranes system with first one
containing electrostatically immobilized GOX and the second one containing ferrous iron.
• To apply the above mentioned 2-stack membranes for simultaneous
enzymatic production of hydrogen peroxide in first membrane and oxidative
dechlorination of trichlorophenol (TCP) in the second membrane by Fenton reaction
using hydrogen peroxide and immobilized ferrous ion.
Copyright © Saurav Datta 2007
4

Chapter 2 Background
This chapter contains a comprehensive background study of the research areas
related to this dissertation. It starts with a brief history and introduction of the membranes
and membrane based processes. Then various aspects of development of functionalized
membranes are discussed, followed by their applications in different research fields.
Application of functionalized polymeric membranes in protein separation and enzymatic
catalysis are described in detail.
2.1 Membrane and membrane based processes
A membrane can be broadly defined as a barrier which allows selective
transportation of species under the influence of a certain driving force. The driving force
is generally due to the difference in chemical or electrical potential in two sides of the
membrane, and is expressed in terms of pressure (ultrafiltration, microfiltration,
pervaporation), concentration (osmosis), temperature (membrane distillation) or
electrical (electro dialysis) potential gradients (Mulder 1991). Membranes can be made of
polymers, metals, inorganic compounds, carbon, ceramic and liquids. Among the
polymers, cellulosic materials, nylon, polyether sulfone (PES), polysulfone (PS),
polypropylene (PP), polyethylene (PE) and polyvinylidene fluoride (PVDF) are the most
popular starting materials for membranes (Kesting 1971).
Figure 2.1 represents different operating streams involved in a typical membrane
based process. The streams are: (i) feed, which is fed into the system; (ii) permeate,
which is passed through the membrane; and (iii) retentate, which is rejected by the
membrane. Membranes can be non-porous or porous. Even the size of the pores varies
staring from 10 µm for microfiltration membrane (MF) to 1 nm for nanofiltration
membranes (NF) as shown in Figure 2.2. The reverse osmosis (RO) and pervaporation
(PV) membranes are considered to be non-porous. Figure 2.2 demonstrates size of the
pores of different kinds of membranes along with the sizes of some common molecules.
5

Feed Retentate
Permeate
Feed Retentate
Permeate
Figure 2.1 Different operating streams involved in a typical membrane separation process
6

Conventional Filtration
Permeate Side
Retentate side
Water Salt
Sugar Salt
Sugar Salt
Protein Virus
Protein Virus Sugar Salt
Bacteria Cell
NF
UF
MF
RO
0.1 nm 1 nm 10 µm 10 nm 1 µm
Sand Resin Bead Activated Carbon
Salt
Bacteria Cell Protein Viruses Sugar Salt
Water
Figure 2.2 Filtration spectrum describing the classification of membrane processes based
on diameter of the pore of membrane. Figure also indicates the proper choice of
membrane process in order to separate some common molecules, based solely on size.
RO = Reverse osmosis, NF = nanofiltration, UF = ultrafiltration, MF = microfiltration
7

This figure is presented to give an idea about the selection of proper membrane
for a separation, based solely on size. For example, in order to separate a protein and salt,
a UF membrane, which will reject the protein and permeate the salt, can be used.
The history of application of synthetic polymeric membranes goes back to the
beginning of nineteenth century. However, the commercial application of membranes
started in late 1960s to early 1970s. One of the most path breaking discoveries in the field
of membranes was that of asymmetric membranes by Loeb and Sourirajan (Loeb and
Sourirajan 1964). They were the first to introduce the concept of a thin skin layer of
separating barrier on the top of a highly porous polymer support. This configuration is
associated with a much lower pressure drop than symmetric membranes. After that,
membrane based separation techniques gained popularity in different process industries.
Membranes have been used extensively in water desalination, waste water treatment,
biotechnology, biomedical industries, pharmaceutical industries, food industries and gas
separation (Bhattacharyya and Butterfield 2003; Ho and Sirkar 1992; McGregor and
Editor 1986; Mohr C. M. 1989; Scott 1995). Membrane based techniques include, but are
not limited to, reverse osmosis (RO), pervaporation (PV), nanofiltration (NF),
ultrafiltration (UF), microfiltration (MF) and electrodialysis (ED). The main advantage of
membrane separation over conventional processes, such as, distillation or evaporation, is
the energy efficiency and compact module design.
Earlier, membranes were considered to be a separation media based solely on size
(UF, MF) or solubility (RO, PV) of species. However, with the advancement of
functionalization chemistry and availability of new materials and technologies, it was
realized that membrane has more potential than just being used as a separation media.
Then, the concept of functionalized membranes was conceived and researchers started
modifying membranes to incorporate various kinds of functionality to use them in
different fields of research. This research work involves extensive experimental and
theoretical studies with functionalized polymeric membranes. Background studies of the
important research areas related to this dissertation are discussed in following sub-
sections.
8

2.2 Functionalized membranes
Functionalized membranes are widely used in various fields, such as,
biotechnology, food and pharmaceutical industries. The main advantage of functionalized
membrane is the versatility of the active groups. It can be tailor-made to impart the
desired functionality from a pool of active groups/molecules/moieties, depending on the
applications. For example, to capture a metal ion, a cation exchange group/molecule
(sulfonic acid group or polycysteine) (Hestekin et al. 2001; Ritchie et al. 1999; Smuleac
et al. 2005); to detect glucose, glucose oxidase enzyme (Zhao and Ju 2006); to isolate an
antibody from mixture, antigen of that antibody (Hout and Federspiel 2003); to release a
drug, a polyelectrolyte (Grimshaw et al. 1992); is introduced in the functionalized
membranes.
Functionalized membranes are created by attaching active groups in the base
polymer of the porous membranes (UF or MF membranes). Porous membranes offer two
fold benefits over non-porous membranes. Firstly, the functionalization takes place
mainly inside the pores of the membranes. Since, pore surface area is much higher than
the external surface area of the membrane, the amount of active groups attached inside
the pore is much higher. Hence, the capacity of pore functionalized membranes is also
higher. Secondly, the molecules of interest in the solution can permeate under convective
flow condition. The convective flow through the membrane minimizes the mass transfer
resistance and enhances the accessibility. The active groups are either incorporated
during the formation of the membrane, or post modification is done on the base
membranes to introduce the functionality.
2.2.1 Development of functionalized polymeric membranes
Some well documented literature reviews (Klein 2000; Zeng and Ruckenstein
1999; Zou et al. 2001) and book (Klein 1991) on functionalized membranes,
encompassing base materials of membranes, active groups, their respective applications,
are available. The chapter on affinity membranes in the book written by Klein deserves
special mention because of the detail discussion of the chemistry involved between the
9

activation reagents and the base materials. The common polymeric membrane materials
that are being used to attach active groups in membranes are described below.
Polymeric membrane materials: Researchers have exploited different base materials as
the constituent of the starting membrane. Applications of cellulose (Hollman and
Bhattacharyya 2002), regenerated cellulose (Liu et al. 2005), cellulose acetate (Hestekin
et al. 2001), chitosan (Zeng and Ruckenstein 1998), nylon (Gsell et al. 1988; Hou et al.
1989), PVDF (Ritter 1991b) and polypropylene (Schisla et al. 1995) have been reported.
This dissertation deals with cellulose acetate (CA), regenerated cellulose (RC), nylon and
PVDF membranes. A brief introduction of these membranes is presented below and the
chemical structures of the building blocks are shown in Figure 2.3.
Cellulose acetate (CA): Although pure cellulose is relatively stable, uniform and
extremely hydrophilic material, its use is limited because of lower availability of active –
CH2OH groups. CA membranes contain sufficient exposed active groups and can be
manufactured by process of phase inversion, but they are associated with lower
mechanical and chemical strength (Zou et al. 2001). Activation of CA membranes has
been conducted to incorporate aldehyde functionality by hydrolysis, followed by
oxidation. These membranes have been used for poly-amino acid attachment for heavy
metal recovery (Hestekin et al. 2001).
Regenerated cellulose (RC): Another popular, modified form of pure cellulose is
regenerate cellulose (RC). RC membranes have high mechanical and chemical strength
along with satisfactory contents of active groups (Zou et al. 2001). RC membranes have
been activated with epichlorohydrin for purification of protein (Liu et al. 2005); with 1,
4-butanediol diglycidol ether for purification of enzyme (Ruckenstein and Guo 2004;
Suen et al. 2000); with 1, 1’-carbonyldiimidazole for immobilization of enzymes and
other affinity ligands (Hearn 1987) and also for the development of immunosensor
(Stoellner et al. 2002).
10

C
O
H3C NH (CH2)6 NHCO(CH2)4 C
O
NH (CH2)6 NH C
O
CH3
n
C
O
C
O
H3C NH (CH2)6 NHCO(CH2)4 C
O
C
O
NH (CH2)6 NH C
O
C
O
CH3
n
C
H
H
C
F
Fn
C
H
H
C
F
Fn
OOH
OH
H2C O CO
CH3
O
OOH
OH
H2C O CO
CH3
O
OOOH
OH
H2C O CO
CH3
O
OOH
OH
H2C O CO
CH3
O
O
OOH
OH
H2C OHO
OOH
OH
H2C OH
O
OOOH
OH
H2C OHO
OOH
OH
H2C OH
O
On
n
Cellulose Acetate
Polyvinylidene fluoride
Nylon 6
Cellulose
Figure 2.3 Chemical structures of building blocks of different membranes used in this
research study
11

Nylon: Nylon is a polyamide material with high mechanical and chemical strength, but its
applications in the process involving biomolecules are restricted due to considerable
hydrophobicity and a lower number of exposed amine groups. Research has been
conducted to convert nylon to a hydrophilic material by attaching active groups and then
applying it for purifying BSA (Briefs and Kula 1992). Nylon membranes are generally
hydrolyzed first to expose the primary amine groups (Hendry and Herrmann 1980).
Shang and coworkers (Shang et al. 1998) have reported the superiority of 1, 1’-
carbonyldiimidazole over other activation agents for binding of histidine in nylon 66
microfiltration membranes.
Polyvinylidene fluoride (PVDF): The repeat unit of PVDF membranes is –CH2−CF2.
These membranes are inherently hydrophobic in nature; however, studies have been
carried out to incorporate hydrophilicity into it. Polyacrylic acid (PAA), due to its
hydrophilic nature and ion exchange property, has been extensively used for the
formation of nanoparticles (Xu et al. 2005), adsorption of non-ionic surfactants (Ladhe et
al. 2006) and capture of metal ions (Rivas et al. 2003) in the PVDF membranes. PAA has
also been used to functionalize membranes for RO, NF and PV type applications (Dai et
al. 2001; Fery et al. 2001; Gabriel and Gillberg 1993). Gabriel and coworker (Gabriel and
Gillberg 1993) have reported a method to functionalize hydrophobic PVDF membranes
by in-situ polymerization of acrylic acid. This technique has already been used for the
formation of nanoparticles (Xu and Bhattacharyya 2007) and immobilization of Fe+2 (Li
et al. 2007) inside the PVDF membrane pore. A study has also been reported on covalent
immobilization of GOX on acrylic acid-graft-copolymerized-PVDF membrane (Ying et
al. 2002). However, to the best of our knowledge, PAA-functionalized PVDF membrane
has never been used for electrostatic immobilization of GOX.
Chemical activation by covalent attachment: Chemical modification of membrane is
done to incorporate either active groups, such as, amine, carboxylic acid, aldehyde,
epoxide and thiol or ligands (Blitz et al. 1987; Klein 1991; Zou et al. 2001) for further
12

applications. Some well known membrane functionalization techniques are described
below.
Periodate oxidation: Membranes containing hydroxyl groups (cellulose) can be activated
by oxidizing with sodium periodate to form aldehyde group. This aldehyde activated
membrane can then react with any primary amine containing molecule, following
Schiff’s base reaction (Hestekin et al. 2001).
Epoxide activation: Membranes containing hydroxyl or primary amine (nylon) can be
activated with epoxide group, by reacting with epichlorohydrin or 1, 4-butanediol
diglycidol ether. The resultant epoxide group can react further with any amine containing
molecule, such as protein (Liu et al. 2005).
Carbonyldiimidazole activation: Membranes containing hydroxyl and primary amine can
again be activated by reacting with 1, 1’-carbonyldiimidazole, which releases its first
imidazole group in this reaction. The attached active group further participates in
nucleophilic substitution with any primary amine containing molecule, such as protein, to
release its second imidazole group and form very stable amide linkage (Klein 1991).
Triazine activation: Another approach of activating membranes containing hydroxyl and
primary amine is known as triazine activation. In this technique, 2, 4, 6-trichlorotriazine
(cyanuric chloride) is reacted with the membrane to attach it in the solid matrix by
releasing highly reactive first chlorine. Since, the second and third chlorines are now
attached with the membrane and available for substitution, this forms a highly reactive
system (Klein 2000).
Carbodiimide coupling: Carbodiimide coupling is the most widely used technique to
form an amide bond between the amine group of the membrane and carboxylic acid
group of the ligand, or vice-versa (Klein 1991). The carbodiimide reacts with the
carboxyl group to form an active intermediate, which reacts further with amine group to
form an amide bond and urea (Smuleac et al. 2004).
13

Radiation grafted activation: In this technique the inert base polymer of the membrane
is irradiated with UV radiation or electron beam to generate free radicals. These free
radicals then react with the monomers of activation reagent to incorporate it into the
membrane matrix. The advantage of this technique is that the inert polymeric support of
the membrane can be activated with virtually any polymer desired. Modification of PP
(Ulbricht and Yang 2005), PVDF (Tarvainen et al. 2000) and PS with PAA (Ulbricht and
Riedel 1998); PE with glycidylmethacrylate (Iwata et al. 1991) and nylon with
glycidylmethacrylate (Hou et al. 2007) using this technique have been reported.
Activation during synthesizing the membrane: Sometimes in order to simplify the step
of functionalization, the active monomer is copolymerized with the base polymer while
casting the membrane. Incorporation of acrylic acid into PVDF (Ying 2002), acrolein-co-
hydroxyethyl methacrylate into PES (Pemawansa 1993), hydroxyalkyl methacrylate into
acrylonitrile (Klein and Silva 1991), various reactive groups containing copolymer into
nylon (Degen et al. 1986; Gsell et al. 1988) and acrolein into acrylonitrile (Wolpert 1997)
have been successfully carried out. Incorporation of particles, containing certain types of
activity, into the casting monomer solution has also been reported (Avramescu et al. 2003;
Lensmeyer et al. 1995; Lingeman and Hoekstra-Oussoren 1997).
2.2.2 Further attachment of groups/molecules
Once the base membrane is activated, further attachment of groups/molecules
depends on the application of the membrane. Since this research study mainly deals with
biomolecules, further discussion is restricted to those molecules only. Various techniques
of biomolecules immobilization into solid support have been well documented in
literature (Ratner et al. 2004; Woodward and Editor 1985). A schematic diagram showing
different types of interactions is presented in Figure 2.4.
14

Adsorption Crosslinking
Covalent attachment
Entrapment
- - -+
++ +
++
++
++
-- -- --+
++
++
+ +
++
++
++
++
++
++
Electrostatic immobilization
Site-directed immobilization
Figure 2.4 Different schemes of immobilization of biomolecules in membrane
15

Adsorption: Biomolecules are physically adsorbed on the membrane materials.
Adsorption takes place due to hydrophobic, van der Waals, and other interactions. This
technique is very simple, but stability is a matter of concern.
Crosslinking: Sometimes to incorporate stability in the adsorption mode of
immobilization, adsorption is followed by crosslinking of the biomolecules. This
technique is associated with loss of active properties of immobilized biomolecules.
Entrapment: In this technique, a network is created inside the pores of the membrane,
and then biomolecules are entrapped in that. Networks are generally created by polymers
or polyelectrolytes. The mode of interaction is same as adsorption. Although the
immobilization is much more stable than adsorption, blockage of membrane pore due to
network formation is a problem in this technique.
Covalent attachment: Protein molecules are covalently attached with the active groups,
such as amine, epoxide, anhydride and carboxylic acid present in the membrane.
Advantage of covalent immobilization is the very stable attachment; however, the biggest
disadvantage is the alterations in the active sites of the biomolecules due to proximity to
the solid polymeric support (Datta et al. 2006).
Site-directed attachment: Site-directed immobilization technique retains the activity of
the biomolecule along with the benefits of traditional covalent bonding. It possess several
advantages over random covalent immobilization (Butterfield and Bhattacharyya 2003;
Butterfield et al. 2001). Although, this technique is very specific and provides high
activity, it is associated with complex methods and is expensive.
Electrostatic attachment: A protein molecule becomes positively charged at any pH
below its isoelectric point (PI) and negatively charged at any pH above its PI. Protein
molecules are electrostatically immobilized on a charged membrane by using the net
opposite charge on protein. Similarly, polyelectrolytes (both cationic and anionic) are
also attached in a charged membrane by manipulating the pH. A sophisticated approach
16

of immobilization of biomolecules by electrostatic interaction has been demonstrated in
this research study. This approach is known as Layer-By-Layer (LBL) technique.
Layer-By-Layer (LBL) technique: Alternative attachment of polycations and
polyanions by LBL is a simple but robust technique to create layers in a solid support
with high capacity and versatile functionality. In our laboratory Bhattacharyya and
Hollman (Hollman and Bhattacharyya 2004) first developed this technique for membrane
applications. The technique was first conceived by Decher (Decher 1997; Decher and
Hong 1991; Decher et al. 1994), based on a study indicating the possibility of existence
of such a technique by Iler (Iler and Colloid 1966). A detailed literature review covering
the mechanisms of layers formation, applications in various fields and scope of future
studies has been published recently (Ariga et al. 2007). LBL technique is used to create
functional domain containing various kinds of species, such as, polyelectrolytes (Chen
and McCarthy 1997; Dai et al. 2001; Nguyen et al. 2003; Smuleac et al. 2006), proteins
(Caruso et al. 1998b; He et al. 2004; Lvov et al. 1995), dyes (Tang et al. 2006; Tedeschi
et al. 2000), nanoparticles (Dotzauer et al. 2006; Ko et al. 2005; Kotov et al. 1995; Zhang
et al. 2003), thiols (Chun and Stroeve 2001), metal ions (Khopade and Caruso 2002;
Krass et al. 2003), virus (Lvov et al. 1994) and lipids (Ichinose et al. 1996). It is also used
in different fields of applications, such as, separation (Jain et al. 2007; Krasemann and
Tieke 1998; Liu and Bruening 2004; Malaisamy and Bruening 2005), biosensors (Hoshi
et al. 2007; Zhao and Ju 2006; Zhou and Arnold 1995) and bio-catalysis (Matsuno et al.
2007; Onda et al. 1996; Smuleac et al. 2006; Su et al. 2005). One of the most intriguing
studies has been carried out by Caruso et al. (Caruso et al. 1998a, 1999) to create “hollow
capsules” based on LBL technique. This study has been further extended to encapsulate
solid microparicles of GOX, utilizing LBL technique, for applications as biosensor (Trau
and Renneberg 2003). A high concentration of salt solution has been used to preserve the
solid state of GOX in aqueous solution. Attempts have also been made to characterize the
layers (Caruso et al. 1998b).
17

2.2.3 Applications of functionalized membranes
Functionalized membranes have a wide spectrum of applications in water
treatments, energy related research work, heavy metal recovery, bioseparation and
biocatalysis. A few of them, relevant to this research, are mentioned below.
Alternative to traditional RO/PV type applications: Traditional RO or PV membranes
selectively separate a component from other, but the associated flux is very low as non-
porous membranes are used. Polyelectrolyte functionalized NF or UF membranes are an
exciting alternative to those processes. Due to comparatively larger pore size of UF/NF
membranes, the permeate flux is very high and the selectivity is also retained because of
the involvement of charge exclusion of ions. Polyelectrolyte assembled functionalized
membranes have been used for separation of salt from seawater under RO and NF
conditions (Jin W. 2003; Toutianoush et al. 2005) as well as for the separation of ethanol-
water mixture by pervaporation (Krasemann et al. 2001). It has also been used for
controlled water permeability and charge based ion exclusion by changing the
conformation of attached polyelectrolytes (Hollman and Bhattacharyya 2002; Smuleac et
al. 2004). Size based selective transport of uncharged molecules, such as, glucose,
sucrose methanol, has also been reported (Liu and Bruening 2004).
Heavy metal recovery: Functionalized membranes have also been used for heavy metal
recovery. Ritchie and co-workers (Ritchie et al. 1999) and Hestekin and co-workers
(Hestekin et al. 2001) have reported the use of polyamino acid functionalized silica and
cellulose membranes for the capture of Cd and Pb, respectively. Smuleac and co-workers
(Smuleac et al. 2005) have implemented polythiol functionalized alumina membrane for
Hg capture, whereas, Makkuni and co-workers (Makkuni et al. 2007) have used organic
sulfide modified iron-copper nanoparticle aggregates for sorption of vapor phase Hg.
This research work has been directed towards development and applications of
functionalized polymeric membranes for bioseparation and biocatalysis. Therefore,
background studies of these two research areas are presented below.
18

2.3 Bioseparation
Various biomolecules, such as, protein, nucleic acid and virus are isolated from
mixtures using their characteristic properties like size, charge, interaction with other
molecules, etc. Among the above mentioned biomolecules, protein is the primary focus
of interest in biotechnology, biomedical and pharmaceutical community as it is the most
fundamental biomolecules present in leaving cells and responsible for majority of intra-
cellular as well as extra-cellular functions. In-vitro, it is used as catalyst, therapeutic
agents, biomarkers and sensors, to name a few (Lehninger 1977; Voet et al. 2004).
2.3.1 Proteins
Amino acids are the building blocks of protein molecules. Twenty amino acids
are available, and each contains a carboxylic acid group (α-carboxylic acid), a terminal
primary amine group (α-amine), a hydrogen atom and a side chain group (R-group)
attached to the central α-carbon atom. The R-group is the key factor in determining the
identity of an amino acid. For example, the R-group is CH3 and (CH2)4-NH2 for alanine
and lysine amino acids, respectively. α-carboxylic acid group of one amino acid reacts
with the α-primary amine group of other to form an amide bond, which is known as
peptide bond in biotechnology. Genetically encoded sequence of peptide bonds in
different combinations, from a choice of 20 amino acids, are the basis of formation of
proteins. Examples of some common proteins are serum albumin, hemoglobin, insulin,
fibrinogen, etc. (Lehninger 1977). In this research work, a regulatory protein of Human
Immunodeficiency Virus type 1 (HIV-1), known as TAT (Trans-Activator of
Transcription or Trans-Activating Transduction) has been purified using affinity based
membrane separation. A brief background study of TAT protein is presented later.
Function of a protein is strictly dependent on its structure. The straight chain
amino acid sequence of a protein is its primary structure. The secondary structure (α-
helix, β-sheet) is the spatial arrangement of only the polypeptide backbones (not the side
chains) under the main influence of hydrogen bonding. Tertiary and quaternary structures
involve protein folding, and are arrangements of a complete polypeptide and more than
one polypeptide chains, respectively (Voet et al. 2004). Different process parameters,
19

such as pH and temperature have significant effects on structure of proteins. Shielding
effect of salt on charge, well known as salting-in and salting-out, has strong influence on
solubility of proteins. Additional interactions, such as hydrophobic interaction, influence
the conformation change of protein molecules. Proteins also demonstrate variation in size,
shape and charge depending on the amino acid residues and existing circumstances. All
these variations in properties and conformations are used to separate proteins from
mixtures by different techniques. Traditional column chromatography is the most popular
technique used for protein separation and is discussed later.
2.3.2 TAT protein
TAT (Trans-Activator of Transcription or Trans-Activating Transduction) is an
extra-cellular regulatory protein of human immunodeficiency virus type 1 (HIV-1) and is
critical for viral replication (Jeang et al. 1999; Ma and Nath 1997; Rusnati et al. 1997;
Stauber and Pavlakis 1998). Tat protein is formed from two exons. The first one is
responsible for coding initial 72 amino acid residues (Tat1-72), whereas, the second one
codes for remaining 14-32 residues. This study deals with only first 1-72 polypeptide
sequence of Tat, and hence, in this dissertation, Tat1-72 is always referred as Tat. Primary
structure of Tat showing the amino acid residues, along with the salient features of Tat, is
represented in Figure 2.5. The primary role of Tat is to magnify the HIV gene expression
(Fisher et al. 1986) by regulating transcription. Tat activates the transcription by
interacting with an RNA element, known as TAR (Trans Activation Response), which is
located close to the promoter region of HIV-1 gene, termed as long terminal repeat (LTR)
(Dingwall et al. 1989; Long and Crothers 1999; Rosen et al. 1988).
The failure of available retro-viral therapies to exterminate HIV has been
implicated to the extra-cellular secretion of Tat by the HIV-infected cells (de Mareuil et
al. 2005; Ramratnam et al. 2000). Moreover, Tat has several deleterious effects on
immune and nervous systems (Nath and Chauhan 2005; Nath and Geiger 1998;
Prendergast et al. 2002). Tat is thus an excellent target for AIDS related vaccine and drug
development (Gallo 1999).
20

Regulatory protein of HIV-1: Target for AIDS vaccines
Genetically engineered to Biotinylated-Tat
Forms polymers due to Cysteine residues
Higher activity in monomeric form
TAT (Tran -Act
Tra
CTNCYCKKC CFHCQVC
s ivator of nscription)
Penetrates cell membrane: Drug delivery vehicle
Affects immuno & nervous systems: Neurotoxicity study
Form complex with an element of RNA
FIT KGLGISYGRK KRRQRRRAPQ DSQTHQVSLS KQ
Separated using avidin-biotin Interaction
MEPVDPRLEP WKHPGSQPKT A
10 20 30 40 50 60 70
Acidic Region Core Region
Arginine Rich Region
Glutamine Rich Region
Cysteine Rich Region
Figure 2.5 Primary structure of HIV-Tat1-72 protein showing the amino acid residues.
Figure also indicates the salient features of Tat in terms of structure, isolation and further
therapeutic applications
21

Although Tat is an extra-cellular protein, it has a unique ability to translocate
across the cell membrane. This unique feature of Tat has been first reported by Frankel
and Pabo (Frankel and Pabo 1988). After that Tat protein or Tat derived peptide
sequences have been utilized as novel delivery vehicles for internalization of wide
varieties of “cargo molecules” inside the living cells. The cargo molecules include
nanoparticles (Lewin et al. 2000), quantum dots (Ruan et al.), DNA (Abu-Amer et al.
2001), enzymes (Schwarze et al. 1999), liposomes (Torchilin et al. 2001), proteins (Caron
et al. 2001), small molecules of drugs (Polyakov et al. 2000) etc. The excellent delivery
efficiency of Tat has facilitated the trans-cellular transduction of active therapeutic agents
(Brooks et al. 2005; Wadia and Dowdy 2003; Zorko and Langel 2005) for the treatment
of different diseases, such as, cancer (Wadia and Dowdy 2005).
It is important to mention here that Tat is functional in monomeric form only; not
in dimeric or polymeric forms (Jeang et al. 1999). Hence, in order to carry out all of the
above mentioned research studies, isolation of monomeric Tat is necessary. However, the
isolation of monomeric Tat protein presents several challenges. Tat includes a cysteine-
rich region, a hydrophobic core sequence, a highly basic region, and a glutamine-rich
region (Bayer et al. 1995; Ruben et al. 1989; Stauber and Pavlakis 1998) as shown in
Figure 2.5. It binds to different cellular proteins, and also due to cysteine rich region
tends to form large complex polymers. The basic region of Tat has a strong interaction
with TAR region of RNA to form complex (Stauber and Pavlakis 1998).
2.3.3 Column chromatographic separation of proteins
In all the column chromatographic techniques, the mixture of proteins is present
in a liquid phase (mobile phase) and percolated through a column containing solid matrix
(stationary phase). As the mixture flows through the column, different components of the
mixture interact to different extent with the solid matrix and fractionate (Regnier 1987a)
as shown in Figure 2.6. The type and extent of interaction depends on the nature of solid
matrix as well as on the proteins. Column chromatographic techniques can be broadly
classified into four categories depending on the mode of fractionation as demonstrated in
Figure 2.4.
22

Column Chromatography
Gel Permeation or Size ExclusionChromatography
Affinity Chromatography
Ion-exchange Chromatography
Hydrophobic Interaction
Chromatography
Figure 2.6 Different types of column chromatographic separation of proteins
23

Gel-permeation / Size exclusion chromatography (size-based): This fractionation
technique is based solely on the size of the protein molecules (Porath and Flodin 1959).
The column is packed with porous gel beads (e.g. polysaccharide). Small protein
molecules penetrate through the beads and retarded, whereas, the larger proteins can not
enter the porous structure of the beads and elute first. A schematic diagram of this
technique is presented in Figure 2.6. Different kinds of proteins, including antibodies,
have been separated using this technique (Barth et al. 1994). Size exclusion
chromatography has also been used for the estimation of molecular weight of proteins
(Irvine 1997).
Ion exchange chromatography (charge-based): This chromatographic technique
fractionates proteins by electrostatic interaction based on charge of the molecules
(Levison 2003) as shown in Figure 2.6. It can differentiate between oppositely charged
species as well as species with different amount of charges. pH and ionic strength of the
mobile phase is manipulated to achieve the desired difference in electrical properties
between the molecules. Both cation (Torres and Peterson 1990) and anion (Peterson 1978)
exchange columns are used for protein separation by this technique. Often,
diethylaminoethyl or quaternary ammonium salts are used as anion exchange and
carboxymethyl is used as cation exchange groups (Amesham Biosciences).
Hydrophobic interaction chromatography (hydrophobic interaction-based): In this
technique, stationary phase is loaded with hydrophobic groups, such, as phenyl, butyl, etc.
Proteins containing higher hydrophobic side chains interact with the stationary phase and
retarded, whereas, less hydrophobic proteins are eluted first (Fausnaugh et al. 1984b).
Sometimes, to increase the selectivity, mobile phase with high ionic strength is used.
Reverse phase chromatography (RPC) based on hydrophobic interaction is also used.
High-performance liquid chromatography (HPLC), based on RPC, is most widely used
protein separation technique (Regnier 1987b). It speeds up the separation by applying
pressure to the mobile phase using a pump. However, there are some basic differences in
the separation principles of HIC and RPC (Fausnaugh et al. 1984a).
24

Affinity chromatography: This kind of chromatography is associated with highest level
of selectivity as specific biological interactions are commonly used (Riggin et al. 1991;
Voet et al. 2004). In this technique, a ligand, that has specific interaction with the target
protein, is immobilized into the stationary phase. When mixture of proteins percolates
through the column, only the target protein is captured. In next step, the target protein is
eluted by changing the pH or applying high salt concentration or applying a protease. A
detailed review article has been published by Varilova and co-workers (Varilova et al.
2006) describing various kinds of solid matrix used for affinity chromatography of
proteins, including beads and membranes. Some well known protein-ligand interactions
are enzyme-substrate and antibody-antigen. Additionally, tagged proteins are also
isolated using this technique. Target protein is tagged previously with an active
group/molecule that has specific interaction with the ligand attached to the stationary
phase, and then separated using affinity chromatography. Histidine-tagged proteins are
separated by this technique using Ni+2 as the ligand (Lechtken et al. 2006).
Chromatographic technique, involving immobilized metal ions as affinity ligand (Chaga
2001), is well known as immobilized metal affinity chromatography (IMAC).
2.3.4 Membrane based separation of proteins
Membrane based separation of proteins are well known in biotechnology, food
and pharmaceutical industries. Membrane based protein separation techniques can be
broadly classified in three types, depending on size, charge and affinity of the molecules
as shown in Figure 2.7.
Size based membrane separation of proteins: Traditional membrane separation
techniques, such as ultrafiltration (UF) and microfiltration (MF), fall under size based
separations. In UF and MF, proteins are separated based on their molecular weight, using
particular molecular-weight-cut-off (MWCO) membranes. However, selectivity of
proteins with moderately different molecular weights is poor by ordinary UF or MF.
25

Membrane Separation of Proteins
Size Based
Charge Based
Affinity Based
Group Specific Bio-Specific
UltrafiltrationMicrofiltration
Ion ExchangeChromatography
IMAM (Ni-Histidine)
Antigen-AntibodyAvidin-Biotin
Figure 2.7 Classification of membrane separation of proteins based on size, charge and
interaction
26

Sometimes, moderately different molecular weight proteins are separated by
manipulating the operating conditions, such as pH, ionic strength, etc (Nystrom et al.
1998; Saksena and Zydney 1994; van Eijndhoven et al. 1995). Stacked ultrafiltration
membranes have also been used to separate proteins, closer in size, from mixture with
higher selectivity (Feins and Sirkar 2004). Occasionally, to increase the selectivity, UF is
followed by diafiltration (van Eijndhoven et al. 1995).
Charge based membrane separation of proteins: Ion exchange membranes separate
protein based on charge interaction (Avramescu et al. 2003; Yang et al. 2002). This
technique is generally applied when the mixture of proteins is such that the isoelectric
point (PI) of the target protein is significantly different than that of unwanted proteins.
The pH of the solution is adjusted to induce a charge to the target protein and then it is
separated using an ion exchange membrane containing oppositely charged groups. The
target protein is eluted by changing the pH again. A positively charged chitosan
membrane, cross linked with glycol diglycidyl ether, has been used to separate ovalbumin
(PI = 4.6) from a mixture with lysozyme (PI = 11), and human serum albumin (PI = 4.8)
from a mixture with cytochrome c (PI = 10.6) (Zeng and Ruckenstein 1998).
Affinity based membrane separation of proteins: Affinity based separation using
functionalized membranes has opened a new horizon for selective isolation of proteins
from mixtures in the downstream processing of biotechnological and pharmaceutical
industries. Two types of interactions are generally being used; group-specific interaction
and bio-specific (biological) interaction. Group specific interaction is associated with
higher capacity, but lower selectivity. Immobilized metal ion affinity membranes
(IMAM), such as Ni+2 or Cu+2 immobilized membranes, for separation of histidine-
tagged proteins is well known example of group specific interaction in membranes. A
comprehensive review article on IMAM containing types of membrane matrices,
chelating agents, metal ions and membrane modules is available (Suen et al. 2003).
This dissertation focuses on affinity membrane separation of proteins based on
biological interaction. Affinity separation, involving very specific interaction based on
biological properties, is more attractive among the biotechnologists (Brandt et al. 1988;
27

Charcosset 1998; Datta et al. 2007; Datta et al. 2006; Hollman et al. 2005; Jain et al. 2007;
Klein 2000; Roper and Lightfoot 1995; Thoemmes and Kula 1995; Zou et al. 2001).
Background study of affinity membrane separation is discussed in detail below.
Some commonly used interactions are avidin-biotin, antigen-antibody, enzyme-
substrate or oligonucleotide-protein binding (Klein 2000; Zou et al. 2001). Among the
above mentioned interactions, avidin-biotin interaction is widely used (Green 1975;
Jahraus et al. 1998) because of the high association constant of 1015 M-1. This is much
higher than that detected for strongest known antigen-antibody interaction of 106-109 M-1
(Piramowicz et al. 2006). In fact, avidin-biotin is the strongest known non-covalent
biological interaction, which remains unaffected up to 132 0C and pH of 2-13 (Savage
1992).
Biotin is a vitamin that is abundant in living cells of liver and kidney. It has a
molecular weight of around 244 and isoelectric point of 3.5. Structure of biotin is given
in Figure 2.8. Avidin is a tetrameric protein with combined molecular weight of 67,000
and isoelectric point of 10 (Savage 1992). Four subunits are identical and each has strong
interaction with biotin. Thus, one mole of tetrameric avidin in ideal situation could bind
four moles of biotin (Green 1965; Green 1975; Piramowicz et al. 2006). The mechanism
of association between avidin and biotin is not clear yet. van der Waals force and
hydrogen bonding network between the biotin and amino acid residues of avidin, mainly
the Tryptophan (Trp) and Lysine (Lys) residues, are suspected to have principle roles in
the interaction (Grubmuller et al. 1996; Livnah et al. 1993). Avidin-biotin interaction has
been used by many researchers to immobilize enzymes on a membrane (Amounas et al.
2000; Bhardwaj et al. 1996; Butterfield et al. 2001). It has also been used for creating
biomaterials (Zheng Liu 2004), assay elements (J.-L. Guesdon 1979), sensors (T. Hoshi
1995) and bioseparations (Datta et al. 2006).
Affinity membrane separation is also known as membrane chromatography or
recognition based membrane separation. Membrane chromatography, as introduced first
by Brandt et al., could combine capture and purification steps for the processing of large
amount of protein at a shorter processing time (Brandt et al. 1988).
28

C
O
HN NH
HC CH
H2C CH (CH2)4COOH
S
C
O
C
O
HN NH
HC CH
H2C CH (CH2)4COOH
S
(a)
-{ }-Lys-Trp-Thr-{ }-Asn-Trp-Lys-{ }-Met-Trp-Leu-{ }-Asp-Trp-Lys-{ }- 9 10 11 69 70 71 96 97 98 109 110 111
(b)
Figure 2.8 (a) Structure of biotin and (b) partial primary structure of avidin showing the
tryptophan (Trp) amino acid residues.
29

Thoemmes and Kula (Thoemmes and Kula 1995) in their review article have
specifically highlighted several hydrodynamic advantages of membrane chromatography
over conventional column chromatography. Due to convective flow within the membrane,
mass transfer resistance is reduced; resulting in shorter cycle time, thereby minimizing
the protein denaturation, whereas, in column chromatography the hydrodynamics are
controlled by diffusion. Therefore, affinity based separation in membranes has the ability
to obtain superior quality of purified protein in a substantially lower processing time than
the conventional column chromatographic separation. Again, the thinner module of
membranes enables a lesser pressure drop in comparison to column chromatography.
Beside that, it is also easy to scale up membrane processes to large-scale processes.
Charcosset (Charcosset 1998) in his review article, has described the ligand and
membrane material performances. They categorized the applications of membrane
chromatography based on the nature of the ligand used. The ligands mentioned were
amino acids, antigen-antibody, dye, metal affinity and other biomolecules. Klein (Klein
2000) has described the types of membranes and modules that can be used for affinity
based membrane separation, the kinetics of the affinity based separation and the
applications.
Development and applications of functionalized membranes for affinity
separation of proteins have been studied extensively (Zeng and Ruckenstein 1999; Zou et
al. 2001). So far functionalized membranes have been used for affinity separation of
lysozyme from egg white using chitin membrane (Ruckenstein and Zeng 1997); BSA
using the antibody anti-BSA in flat sheet of RC membrane (Kugel et al. 1992) as well as
hollow fiber module containing RC membrane (Hout and Federspiel 2003); IgG using
protein A/G in composite cellulose membrane (Mandaro R. M. 1987; Ritter 1991a) as
well as functionalized PVDF membrane (Ritter 1991b); pyruvate decarboxylase using
cibacron blue F3GA dye in nylon membrane (Champluvier and Kula 1991); fibronectin
using gelatin in modified PES-poly(ethylene) oxide membrane (Brandt et al. 1988), the
enzyme horseradish peroxidase using concanavalin A in cellulose membrane (Guo and
Ruckenstein 2003) and hormone 17-β-estradiol using its antibody (Urmenyi et al. 2005).
Mathematical analyses of affinity based membrane separation of proteins have
been studied, considering different perspectives of transport and interaction of
30

biomolecules within the membrane (Boi et al. 2007; Briefs and Kula 1992; Hout and
Federspiel 2003; Suen and Etzel 1992). Effects of the variation in different process
parameters, such as, diffusivities and reaction rate constants, have been critically
examined.
Fouling: The most severe problem associated with the practical application of membrane
processes to protein solutions are the decrease in permeate flux with time due to fouling
of the membrane surface and pores. In fact, the applicability of UF and MF processes in
protein separation is limited by protein-membrane and protein-protein interactions that
lead to irreversible alteration or fouling of the membrane surface and pore structure
(Bowen et al. 1995; Bowen and Gan 1991; Hlavacek and Bouchet 1993; Ho and Zydney
2000; Kelly and Zydney 1995; Marshal et al. 1993; Palacio et al. 2003; Tracy and Davis
1994; Velasco et al. 2003). To minimize the protein-membrane interactions, and hence to
improve the separation efficiency, the membrane material needs to be hydrophilic and
resistant to the prevailing experimental conditions.
Marshall et al. (Marshal et al. 1993) have presented an extensive literature review
on protein fouling in UF and MF. They described the effects of feed properties
(concentration, pH, ionic strength and nature of components), membrane materials
(hydrophobicity, pore size and charge), and operating conditions (transmembrane
pressure and cross flow velocity) on the permeate flux, protein retention and selectivity.
They suggested a three step mechanism of fouling, which consists of an initial flux drop
due to concentration polarization, a decline in flux due to the formation of monolayer of
protein by deposition, followed by a slow decline in flux due to further deposition of
protein molecules. They have also pointed out the difference between the compaction,
concentration polarization and fouling. Effect of different process parameters, such as,
pH and ionic strength, on thickness of adsorbed foulant layer has also been studied
(Zeman 1983).
Ho and co-worker (Ho and Zydney 2006) have presented a review article on
overview of fouling, highlighting the modeling approaches based on classical blocking
mechanisms. In general, the phenomenon of flux decline due to membrane fouling can be
described in terms of four blocking mechanisms (Bowen et al. 1995):
31

1. In the standard blocking model, it is assumed that reduction in effective radii occurs
due to the adsorption of molecules in pore walls.
2. In the complete blocking model, each molecule is assumed to block a pore.
3. In the intermediate blocking model, some molecules are assumed to block the pores
and some attached to nonporous surface.
4. Finally, in the cake filtration model, a protein layer (cake) is assumed to cover the
active membrane face.
For all of the blocking mechanisms common mathematical expression is
( )βα −=− 3v
v Jdt
dJ
Where, Jv = Permeate flux; and α and β are the model parameters whose values are
dependent on specific blocking mechanism.
Many researchers have tried to analyze their experimental data of flux decline for
the same protein with a single fouling mechanism, but they differ in finding out the most
appropriate mechanism to be applicable for that protein (Ho and Zydney 2000). Bowen
and Gan (Bowen and Gan 1991) have used standard blocking mechanism to analyze their
data of fouling of capillary pore aluminium oxide membranes by BSA, whereas,
Hlavacek and Bouchet (Hlavacek and Bouchet 1993) used intermediate blocking
mechanism, and Kelly and Zydney (Kelly and Zydney 1995) used a modified complete
blocking model to satisfactorily explain the flux decline for BSA. Tracey and coworker
(Tracy and Davis 1994) and Bowen and coworkers (Bowen et al. 1995) showed the
transition of fouling mechanism with respect to time. They observed that at short times
the fouling follows a particular mechanism, which at longer times shifted to another
mechanism. This has suggested the involvement of complex theories of fouling, which
could not be explained by a single fouling mechanism. Ho and Zydney (Ho and Zydney
2000) were the first to develop a mathematical model, which incorporates both the initial
fouling by complete blocking mechanism and subsequent fouling by cake filtration
mechanism. In this way, they have eliminated the need of using two different equations to
describe fouling in two time domains. Their model predicted flux showed excellent
agreement with the experimental data obtained for the permeation of BSA through
polycarbonate MF membrane throughout the course of the experiment. Later, Zydney and
32

coworkers (Palacio et al. 2003) studied the fouling behavior for protein mixtures, BSA-
lysozyme and BSA-pepsin. They have used the previously described combined model to
predict the flux and to evaluate the effect of mixture composition on protein aggregates.
The predicted results were in good agreement with the experimental data, which proved
the applicability of this model for mixture of proteins.
Chan and co-worker (Chan and Chen 2004) reviewed the phenomenon of fouling
on the perspective of different techniques used for the characterization of nature of
foulants and morphology of fouled membranes. They described electron para-magnetic
resonance spectroscopy (EPRS), scanning electron microscopy (SEM), atomic force
microscopy (AFM), attenuated total reflection-Fourier transform infrared spectroscopy
(ATR-FTIR), ellipsometry, small angle neutron scattering (SANS), confocal microscopy
and matrix-assisted laser desorption ionization-mass spectrometry (MALDI-MS) as
characterization tools.
2.4 Biocatalysis
Biocatalytic reactions involving enzyme and substrate are extremely important
and a very promising area of research. In fact, the whole metabolism of human body is
controlled by biocatalytic reactions involving different enzymes. Enzymes are also
extensively used in food, pharmaceutical and biotechnological industries (McGregor and
Editor 1986). A brief introduction of enzymes, highlighting the enzyme Glucose oxidase,
their immobilization techniques in solid support and kinetic studies are presented below.
2.4.1 Enzyme
Enzymes are a special group of proteins that act as catalysts in a very selective
manner. The reaction involving enzymes is known as biocatalysis and the reactant that is
being catalyzed with a high degree of specificity is called the substrate (s). The high
degree of specificity of an enzyme for a substrate can be attributed to the complementary
geometric and electronic structure of the binding sites of the enzyme and substrate (Voet
et al. 2004). Some enzymes do require a non-covalently bound small group/moiety to
33

show their activity. This small group/moiety is known as a cofactor. Cofactors may be
metal ions, such as, Cu+2, Fe+3. When an organic molecule acts as cofactor then it is
called coenzyme, such as flavin. Enzymes are widely used in food industries. For
example use of amylase in brewing, lactase in stabilization of milk, lipase in cheese
making, glucose oxidase in removal of O2 and/or glucose from beer and cheese are well
documented (Whitaker 1994). Among these enzymes, glucose oxidase (GOX) is one of
the most popular, and has been used in our research related to biocatalysis. Additional
background information about GOX is provided below.
Glucose oxidase (GOX): Glucose oxidase (GOX) is a well known enzyme from
nineteenth century since Müllar has reported its activity in Aspergillus Niger (Muller
1928). GOX is very specific to the substrate β-D Glucose (Johnson et al. 2002) and
catalyzes the oxidation of β-D glucose to δ-gluconolactone and hydrogen peroxide in a
two step mechanism, known as Ping Pong Bi Bi mechanism (Figure 2.9). In first step, the
co-factor of the enzyme, flavin adenine dinucleotide (FAD) oxidizes glucose to δ-
gluconolactone and itself converts to the reduced form (FADH2). In the second step,
FADH2 is oxidized back to FAD by O2, which itself reduces to H2O2. δ-gluconolactone is
an unstable compound, and immediately forms gluconic acid. The mechanism and
kinetics of glucose oxidation by GOX has been extensively studied by several researchers
(Duke et al. 1969; Gibson et al. 1964; Weibel and Bright 1971) and summarized in the
literature (Leskovac et al. 2005). The structure of GOX has also been studied (Hecht et al.
1993). GOX is a dimeric protein consisting of two subunits of molecular weight 80 KDa
each and connected by disulfide bond. Each subunit contains a non-covalently attached
FAD and a ferrous iron (Wong and Editor 1995). There are three amino acid residues in
the proximity of the active sites, namely, two histidine and one glutamic acid residues
(Leskovac et al. 2005). Factors affecting the kinetics of glucose oxidation by GOX, such
as pH (Bright and Appleby 1969; Chen and Weng 1986; Li et al. 1998), temperature (Li
et al. 1998) and inhibition by product H2O2 (Bao et al. 2003) has been demonstrated
thoroughly. Mathematical modeling of the kinetics of immobilized GOX has also been
reported (Parker and Schwartz 1987).
34

H
H
H
HH
H
O
OO
O
O
O
O
H
H
H
H
O
O
O
O
O
O
H
H H
H H
H
O
O
O
O
O
O
FAD
FADH2O2
H2O2 FAD
FADH2O2
H2O2
Gluconic acid
δ-D-Gluconolactone
β-D-Glucose
Figure 2.9 Enzymatic oxidation of glucose to gluconolactone by Glucose Oxidase (GOX).
Gluconolactone immediately converts to gluconic acid. Cofactor of GOX, FAD, first
converts to reduced form, FADH2, and then oxidized to FAD by O2
35

Immobilization of GOX in solid support: The activity of traditional covalently
immobilized GOX in solid matrix is significantly low. The lower activity can be
attributed to the conformation change of the enzyme in contact with solid support and
also to the mass transfer resistances. To improve the situation, researchers have explored
different new techniques of GOX immobilization. Table 2.1 summarizes some of the
recent approaches adopted by the researchers along with the result of the kinetic study.
One approach has been to keep the mode of attachment the same (i.e. covalent)
but modify the solid matrix. For example, covalent attachment of GOX in different
activated beads/particles (Ahuja et al. 2007; Hou et al. 2007; Ozyilmaz et al. 2005),
nanoparticles (Pandey et al. 2007), membranes (Rauf et al. 2006; Ying et al. 2002) and
films (Li et al. 1998) have been reported in literature. The other approach is the non-
covalent attachment of GOX on the solid matrix. Electrochemical polymerization (Ekinci
et al. 2007), Layer-By-Layer deposition along with gold nanoparticles (Hoshi et al. 2007),
electrostatic immobilization on anionic polystyrene beads (Tomotani and Vitolo 2007),
electrostatic immobilization on LBL assembled nylon membrane (Smuleac et al. 2006)
and LBL assembly along with multiwall carbon nanotubes on gold electrode (Zhao and
Ju 2006) are to mention a few. Site-directed immobilization (Ahuja 2006) of GOX has
also been studied. Although extensive studies were carried out to solve the problem of
conformation change by proper immobilization, the issue of mass transfer resistance
acquired less attention. Our research group has addressed this issue and used convective
flow instead of diffusion (Smuleac et al. 2006).
Kinetic study of GOX: The kinetics of free and immobilized enzymes are generally
studied and compared by the well known Michaelis-Menten equation, which is discussed
elaborately in Chapter 6. Two important kinetic parameters of Michaelis-Menten
equation are vmax and Km. vmax is the maximum attainable rate at an imaginary substrate
concentration of infinity, whereas Km is the substrate concentration at which rate
becomes half of vmax. Both parameters, in combination, indicate the affinity of the
enzyme towards the substrate. One would expect higher value of vmax and lower value of
Km for homogeneous phase compared to immobilized phase.
36

Table 2.1 A comparative study of types of solid matrix used and kinetic parameters
obtained for different GOX immobilization techniques reported in literature. MUDA =
mercaptoundecanoic acid, EDC = N-ethyl-N’-(3-dimethylaminopropyl) carbodiimide,
NHS = N-hydroxysuccinimide, PMMA = poly(methylmethacrylate), PSt = poly(styrene),
GMA = Glycidolmethacrylate, APTES = 3-aminopropyltrimethoxysilane, PAA =
poly(acrylic acid), PVDF = polyvinylidene fluoride, AAc = acrylic acid, CA = cellulose
acetate
0.2172590.43568.2CovalentMagnesium silicate + APTESOzyilmazet al. 2005
0.62 mM/min
80.60.78 mM/min
45CovalentGrafted AAc on Polyanilinefilm
Li et al.
1998
14x10-410.548x10-44.9CovalentGrafted PAA on PVDF membrane
Ying et al. 2002
15.5mM/mg-min
35.221.65 mM/mg-min
23.3CovalentPSt-GMA MicrosphereHou et al. 2007
1.17 mM/min
41.651.34 mM/min
17.42CovalentCA-PMMA membrane+Glutaraldehyde
Rauf et al. 2006
14.2x10-43.742.5x10-45.85CovalentAu nanoparticle+MUDA+EDC-
NHS
Pandey et al. 2007
0.05239.30.273 25CovalentPolystyrene beads activated with hydrazide + Glutaraldehyde
Ahuja et al. 2007
0.248290.273 25Site-directedPolystyrene beads activated with hydrazide + Glutaraldehyde
Ahuja et al. 2007
34x10-4-57x10-4-ElectrostaticAnioinic polystyrene beads+UF membrane
Tomotaniand Vitolo
2007
0.04 (µmole/min-ml)
11.80.68 (µmole/min-ml)
3.0EntrapmentPt-electrode coated with copolymer of Pyrrole and
Polystyrene
Ekinci et al. 2007
vmax(mmole/min-
mg)
Km(mM)
vmax(mmole/min-mg)
Km(mM)
Immobilized GOXFree GOX
Kinetics StudyMode of GOX immobilization
Types of solid matrixReferences
0.2172590.43568.2CovalentMagnesium silicate + APTESOzyilmazet al. 2005
0.62 mM/min
80.60.78 mM/min
45CovalentGrafted AAc on Polyanilinefilm
Li et al.1998
14x10-410.548x10-44.9CovalentGrafted PAA on PVDF membrane
Ying et al. 2002
15.5mM/mg-min
35.221.65 mM/mg-min
23.3CovalentPSt-GMA MicrosphereHou et al. 2007
1.17 mM/min
41.651.34 mM/min
17.42CovalentCA-PMMA membrane+Glutaraldehyde
Rauf et al. 2006
14.2x10-43.742.5x10-45.85CovalentAu nanoparticle+MUDA+EDC-
NHS
Pandey et al. 2007
0.05239.30.273 25CovalentPolystyrene beads activated with hydrazide + Glutaraldehyde
Ahuja et al. 2007
0.248290.273 25Site-directedPolystyrene beads activated with hydrazide + Glutaraldehyde
Ahuja et al. 2007
34x10-4-57x10-4-ElectrostaticAnioinic polystyrene beads+UF membrane
Tomotaniand Vitolo
2007
0.04 (µmole/min-ml)
11.80.68 (µmole/min-ml)
3.0EntrapmentPt-electrode coated with copolymer of Pyrrole and
Polystyrene
Ekinci et al. 2007
vmax(mmole/min-
mg)
Km(mM)
vmax(mmole/min-mg)
Km(mM)
Immobilized GOXFree GOX
Kinetics StudyMode of GOX immobilization
Types of solid matrixReferences
37

However, the reverse trend is not impossible, and has already been reported for in
the literature (Pandey et al. 2007) as shown in Table 2.1. The activity of an enzyme
depends on its conformation under existing conditions. Pandey and co-workers have
carried out circular dichroism studies, which revealed a favorable conformational change
of GOX due to binding upon thiolated gold nanoparticles. It was also mentioned that,
secondary and tertiary structures of free GOX may restrict the active site accessibility.
Additionally, the accessibility could be reduced due to aggregation in homogeneous
phase by protein-protein interaction.
2.5 Concluding remarks
From the detailed background study of the research areas relevant to this
dissertation, the following interesting observations can be made.
Affinity based membrane separation of proteins: Various studies have been reported
with avidin-biotin interaction, but, quantification of the immobilized avidin sites within
membranes by biotinylated probe molecules has never been done. Affinity separation of
Tat has already been demonstrated by our research group (Hollman et al. 2005); however,
attempt has not been made to improve the accessibility, processing time and fouling of
the membranes by incorporating a prefiltration step.
Immobilized enzymatic catalysis: Researchers have exploited various solid matrices for
enzyme immobilization; however, major studies are based on covalent attachment. The
research works involving electrostatic immobilization have paid less attention to the
reusability of the matrix. Enzyme immobilization by LBL assembly is a comparatively
new technique, and is yet to be explored properly. Although, PVDF membranes have
been used for covalent attachment of GOX, it has never been used for electrostatic
immobilization of GOX.
Copyright © Saurav Datta 2007
38

Chapter 3 Experimental and Analytical Procedures
This chapter describes the experimental methods and the analytical techniques
used in this dissertation for functionalized membrane based bioseparation and
biocatalysis. The equipments and materials involved are also presented here.
3.1 Equipments
A stirred membrane cell purchased from Millipore Corporation (Product number
XFUF07601) was used for all the experiments related to the bioseparation project. To
ensure complete mixing in the cell, mixtures were stirred with a magnetic stirrer. The
effective external surface area of the membranes in this cell was 33.2 cm2.
For the biocatalysis part of the dissertation, all the experiments were carried out in
a stainless steel membrane cell from Osmonics. The effective external surface area of the
membranes in this cell was 13.2 cm2.
3.2 Materials
3.2.1 Membranes
The acyl-anhydride functionalized nylon based microfiltration (MF) membranes
(Immunodyne ABC, pore diameter 0.45 µm, thickness 165 µm, porosity 80 % as
supplied by manufacturer) used in all affinity separation experiments were purchased
from Pall Corporation. 100KDa MWCO regenerated cellulose membranes were used for
ultrafiltration (UF) experiments and hydrophilized PVDF membranes (Pore size 0.1 µm)
were used for MF experiments. These two types of membranes were purchased from
Millipore Corp.
The nylon based acyl-anhydride activated Immunodyne membranes were again
used for the Layer-By-Layer (LBL) experiments for biocatalysis. Hydrophobic PVDF
membranes (pore diameter 0.45 µm, thickness 125 µm, porosity 75 % as supplied by
manufacturer), used for the rest of the biocatalysis experiments, were purchased from
Millipore Corporation.
39

Unactivated regenerated cellulose (RC), nylon and cellulose acetate (CA)
membranes were activated using different techniques. CA (pore diameter = 0.45 µm,
thickness = 125 µm) and RC (pore diameter = 0.2 µm, thickness = 125 µm) membranes
were purchased from Sartorius. Nylon membranes (pore diameter = 0.2 µm, thickness =
165 µm) were purchased from Pall Corp.
3.2.2 Chemicals
Biotinylated-bovine serum albumin (BBSA), Factor Xa and Biotin Quantification
Kit were purchased from Pierce Biotechnology. Gamma Globulin (GG) and the reagents
for Bradford protein assay were purchased from Bio-Rad Laboratories. Unless specified
otherwise, all other chemicals used in the bioseparation project were purchased from
Sigma Corporation. The bacterial lysate supernatant was prepared in the Department of
Anatomy and Neurobiology, University of Kentucky.
The enzyme Glucose Oxidase from Aspergillus Niger (GOX, Product No. G0543,
MWt. 160000), β-D (+) Glucose (Product No. G5250, MWt. 180) and Poly-L-Lysine-
hydrochloride (PLL, Product No. P9404, MWt. 105500, MWt. of repeat units 164.5)
were purchased from Sigma. Poly(sodium 4-styrenesulfonate) (PSS, Product No. 243051,
MWt. 70000, MWt. of repeat units 206), Poly(allylamine-hydrochloride) (PAH, Product
No. 283223, MWt. 56000, MWt. of repeat units 93.5), 15 % solution of Titanium
Oxysulfate in dilute H2SO4 (Product No. 495379), Benzoyl Peroxide (Product No.
179981), Trimethylolpropane triacrylate (TMPTA, Product No. 246808), Anhydrous
Toluene (Product No. 244511) and Acrylic Acid (Product No. 147230, MWt. 72) were
purchased from Aldrich. Epichlorohydrin (ECH), 1, 4-butanediol diglycidol ether
(BDDE), 1, 1’-carbonyldiimidazole (CDI), Sodium Periodate (NaIO4), and para-amino
benzoic acid (PABA) were purchased from Sigma-Aldrich.
Unless mentioned otherwise, rest of the chemicals, including the de-ionized ultra
filtered water (DIUF), were purchased from Fisher Scientific.
40

3.3 Analytical procedures
All spectrophotometric measurements in the UV and visible range were done by
UV-VIS Spectrophotometer (Varian, Cary 300).The concentrations of BABA were
determined by measuring the absorbance directly at 264 nm. Amount of immobilization
of avidin was determined by measuring the concentration in the feed and permeate using
the well known Bradford Protein Assay technique (Bradford 1976) at 595 nm. The same
procedure was followed for measuring pure BBSA concentrations. The salt-wash
solutions were also analyzed by the Bradford Assay to quantify the reversibly adsorbed
species (avidin, BABA, BBSA). BBSA in mixture with GG was quantified by measuring
the biotin content of BBSA using HABA ((2-(4´-Hydroxyazobenzene) Benzoic Acid)-
avidin complex method (Green 1965). The linear range of detection for BABA was 0.1-
25 µg/ml and the analytical error was less than 1 % for 10-25 µg /ml, 1-5 % for 1-10 µg
/ml and 5-15 % for 0.1-1 µg /ml. The linear range of total protein analyses by Bradford
Protein Assay was 1-24 µg /ml and the analytical error was less than 1 % for 2-24 µg /ml
and 1-10 % for 1-2 µg /ml of protein solutions in this research work. The lower limit of
detection of biotin for HABA-avidin complex method was 5 x 10⁻⁴ µmoles/ml of biotin
with analytical error of 5 %. To check the reproducibility, the analyses were triplicated.
Qualitative analyses of Tat protein was conducted by Sodium Dodecyl Sulfate-
Polyacrylamide Gel Electrophoresis (SDS-PAGE) and Western Blot analysis as
described below. Quantification of total protein in bacterial lysate (BL) was carried out
by Bradford Assay, and that of Tat protein was carried out by Enzyme-Linked-Immuno-
Sorbent-Assay (ELISA). One of the additional goals of this research was to quantify the
biotinylated-Tat present in different solutions of pre-filtered BL feed by an easy analysis
of biotin. This has enabled to surpass the requirement of complex analysis of Tat by
ELISA. This analysis was not possible for unfiltered BL feed due to the presence of
impurities which interferes with the assay. Biotinylated Tat protein present in different
streams of pre-filtered affinity separation experiments was quantified by measuring the
biotin content using HABA-avidin complex method (Green 1965). Detail of the
analytical protocol is mentioned below.
41

SDS-PAGE: SDS-PAGE was used to carry out qualitative analysis of proteins in
different streams of Tat separation experiments, such as, feed, permeate, retentate, wash
buffer 1 (WB1), wash buffer (WB2), cleavage buffer (CB) and eluate. SDS, being an
anionic surfactant, denatures proteins and induces a uniform mass to charge ratio to all
the proteins present in the mixture. So, the migration of proteins through the gel is strictly
controlled by the size, i.e. molecular weight of the proteins. Therefore, SDS-PAGE
fractionates proteins, and because of the presence of a tracking dye, generates bands in
different location for proteins of varying molecular weights. In our case, a 15 %
polyacrylamide gel was used under reducing environment of dithiothreitol (DTT).
Coomassie blue or bromophenol blue was used as tracking dye.
Western Blot analysis: Western Blot analysis works on the principle of interaction with
an antibody to the target protein. Hence, it is very sensitive and selective. Any band that
shows up in a Western Blot, irrespective of the location, is due to the target protein. In
our case, monoclonal mouse anti-Tat antibody and goat anti-mouse IgG were used as
primary and secondary antibodies, respectively. The blot was developed with Amersham
ECL kit (GE Healthcare) and exposed on a Kodak Bioquant system.
Biotin analysis: HABA-avidin complex method works on the ability of binding of HABA
with avidin to give an absorption band at 500nm. The absorption decreases
proportionately as biotin is added to the solution to displace HABA. By measuring the
decrease in absorbance at 500nm, the amount of biotin in different solutions was
measured. Then amount of Tat protein was calculated considering 1:1 molar ratio of
biotin to Tat. Accuracy of the analysis was tested by adding known quantity of
biotinylated-BSA in different BL solutions.
For the biocatalysis part of the research, the analytical techniques used were as
follows.
42

Analysis of PAH and PLL: PLL and PAH were quantified with a Total Organic Carbon
(TOC) analyzer from Shimadzu (TOC 5000 A) using a calibration curve in the range of
5-100 ppm. The analytical error for this analysis was 5-10 %.
Analysis of PSS: PSS in a layer was quantified by measuring the absorbance in feed,
permeate and wash directly at 261 nm using the UV-VIS spectrometer. The linear range
of detection for PSS was 1-400 ppm and the analytical error was less than 1 %.
Analysis of GOX: Amount of GOX in a solution was determined by the well known
Bradford Protein Assay (Bradford) using a calibration curve prepared from GOX at 595
nm. The linear range of Bradford Protein Assay was 1-24 µg/ml and the analytical error
was less than 1 % for 2-24 µg/ml and 1-10 % for 1-2 µg/ml of GOX in this research work.
Analysis of H2O2: H2O2 in solution was analyzed by a colorimetric method (Clapp et al.
1989) using acidified titanium oxysulfate and measuring the absorbance at 407 nm. The
linear range of calibration for H2O2 analysis was 0.03-3 mM (1-100 ppm), and the
analytical error was less than 5 % for 1-3 mM and 5-10 % for 0.03-1 mM.
3.4 Functionalization of membranes
3.4.1 Covalent immobilization of avidin in anhydride activated nylon membrane
Avidin was covalently immobilized on commercially available anhydride
activated nylon membrane by permeating in 0.05 M Na2HPO4 buffer (pH 9) at room
temperature (25 0C) and 0.68 bar (10 psi) pressure with constant stirring at 300 rpm.
Pressure in the cell was maintained by N2 gas. Avidin molecules became covalently
attached with the acyl-anhydride groups present in the membrane following the reaction
scheme shown in Figure 3.1. The avidin solution was recycled twice to attain the
saturation capacity. After immobilization of avidin, the membrane matrix was washed
with 50 ml of 0.25 M NaCl solution to remove the reversibly adsorbed molecules from
the membrane.
43

C
O
C
O
O R
:NH2-R’C
O
NH-R’
Figure 3.1 Reaction scheme for covalent immobilization of primary amine group
containing molecule (:NH2-R’) in activated nylon membrane. (:NH2-R’') could be avidin
or poly(L-Lysine) or GOX
44

3.4.2 Functionalization of anhydride activated nylon membranes based on LBL
technique for electrostatic immobilization of GOX
Development of LBL assembly in activated nylon membrane: Layers of
polyelectrolytes, mainly within the membrane pores, was assembled by alternative
electrostatic attachment of cationic and anionic polyelectrolytes under convective flow
and constant stirring conditions (Figure 3.2). For all layer formation steps, convective
flow was maintained by applying pressure using N2 gas. Convective flow was applied to
achieve the functionalization mainly within the membrane pores. Membrane pores were
preferred because of higher pore surface area over external membrane surface area. The
immobilization was non-stoichiometric. In order to ensure non-stoichiometric attachment
of subsequent layers, all layer formation steps were carried out in presence of 0.25 M
NaCl solution. The shielding effect of salt increases the availability of free charges for
the next layer.
In order to impart stability in subsequent layers, the first layer of PLL was
attached covalently in the membrane matrix. This was done by the reaction between the
terminal amine group of PLL and anhydride group of the membrane (Figure 3.1). The
first layer of PLL was attached by permeating 100 ml of 40 ppm PLL solution (4mg or
0.039 µmole PLL) in DIUF at 0.07 bar (1 psi) pressure, pH 9.3. The solution was
recirculated once. After that, the membrane was washed to get rid off the loosely
adsorbed molecules. The recirculation and washing steps were followed for all other
layer formation steps as well. As the first layer, PLL was preferred over PAH, because
the difference of pKa between the terminal amine group (pKa ~ 9) and amine groups in
the side chains (pKa ~ 10.5) of PLL is precisely known. Hence, at a pH of around 9.3, the
terminal amine group is uncharged, and therefore, forms covalent attachment
preferentially over the side chain amine groups, which are positively charged at that pH.
This has enhanced the probability of single point attachment of the first layer, rather than
multipoint attachment through the side chain amine groups. The side chain amine groups
provide free positive charges available for the next layer formation step. Layer formation
on surface was minimized by high stirring and never allowing the feed side volume to go
below 20 ml.
45

Figure 3.2 Schematic of formation of 7-layers of polyelectrolytes inside an anhydride
activated nylon based membrane using Layer-By-Layer (LBL) technique followed by
electrostatic immobilization of GOX
PLL + + ++ +
+ + ++ +
+ + ++ +
PSS1 + + ++ +
+ + ++ +
+ + ++ +
PAH1
+ + ++ +
+ + ++ +
+ + +
+ +
++
++
+
+ + ++ ++ + ++ +
+ + ++ +
+ + ++ +
+ + ++ +
+ + +
+ ++ + +
+ +
++
++
+++
++
+
PSS2
+ + ++ +
+ + ++ +
+ + +
+ +
++
++
+
+ + ++ +
+ + ++ +
+ + +
+ +
++
++
+
+ + ++ ++ + ++ +
+ + ++ +
+ + ++ +
+ + ++ +
+ + +
+ ++ + +
+ +
++
++
+++
++
+
PAH2
+++ ++
+ + ++ +
+ + ++ +
+ + +
+ +
++
++
++++ ++
+++
++
++
+ ++
++
+++
++
++
+
+++ ++
+++ ++
+ + ++ +
+ + ++ +
+ + +
+ +
++
++
+
+ + ++ +
+ + ++ +
+ + +
+ +
++
++
+
+ + ++ ++ + ++ +
+ + ++ +
+ + ++ +
+ + ++ +
+ + +
+ ++ + +
+ +
++
++
+++
++
++++ +++++ ++
+++
++ +++
++
++
+ ++
++
+ ++
++
+++
++
+++
++
++
+++
++
+
PSS3
+++ ++
+ + ++ +
+ + ++ +
+ + +
+ +
++
++
++++ ++
+++
++
++
+ ++
++
+++
++
++
+
+++ ++
+ + ++ +
+ + ++ +
+ + +
+ +
++
++
++++ ++
+++
++
++
+ ++
++
+++
++
++
+
+++ ++
+++ ++
+ + ++ +
+ + ++ +
+ + +
+ +
++
++
+
+ + ++ +
+ + ++ +
+ + +
+ +
++
++
+
+ + ++ ++ + ++ +
+ + ++ +
+ + ++ +
+ + ++ +
+ + +
+ ++ + +
+ +
++
++
+++
++
++++ +++++ ++
+++
++ +++
++
++
+ ++
++
+ ++
++
+++
++
+++
++
++
+++
++
+
PAH3PAH3
++++
+
+ + ++ +
+ + ++ +
+ + +
+ +
++
++
++++ ++
+++
++
++
+ ++
++
+++
++
++
++
++
++
+++ ++
+ + ++ +
+ + +++
++
++
+
+ + ++ +
++
++
+
+ + ++ +
++++
+
+ + ++ +
+ + ++ +
+ + +
+ +
++
++
++++ ++
+++
++
++
+ ++
++
+++
++
++
+
++++
+
+ + ++ +
+ + ++ +
+ + +
+ +
++
++
++++ ++
+++
++
++
+ ++
++
+++
++
++
+
++++
+++
+++
+ + ++ +
+ + ++ +
+ + +
+ +
++
++
+
+ + ++ +
+ + ++ +
+ + +
+ +
++
++
+
+ + ++ ++ + ++ +
+ + ++ +
+ + ++ +
+ + ++ +
+ + +
+ ++ + +
+ +
++
++
+++
++
++++ +++++ ++
+++
++ +++
++
++
+ ++
++
+ ++
++
+++
++
+++
++
++
+++
++
++
++
++++
++
+
+++ ++
+++ ++
+ + ++ ++ + ++ +
+ + +++
+ + +++
++
++
+++
++
+
+ + ++ +
+ + ++ +
++
++
+
++
++
+
+ + ++ +
+ + ++ +
GOX
+++ ++
+ + ++ +
+ + ++ +
+ + +
+ +
++
++
++++ ++
+++
++
++
+ ++
++
+++
++
++
++
++
++
+++ +++ + ++ +
+ + ++ +
++
++
+
+ + ++ +
++
++
+
+ + ++ +
---
- --
----
-- -
-- -
--
--
---
---
--
--
- --
---
---- - -
+++ ++
+ + ++ +
+ + ++ +
+ + +
+ +
++
++
++++ ++
+++
++
++
+ ++
++
+++
++
++
++
++
++
+++ +++ + ++ +
+ + ++ +
++
++
+
+ + ++ +
++
++
+
+ + ++ +
+++ ++
+ + ++ +
+ + ++ +
+ + +
+ +
++
++
++++ ++
+++
++
++
+ ++
++
+++
++
++
+
+++ ++
+ + ++ +
+ + ++ +
+ + +
+ +
++
++
++++ ++
+++
++
++
+ ++
++
+++
++
++
+
+++ ++
+++ ++
+ + ++ +
+ + ++ +
+ + +
+ +
++
++
+
+ + ++ +
+ + ++ +
+ + +
+ +
++
++
+
+ + ++ ++ + ++ +
+ + ++ +
+ + ++ +
+ + ++ +
+ + +
+ ++ + +
+ +
++
++
+++
++
++++ +++++ ++
+++
++ +++
++
++
+ ++
++
+ ++
++
+++
++
+++
++
++
+++
++
++
++
++++
++
+
+++ ++
+++ +++ + ++ ++ + ++ +
+ + ++ ++ + ++ +
++
++
+++
++
+
+ + ++ +
+ + ++ +
++
++
+
++
++
+
+ + ++ +
+ + ++ +
---
- --
----
-- -
-- -
--
--
---
---
--
--
- --
---
---- - -
---
- ---
--- -
-
----
------
-- -
-- -
-- -
-- -
--
--
---
---
---
---
--
--
---
--
-- -
---
-- -
---
-
---- - ----- - -
LPL+ + ++ +
+ + ++ +
PSS1 PAH1
PSS2+ + ++
PA+
H2 PSS3
+ + ++ +
PAH3
---- - -
GOX
LPL+ + ++ +
PLL+ + ++ +
+ + ++ +
+ + ++ +
+ + ++ +
PSS1PSS1 PAH1
PSS2PSS2+ + ++
PA+
H2+ + ++ +
+ + ++
PA+
H2 PSS3PSS3
+ + ++ +
PAH3+ + ++ +
+ + ++ +
PAH3
---- - -
GOX
---- - ----- - -
GOX
Activated nylon membrane
GOX immobilized 7-layer LBL membrane
46
The second layer of PSS was attached by electrostatic interaction between the side
chain amine groups of PLL and sulfonic acid groups (pKa ~2.0-2.5) of PSS. 100 ml of
~400 ppm solution (40 mg PSS, 0.2 mmole of negative charges based on repeat units) of
PSS was permeated in DIUF at pH 6. At working pH of 6, the net charge on amine
groups of PLL is positive, whereas, the net charge on sulfonic acid groups of PSS is
negative. So, they easily interact with each other.
The third layer of PAH was formed similarly by the electrostatic interaction
between the negatively charged sulfonic acid groups of PSS and positively charged amine
groups of PAH. PAH was attached by permeating 100 ml of 300 ppm solution (30 mg
PAH, 0.3 mmole of negative charges based on repeat units) in DIUF at pH 6. In this case,
PAH is preferred over PLL as it does the same function at a lower cost.
After this, two more bi-layers of PSS and PAH were attached in the membrane
matrix to obtain PLL-(PSS-PAH)3 as shown in Figure 3.2. In an earlier study (Smuleac et
al. 2006) only 3 layers were assembled to study GOX activity. In current research, more
layers have been introduced to increase the enzyme loading and also to decrease the core
leakage (discussed later in Chapter 6) of the substrate molecules. The goal was to
synthesize a net positively charged membrane in the working pH (i.e. ~6) so that GOX
(PI 4.2) can be attached using its negative charges. GOX was attached electrostatically in
the absence of salt so that all the charges on membrane matrix could be neutralized by it.
Stability of each layer was checked by permeating solutions of varying pH,
ranging from 2.7-9. The data of pure water flux as a function of pressure was obtained
after the formation of each layer.
Electrostatic immobilization of GOX in LBL assembled membrane: After formation
of PLL-(PSS-PAH)3 layers, GOX was immobilized electrostatically by permeating 100
ml of 25 ppm solution (2.5 mg) in DIUF at pH 6. Then, the system was washed with
DIUF. Feed, permeate and wash solutions were analyzed for GOX. The GOX
functionalized LBL membrane was preserved at 4 0C. For comparison, covalent
attachment of GOX was carried out by the reaction of the amine group of it with the
anhydride groups in the Immunodyne membrane (Figure 3.1).
47

3.4.3 Functionalization of PVDF membrane by in-situ polymerization of acrylic
acid for electrostatic immobilization of GOX
Functionalization of PVDF membrane: A method reported in literature (Gabriel and
Gillberg 1993) was adopted to functionalize hydrophobic PVDF membrane with PAA by
in-situ polymerization of acrylic acid monomer. The polymerization solution consists of
70 % toluene, 30 % acrylic acid, 0.5 % benzoyl peroxide and 1.2 % TMPTA by weight.
Benzoyl peroxide was used as the initiator. To increase the stability and density of the
polymer network inside the membrane matrix, TMPTA was used as the cross-linker. The
membrane was dipped into polymerization solution for 30 sec, and then it was
sandwiched between two Teflon plates and clipped tightly. It was then inserted into an
oven at 90 0C for 4 hrs under constant N2 environment. After that, the membrane was
washed with copious amount of DIUF water under convective flow condition to remove
impurities. The membrane obtained at this point was functionalized with hydrogen form
(H-form) of PAA. It was converted to Na-form by permeating 200 ml of 0.1 M NaOH
solution. Na-form helps resisting any drastic change in pH that generally occurs in H-
form, for the following ion exchange steps. Flux of water and effect of pH on water flux
through PAA-functionalized PVDF (PVDF-PAA) membrane was studied.
Electrostatic immobilization of GOX in PAA functionalized PVDF membrane: In
order to electrostatically immobilize GOX in PAA-functionalized PVDF membrane, it
was converted to a positively charged membrane. This was achieved by attaching a layer
of PAH using same principle of electrostatical interaction (Figure 3.3) as used for PSS-
PAH layer in LBL membrane. 100 ml of 300 ppm solution of PAH (30 mg PAH, 0.3
mmole of negative charges based on repeat units) in DIUF water at pH 6 was permeated
through the PVDF-PAA membrane. The carboxylate anions of PAA have a pKa of
around 4.7. So, at pH 6, these groups interact with positively charged amine groups of
PAH. After that, GOX was immobilized on PAH layer as demonstrated in Figure 3.3.
The stability of the system was checked frequently by analyzing leakage of GOX in
permeate. The GOX immobilized PVDF membrane was stored at 4 0C and reused.
48

In-situ polymerization
of acrlylic acid
PAH
Figure 3.3 Schematic of functionalized PVDF membrane by PAA (shown here as a
single chain for illustration purposes) and electrostatic attachment of PAH, followed by
electrostatic immobilization of GOX
PAH
+ + ++ +
++
++
+
+ + +
+ +
+++
++
+ + +
+ +
+ + ++ +
+ + ++ ++
++
++
++
++
+
++
++
+
+++++
+ + +
+ ++ + ++ +
+ + ++ +
++
++
++
++
++
+ + +
+ ++ + +
+ +
+++
++ +++
++
+ + +
+ ++ + +
+ +
+ + ++ +
+ + ++ +
+ + ++ +
+ + ++ ++
++
++
++
++
+
++
++
++
++
++
++
++
+
++
++
+
++++++++++
+ + +
+ ++ + +
+ +
---- - -
----
--
---- - -- - -
---
-- - ---
-- -
--- --- -
-- -
-- -
--
- ----
-
+ + ++ +
++
++
+
+ + +
+ +
+++
++
+ + +
+ +
+ + ++ +
+ + ++ ++
++
++
++
++
+
++
++
++++++
+ + +
+ + -- -
---
-- - ---
---- - ----- - -
----
---
----
-
---- - ----- - -- - -
---- - -
---
-- - --- -- - ---
-- -
--- -- -
--- --- -
-- --
- --
- --
- --
- --
- --
-
- ----
-- -
---
-
+ + ++ +
++
++
+
+ + +
+ +
+++
++
+ + +
+ +
+ + ++ +
+ + ++ ++
++
++
++
++
+
++
++
++++++
+ + +
+ ++ + ++ +
+ + ++ +
++
++
++
++
++
+ + +
+ ++ + +
+ +
+++
++ +++
++
+ + +
+ ++ + +
+ +
+ + ++ +
+ + ++ +
+ + ++ +
+ + ++ ++
++
++
++
++
+
++
++
++
++
++
++
++
+
++
++
+++++++++++
+ + +
+ ++ + +
+ + -- -
--- -
- ---
-
-- - --- -- - ---
- -- - - -- - ---PAH GOXPAA + + +
+ +- -- - -- -- - - -
- - --- -- - ---PAH GOXPAA + + +
+ ++ + ++ +
GOX
PVDF membrane PVDF-PAA membrane
PVDF-PAA-PAH membrane
PVDF-PAA-PAH-GOX membrane
49

3.4.4 Functionalization of other unactivated base membranes
In this section, experimental procedure for functionalization of three base
membranes, namely, CA, nylon and RC, with four different kinds of functional groups in
different combinations, are described (Figure 3.4). The functional groups were carbonyl
(for CA), epoxide (for all three), carbonyl imidazole (for nylon and RC) and di-epoxide
(for RC). The activation reagents used were NaIO4 (for CA), ECH (for all three), CDI
(for nylon and RC) and BDDE (for RC). Functionalized membranes were developed in
such a way that facilitates the immobilization of primary amine groups in the form of
either a probe molecule (PABA) or a protein (avidin) or poly(allylamine hydrochloride).
Cellulose acetate (CA): CA membranes were functionalized using two different
approaches. For both approaches, the acetate groups of the membranes were first
hydrolyzed to hydroxyl groups by permeating 200 ml of 1:1 mixture of 0.01 M NaOH
and 0.1 M NH4OH. In the first case, the hydrolyzed cellulose membranes were treated
with 5 g/l of NaIO4 for 90 min to oxidize the hydroxyl groups to carbonyl groups. In
another case, 5 % by volume solution of epichlorohydrin (ECH) in hot (50 0C), 0.5 M
NaOH was permeated through the hydrolyzed cellulose membrane to attach the epoxide
ring in the membrane matrix by forming an ether bond. This reaction is commonly
known as base catalyzed Williamson synthesis of ether. The reaction schemes of
functionalization of all base membranes are represented in Figure 3.4 along with the
important conditions used.
Nylon: Nylon membranes were treated with 0.1 M HCl to expose its amine groups
followed by attachment of epoxide groups by reacting with ECH. Reaction between the
amine groups of nylon membrane and ECH is an example of base catalyzed nucleophilic
substitution of the 2nd type (SN2). In this reaction mechanism, the nucleophile attacks the
less hindered primary carbon. In another approach, nylon membranes were functionalized
by reacting with 1, 1’-carbonyldiimidazome (CDI). CDI was dissolved in anhydrous
acetone and then permeated through the membrane. Since, CDI is prone to hydrolysis by
even trace amount of water present in the solution, anhydrous acetone was used.
50

NH2NH2NH2
O
CH2CHH2C
Cl O
CH2CHH2C
Cl
O
CH2CHH2CNH
O
CH2CHH2CNH
O
CH2CHH2CNH0.5 M NaOH, 500 C
(ECH)
NH C
ON
NNH C
ON
N
NN C
ON
NN
N C
ON
N
Anhydrous Acetone
(CDI)
NaOH / NH4OH
NaIO4
CH3C
O
O CH3C
O
O CH3C
O
O OHOHOH
O
CH2CHH2C
Cl O
CH2CHH2C
Cl
O
CH2CHH2CO
O
CH2CHH2CO
O
CH2CHH2CO
OOO
0.01 M NaOH and 0.1 M NH4OH (1:1)
5 gm/l NaIO4for 90 min
0.5 M NaOH, 500 C
(ECH)
CA membrane
Nylon membrane
O
CH2CHH2C
Cl
O
CHH2C CH2 O CH2 O CH2
O
CH2CH2
NN C
ON
N
OH
O
CH2CHH2CO
O C
ON
N
CHCH2 CH2 O CH2 O CH2
O
CH2CHO2
OH
0.5 M NaOH, 500 C
0.05 M Na2HPO4 buffer, pH = 11
Anhydrous Acetone
(ECH)
(BDDE)
(CDI)
RC membrane
O
CH2CHH2C
Cl O
CH2CHH2C
Cl
O
CHH2C CH2 O CH2 O CH2
O
CH2CH2
O
CHH2C CH2 O CH2 O CH2
O
CH2CH2
NN C
ON
NN
N C
ON
N
OHOHOH
O
CH2CHH2CO
O
CH2CHH2CO
O
CH2CHH2CO
O C
ON
NO C
ON
NO C
ON
N
CHCH2 CH2 O CH2 O CH2
O
CH2CHO2
OH
CHCH2 CH2 O CH2 O CH2
O
CH2CHO2
OH
CHCH2 CH2 O CH2 O CH2
O
CH2CHO2
OH
0.5 M NaOH, 500 C
0.05 M Na2HPO4 buffer, pH = 11
Anhydrous Acetone
(ECH)
(BDDE)
(CDI)
RC membrane
Figure 3.4 Reaction schemes showing functionalization of unactivated base membranes
by different active groups. CA: Cellulose Acetate, RC: Regenerated Cellulose, ECH:
Epichlorohydrin, CDI: 1, 1’-carbonyldiimidazole, BDDE: 1, 4-butanediol diglycidol ether
51

CDI reacts with the amine groups of the nylon membranes to form a carbonyl
diamide by releasing one of the imidazole rings as shown in Figure 3.4. This intermediate
diamide is sufficiently stable in aqueous solution (Hearn 1987). CDI activated
membranes react readily with primary amine containing compounds, such as, proteins to
release the other imidazole ring and form a very stable urea bond.
Regenerated cellulose (RC): RC membranes were functionalized using three different
techniques as described in Figure 3.4. For all of them, the commercially purchased RC
membranes were first washed with 2 % by volume aqueous solution of glycerol. Then, in
the first two techniques, RC membranes were treated with ECH and CDI as described
earlier for CA and nylon membranes, respectively. In the third one, it was reacted with
BDDE, which contains two epoxide rings at the two ends. The condensation of first
epoxide ring with hydroxyl group of RC membrane occurs at pH 11. To achieve that,
BDDE was permeated by dissolving in Na2HPO4/NaOH buffer of pH 11. The second
epoxide ring, which acts as the active functionality, condenses at pH 7-10.
Chemical characterization of functionalized membranes: Functionalized membranes
derived from unactivated base membranes were chemically characterized to determine
the extent of functionalization. The probe molecule used for this purpose was para-amino
benzoic acid (PABA). 100 ppm solution of PABA in Na2HPO4 buffer (pH = 9) was
permeated, followed by washing with 0.25 M NaCl to remove the adsorbed PABA.
PABA in feed, permeate, retentate and wash was analyzed, and amount of active group
was determined from amount of PABA attached.
Amine group of PABA, being a strong nucleophile, reacts with different active
group present in membrane as demonstrated in Figure 3.5. For carbonyl activated CA, the
amine group of PABA was involved in Schiff’s base reaction to form C=N, which was
then converted to C-N by reducing with NaBH4. On the other hand, for epoxide activated
CA, nylon and RC membranes, amine group of PABA was reacted by base catalyzed
nucleophilic substitution of the 2nd type, i.e., the SN2, to open the epoxide ring and form a
stable C-N bond. During this reaction, the amine group preferred the less hindered
primary carbon in the epoxide ring, a typical feature of base catalyzed SN2 reaction.
52

OOO N-RN-RReduction
NH-RNH-RR-NH2
NH C
ON
NNH C
ON
N NH C
O
NH-RR-NH2
O
CH2CHH2CO
O
CH2CHH2CO
O
CH2CHH2COR-NH2
CH2CHH2CO
OH
NH-RCH2CHH2CO
OH
NH-RCH2CHH2CO
OH
NH-R
Carbonyl activated membrane
Schiff’s base
reaction
Epoxide activated membrane
Carbonyl imidazole activated membrane
Nuclephilic substitution
Nuclephilic substitution
Figure 3.5 Reaction of carbonyl, carbonyl imidazole and epoxide activated membranes
with primary amine containing molecules (R-NH2), such as PABA, avidin, PAH, etc.
53

For a di-epoxide activated RC membrane, a similar reaction was occurred as
mentioned earlier for epoxide activated membrane. For carbonyl imidazole activated
nylon and RC membranes, the imidazole group was displaced due to the nucleophilic
attack by amine group of PABA, and a highly stable urethane (for RC) or urea (for nylon)
bond was formed.
Covalent immobilization of avidin in RC-ECH membrane: From the PABA
attachment results and considering some other factors, which have been discussed later,
further experiments were carried out with only functionalized RC-ECH membranes. 4.5 x
10-2 µmole (3 mg) of avidin was dissolved in 100 ml of 0.05 M Na2HPO4 buffer (pH 9)
and permeated through the membrane. Avidin molecules became covalently immobilized
in the RC-ECH membrane by the reaction between the amine groups of it and the
epoxide groups present in membrane (Figure 3.5). Non-specifically adsorbed avidin was
removed from the membranes by washing with 0.25 M NaCl solution. Avidin
immobilized in the membrane was quantified by analyzing it in feed, permeate, retentate
and wash solutions. This membrane was used further for affinity separation of Tat.
Formation of LBL assembly in RC-ECH membrane: Attachment of polyelectrolytes
based on LBL technique was carried out in same fashion as mentioned earlier for
activated nylon (Immounodyne) membrane. In this case, PAH was attached as the first
layer by covalent immobilization of amine group with the epoxide ring present in the
membrane (Figure 3.5). In order to establish that LBL technique works satisfactorily in
RC-ECH membrane, avidin was used as a model protein. Avidin has an isoelectric point
of 10, and hence the final layer of the membrane was kept negative using PSS. Avidin
was electrostatically attached, in the negatively charged membrane at pH 6, utilizing the
net positive charge at that pH. Amount of avidin attached was quantified using the
Bradford Assay. This experiment was done just to demonstrate that functionalized RC-
ECH membrane can potentially be used for development of LBL assembly.
54

3.5 Separation and purification of HIV-Tat protein in avidin functionalized
membranes
This section describes the experimental procedures for quantification of
covalently immobilized avidin sites by probe biotinylated compounds. Different steps of
affinity separation of Tat from BL in avidin functionalized membranes are also discussed
in detail along with a brief description of column chromatographic separation of Tat.
3.5.1 Accessibility of covalently immobilized avidin sites in nylon membrane by
biotin moieties present in different species
Accessibility of avidin sites by biotin present in homogeneous phase was
determined using probe biotinylated molecule, biotin, 4-amidobenzoic acid (BABA,
1mole of BABA is equivalent to 1 mole of biotin). Avidin and BABA was mixed in 0.05
M Na2HPO4 buffer (pH = 9). Samples were collected at different time intervals,
unreacted BABA was separated from avidin-BABA complex and unreacted avidin using
ultrafiltration membrane, followed by analysis of BABA.
Single membrane (diameter 6.5 cm, external surface area 33.2 cm2, bed volume =
external surface area x thickness = 0.55 ml) was used for permeation of (i) BABA (0.6,
3.2 and 9.6 µg/ml), (ii) BBSA (3, 10, 19.3 µg/ml) and (iii) 10 µg/ml BBSA in mixture
with a non-biotinylated protein, Gamma Globulin (GG). BABA and BBSA solutions
were prepared in 0.05 M Na2HPO4 buffer (pH 9) and permeated at room temperature and
0.34 bar (5 psi) pressure with constant stirring at 300 rpm. It was observed that
accessibility of avidin sites by biotin is independent of number of membranes present.
Therefore, a single membrane was used for accessibility studies, whereas a 4-stack
membranes system was used for Tat separation experiments. Volumetric flow rate and
cumulative volume of permeates were measured as a function of time. After permeating
BABA, BBSA and BBSA+GG, the membrane matrix was washed with 100 ml of 0.25 M
NaCl solution to remove the reversibly adsorbed molecules from the membrane.
Total protein present in membrane can be classified into two categories: (i)
specifically attached proteins (avidin-biotin interaction) and (ii) non-specifically adsorbed
55

proteins (protein-membrane and protein-protein interaction), which consisted of
reversibly and irreversibly adsorbed proteins. Reversibly adsorbed proteins were
quantified as stated earlier. To quantify the irreversibly adsorbed proteins for BBSA,
separate permeation experiments were carried out with non-biotinylated protein (BSA)
under the same conditions and concentrations. While calculating the accessibility of
avidin sites, non-specifically adsorbed protein quantity was deducted from the total
proteins in membrane to estimate the specifically attached proteins. To analyze the
formation of protein layers in the membranes, pure water flow rate was measured through
bare membranes, after immobilization of avidin and after permeation of protein.
3.5.2 Affinity separation of HIV-Tat protein from bacterial lysate (BL)
Affinity based membrane separation of a specific protein from mixture of proteins
is achieved using the knowledge of molecular biology and membrane technology. It
consists of the following steps (Figure 3.6): (i) immobilization of a ligand, which has
specific affinity towards the target protein, on the pore walls of membrane, (ii) selective
attachment of the target protein from a mixture to the membrane by ligand-protein
interaction, (iii) purification of the attached protein by removing the impurities and (iv)
elution of target protein from membrane by disrupting protein-ligand interaction. The
activity of the immobilized ligand depends on the method of immobilization in the
membranes. The membrane allows the protein molecules to permeate through the pores.
While permeating through the pores, target protein molecules have easy convective
access to the immobilized ligands. Besides that, the bigger pores facilitate a wide range of
ligand immobilization techniques without hindering the flow of the permeate
significantly.
Production of biotinylated-Tat: To isolate Tat protein based on avidin-biotin interaction,
it is genetically engineered to introduce biotin structure by gene fusion while cloning in
the cell of E.Coli. vector. It is expressed in E. Coli., followed by lysing of the bacterial
cells using French pressure cell press (SLM Amimco). Then, the fermentation broth was
centrifuged at 10000g rpm to remove cell debris and precipitates.
56

Initial activated membrane
Immobilization of ligand
Specific attachment of target protein
+
Removal of Elution of the target protein impurities
LigandLigand Unwanted proteinUnwanted proteinTarget proteinTarget protein
Figure 3.6 Schematics of basic steps involved in affinity based membrane separation of a
target protein from mixture of proteins
57

The supernatant, containing biotinylated-Tat (1-3 %) along with other proteins, is
known as bacterial lysate (BL).Genetically engineered Tat contains a fusion protein,
which bridges between the biotin moiety and the protein as shown in Figure 3.7. BL
supernatant, containing biotinylated-Tat along with other proteins and impurities, was
then treated separately by membrane and conventional packed-bead chromatography to
obtain pure Tat.
A. Affinity membrane separation of Tat: The experimental steps for the pretreatment,
separation and purification of Tat from BL are presented in Figure 3.8.
Pretreatment of bacterial lysate (BL): BL supernatant contains exposed biotinylated Tat,
which are available for binding with avidin. It also contains biotinylated Tat, which are
entangled within other protein aggregates due to non-specific protein-protein interactions.
Formation of these aggregates depends on the nature of the solution (dilution and ionic
strength). The entangled Tat never comes in contact with avidin as shown in Figure 3.7.
Pre-treatment (dilution and addition of chemicals) of BL supernatant was necessary to
disentangle Tat from those protein aggregates in order to maximize the exposed
biotinylated Tat. The primary objective of bacterial lysate pretreatment was to mitigate
protein-protein and Tat-RNA interactions to increase the quantity of free Tat in solution.
It was observed that by diluting BL and applying a higher salt concentration, the
aggregate formation between proteins can be reduced, thereby increasing the available
free Tat in the BL (Hollman et al. 2005). To study the effect of dilution and salt
concentration on the amount of available free Tat in BL, two separate experiments were
carried out. In one experiment, 1 ml of stock BL was diluted by varying dilution factor in
the range of 1-1000 with 0.1 M (0.1 x 10³ µmoles/ml) NaCl. In another experiment, 1 ml
of BL was diluted (dilution factor 10) with 0, 0.1, 0.25 and 0.5 M NaCl solutions. ELISA
was carried out to measure the amount of Tat in solutions. The results of these
experiments are discussed later in Chapter 5; however, it is worth mentioning here that
amount of available free Tat in BL was found to increase with increase in dilution factor
up to around 150. After that it remained constant.
58

Bacterial LysateAvidin
Biotin
Fusion Protein
Tat Protein
Non-specific Protein
Genetically EngineeredTat
Avidin
Biotin
Fusion Protein
Tat Protein
Non-specific Protein
Genetically EngineeredTat
Tat-F-Bio +
Bio-
Bio-
Av-Mem Tat-F- Av-Mem Factor Xa Tat + F- Av-Mem
Tat / other protein aggregation
Non-specific protein adsorption
Figure 3.7 Schematic of separation of Tat protein from bacterial lysate using avidin-
biotin interaction in a functionalized membrane pore. Biotinylated-Tat (Bio-F-Tat) forms
a complex (Tat-F-Bio-Av-Mem) with avidin immobilized membrane (Av-Mem). Tat is
then isolated by cleaving the Tat-Fusion protein bond with Factor Xa
59

Tat inbacterial
lysate
4-stack nylonmembranes
Pre-treatment of BL feed
Permeationof BL
Immobilization of avidin
Permeationof wash
Buffer (WB)
Permeationof Factor Xa
WB CB Tat Eluate
Separation of Tat from BL
Purificationof Tat
Recoveryof Tat
PermeateRetentate
SDS-PAGE:Qualitative
determination
ELISA: Quantitative
determination
Western Blot:Qualitative
determination
Bradford Assay:Total protein
Permeationof cleavageBuffer (CB)
Figure 3.8 Experimental steps for the separation and purification of Tat from Bacterial
Lysate (BL) using avidin-biotin interaction in functionalized stacked membranes. In few
experiments, a pre-filtration step (shown as a dotted box) was introduced to remove
unwanted proteins and impurities prior to the affinity separation
Feed
Pre-filtration
Biotin Analysis: Quantitative
determination
Tat inbacterial
lysate
4-stack nylonmembranes
Pre-treatment of BL feed
Permeationof BL
Immobilization of avidin
Permeationof wash
Buffer (WB)
Permeationof Factor Xa
WB CB Tat Eluate
Separation of Tat from BL
Purificationof Tat
Recoveryof Tat
PermeateRetentate PermeateRetentate
SDS-PAGE:Qualitative
determination
ELISA: Quantitative
determination
Western Blot:Qualitative
determination
Bradford Assay:Total protein
Permeationof cleavageBuffer (CB)
Feed
Pre-filtration
Biotin Analysis: Quantitative
determination
60

On the other hand, amount of available free Tat was observed to increase linearly
in the range of NaCl concentration studied. Therefore, the feed for affinity separation
was prepared by diluting BL supernatant in desired ratio with 0.5 M NaCl.
Further, it was observed that the basic region of Tat protein has a high affinity to
form a Tat-RNA complex (Rana and Jeang 1999), which alters the binding affinity of Tat
with the immobilized avidin due to steric hindrance. Hence, 25 µg RNAse per ml of BL
was added to degrade RNA and eradicate the formation of Tat-RNA complex. Other than
these, dithiothreitol (DTT) was added as antioxidant and phenylmethylsulphonylfluoride
(PMSF) was added as protease inhibitor.
Separation of Tat: Biotinylated-Tat present in BL was separated by permeating through
an avidin immobilized nylon membranes matrix. Membrane matrix consisted of 4
membrane sheets arranged in stacked configuration to provide greater internal surface
area for avidin immobilization. While permeating through the membrane, Biotinylated
Tat interacted with avidin and attached to the membrane matrix, while other proteins
present in the mixture permeated through (Figure 3.7). Some non-biotinylated proteins
were also adsorbed into the membrane due to non-specific protein-membrane interaction.
In this dissertation, results obtained from two different dilution factor experiments
are discussed. In one experiment 10 ml and in another 15 ml of BL was diluted to 300 ml
with 0.5 M NaCl. Diluted BL solution was then permeated at 0.34 bar pressure, and the
permeate flow rate and cumulative volume were measured at different time intervals.
In order to demonstrate that avidin immobilized RC-ECH membrane can also be
used for affinity separation of Tat; separate experiments were carried out with stack of 4
avidin immobilized RC-ECH membranes. All other steps of were identical as affinity
separation of Tat using avidin immobilized nylon membranes.
Purification and isolation of Tat: After separating Tat from other proteins, the membrane
module was treated with suitable wash solutions to remove the non-specifically adsorbed
proteins. 75 ml of wash buffer 1 (WB1; 0.05 M Tris HCl pH 8, 0.1 M NaCl, 1.6x10⁻⁵ M
Triton X-100, and 0.031 M NaN3, 30 µl 1 M DTT, 20 µl PMSF) containing both PMSF
and DTT was permeated first, followed by permeation of wash buffer 2 (WB 2) devoid of
61

PMSF. The system was then preconditioned for cleavage with 100 ml cleavage buffer
(CB; 0.05 M Tris HCl pH 8, 0.10 M NaCl, 0.001 M CaCl2, and 0.031 M NaN3, 30 µl 1 M
DTT) containing DTT, but no PMSF. Purified Tat was then eluted by disrupting the
fusion protein-Tat bond from the membrane module using 20 µg Factor Xa (cleavage
protease) per ml of cleavage buffer. Restriction protease, Factor Xa, has a specific
cleavage location after arginine residue in the sequence of Ile-[Glu or Asp]-Gly-Arg
(Nagai and Thøgersen 1984).
Characterization of purified Tat: Before analyzing the isolated Tat, it was desalted using
size-based packed-bead (polyacrylamide) column chromatography, followed by
endotoxin removal in an affinity column containing Polymixin B beads (Pierce
Biotechnology). The purified protein obtained in this research was characterized by SDS-
PAGE, Western Blot Analysis, and ELISA. Fouling within the membranes was
characterized by Scanning Electron Microscopy (SEM). SDS-PAGE and Western Blot
analysis were carried out to qualitatively determine, and ELISA was done to
quantitatively determine Tat in BL feed, permeate, retentate, WB permeate, CB permeate
and the eluate. For BL permeation, to analyze the protein layer formed in the membranes,
pure water flow rate through the 4-stack membrane matrix was measured before and after
the permeation of BL as done for other protein solutions.
B. Column chromatographic affinity separation of Tat: Packed-bead column
chromatographic separation of Tat was conducted in the Department of Anatomy and
Neurobiology, University of Kentucky. Separation of biotinylated Tat was achieved by
equilibrating BL supernatant with 5 ml of avidin containing agarose beads (Ultralink
Immobilized NeutrAvidin from Pierce Biotechnology) in 30 ml of cell lysing buffer for 2
hours. The binding capacity of the beads was 5 x 10⁻² – 8 x 10⁻² µmoles biotin/ml of
beads. The purification and elution steps followed the same protocols; however, the
major difference in principle was the use of diffusive mode instead of convective mode.
62

3.6 Effect of pre-filtration on affinity membrane separation of Tat
3.6.1 Pre-filtration
A pre-filtration step was incorporated just after the pre-treatment step and prior to
affinity separation step as shown in Figure 3.8. The pre-treated (30 times dilution, 0.5 M
NaCl, 25 µg RNAse/ml BL, 30 µl DTT, 20 µl PMSF) BL supernatant was subjected to
UF in one case and MF in other. All pre-filtration experiments were carried out at 25 0C
with constant stirring at 300 rpm. The trans-membrane pressure for UF was 1.36 bar (20
psi) and for MF was 0.34 bar (5 psi). Pressure in the cell was maintained by N2 gas. To
study the effect of pre-filtration on BL feed, biotin analysis and total protein analysis
were carried out on pre-filtration feed and permeate. Since, the pre-filtration feed (i.e.
diluted BL supernatant) contained significant amount of impurities, direct measurement
of biotin was erroneous. In order to get accurate measure of total biotin, the feed was
digested with 10 % by volume of 6N HCl at 120 0C for 12 hrs until all proteins hydrolyze,
but biotin structure remains same. Then, biotin analysis was carried out to obtain total
biotin (exposed + entangled) present. For pre-filtration permeate, both direct analysis of
biotin and analysis of biotin from the digested fraction of permeate were carried out.
SDS-PAGE images were obtained to observe the effect of pre-filtration on BL feed.
Characteristic flux decline behavior was also studied for pre-filtration experiments.
Permeate of pre-filtration experiments were used directly as BL feed (UF BL feed and
MF BL feed) in affinity separation experiments.
3.6.2 Affinity membrane separation of Tat from pre-filtered BL feed
Tat protein was separated from BL feed following exact same procedure as
described in sub-section 3.5.2. The only difference was the use of pre-filtered BL feed
instead of unfiltered BL feed to the affinity membrane system. After that, biotin analysis
was carried out on different streams to quantify biotinylated Tat. Then material balance
was done on biotinylated Tat present in different streams to determine the amount of Tat
separated by membrane based affinity separation. From that the normalized accessibility
of avidin sites was calculated and discussed later in Chapter 5. Due to specific cleavage
63

location of restriction protease, Factor Xa, purified Tat eluate ideally should not contain
any biotin. But, for column chromatographically purified Tat eluate, biotin impurities
have been identified by HABA-avidin complex analysis. Hence the same analysis was
also carried out for membrane purified Tat eluate. SDS-PAGE and Western Blot analysis
were also carried out to check the purity of the membrane purified Tat and compare with
column chromatographically purified Tat. The results obtained for pre-filtered BL feed
(both MF BL and UF BL) are also compared with that obtained for unfiltered BL feed.
3.7 Enzymatic oxidation of glucose by electrostatically immobilized GOX in LBL
assembled nylon membrane and functionalized PVDF membrane
This section describes the experimental protocols of the enzymatic oxidation of
glucose using electrostatically immobilized GOX in LBL functionalized nylon membrane
and functionalized PVDF membrane. Detachment of GOX from membrane matrix and
reattachment of the detached GOX are also stated.
3.7.1 Activity study of electrostatically immobilized GOX in LBL functionalized
nylon membrane
All the activity measurement experiments were performed in 50 mM sodium
acetate-HCl buffer (NaOAC-HCl buffer) saturated with O2, and under constant pressure
of air. NaOH and HCl were used to adjust the pH of the solution. Activity was
determined by measuring the concentration of H2O2 in permeate. Permeate glucose
solutions were tested frequently to determine any GOX leakage from the system. β-D (+)
Glucose is referred as glucose in the text.
Steady state determination: Oxidation of glucose by GOX, in this case, was a
biocatalytic reaction carried out in a constant flow reactor. Hence, condition of steady
state prevails. In order to get an idea about the time needed to reach the steady state,
experiments were conducted with 15 and 75 mM glucose solution at constant flow rate
through the GOX-LBL membrane. Permeates were collected as a function of time.
64

Importance of O2: Oxygen is very important in the second step of the two step reaction
mechanism of catalytic oxidation of glucose. Monitoring the effect of variation of O2 on
the reaction was out of scope of this research work. In fact, in order to ensure excess O2
in the media throughout the reaction, the system was designed with oxygen saturated
buffer and also kept under constant pressure of air. However, to study the consequences
of depletion of O2 from the reaction media, constant flow rate experiment was carried out
with initial air purging. After certain time air supply was replaced by supply of N2, which
gradually started removing O2 from the solution. Then again, air supply was re-
established. Activity of GOX was observed as a function of time through out the reaction.
Kinetic study: Activity of free GOX in homogeneous phase reaction was studied as a
function of time in a batch reactor at pH 5.5. The concentration of glucose was varied
from 0.15-75 mM. For all experiments O2 saturated buffer was used and air was purged
into the reactor continuously. Samples were collected at different time intervals and
activity was determined by analyzing H2O2 formed.
For electrostatically immobilized GOX in LBL membrane (LBL-GOX-
convective), glucose concentration was varied from 0.15-75 mM for different
experiments, while flow rate was adjusted such that the condition of equal residence time
prevails for all the kinetic experiments. In order to study the kinetics of the same GOX
immobilized LBL membrane in diffusive mode (LBL-GOX-soaking), experiments were
carried out by soaking the membrane in glucose solution and measuring the activity of
GOX in reaction mixture as a function of time. Kinetics of covalently attached GOX was
studied under convective mode and represented as covalent-GOX-convective.
Effect of residence time i.e., flow rate: Effect of residence time on the activity of GOX
was studied by varying permeate flow rate for a fixed concentration of glucose solution at
pH 5.5. Flow rate was varied from 2-25 ml/min by changing the pressure from 0.34-3.4
bar (5-50 psi).
65

Effect of pH: Effect of pH on the activity of GOX was studied by varying pH from 4.5-7,
for a fixed concentration of glucose solution at a constant flow rate. Homogeneous phase
experiments for free GOX were also carried out with pH varying in the same range.
Stability of GOX immobilized in LBL membrane: Stability of GOX, immobilized in
LBL assembled membrane, was studied by measuring the activity after every 7 days for a
total of 28 days. While not including, the membrane was stored at 4 0C. A 15 mM
glucose solution at pH 5.5 was used for all stability studies.
Detachment and re-attachment of GOX in the same LBL functionalized membrane:
Immobilized GOX, activity of which has already been studied, was detached from the
membrane matrix by permeating 50 ml DIUF water of pH 3 at 10-15 psi. After
detachment, the pH of the solution was immediately adjusted to 5.5. Activity of any
undetached GOX in the membrane matrix was determined by permeating glucose
solution at pH 5.5. Amount of detached GOX was quantified by analyzing the solution
using the Bradford Assay. The activity of the detached GOX in free form was determined
by homogeneous phase batch reaction at pH 5.5. The rest of the detached GOX was then
reattached in the same membrane matrix using principle of electrostatic interaction. The
activity of the reattached GOX in the membrane was determined as earlier. The steps of
detachment and reattachment were repeated. Attachment of fresh GOX in the same
membrane matrix was also performed followed by the activity study.
3.7.2 Activity study of electrostatically immobilized GOX in functionalized PVDF
membrane
Kinetic study of immobilized GOX in functionalized PVDF membrane (PVDF-
GOX-convective) and effect of residence time i.e., flow rate, on activity were studied
similarly as carried out for LBL membrane.
66

Reusability of GOX immobilized PVDF membrane: The functionalized PVDF
membranes were reused for GOX immobilization. When, the activity of GOX went
below the acceptable value, the system was regenerated by detaching the used GOX and
attaching fresh GOX in the same PVDF-PAA membrane. This was done by permeating
DIUF water of pH 4 at convective flow mode. However, there was a fundamental
difference in regeneration of this membrane matrix with LBL membrane matrix. The pKa
of amine groups of PAH is 9.5 and the PI of GOX is 4.2. Hence, in order to nullify the
electrostatic interaction and detach GOX, the pH of the detaching solution should be less
than 4.2. But, at that pH the interaction between PAH and PAA also vanishes as the pKa
of carboxylic acid groups of PAA is around 4.7. Thus, the detaching solution dislocates
the whole PAH-GOX domain from the PVDF-PAA matrix. To reattach fresh GOX in the
same membrane, PAH layer was re-introduced as stated earlier, followed by electrostatic
immobilization of GOX. Stability of the domain and activity of fresh GOX were tested.
Copyright © Saurav Datta 2007
67

Chapter 4 Functionalization of Membranes
This Chapter deals with functionalization of different membranes carried out for
various applications.
4.1 Results and discussion
In this section, results obtained for random covalent immobilization of avidin in
acyl-anhydride activated nylon membranes are presented. Electrostatic immobilization of
GOX in Layer-By-Layer (LBL) functionalized nylon membrane (LBL-GOX) and
polyacrylic acid (PAA) functionalized PVDF membrane (PVDF-GOX) are described.
Characterization of these two types of membranes is also demonstrated. Additionally, the
extent of functionalization of unactivated membranes (CA, nylon and RC) are presented
in terms of probe molecule, para-aminobenzoic acid (PABA). This is followed by a brief
discussion of covalent immobilization of avidin in RC-ECH membrane and electrostatic
immobilization of avidin in LBL assembly developed within the RC-ECH membrane.
4.1.1 Covalently immobilized avidin in anhydride activated nylon membrane
To study the variation in the amount of avidin immobilized, both single
membranes and 4-stack membranes matrices were tested. Based on the information
supplied by the manufacturer, the acylanhydride groups present in a membrane (bed
volume 0.55 ml, external membrane area 33.2 cm2) could covalently immobilize 2.4 x 10-
2 - 3.3 x 10⁻² µmoles of avidin/ml bed volume, when spot loaded with 4000 µg/ml avidin
solution in PBS buffer and allowed to react for 15 min at pH 7-9. However in our
research, for the single membranes, immobilization of avidin was 3.8 x 10⁻² – 5.1 x 10⁻²
µmoles/ml bed volume (6.3 x 10⁻⁴ – 8.5 x 10⁻⁴ µmole/cm2 external membrane area). This
corresponds to a biotin binding capacity (based on biotin : avidin = 3.6 : 1) of 13.7 x 10⁻²
– 18.4 x 10⁻² µmoles /ml bed volume. The avidin to biotin ratio of 1:3.6 is obtained from
homogeneous phase avidin-biotin interaction experiment. Due to convective flow within
the membrane pores, the avidin molecules could easily access the acylanhydride groups,
68

and therefore the amount of avidin immobilized was significantly higher for these
experiments. The variation in the amount of avidin immobilized was due to the presence
of different amount of acylanhydride groups in different membranes and multiple
attachment of single molecule of avidin with their different amine groups. For 4-stack
membranes matrices (bed volume = 4 x 0.55 = 2.2 ml), the immobilization of avidin
varied from 2.2 x 10⁻² µmoles avidin / ml bed volume (corresponding to biotin binding
capacity of 7.9 x 10⁻² µmoles / ml bed volume) to 4.5 x 10⁻² µmoles avidin / ml bed
volume (corresponding to biotin binding capacity of 16.2 x 10⁻² µmoles /ml bed volume).
The effective thickness of the covalently immobilized avidin layer in the
membranes, δavidin, was calculated (applying Hagen-Poiseuille’s equation) using the water
flow rate data obtained before and after permeating avidin solution. Depending on the
amount of avidin immobilized, calculated δavidin varied within 9 - 13 nm. The calculation
of δavidin is discussed in detail later while explaining the results of fouling in Chapter 5.
Due to immobilization of avidin, 15-20 % decrease in water flux was observed for all the
membranes. The initial flux through the avidin-immobilized membranes (Jv0) was 14 x
10-4 - 24 x 10-4 cm3/cm2.s (corresponds to a flow rate of 3 - 5 ml/min) at 0.34 bar. Based
on the initial flux through avidin-immobilized membrane and the porosity determined
from water sorption experiment, the approximate initial linear velocity through the pores
was calculated to be 370 - 620 cm/h. At this linear velocity the residence time through a
4-stack membranes system would be 1.6 - 2.6 sec.
4.1.2 Electrostatically immobilized GOX in LBL assembled nylon membrane and
functionalized PVDF membrane
Bio-catalytic reactions with free enzyme in homogeneous phase possess the
advantage of higher activity, but its use is limited due to lower stability, inhibition from
product and lack of reusability. As an alternative, enzyme is immobilized covalently in a
solid matrix and then used as a catalyst. The advantages of immobilized enzyme over free
enzyme are; (i) stability due to the protective action of the solid matrix, (ii) reusability as
it is confined in the solid support and (iii) ease of operating under continuous flow mode.
However, the biggest disadvantage is the lower activity of the immobilized enzyme.
69

Sometimes, the activity is as low as 10 % of the activity of free enzyme (Cheryan M.
1986). The lower activity can be attributed to the proximity of the active sites of enzyme
to the solid matrix. The solid matrix reduces the accessibility of active sites, causes a
conformational change of the enzyme and offers diffusional resistance. Membrane is a
common solid support for enzyme immobilization. Diffusional resistance is minimized
by permeating the substrate solution under convective flow condition. Researchers have
studied site-directed immobilization of enzymes to restrict conformation change, and
hence, increase the accessibility (Butterfield and Bhattacharyya 2003; Liu et al. 2001).
However, site-directed immobilization requires complicated techniques, and it is
considerably expensive.
A simple, but efficient alternative to traditional covalent immobilization of
enzymes in solid matrix is to create a charged domain of polyelectrolytes inside the
membrane pore, and then immobilize the enzyme using electrostatic interaction (Smuleac
et al. 2006). This technique combines the benefits of activity of free enzyme in
homogeneous phase along with the stability and reusability of the immobilized enzyme.
The higher activity compare to covalent binding is due to the fact that the enzyme is
loosely bound to the polymer matrix and away from the solid support. Hence, the chances
of conformation change and the accessibility problem due to the proximity to the solid
support are significantly less. There also exists a possibility of reusing the membrane
matrix by detaching (eluting) the used enzyme, when needed, and attaching fresh enzyme.
For electrostatic immobilization of GOX, the functionalized membrane domain
was positively charged and GOX was attached using its negative charges primarily from
the carboxylic acid side chains of glutamic acid and aspartic acid residues. It is important
to note the existence of one glutamic acid residue near the active site of GOX (Frederick
et al. 1990; Hecht et al. 1993). This particular glutamic acid residue can play an important
role in determining the activity of electrostatically immobilized GOX. It can also be
observed from the sequence of amino acid residues of GOX (Frederick et al. 1990) that
its negative charges are well distributed through out the structure. Hence, immobilizing it
electrostatically means extending it in coil form and then attaching it loosely with the
polymer domain at almost regular intervals. This conformation will expose its active sites.
70

Electrostatically immobilized GOX in LBL assembled nylon membrane
Characterization of LBL assembled nylon membrane: The amount of repeat units of
polyelectrolyte attached in each layer was determined from different analytical
procedures and represented in Table 4.1. A single repeat unit of all the polyelectrolytes
contains a unit charge. Based on that, net charges in the subsequent layers are calculated
and represented in the same Table. Since, the addition of layers were non-stoichiometric,
there is no particular correlation between the amounts of polyelectrolytes attached in each
layer.
However, it is important to note here, that each layer was associated with excess
net opposite charges compare to the previous layer. This has governed the electrostatic
attachment of next layer. The attachment of excess opposite charges was possible due to
non-stoichiometric addition of polyelectrolytes in presence of salt. The net charge after
the 7th layer of polyelectrolyte (PAH3) mentioned in this dissertation was (+) ve.
Cumulative thickness of n-th layer (δn) is calculated by applying Hagen-
Poiseuille’s equation (Ho and Sirkar 1992) on water flux through the virgin membrane
(Qw0) and after attachment of the n-th layer (Qwn) as shown below. 25.0
00 ⎟⎟
⎠
⎞⎜⎜⎝
⎛=
w
nwn Q
Qrr (4.1)
nn rr −= 0δ (4.2)
Permeability after n-th layer (Pn) in cc/cm2-s-bar is calculated as follows:
PAQ
Pm
wnn ∆
= (4.3)
where, Q terms are volumetric flow rate in cm3/min, r terms are radius of pore in cm, Am
is the external area of membrane = 13.2 cm2, ∆P = transmembrane pressure in bar.
The calculated cumulative thicknesses of layers are plotted in Figure 4.1, along
with the calculated water permeability values. It can be observed that cumulative
thickness of layers increases as subsequent layers are assembled in the membrane pores.
Final cumulative thickness of functionalized domain after GOX immobilization is 100
nm, which corresponds to 44 % reduction in pore radius. Hence, the radius of
functionalized pore after GOX immobilization was 125 nm.
71

Table 4.1 Characterization of LBL assembled nylon membrane by calculating the amount
of repeat units immobilized in subsequent layers. Molecular weight of repeat units of
different polyelectrolytes is as follows: PLL 164.5, PSS 206, and PAH 93.5. External
membrane area = 13.2 cm2, Membrane thickness = 165 µm, pH = 6
Layer Amount of repeat units immobilized x 103, mmole
Net charge x 103, mmole
PLL 2.1 (+) 2.1
PSS1 6.9 (-) 4.8
PAH1 9.1 (+) 4.3
PSS2 10.4 (-) 6.1
PAH2 13.1 (+) 7.0
PSS3 8.2 (-) 1.2
PAH3 2.5 (+) 1.3
GOX 1.1 -
72

0
20
40
60
80
100
120
PLL PSS 1 PAH 1 PSS 2 PAH 2 PSS 3 PAH 3 GOX
Layers
C
0
100
200
300
400
500
600
Bare PLL PSS1 PAH1 PSS2 PAH2 PSS3 PAH3 GOX
Layers
Per
mea
bilit
y x
104 , c
c/cm
2 -s-b
ar
mm
aes
s, n
ickn
tive
Thul
u
Figure 4.1 Calculated cumulative thickness of layers after electrostatic immobilization of
polyelectrolytes inside nylon membrane pore. Hagen Poiseuiile’s equation was used to
calculate layer thickness. Inset Figure shows the decrease in permeability due to
formation of layers inside membrane pores. Pore radius of pure nylon membrane = 225
nm, water permeability of pure nylon membrane = 570 x 10-4 cc/cm2-s-bar, permeability
after GOX immobilization = 52 x 10-4 cc/cm2-s-bar, external membrane area = 13.2 cm2,
membrane thickness = 165 µm, pH of water used for permeability measurement = 6,
NaCl concentration used to form layers = 0.25 M
73
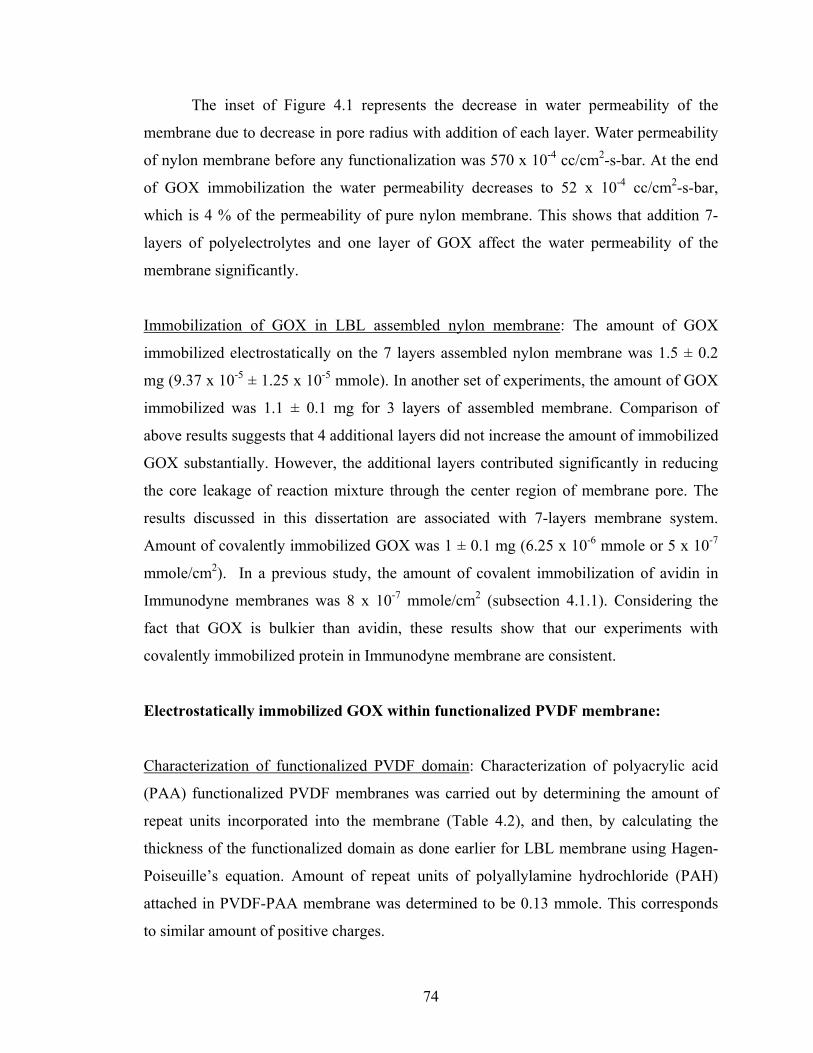
The inset of Figure 4.1 represents the decrease in water permeability of the
membrane due to decrease in pore radius with addition of each layer. Water permeability
of nylon membrane before any functionalization was 570 x 10-4 cc/cm2-s-bar. At the end
of GOX immobilization the water permeability decreases to 52 x 10-4 cc/cm2-s-bar,
which is 4 % of the permeability of pure nylon membrane. This shows that addition 7-
layers of polyelectrolytes and one layer of GOX affect the water permeability of the
membrane significantly.
Immobilization of GOX in LBL assembled nylon membrane: The amount of GOX
immobilized electrostatically on the 7 layers assembled nylon membrane was 1.5 ± 0.2
mg (9.37 x 10⁻⁵ ± 1.25 x 10⁻⁵ mmole). In another set of experiments, the amount of GOX
immobilized was 1.1 ± 0.1 mg for 3 layers of assembled membrane. Comparison of
above results suggests that 4 additional layers did not increase the amount of immobilized
GOX substantially. However, the additional layers contributed significantly in reducing
the core leakage of reaction mixture through the center region of membrane pore. The
results discussed in this dissertation are associated with 7-layers membrane system.
Amount of covalently immobilized GOX was 1 ± 0.1 mg (6.25 x 10⁻⁶ mmole or 5 x 10⁻⁷
mmole/cm2). In a previous study, the amount of covalent immobilization of avidin in
Immunodyne membranes was 8 x 10⁻⁷ mmole/cm2 (subsection 4.1.1). Considering the
fact that GOX is bulkier than avidin, these results show that our experiments with
covalently immobilized protein in Immunodyne membrane are consistent.
Electrostatically immobilized GOX within functionalized PVDF membrane:
Characterization of functionalized PVDF domain: Characterization of polyacrylic acid
(PAA) functionalized PVDF membranes was carried out by determining the amount of
repeat units incorporated into the membrane (Table 4.2), and then, by calculating the
thickness of the functionalized domain as done earlier for LBL membrane using Hagen-
Poiseuille’s equation. Amount of repeat units of polyallylamine hydrochloride (PAH)
attached in PVDF-PAA membrane was determined to be 0.13 mmole. This corresponds
to similar amount of positive charges.
74
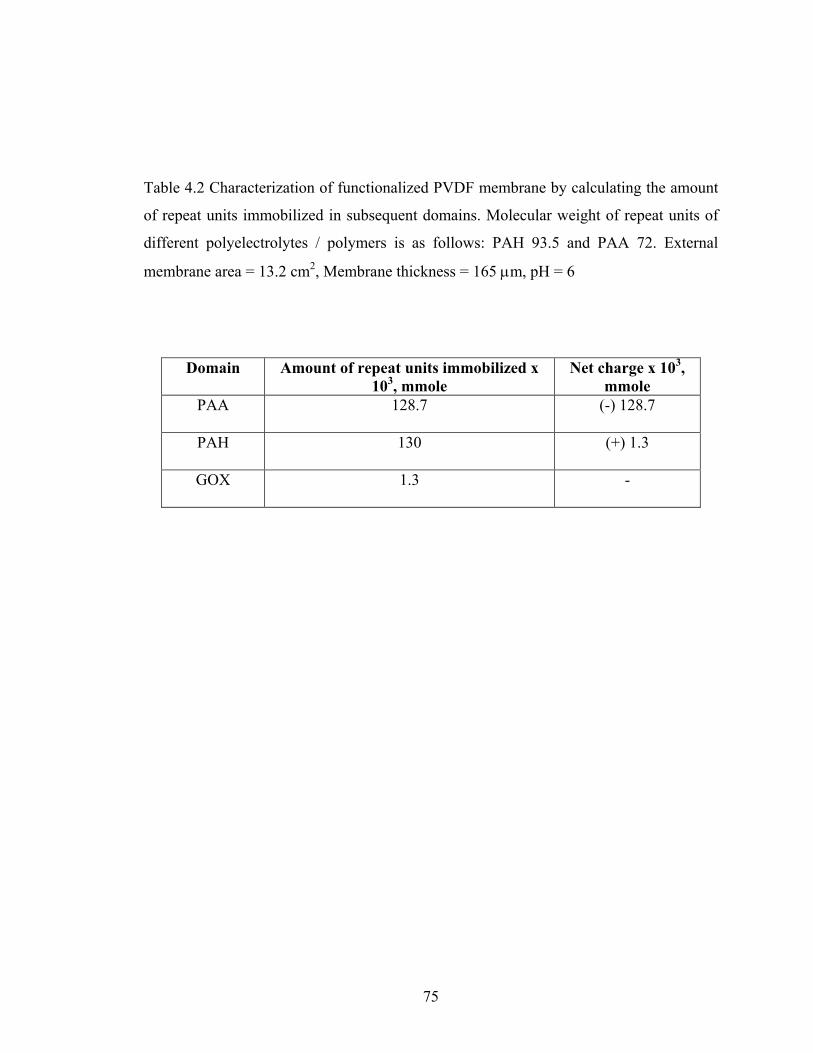
Table 4.2 Characterization of functionalized PVDF membrane by calculating the amount
of repeat units immobilized in subsequent domains. Molecular weight of repeat units of
different polyelectrolytes / polymers is as follows: PAH 93.5 and PAA 72. External
membrane area = 13.2 cm2, Membrane thickness = 165 µm, pH = 6
Domain Amount of repeat units immobilized x 103, mmole
Net charge x 103, mmole
PAA 128.7 (-) 128.7
PAH 130 (+) 1.3
GOX 1.3 -
75

Since direct analysis of PAA attachment was not possible, the amount of PAA
attached was determined by knowing the amount of GOX immobilized, as explained later.
The cumulative thickness of functionalized domains of PVDF-PAA-PAH-GOX
membrane was calculated to be 125 nm, i.e., the effective radius of pore became 100 nm.
Effect of functionalization on water flux was studied for subsequent layers in
PVDF-PAA-PAH-GOX membrane. Figure 4.2 shows the behavior of pure water flux
(pH 6) as a function of pressure at different stages of functionalization. The slope of each
curve plotted in Figure 4.2 is the permeability of water x 104 through the membrane at
that particular stage of functionalization. It can be observed that water permeability
decreases dramatically from PVDF membrane before functionalization (596 x 10-4
cc/cm2-s-bar) to PVDF-PAA membrane (82 x 10-4 cc/cm2-s-bar). This observation can be
attributed to the formation of highly dense PAA network inside the membrane pore. Also,
at pH 6, carboxylic acid groups of PAA become ionized and start repelling each other.
This leads to an elongated conformation of PAA as explained in next paragraph and
causes a substantial decrease in pore radius. Permeability further decreases as PVDF-
PAA membrane was converted to PVDF-PAA-PAH membrane (permeability = 50 x 10-4
cc/cm2-s-bar) and PVDF-PAA-PAH-GOX membrane (permeability = 24 x 10-4 cc/cm2-s-
bar), subsequently.
Variation in water flux as a function of pH is demonstrated in Figure 4.3. It can be
observed, that staring from 2.5, as pH increases, water flux remains constant till around
4.5, and then it starts decreasing sharply. At pH 5.5 the flux reduces to 40 % and at pH 7
the flux reduces to 20 % of the initial value. After pH 7, again it becomes constant. This
indicates that between pH 4.5 to 7 some kind of conformational change of PAA structure
takes place. For a layer of PAA immobilized in a solid matrix, this kind of phenomenon
is referred as “helix-to coil transition” (Hollman and Bhattacharyya 2004). However,
PAA in this case, forms a network structure inside the PVDF membrane pore, and the
existence of helical or coil conformations are unlikely. Hence, although the fundamental
science behind the observation is identical, the same terminology would be a misnomer.
It can be stated that through out this pH range PAA transforms from retracted to
elongated form.
76

0
100
200
300
400
500
0 0.5 1 1.5 2 2.5
∆P, bar
Jw x
104 , c
c/cm
2 -s
PVDFPVDF-PAAPVDF-PAA-PAHPVDF-PAA-PAH-GOX
Figure 4.2 Effect of functionalization on PVDF membrane as depicted by the permeate
flux vs pressure curve. Pore radius of pure PVDF membrane = 225 nm, pore radius of
PVDF-PAA-PAH-GOX membrane = 100 nm. Water (pH 6) permeability values for
different steps of functionalized membrane are given by the slope of the curves. External
membrane area = 13.2 cm2, membrane thickness = 125 µm
77

0
0.2
0.4
0.6
0.8
1
2 3 4 5 6 7 8 9 10 11
pH
Nor
mal
ized
Flu
x
Figure 4.3 Effect of pH on permeate water flux for PAA-functionalized PVDF membrane
in Na-form. Flux was normalized with maximum flux for this experiment (330 x 10-4
cc/cm2-s) at a pH of 2.5 and pressure of 1.38 bar. Pore radius of pure PVDF membrane =
225 nm, pore radius of PVDF-PAA-PAH-GOX membrane = 100 nm, external membrane
area = 13.2 cm2, membrane thickness = 125 µm
78

Below pH 4.5, PAA remains totally protonated and hence retracted. With increase
in pH it starts de-protonating, and above pH 7 all of its acid groups become de-protonated
and fully elongated. A slight hysteresis was observed (not shown in Figure) as the same
experiment was repeated in a reverse manner, i.e. starting from pH 10 and going to pH
2.5. At pH 6, the normalized flux was 0.31, which corresponds to water permeability
value of 74 x 10-4 cc/cm2-s-bar.
Functionalization within the membrane was also characterized by Scanning
Electron Microscope (SEM) images and Energy Dispersive X-ray (EDX) analysis of the
elements present in the membrane before and after functionalization. Comparison of
SEM images (Figure 4.4a and 4.4b) of cross section of the membranes before and after
functionalization clearly indicates attachment of polymer inside the PVDF membrane.
SEM-EDX analysis diagram shows a peak corresponding to the element oxygen for
PVDF-PAA membrane (Figure 4.4d) in addition to the other elemental picks (carbon and
fluorine) present for virgin PVDF membrane (Figure 4.4c). This also demonstrates PAA
functionalization within the pores of PVDF membrane. The pick corresponding to the
element Fe is obtained as the analysis was carried out with Fe-immobilized PVDF-PAA
membrane. This shows immobilization of Fe in the ion exchange step as discussed later
in Chapter 7. The picks for Au and Pd are observed because the samples were sputtered
with Au-Pd before the SEM-EDX characterization to increase the conductivity.
Immobilization of GOX in functionalized PVDF membrane: The amount of GOX
attached electrostatically on the functionalized PVDF membrane was 1.8 ± 0.1 mg. This
corresponds to about 1.12 x 10⁻⁵ mmole GOX or 1.33 x 10⁻³ mmole negative charges,
considering one mole of GOX is equivalent to approximately 118 moles of negative
charge (calculated from the number of aspartic and glutamic acid residues present in
GOX). Assuming, for the present membrane system, this is the saturation capacity of
GOX attachment by electrostatic immobilization, the excess positive charges of PAH that
was neutralized by PAA = 0.13-1.33 x 10⁻² mmole = 0.1287 mmole. This corresponds to
an attachment of 0.1287 mmole or 9.3 mg of repeat units of PAA, i.e., acrylic acid.
79

Au Pd
(a) (b)
(c) (d)
Figure 4.4 SEM images of cross section of (a) unmodified PVDF membrane and (b)
PAA-functionalized PVDF membrane with immobilized Fe+2. The figure also shows
SEM-EDX analysis of different elements present in (c) virgin PVDF membrane and (d)
PAA-functionalized PVDF membrane with immobilized Fe+2
80

4.1.3 Determination of extent of functionalization in other membranes (RC, CA,
nylon)
Amount of active groups attached in membranes were determined from amount of
PABA attached. The values are shown in Table 4.3. As can be seen from the Table, all
methods were able to functionalize active groups in the membrane, however, the amount
attached were different. Due to limitations of time and scope, a particular type of
membrane was chosen for further study mentioned in this dissertation; however, all
others are also capable of being used as effective functionalized membranes system.
For CA membrane, oxidation was observed to be a better way than reacting with
ECH. The base structure of CA gets affected under extreme reaction conditions, such as
during the oxidation by NaIO4 or reaction of ECH in presence of hot NaOH. This causes
stability and reproducibility problems with CA membranes. The extent of
functionalization values obtained for same lot of CA membranes varied a lot (~ 30 %) as
given in Table 4.3. Therefore, although CA is a very hydrophilic membrane, it was not
considered for further studies related to immobilization of avidin.
For nylon membranes, both ECH and CDI techniques were efficient. The extent
of immobilization of active groups was significantly higher than functionalized CA
membranes as shown in Table 4.3. The value of active groups attached for nylon
membranes were satisfactorily reproducible. Nylon membranes are substantially robust;
however, since they are comparatively more hydrophobic than RC membranes, they were
not used for further attachment of avidin in this study.
As can be seen from Table 4.3, functionalization of active groups by all three
different techniques was satisfactory for RC membranes. In spite of the same pore size,
RC membranes were functionalized with more active groups than nylon membranes,
probably because the amount of reactive groups were more in RC (hydroxyl) than nylon
(amine). Among the three different techniques used for RC, the ECH activation was
found to be superior to other two in terms of the capacity as well as reproducibility. RC is
hydrophilic membrane with good mechanical and chemical strength. Hence, among all
the choices of membranes, RC-ECH functionalized membranes were selected for
separation of Tat as well as formation of LBL assembly.
81

Table 4.3 Amount of active groups attached for functionalization of different base
membranes, such as regenerated cellulose (RC), cellulose acetate (CA) and nylon. ECH =
epichlorohydrin, BDDE = 1, 4-butanediol diglycidol ether, CDI = 1, 1’-
carbonyldiimidazole, PABA = para-aminobenzoic acid. Variation in results are
represented as standard deviation
Membranes (Pore dia. in
µm)
Methods used for functionalization
PABA attachment i.e. amount of active group functionalized
(µmole x 102/cm2 external surface area)
ECH 8.5 ± 0.6 BDDE 6.0 ± 0.2
RC (0.2)
CDI 5.5 ± 0.5 ECH 2.0 ± 0.6 CA (0.45)
Oxidation 3.5 ± 0.7 ECH 4.5 ± 0.5 Nylon (0.2)
CDI 5.2 ± 0.2
82

Covalent immobilization of avidin in RC-ECH membrane for separation of Tat: Amount
of avidin immobilized covalently in a 13.2 cm2 RC-ECH membrane was 2 ± 0.2 x 10⁻²
µmole (1.35 ± 0.15 mg), which corresponds to 1.5 ± 0.15 x 10⁻³ µmole of avidin/cm2 of
external area. The immobilization was significantly lower for larger molecule of avidin in
compare to smaller molecule of PABA (Table 4.3). For commercially available
anhydride functionalized nylon membranes (Immunodyne ABC), maximum amount of
covalently immobilized avidin was 8.5 x 10⁻⁴ µmole/cm2 external area. So, it can be
observed that the RC-ECH functionalized membranes created as a part of this dissertation
was of higher capacity than the commercially available Immunodyne membranes.
Amount of biotin attachment obtained in the RC-ECH-Avidin membrane was
around 3.6 x 10⁻² µmole for 10 µg/ml BBSA (1.3 x 10⁻³ µmole of biotin/ml) feed. This
corresponds to an avidin to biotin ratio of 1:1.8, whereas, the avidin to biotin ratio was
only 1:1.3 for the same case in Immunodyne membrane. This clearly demonstrates that
accessibility of avidin sites is higher for functionalized RC membranes compare to
Immunodyne membranes. This can probably be attributed to the higher hydrophilicity of
RC over nylon membranes.
Formation of LBL in RC-ECH membrane: Four layers of polyelectrolytes in the sequence
of PAH1-PSS1-PAH2-PSS2 were attached in functionalized RC-ECH membrane
following the principle of electrostatic immobilization as described earlier. Only PSS
layers were quantified. The amount of PSS immobilization was 16 x 10-3 mmole and 10 x
10-3 mmole for PSS1 and PSS2, respectively. For Immunodyne membranes, maximum
amount of immobilization of PSS was 10.5 x 10⁻³ mmole. This demonstrates that RC-
ECH membranes could be efficiently used for layer-by-layer attachment of
polyelectrolytes. The amount of avidin immobilized electrostatically in the negatively
charged RC-ECH-LBL membrane was 6 x 10⁻² µmole (4 mg). Hence, it can be
hypothesized, that functionalized RC-ECH-LBL membrane can also be potentially used
for enzyme immobilization.
83

4.2 Conclusions
Covalent immobilization of avidin molecules was successfully carried out in
commercially available anhydride activated nylon membranes. The amount of avidin
immobilization under convective mode was higher than that mentioned by the
manufacturer under soaking mode.
Enzyme Glucose Oxidase (GOX) was successfully immobilized in two different
kinds of charged functionalized membrane domains by electrostatic interaction. In one
case, the domain was created by alternative Layer-By-Layer (LBL) deposition of anionic
and cationic polyelectrolytes on nylon based membrane, whereas, in other, the domain
was created by in-situ polymerization of acrylic acid in hydrophobic PVDF membrane.
Functionalized membranes were characterized in terms of permeate flux and attached
domains. For PVDF membrane, functionalization was also demonstrated by SEM images.
Functionalized domains in both cases were observed to be stable under tested conditions.
RC, CA and nylon membranes were activated by covalent attachment of active
groups. Attachment was quantified by a probe molecule para-aminobenzoic acid (PABA).
From capture of PABA and considering some other facts, epoxide activated RC
membranes (RC-ECH) were selected for further studies. Avidin immobilized RC-ECH
membranes were created for potential use in affinity based separation of HIV-Tat protein.
Amount of avidin attached per unit membrane area was higher for RC-ECH than
commercially available nylon membrane. RC-ECH membrane was also used for
development of polyelectrolyte functionalized membrane based on Layer-By-Layer (LBL)
technique. Attachment of layers was satisfactory as shown by the capture of avidin based
on electrostatic interaction. This study has demonstrated the fact that base membranes
can be modified to create initial activated membranes for applications in bioseparation
and biocatalysis. However, since it is out of scope of this research work, further
experiments were mainly conducted using commercially available activated nylon
membrane and PVDF membrane.
Copyright © Saurav Datta 2007
84

Chapter 5 Affinity Based Separation of HIV-TAT Protein: Analysis of
Accessibility of Avidin Sites and Fouling in Membranes
This chapter addresses two fundamental aspects of affinity based membrane
separation of proteins; the accessibility of covalently immobilized active sites and fouling
of the membranes. Avidin was covalently immobilized in the anhydride activated nylon
membrane. Attempt was made to quantify the accessibility of avidin sites with biotin
moieties present in a small probe molecule, biotin 4-amidobenzoic acid (BABA), as well
as in a protein, biotinylated-BSA (BBSA). Further studies were extended to separation
and purification of a target protein, HIV-Tat, from a complex fermentation broth
(bacterial lysate, BL) using very specific interaction between the biotinylated-Tat protein
and the avidin-functionalized membrane matrix. Fouling in the membranes was studied
by critically examining the flux decline behavior and calculating the thickness of
adsorbed protein layers inside the membrane.
It was hypothesized, that to make the technique more efficient, increase in
separation efficiency (recovery of Tat per unit amount of avidin immobilized), increase in
permeate flux and decrease in processing time are essential. Separation efficiency of Tat
could be increased by enhancing the accessibility of the immobilized avidin sites.
Permeate flux, and hence processing time could be improved by reducing the fouling.
Incidentally, both accessibility and fouling are governed by the presence of unwanted
high molecular weight proteins and other impurities in the BL.
Therefore, a pre-filtration step was introduced to remove unwanted high
molecular weight proteins and other impurities from BL feed prior to affinity membrane
separation. Two types of pre-filtration were studied; Ultrafiltration (UF) and
Microfiltration (MF). Pre-filtered BL feed containing biotinylated Tat was then subjected
to affinity based membrane separation. Effects of pre-filtration on the permeate flux,
separation efficiency and processing time is discussed in detail. A comparative study is
presented between the pre-filtered and unfiltered affinity separation. The flux decline
during affinity separation is described by model equations and the calculated flux values
are compared with the experimental values. The quality of purified Tat protein isolated
85

from unfiltered BL feed as well as from pre-filtered BL feed was analyzed by different
analytical techniques and compared with that obtained for column chromatographic
separation.
5.1 Results and discussion
In order to check the reproducibility of the results, all experiments were
triplicated. The error bars shown in different figures represent standard deviations.
5.1.1 Accessibility of covalently immobilized avidin sites
From homogeneous phase avidin-biotin interaction experiments, it was
determined that 1 mole of avidin, in homogeneous phase, could bind 3.6 mole of biotin
present in BABA, which is close to 4 mole that has been reported in literature (Savage
1992).
Biotin moieties present in biotin 4-amidobenzoic acid (BABA): In homogeneous
phase, because of the ease of accessibility (Figure 5.1 (a)), 4 moles of biotin uptake was
possible by the active sites of one mole of avidin. However, within the membrane pores,
the biotin uptake by the immobilized avidin sites would be less because of the associated
hindrance to accessibility. In this research, BABA was used as a probe molecule to
determine the maximum accessible sites of avidin, immobilized covalently within
membrane pores.
Breakthrough curves obtained for different concentration of BABA solutions are
presented in Figure 5.2. Concentration is represented in terms of biotin. As expected, the
breakthrough curve is steeper for higher concentration of BABA solutions due to higher
amount of biotin permeated. It is also observed that Cp / Cf is never zero at time > 0
(initially pores were filled with buffer) for any of the solutions.
Due to bigger pores (~0.42-0.43 µm) of avidin-immobilized MF membranes and
convective flow of permeate, significant amount of biotin has permeated through central
region of the pores without even interacting with the avidin sites. This phenomenon is
known as “Core Leakage” (Datta et al. 2006).
86

(b)(a)(a)
(d)(d)
AvidinAvidin Biotinylated-proteinBiotinylated-protein Non-biotinylated proteinNon-biotinylated protein
(c) (e)(e)
Figure 5.1 Schematic of different ways of attachment of avidin molecules in
functionalized membranes and its effect on interaction with biotin moieties. (a) avidin in
homogeneous phase. Four sites are available for biotin, (b) covalently immobilized avidin
in membrane, (c) multiple attachment of avidin molecules by different amine groups, (d)
blockage of avidin sites by next layer of immobilized avidin due to protein-protein
interaction, and (e) blockage of avidin sites by big molecules of protein (biotinylated as
well as non-biotinylated)
87

0
0.2
0.4
0.6
0.8
1
0 50 100 150 200 250
Cumulative Permeate Volume, V (ml)
Cp/C
f
25 x 10-3 µmoles/ml biotin (9.6 µg/ml BABA) 8.3 x 10⁻³ µmoles/ml biotin (3.2 µg/ml BABA) 1.56 x 10⁻³ µmoles/ml biotin (0.6 µg/ml BABA) Error bars show standard deviation
Figure 5.2 Comparison of breakthrough curves for permeation of different biotin 4-
amidobenzoic acid (BABA) solutions through avidin immobilized (3.8 x 10⁻² - 5.1 x 10⁻²
µmoles / ml bed volume) single nylon membrane (Pore dia. = 0.45 µm) at 0.34 bar.
Avidin functionalized membrane permeability = 4 x 10⁻³- 7 x 10⁻³ cm3/cm2.s.bar. CP =
conc. of biotin in permeate, Cf = conc. of biotin in feed
88

It was observed, that even for this small biotinylated-compound, BABA, the
amount of biotin capture (Table 5.1) by the covalently immobilized avidin sites in the
membrane was only half of the biotin capture capacity of the same amount of avidin in
homogeneous phase. Similar kind of observation has already been reported in literature
(Hollman et al. 2005). This signifies that only half of the total active sites of covalently
immobilized avidin, in this type of membrane, were accessible by BABA. Thus,
saturation biotin capture by covalently immobilized avidin in this membrane
(Immunodyne) was considered to be equal to that obtained for BABA, i.e. by considering
biotin : avidin = 1.8 : 1. Based on that, for all other biotinylated solutions used,
normalized accessibility of the covalently immobilized avidin sites is defined as follows:
BABAonbasedcapturebiotinSaturationspeciesedbiotinylatfromcapturebiotinofamountActualityAccessibilNormalized −
=
8.1:1: =−
=biotinavidinonbasedcaptureBiotin
speciesedbiotinylatfromcapturebiotinofamountActual
The normalized accessibility is very specific for a particular type of membrane as
the saturation biotin capture by avidin can vary with membrane.
The possible explanations of lower accessibility of immobilized avidin sites by
BABA are; (i) blockage of avidin sites near the walls of the membrane pores as shown in
Figure 5.1 b, (ii) multiple attachment of single molecule of avidin by different amine
groups as shown in Figure 5.1 c, (iii) blockage of avidin sites by next layer of
immobilized avidin molecules (Figure 5.1 d), and/or (iv) conformation change on the
wall of membrane pores by protein-polymer interaction. It is interesting to notice in Table
5.1, that accessibility values are same for all BABA solutions irrespective of the
concentration of biotin in feed BABA. The non-dependency of accessibility on
concentration suggests that the small molecules of BABA did not offer any steric
hindrance to biotin moieties and did not block the avidin sites.
89

Table 5.1 Accessibility of avidin sites for the permeation of biotin 4-amidobenzoic acid
(BABA) through avidin immobilized nylon membrane (Pore dia. = 0.45 µm) at 0.34 bar.
A single membrane was used for this case
Avidin immobilized
x 102 (µmoles)
Conc. of BABA in
feed (µg/ml)
Conc. of biotin in
feed x 103 (µmoles/ml)
Biotin uptake capacity of avidin in homogeneous phase
x 102 (µmoles)
Biotin uptake by avidin x
102 (µmoles)
Normalized accessibility
2.4 9.6 25.0 8.6 4.3 1
2.1 3.2 8.3 7.6 3.8 1
2.3 0.6 1.56 8.3 4.2 1
90

Biotin moieties present in biotinylated-BSA (BBSA): Figure 5.3 shows the
breakthrough curves for the permeation of different concentrations of BBSA solutions.
The concentration of biotin is obtained by considering each mole of BBSA is equivalent
to 8 moles of biotin, as specified by the manufacturer. The initial breakthrough curve is
steeper for higher concentration of BBSA due to the higher amount of biotin permeated,
as observed earlier for BABA. “Core leakage” is also observed for BBSA, as for BABA.
The normalized accessibility values plotted as a function of amount of biotin
permeated in Figure 5.4 and presented in Table 5.2, show lower accessibilities for BBSA
compare to BABA. It is not trivial to calculate the accessibilities of avidin sites for BBSA,
as the location and orientation of 8 biotin moieties present per molecules of BBSA are
unknown. It is possible, that the accessibility for BBSA solutions was less because some
of the biotin moieties were never exposed to avidin. It is also possible that instead of all 8
biotin moieties, BBSA molecules were attached using few biotin moieties only, making
calculations of accessibility more difficult. In our calculations, a simple approach was
taken considering a BBSA molecule was always attached with 8 biotin moieties. Figure
5.4 depicts that as biotin moieties permeated through the avidin-immobilized membrane;
they interacted with avidin and bound to the membrane matrix. The hindrance in
accessibility by large molecules of proteins was two fold. Bulky molecules of BBSA
offered substantial steric hindrance to the biotin moieties present in it to access the avidin
sites. Additionally, some BBSA molecules blocked nearby avidin sites by non-specific
adsorption (Figure 5.1 (d)), thereby reducing the accessibility in comparison to BABA.
It can also be observed from Figure 5.4, that in contrast to BABA, accessibility
shows a decreasing trend with increasing BBSA concentration. This can be attributed to
the fact that as the concentration of BBSA in the feed increases, the biotin moieties
experienced increased steric hindrance from larger number of protein molecules present.
The blockage of avidin sites by the molecules of proteins was also higher for the
concentrated BBSA solution.
91
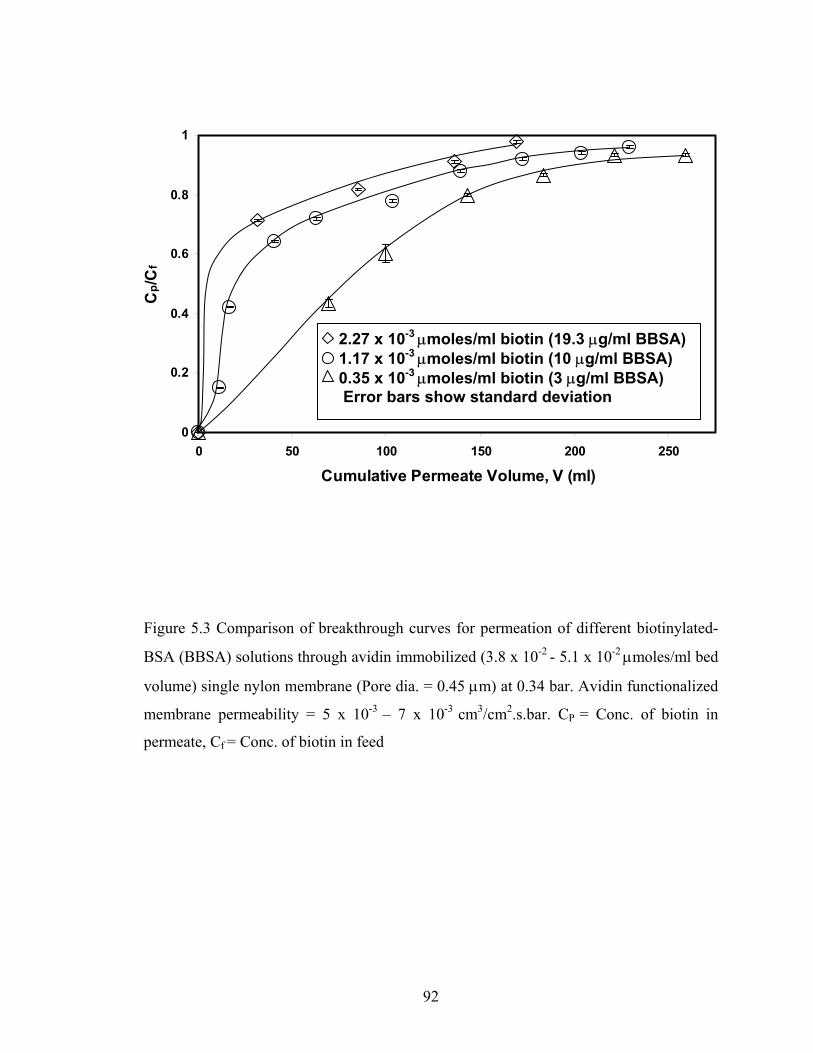
0
0.2
0.4
0.6
0.8
1
0 50 100 150 200 250
Cumulative Permeate Volume, V (ml)
C
2.27 x 10⁻³ µmoles/ml biotin (19.3 µg/ml BBSA) 1.17 x 10⁻³ µmoles/ml biotin (10 µg/ml BBSA) 0.35 x 10⁻³ µmoles/ml biotin (3 µg/ml BBSA) Error bars show standard deviation
f/C p
Figure 5.3 Comparison of breakthrough curves for permeation of different biotinylated-
BSA (BBSA) solutions through avidin immobilized (3.8 x 10⁻² - 5.1 x 10⁻² µmoles/ml bed
volume) single nylon membrane (Pore dia. = 0.45 µm) at 0.34 bar. Avidin functionalized
membrane permeability = 5 x 10⁻³ – 7 x 10⁻³ cm3/cm2.s.bar. CP = Conc. of biotin in
permeate, Cf = Conc. of biotin in feed
92

0
0.2
0.4
0.6
0.8
1
0 10 20 30 40
Biotin Permeated x 102 (µmoles)
2.27 x 10⁻³ µmoles/ml biotin (19.3 µg/ml BBSA) 1.17 x 10⁻³ µmoles/ml biotin (10 µg/ml BBSA) 0.35 x 10⁻³ µmoles/ml biotin (3 µg/ml BBSA) Error bars show standard deviation
Figure 5.4 Comparison of accessibility of the avidin sites (3.8 x 10⁻² - 5.1 x 10⁻²
µmoles/ml bed volume) immobilized in single nylon membrane (Pore dia. = 0.45 µm) for
different biotinylated-BSA (BBSA) solutions at 0.34 bar. Avidin functionalized
membrane permeability = 5 x 10⁻³ - 7 x 10⁻³ cm3/cm2.s.bar
No
ae
Acc
essi
bilit
y d liz
rm
93

Table 5.2 Accessibility of avidin sites for permeation of biotinylated-BSA (BBSA),
BBSA + Gamma Globulin (GG, Non-biotinylated) and Tat in unfiltered bacterial lysate
(UNF BL) through avidin immobilized nylon membrane (Pore dia. = 0.45 µm) at 0.34 bar.
Single membrane was used for BBSA and BBSA+GG, whereas, 4-stack membranes were
used for Tat in BL
Avidin
immobilized x 102 (µmoles)
Conc. of biotinylated
species in feed
(µg/ml)
Conc. of biotin in
feed x 103
(µmoles/ml)
Biotin capture
by avidin x 102
(µmoles)
Saturation capture of
biotin based on BABA x
102 (µmoles)
Normalized accessibility
2.8 19.3 2.27 2.9 5.0 0.58
2.4 10.0 1.17 2.8 4.4 0.64
1.5
BBSA
3.0 0.35 2.3 2.8 0.83
2.5 BBSA+GG (13 µg/ml)
10.0 1.17 2.5 4.5 0.55
5.0 Tat in UNF BL1 (3864 µg/ml total
protein)
15.0 1.8 3.0 9.0 0.35
10.0 Tat in UNF BL2 (1120 µg/ml total
protein)
15.0 1.8 3.2 18.0 0.18
94

Biotin moieties present in BBSA, along with non-biotinylated gamma globulin: The
normalized accessibility of avidin sites for BBSA present in a mixture with GG is shown
in Table 5.2. The biotin attachment, and hence the accessibility of avidin sites is less than
that for pure BBSA with same biotin concentration (1.17 x 10⁻³ µmoles/ml biotin). In
addition to the reasons already stated for BBSA, accessibility decreased further due to the
blockage of avidin sites by non-biotinylated protein (GG) present (Figure 5.1 (d)).
Figure 5.5 compares the normalized accessibility as a function of total biotin
permeated for three different types of solutions (BABA, BBSA, and BBSA+GG)
containing comparable concentration of biotin. The accessibility for BABA was always
higher than the other two because of the unhindered access to avidin sites by biotin
moieties present in small BABA molecules. However, the accessibility was less for biotin
moieties present in complex molecules of proteins as discussed earlier. Between BBSA
and BBSA+GG, the initial biotin attachment was the same, probably because the effect of
non-biotinylated protein was insignificant initially. But, finally accessibility decreased for
BBSA+GG due to the increased steric hindrance and blockage of avidin sites by the non-
biotinylated protein.
Biotin moieties present in bacterial lysate (BL): This section contains accessibility
results for biotin present as biotinylated-Tat in BL. The effect of pre-filtration on
accessibility is also discussed here.
Accessibility for biotinylated-Tat in unfiltered BL (UNF BL) feed: Table 5.2 contains the
avidin sites accessibility values for biotinylated Tat present in a complex mixture of
proteins (97-99 % unwanted protein). Results for two different sets of unfiltered BL feed,
namely UNF BL1 (total protein concentration 3864 µg/ml) and UNF BL2 (total protein
concentration 1120 µg/ml) are presented. From Table 5.2 it can be observed that the
avidin site accessibility is least for the permeation of both UNF BL1 and UNF BL2.
Although the concentration of biotin (biotin : monomeric Tat = 1:1) present in UNF BL
was comparable with 0.6 µg/ml of BABA, 10 µg/ml of BBSA and 10 µg/ml of BBSA +
13 µg/ml of GG; the presence of 97-99 wt % of unwanted protein was responsible for the
decreasing accessibility.
95

0
0.2
0.4
0.6
0.8
1
0 10 20 30 40
Biotin Permeated x 102 (µmoles)
Nor
mal
ized
Acc
essi
bilit
y
1.56 x 10⁻³ µmoles/ml biotin (0.6 µg/ml BABA) 1.17 x 10⁻³ µmoles/ml biotin (10 µg/ml BBSA) 1.17 x 10⁻³ µmoles/ml biotin (10 µg/ml BBSA + 13 µg/ml Gamma Globulin) Error bars show standard deviation
Figure 5.5 Comparison of normalized accessibility vs. biotin permeated for biotin 4-
amidobenzoic acid (BABA), biotinylated-BSA (BBSA) and BBSA + Gamma Globulin
(GG, non-biotinylated protein) through avidin immobilized (3.8 x 10⁻² - 5.1 x 10⁻²
µmoles/ml bed volume) single nylon membrane (0.45 µm) at 0.34 bar. Avidin
functionalized membrane permeability = 4 x 10⁻³ - 5 x 10⁻³ cm3/cm2.s.bar
96

The difference in accessibility for the two cases of BL, particularly the lower
accessibility for dilute solution, is difficult to explain. However, due to the complex
nature of the mixture it can be assumed that some other factor, like interactions between
proteins present in BL, might have overshadowed the advantage of lower concentration
of proteins in solution.
Accessibility for biotinylated-Tat present in pre-filtered BL feed: In order to understand
the discussion on accessibility of avidin sites for biotinylated Tat present in pre-filtered
BL feed, it is necessary to have an idea of the effects of pre-filtration on BL feed. Hence,
the following sub-section is dedicated to study the effects of two different set of pre-
filtration experiments; one UF and another MF, on BL feed.
Effect of pre-filtration on BL feed: Results of pre-filtration experiments are summarized
in Table 5.3 and Figures 5.6-5.7. Feed to the pre-filtration step had 1120 µg/ml of total
protein among which 3 wt % was total (exposed + entangled) biotinylated-Tat protein. It
can be observed from Table 5.3 that UF removed 85 ± 5 wt % of the total protein from
diluted BL supernatant, and produced UF BL feed (UF permeate) containing the lowest
concentration (155 ± 5 µg/ml) of total protein. MF removed 57 ± 5 wt % of the protein,
and produced MF BL feed (MF permeate) containing 465 ± 10 µg/ml of total protein.
Fouling in UF and MF is illustrated by flux decline curves in Figure 5.6. Due to
higher rejection of proteins by UF membrane, it was associated with gel polarization
effect, which has caused higher flux decline compare to MF. Severe flux drop was
observed right from the beginning for UF as proteins started depositing on the external
surface of the membrane, blocking some of the pores and then eventually formed a cake.
The formation of cake is associated with flattening of flux vs time curve as shown in
Figure 5.6. For MF, fouling was gradual compare to UF as initially protein adsorption
occurred mainly inside the pores. Then, it also started depositing on the external surface
due to formation of aggregates and eventually ends up forming cake. Palacio and
coworkers have used 0.2 µm polycarbonate membrane to study the fouling behavior of
mixture of BSA and pepsin with a total protein concentration of 2000 mg/l.
97

Table 5.3 Effect of pre-filtration (UF and MF) on BL feed. Concentration of total protein
in pre-filtration feed = 1120 µg/ml. Concentration of total biotin (exposed + entangled) in
pre-filtration feed = 3.8 x 10⁻³ µmole/ml (i.e. 32 µg/ml Tat). UF: 100 KDa MWCO
regenerated cellulose membrane, ∆P = 1.36 bar, MF: 0.1 µm pore size hydrophilized
PVDF membrane, ∆P = 0.34 bar
Pre-Filtration
Protein removed from system, wt %
Conc. of total protein in
permeate, µg/ml
Conc. of total biotin in permeate, µmole/ml
(µg Tat/ml)
Conc. of exposed biotin in permeate,
µmole/ml (µg Tat/ml) UF 85 ± 5 155 ± 5 3.0 x 10⁻³ (25) 2.2 x 10⁻³ (18) MF 57 ± 5 465 ± 10 3.2 x 10⁻³ (27) 2.5 x 10⁻³ (21)
98

1
Figure 5.6 Normalized flux vs cumulative volume for pre-filtration experiments. UF:
100KDa MWCO regenerated cellulose membrane, ∆P = 1.36 bar, Permeability = 4x10⁻³
cm3/cm2-s-bar. MF: 0.1 µm pore size hydrophilized PVDF membrane, ∆P = 0.34 bar,
Permeability = 20 x 10-3 cm3/cm2-s-bar. Dotted curves represent trend lines for
experimental data. Volume of pre-filtration feeds = 300 cm3
0
0.2
0.4
0.6
0.8
0 50 100 150 200 250 300
Cumulative Permeate Volume, V (cm3)
Nor
mal
ized
Flu
x, J
v/Jv0
MF UF
99

UF/MF
F UMF PMW F P181.8115.5
82.263.248.8
37.1
25.9
19.4
14.8
6.0
UF/MFF UMF PMW
181.8115.5
82.263.248.8
37.1
25.9
19.4
14.8
6.0
181.8115.5
82.263.248.8
37.1
25.9
19.4
14.8
6.0
F P
Figure 5.7 SDS-PAGE images of feed and permeate streams of pre-filtration experiments
prior to affinity separation. Total protein concentration in pre-filtration feed (UF/MF F) =
1120 µg/ml, in microfiltration permeate (MF P) = 465 ± 10 µg/ml, and in ultrafiltration
permeate (UF P) = 155 ± 5 µg/ml
100

They have also observed similar trend in flux decline behavior due to blockage of
pores and formation of cake by the adsorbed proteins (Palacio et al. 2003).
The biotin analysis data presented in Table 5.3 reveal some interesting
phenomenon. It can be observed that there is significant difference in concentration of
total biotin (obtained from biotin analysis of digested fraction) and exposed biotin
(obtained from direct biotin analysis) for both UF and MF permeate. This suggests that
although the pre-filtration step was able to remove unwanted proteins from BL feed, it
was not able to disentangle all biotinylated-Tat from non-specific aggregates. There also
exists a difference between the concentration of biotin in pre-filtration feed and permeate
for both UF and MF. This implies that some of the biotinylated-Tat proteins were
rejected by the membrane due to entanglement in non-specific protein aggregates and
adsorption to membranes. The concentration of exposed biotin was 2.2 x 10⁻³ and 2.5 x
10-3 µmole/ml for UF and MF permeate, respectively. Since, the exposed biotinylated-Tat
was available for binding with avidin; those values were used for further calculations.
Figure 5.7 shows SDS-PAGE images of process streams before and after pre-
filtration. It can be observed from the figure that the MF membrane was functional only
to partially reject the high molecular weight proteins as the corresponding bands still
exist in lesser intensity. In contrast, UF membrane, due to its smaller pore size, was able
to reject all of the proteins above 35 KDa molecular weight. Although UF membrane was
100 KDa MWCO, the reason of rejecting proteins below 100 KDa was probably the
formation of larger size protein aggregates and non-uniform pore size distribution. Both
MF and UF were able to completely reject the other impurities, such as cell debris.
Effect of pre-filtration on accessibility: The focus of this particular sub-section is to
understand the effect of pre-filtration on accessibility by discussing the results obtained
for 2 different pre-filtered BL permeation experiments (MF BL and UF BL) along with
the result obtained for UNF BL2. For proper comparison, the results of Table 5.2 are
reproduced in Table 5.4 along with the MF BL and UF BL results.
101

Table 5.4 Effect of pre-filtration on accessibility of avidin sites for BL permeation. For
proper comparison, results of Table 5.2 are reproduced here along with the MF BL and
UF BL results. Single membrane was used for BBSA and BBSA+GG, whereas, 4-stack
membranes were used for Tat in BL
Avidin
immobilized x 102 (µmoles)
Conc. of biotinylated
species in feed
(µg/ml)
Conc. of biotin in
feed x 103
(µmoles/ml)
Biotin capture
by avidin x 102
(µmoles)
Saturation capture of
biotin based on BABA x
102 (µmoles)
Normalized accessibility
2.8 19.3 2.27 2.9 5.0 0.58
2.4 10.0 1.17 2.8 4.4 0.64
1.5
BBSA
3.0 0.35 2.3 2.8 0.83
2.5 BBSA+GG (13 µg/ml)
10.0 1.17 2.5 4.5 0.55
5.0 Tat in BL (3864 µg/ml
total protein)
15.0 1.8 3.0 9.0 0.35
10.0 Tat in BL (1120 µg/ml
total protein)
32.0 3.8 3.2 18.0 0.18
10.0 Tat in MF BL
(465 µg/ml total
protein)
21.0 2.5 9.0 18.0 0.50
10.0 Tat in UF BL
(155 µg/ml total
protein)
18.0 2.2 12.6 18.0 0.70
102
Maximum possible capture of biotin by the immobilized avidin (avidin
immobilization = 0.1 µmoles or 6000 µg for all 3 cases) was 0.18 µmole (1500 µg of
biotinylated-Tat) for all 3 cases. Only 0.032 µmole of biotin (270 µg of biotinylated-Tat)
was captured for UNF BL2. On the other hand, 0.1262 µmole of biotin (1050 µg of
biotinylated-Tat) and 0.092 µmole of biotin (750 µg of biotinylated-Tat) were captured
for UF BL and MF BL, respectively. UF BL has the highest normalized accessibility (0.7)
followed by MF BL (0.5), while UNF BL2 has the lowest normalized accessibility (0.18).
Point to be noted that the amount of biotinylated-Tat capture for pre-filtered BL
feed was calculated from biotin analysis and material balance. ELISA was also carried
out on some samples of purified Tat eluate to make sure that the calculated values of Tat
recovery from biotin analysis and material balance were accurate. The obtained values
showed ± 12 % standard deviation. Accessibility depends on both blockage of avidin
sites and steric hindrance offered to biotin moieties by unwanted proteins. Since, amount
and molecular weight of unwanted proteins present was highest in the UNF BL2 feed,
accessibility was lowest. On the other hand, lowest amount of unwanted proteins as well
as lower molecular weight proteins were present for the UF BL feed compare to others.
Hence, it has the highest accessibility. It is also very interesting to observe from Table 5.4,
that accessibility of the pre-filtered BL was even higher than most of the BBSA (MWt.
68000) experiments. This can be attributed to the rejection of higher molecular weight
proteins from the pre-filtered BL feed.
5.1.2 Study of associated fouling in avidin immobilized nylon membrane
The fouling in the membrane due to permeation of proteins can be observed by
the flux decline curves shown in Figure 5.8. Due to the presence of higher amount of
protein (attached + adsorbed) in the membrane (Table 5.5), reduction of flux increases as
the concentration of protein in feed increases (except 10 µg/ml BSA). For BL (3864
µg/ml total protein) the flux decline (85 %) was highest because of maximum amount of
protein in membrane matrix.
103

0
0.2
0.4
0.6
0.8
1
0 50 100 150 200 250 300
Cumulative Permeate Volume, V (ml)
Jv/J
v0
10 µg/ml BSA, 3 µg/ml BBSA, 10 µg/ml BBSA, 10 µg/ml BBSA + 13 µg/ml GG, BL (3864 µg/ml total protein) 10 µg/ml BSA, 3 µg/ml BBSA, 10 µg/ml BBSA, 10 µg/ml BBSA + 13 µg/ml GG, BL (3864 µg/ml total protein)
Figure 5.8 Comparison of normalized flux (Jv/Jv0) for permeation of BSA, BBSA, BBSA
+ gamma globulin (GG) and bacterial lysate (BL) through avidin immobilized nylon
membranes (pore dia. = 0.45 µm) at 0.34 bar. Normalized flux = ratio of flux at any time
of permeation to initial flux. Jv0 = 14 x 10-4 – 24 x 10-4 cm3/cm2.s
104

Table 5.5 Calculated resistance and thickness of protein layer formed due to the
permeation of BSA, Biotinylated-BSA (BBSA), BBSA + Gamma Globulin (GG) and
UNF BL feed through avidin immobilized membrane (Pore dia. = 0.45 µm) at 0.34 bar.
RP = Resistance of protein layer, δp= Effective thickness of protein layer
Conc. of total protein in feed Total amount of protein in
membrane (µg) RP x 10-10 (cm-1)
δp (nm)
10 µg/ml BSA 256 1.3 6.0
3 µg/ml BBSA 307 1.53 12.0
10 µg/ml BBSA 493 2.37 15.5
19.3 µg/ml BBSA 653 2.6 20.0
10 µg/ml BBSA+13 µg/ml GG 678 2.75 27.0
3864 µg/ml (UNF BL1) 16251 12.3 68.0
1120 µg/ml (UNF BL2) 15000 8.3 61.0
105

Membrane pores experience fouling because of the adsorption of proteins due to
different interactions (hydrophobic and van der Waals). Some protein molecules form
aggregates by protein-protein interaction (e.g., Tat and BSA are rich in cysteine residues,
so prone to form aggregates by S-S linkages) and deposited in the pores of the membrane
(Kelly and Zydney 1995; Marshal et al. 1993). Reversibly adsorbed molecules were
removed by salt washing. However, significant amount of proteins were adsorbed
irreversibly, particularly for the higher concentration of protein solution, and hence,
permeate flux could not be recovered to the initial value. Based on the initial flux through
avidin-immobilized membrane, the flux recovery was 90 % for 10 µg/ml BSA and 70-80
% for 19.3-3 µg/ml BBSA. The flux recovery (25 %) to significant extent was not
possible for BL by washing with salt solutions (wash buffer and cleavage buffer), which
proves highly irreversible nature of fouling for BL as again discussed later.
Figure 5.8 also reveals that fouling is less for 10 µg/ml BSA than that for 10
µg/ml BBSA, suggesting that fouling is not dependent entirely on total protein in feed,
but also depends on the biotin molecules. For BBSA, due to the avidin-biotin interaction
the amount of total protein present in membrane is higher than that for BSA (Table 4.3),
which has caused the higher flux drop.
Calculation of resistance and thickness of adsorbed protein layer: Assuming all pores
in the membrane have the same radius, the volumetric permeate flux (Jw0) and the
volumetric flow rate (Qw0) of water through a non-fouled avidin-immobilized membrane
can be represented by Hagen-Poiseuille’s equation as (Mulder 1991):
mw R
PPl
rJ
µµτε ∆
=∆=8
20
0 (5.1)
and, lPr
NQ Pw µπ
8
40
0
∆= (5.2)
where, r0 = radius of non-fouled avidin-immobilized membrane pore; µ = viscosity of
solution; ℓ = thickness of the membrane or length of membrane pore; ∆P =
transmembrane pressure drop; τ = tortuousity of the membrane; ε = porosity = 0.8; NP =
106

total number of pores in the membrane; Am = external membrane surface area; intrinsic
membrane resistance, . 20/8 rlRm ετ=
For permeation of proteins, the volumetric flux, Jv, through the fouled membrane can be
described using Darcy’s Law as follows (Ho and Sirkar 1992):
)( Pmv RR
PJ+
∆=
µ (5.3)
where, RP = resistance offered by the layer of proteins present in the membrane.
Rearranging equation (5.1) and (5.3) the expressions for Rm and RP can be obtained as
follows:
0wm J
PRµ∆
= (5.4)
vPm J
PRRµ∆
=+ (5.5)
Assuming NP remains same and proteins form an effective uniform thickness of layer
throughout the pores of the membrane, equation (5.2) could be reproduced for the
volumetric flow rate of pure water through the fouled membrane, Qw, by substituting the
radius of the bare membrane pore (r0) with the effective radius of the fouled membrane
pore (rP). Now, rP can be represented similarly as reported in literature (Zeman 1983) by: 25.0
00
⎟⎟⎠
⎞⎜⎜⎝
⎛=
w
wP Q
Qrr (5.6)
Equation (5.6) can also be used to calculate the effective radius of membrane
pores after immobilization of avidin (ravidin), using the water flow rate data obtained after
immobilization.
The effective thickness of immobilized avidin layer (δavidin), the effective
thickness of protein layer (δp) and the effective thickness of total protein (including
avidin) layer (δT) can be calculated as:
δT = r-rP, δavidin = r-ravidin, and δP = δT - δavidin = ravidin- rP (5.7)
Equation (5.4) and (5.5) are used to calculate the equivalent resistance (RP)
offered by the effective protein layer, and equation (5.6) and (5.7) are used to calculate
107

the thickness of the protein layer (δp) present in the membrane pores after the permeation
of protein and salt washing.
Due to the high concentration of proteins in BL, surface fouling occurred to some
extent along with the adsorption of proteins within the pores. However, in order to get a
rough estimate of the effect of protein layer on the fouling, the same assumption of
“formation of an effective uniform thickness of protein layer throughout the pores of the
membrane” was followed for BL also. For BL, it was also assumed that 4-stack
membranes system obeys resistance-in-series model. Calculated values of RP and δP for
different protein solutions are presented in Table 5.5. It can be observed that RP and δp
increase with increase in protein concentration in feed, due to the presence of higher
amount of protein in the membrane. The RP and δp for both cases of BL are much higher
than that for BSA, BBSA and BBSA+GG.
The increase in effective thickness of protein layer during the permeation of BSA,
BBSA, BBSA+GG and UNF BL were calculated using same type of correlation as
equations (5.6) and (5.7). The calculated values of effective thickness of protein layers
are plotted in Figure 5.9 as a function of cumulative permeate volume, V. Starting from
zero thickness, the layer built up sharply as protein molecules were attached by avidin-
biotin interaction, as well as adsorbed by non-specific protein-avidin interaction on the
membrane pores. Later, formation of the adsorbed protein layer was gradual due to the
slower rate of attachment and adsorption, and finally it leveled off.
SEM images of the unused Immunodyne membrane and the topmost membrane
used in the 4-stack membranes system for UNF BL1 permeation are shown in Figure
5.10. Substantial fouling is observed in some places of the surface of the topmost
membrane used for UNF BL1 permeation. So, it can be inferred that the fouling is mainly
on the pore of the membrane, along with some surface fouling as shown by SEM image.
Deposition of aggregated proteins was the cause of this surface fouling.
108

0
10
20
30
40
50
60
70
80
90
0 50 100 150 200 250 300
Cumulative Permeate Volume, V (ml)
Effe
ctiv
e th
ickn
ess
of p
rote
in la
yer i
n m
embr
anes
, nm
10 µg/ml BSA 3 µg/ml BBSA 10 µg/ml BBSA 10 µg/ml BBSA + 13 µg/ml GG BL (3864 µg/ml total protein)
Figure 5.9 Comparison of effective thickness of protein layer formed within the
membrane while permeating BSA, BBSA, BBSA + Gamma Globulin (GG) and bacterial
lysate (BL) through avidin immobilized nylon membranes (Pore dia. = 0.45 µm) at 0.34
bar
109

(a) (b)
Figure 5.10 SEM images (6K magnification) of the surface of the nylon based MF
membranes (Pore dia. = 0.45 µm). (a) Bare Immunodyne membrane, (b) Topmost
membrane of the 4-stack nylon membranes matrix through which UNF BL1, wash buffer
and cleavage buffer were permeated at 0.34 bar
110

Effect of pre-filtration on fouling behavior of affinity separation: Simplified
mathematical models are presented to explain the change in fouling behavior of the pre-
filtered affinity separation. Two mechanisms of flux decline are considered; combined
Model and standard Blocking Model (Bowen and Gan 1991). Combined model is
applicable for protein solutions of higher concentration (UNF BL2 feed), where the
chances of formation of aggregates are significant. But, standard blocking model
describes fouling for lower concentration of protein solutions (UF BL and MF BL feeds).
For both the models, it is assumed that membranes consist of equal numbers of
uniform, cylindrical pores and adsorbed protein molecules form a uniform layer of
thickness, δ, within all of the pores. It is also assumed that in the 4-stack membranes
system, pores are aligned coaxially on top of each other to form a continuous cylindrical
channel of length equal to 4 times the length of a single pore.
The schematic of the membrane pore within which mass balance is done to
formulate flux decline due to protein adsorption is shown in Figures 5.11 (a) and (b). For
the combined model, fouling is assumed to occur both inside the pores and on the
external surface of the membrane. As protein molecules permeate through the membrane,
some of them adsorb on the pore walls reducing the pore radius from r0 to r at time t and
some of them adsorb on the external surface of the membrane (Figure 5.11 a).
From the protein mass balance, the amount of total adsorption at any time interval
can be written as summation of the amount of pore and external surface adsorption as
( ) SPt dMdrrLNdM +−= ρπ2 (5.8)
where, NP = number of pores in avidin-immobilized membrane, which is estimated as
Pr
AQlN mw
P∆
= 60
2
8
π
εµ= 2x10⁹ (5.9)
Am = external surface area of membrane = 33.2 cm2; ε = 0.8 (from manufacturers data); r0
= radius of avidin-immobilized membrane pore = 215 x 10-7 cm (Datta et al. 2006); L =
Total length of a cylindrical channel in 4-stack membranes = 4ℓ = 4 x 165 x 10-4 cm; ρ =
mass of protein adsorbed per unit volume of adsorbed layer inside the pore, µg/ cm3; MS
= mass of protein adsorbed on the external surface of membrane at t, µg; MT = mass of
total protein adsorbed in membrane (external surface + pore) at t, µg.
111

r
ℓ
∆r (a)
δ
r0
r0
∆r
δ
ℓ
r
(b)
Figure 5.11 Schematic of adsorption of protein (a) both within the pores and on the
external surface of the membranes: combined model, and (b) only within the pores of the
membranes: standard model. The thickness of adsorbed protein layer formed at a distance
r from the center of pore at any time interval of ∆t is ∆r
112

Equation 5.8 is integrated with the initial conditions; at t = 0, r = r0, MS = 0, MT = 0, to
obtain
STP MMrrrLN −=
⎥⎥
⎦
⎤
⎢⎢
⎣
⎡
⎟⎟⎠
⎞⎜⎜⎝
⎛−
2
20
0
1ρπ (5.10)
Hagen-Poiseuille’s equation is used to substitute the ratio r/r0 with the ratio of permeate
volumetric fluxes (Jv/Jv0) in Equation 5.10. Rearranging the resulting equation, an
expression for the normalized permeate flux is obtained as 2
200
1⎥⎥⎦
⎤
⎢⎢⎣
⎡⎟⎟⎠
⎞⎜⎜⎝
⎛ −−=
rLNMM
JJ
P
ST
v
v
ρπ (5.11)
where, Jv = permeate flux at any time t, cm3/cm2-s; Jv0 = initial permeate flux (i.e. at t =
0), cm3/cm2-s; and Jv/Jv0 = normalized permeate flux.
Determination of MT and MS are necessary to calculate permeate flux. For that,
equation 5.11 is treated as a semi-empirical model and MT and MS are obtained by
studying the kinetics of total protein and surface protein adsorption, respectively.
Total protein adsorption data are obtained from the affinity separation experiment
of UNF BL2 feed by measuring the concentration of total protein in permeates at
different time. It is observed that the amount of adsorbed protein eventually approaches
equilibrium. Suki et al. (Suki et al. 1984) studied the adsorption kinetics of BSA and
observed similar kind of equilibrium adsorption. Considering the same type of kinetics of
adsorption is valid in our case, the rate of adsorption is defined following Suki et al. as:
( TTTT MMK
dtdM
−= * ) (5.12)
where, MT* = final amount of total protein adsorbed, µg, and KT = rate constant of the
total adsorption, min-1
Integrating equation 5.12 with the initial condition; at t = 0 MT = 0, one can obtain
]1[* tKTT
TeMM −−= (5.13)
The experimental values of MT are plotted in Figure 5.12 as a function of time
and fitted with equation 5.13.
113

0
4000
8000
12000
16000
0 20 40 60 80 100 120 140 160 180 200
Time,t (min)
Prot
ein
Ads
orbe
d, µ
g
Total adsorption (external surface + pore) External surface adsorption
Figure 5.12 Kinetics of total protein adsorption for UNF BL2 feed. The solid curves
represent the best fitted values according to Equation 5.13 for total adsorption and
according to Equation 5.14 for surface adsorption, respectively
114

The best fitting value of the total adsorption rate constant, KT, is determined to be
0.034 min-1, while the value of MT* (15000 µg) was known from material balance on
total protein present in different streams of affinity separation of UNF BL2 feed.
In order to study the kinetics of surface adsorption, separate batch experiments
(no flow condition) were carried out with avidin-immobilized Immunodyne membrane
and UNF BL feed containing the same protein concentration as in the affinity separation.
The amount of adsorbed protein was determined at different time intervals. Then, similar
procedure as total adsorption is followed to obtain
]1[* tKSS
SeMM −−= (5.14)
where, MS* = final amount of protein adsorbed on surface = 1400 µg (from material
balance on total protein present in different streams of batch experiment), and KS = rate
constant of the surface adsorption = 0.04 min-1 (best fitting value obtained from Figure
5.12).
The value of ρ is obtained by defining it as ( ) 35
0
**
/103.12
cmgxLrN
MM
P
ST µδπ
ρ =−
=
where, δ = calculated thickness of protein layer adsorbed within the pores = 61 nm (Table
5.5). Knowing MT and MS from Equation 5.13 and 5.14, respectively, the normalized flux
for UNF BL2 can be calculated from Equation 5.11 as a function of time.
Standard blocking model can be applied to dilute solutions of protein. In this case,
external surface adsorption is assumed to be negligible and flux decline is described by
adsorption of protein molecules only inside the pores of membrane. Equation 5.8 can be
simplified assuming negligible external surface adsorption, i.e. the last term of right hand
side of Equation 5.8 is assumed to be zero. The simplified equation is written as
( )ρ
π tP
dMdrrLN =− 2 = change in volume of adsorbed pore layer
The change in volume of adsorbed pore layer, shown in Figure 5.11 (b), can be correlated
with the volume of the adsorbed protein as done by Bowen et al (Bowen and Gan 1991).
( ) XdVdrrLN P =− π2 (5.15)
where, X = Volume of total protein adsorbed per unit volume of permeate
V = Volume of permeate collected at any time, cm3
115

Integrating Equation 5.15 with the condition; at V = 0, r = r0, and then substituting r/r0
with Jv/Jv0, an expression for the normalized permeate flux is obtained as
( )[ 2
0
1 VKJJ
Xv
v −= ] (5.16)
where, KX = X/LA0, cm-3; A0 = Initial pore area = NPπr02, cm2.
Integrating Equation 5.16 by substituting Jv = (dV/dt)/Am and rearranging gives
Xmv
KtAJV
+=0
11 (5.17)
Substituting the value of V from Equation 5.17 to 5.16 and rearranging gives
([ )]200 1
1tAJKJ
J
mvXv
v
+= (5.18)
Equation 5.18 is used to calculate normalized permeate flux of UF BL and MF
BL feeds. It is also used to calculate permeate flux of UNF BL2 feed so that comparison
can be made between the applicability of two models for UNF BL2 feed. KX values for
all three cases are obtained from the Y-axis intercept of straight line fit (not shown here)
of respective affinity separation experimental data (R2 > 0.98) according to Equation 5.17.
The KX values are 0.0064, 0.0032 and 0.0006 cm-3 for UNF BL2, MF BL and UF BL,
respectively. These values are then used in equation 5.18 to calculate normalized flux
(Jv/Jv0) values as a function of time.
The combined model calculated Jv/Jv0 values for UNF BL2 feed as well as the
standard model calculated Jv/Jv0 values for UNF BL2, MF BL and UF BL feed are plotted
in Figure 5.13 as a function of cumulative permeate volume (V). The experimental
normalized flux values are also plotted in the same figure for comparison. For all of the
affinity separation experiments, Jv/Jv0 decreased with increasing V, however, the extent
and nature of the decline are different for different cases. Flux decline for the UNF BL2
feed was highest because of the fouling caused by feed containing highest protein
concentration. This was followed by MF BL feed and UF BL feed. It was determined that
total protein adsorption at the end of each experiment were 15000, 3000 and 2000 µg for
UNF BL, MF BL and UF BL feeds, respectively Similarly, due to the very high rate of
fouling the flux decline curve for UNF BL2 feed is steeper than the others.
116

0
0.2
0.4
0.6
0.8
1
0
50 100 150 200 250
Cumulative Permeate Volume, V (cm3)
Jv/J
vo
UF BL feed MF BL feed
UNF BL feed
Figure 5.13 Normalized flux vs cumulative permeate volume for the affinity separation of
different BL feeds through avidin-immobilized 4-stack Immunodyne membranes at 0.34
bar. The solid curves represent the Standard Blocking Model calculated values according
to Equation 5.18, whereas, the broken curve represents the Combined Model calculated
values according to Equation 5.11. UNF BL2 = Unfiltered BL2, UF BL = Ultrafiltered
BL, MF BL = Microfiltered BL
117

It is also observed from Figure 5.13 that the standard model calculated Jv/Jv0
values match very well with the experimental values of UF and MF BL feeds. This
proves that the standard blocking mechanism was sufficient to explain fouling for the UF
and MF BL feeds. However, for the UNF BL feed the standard blocking mechanism did
not provide Jv/Jv0 values accurately. The deviation between the experimental and the
standard model calculated values was due to surface adsorption of proteins in addition to
pore adsorption for the UNF BL2 feed. It can be observed from Figure 5.13 that the
combined model calculated values describe the experimental flux decline for the UNF
BL2 feed more accurately than the standard model. The model calculated values of UF
BL, MF BL and UNF BL2 have indicated that pre-filtration step was able to restrict the
fouling only within the pore structure for affinity separation step. The deviation noticed
in the model predicted and experimental values for UNF BL2 feed in the initial phase of
affinity separation was probably due to blockage of some of the pores that was not
accounted for in the combined model.
5.1.3 Separation and purification of Tat
Effect of dilution and ionic strength: Figure 5.14 and 5.15 show the effect of dilution
and salt concentration on available free Tat as analyzed by ELISA. Normally with
dilution the total amount of a component present in a solution remains same (the
concentration decreases). In case of Tat in BL, it was observed that the total amount of
available free Tat in diluted BL increased with an increase in dilution factor till around
150 as shown in Figure 5.14. After that it became constant eventually. This observation
suggests that in undiluted BL supernatant, Tat was entangled within the aggregates
formed. As dilution increased, due to decrease in protein-protein interaction Tat was
released from the aggregates, resulting in increase in amount of Tat. However, after
certain dilution all the entangled Tat was released. In our experiment we have taken
conservative approach by diluting BL up to 30 times only. This was done to make sure
that the advantage of dilution has been utilized properly. Similarly, due to the shielding
effect of ions, the interaction between the proteins decreased at higher salt concentration
and more amount of Tat was released in BL as shown in Figure 5.15.
118

0
100
200
300
400
500
600
0 100 200 300 400 500 600 700 800 900 1000
Dilution Factor
µg
Tat /
ml o
f BL
Figure 5.14 Effect of dilution on free available Tat by diluting bacterial lysate with 0.1 M
(0.1 x 10³ µmoles/ml) NaCl
119

0
50
100
150
200
0 0.1 0.2 0.3 0.4 0.5 0.6
Conc. of NaCl x 10-3, µmoles/ml
µg
Tat /
ml o
f BL
Figure 5.15 Effect of ionic strength on free available Tat by diluting bacterial lysate
(dilution factor = 10) with different concentrations of NaCl
120

Characteristic flux and concentration of protein profiles in permeate of affinity
membrane separation of Tat: Figure 5.16 represents characteristic flux decline profile
as a function of time for different solutions in affinity separation of Tat from UNF BL2
feed. It can be observed that permeation of BL is associated with dramatic decrease in
permeate flux. It decreases to 50 % and 20 % of initial flux after first 10 min and 60 min,
respectively. After that it remains almost constant. Even the washing steps (WB 1, WB 2
and CB) were not able to enhance the flux significantly. This shows that the fouling
inside the membrane matrix was pre-dominantly irreversible in nature. Some reversibly
adsorbed proteins were removed in the washing steps thereby increasing the flux from 20
% to 25 % of the initial value. Figure 5.17 is a semi-logarithmic plot, which
demonstrates the concentration of total protein obtained in permeate as different solutions
were permeated in the same affinity separation experiment. Concentration of protein in
permeate decreases due to adsorption inside the membranes. It reaches a minimum (550
µg/ml) after around 60 min, which also corresponds to maximum decline in the permeate
flux. Then, adsorption of protein attains an equilibrium value and almost ceases. After
that, concentration of protein in permeate increases and eventually approaches the
concentration of protein in feed side. Figure 5.17 also shows that the subsequent washing
steps were able to remove the reversibly adsorbed protein molecules from the membrane
matrix.
Qualitative analysis of membrane purified Tat protein: Quality of the membrane
purified Tat, isolated from unfiltered BL as well as pre-filtered BL feed, was analyzed by
SDS-PAGE, Western Blot and Biotin analyses. SDS-PAGE fractionates proteins from a
mixture based on their molecular weight and shows specific band for different molecular
weight proteins present. Figure 5.18 demonstrates that for a typical Tat separation
experiment, feed, permeate and retentate streams were consisted of substantial amount of
unwanted proteins along with Tat. The wash buffer and cleavage buffer did not contain
Tat protein. The eluate, which is basically the purified Tat stream, has a distinct band
near 13-14 kDa molecular weight range.
121

0
0.2
0.4
0.6
0.8
1
0 100 200 300 400 500 600
Time (min)
Jv/J
vo
UNF BL2WB1WB2CB
Figure 5.16 Characteristic flux vs. time curve for permeation of unfiltered bacterial lysate
(UNF BL2), wash buffer 1 (WB 1), wash buffer 2 (WB 2) and cleavage buffer (CB)
through avidin immobilized 4-stack functionalized membranes. Permeate flux is
normalized by dividing with initial flux through avidin immobilized 4-stack membranes.
122

1
10
100
1000
10000
0 100 200 300 400 500 600
Time, min
CP,
µg/
ml
UNF BL2WB1WB2CB
Figure 5.17 Concentration of total protein in permeate for different solution streams in
affinity separation of Tat from UNF BL2 feed through 4-stack avidin immobilized
functionalized membranes. UNF BL2 = unfiltered bacterial lysate with 1120 µg/ml total
protein concentration in feed, WB 1 = wash buffer 1, WB 2 = wash buffer 2 and CB =
cleavage buffer
123

CC
TAT
CC
TATTat
Figure 5.18 SDS-PAGE images of different streams for the separation of Tat from
bacterial lysate (UNF BL2) using avidin-biotin interaction in avidin immobilized 4-stack
nylon membranes (F = Feed, P = Permeate, R = Retentate, WB = wash buffer, CB =
cleavage buffer, E = Tat eluate). Conc. of total protein in feed = 1120 µg/ml
124

For the ease of comparison, SDS-PAGE and Western Blot analysis images of Tat
eluates from UNF BL1, UNF BL2, MF BL and UF BL feed are represented in Figures
5.19 and 5.20 along with the column chromatographically purified Tat. A distinct band
near 13-14 KDa can be observed in SDS-PAGE images (Figure 5.19) of all membrane
purified Tat eluates along with few additional bands for minor impurities. However, due
to the presence of substantial amount of impurities, several other bands are observed for
column chromatographically purified Tat eluate. Although molecular weight of Tat
monomer is 8335 Da, the band obtained at 13-14 kDa due to the strong interaction
between SDS and the highly basic polypeptide sequence of Tat (Hollman et al. 2005).
Western Blot analysis has also been used to compare the purity of Tat protein
obtained by membrane and packed-bead column chromatographic separation. Since, a
very specific antibody of the protein of interest is utilized to analyze a sample in Western
Blot; any band that shows up in the image must be due to the corresponding protein. As
seen from Figure 5.20, the purified Tat obtained from membrane separation contains a
distinct band near 13 kDa, indicating the presence of pure monomeric form of Tat,
whereas the Tat from packed-bead column chromatographic separation contains several
other bands ranging from 10-80 kDa, indicating the presence of polymeric forms of Tat,
which are unwanted for further therapeutic usages of Tat protein.
Biotin analysis results also proved the presence of impurities in the form of biotin
for column chromatographically purified Tat. It was determined that column purified Tat
contains impurities equivalent to 17 mole % (0.5 wt %) of biotin, which was substantially
high. On the other hand, biotin was not detected (lower limit of detection was found to be
4 mole % of biotin) for membrane purified Tat. The biotin impurities in column
chromatographically purified Tat indicates the shortcomings of diffusion mode in
washing and cleavage steps. It is speculated that the biotin containing impurities might be
due to the uncleaved biotin-fusion protein-Tat or biotin-fusion protein or free biotin.
Total amount of purified Tat for UNF BL1 and UNF BL2 feed were 250 and 270
µg, respectively, as analyzed by ELISA. This corresponds to only 5-6 % recovery of Tat
from BL. The % recovery implies that substantial amount of Tat (95 %) is still present in
other streams along with the impurities.
125

UNFBL1E
UNFBL2E
MFBLE
UFBLE
CCE
CCE
MWt.RCECHE
181.8115.582.263.248.8
37.1
25.9
19.4
14.8
6.0
14.8
6.0
UNFBL1E
UNFBL2E
MFBLE
UFBLE
CCE
CCE
MWt.RCECHE
181.8115.582.263.248.8
37.1
25.9
19.4
14.8
6.0
14.8
6.0
181.8115.582.263.248.8
37.1
25.9
19.4
14.8
6.0
14.8
6.0
181.8115.582.263.248.8
37.1
25.9
19.4
14.8
6.0
14.8
6.0
Tat
Figure 5.19 SDS-PAGE images of purified Tat eluates separated from bacterial lysate
(BL) using different techniques. E = Tat eluate, UNF BL1 = unfiltered BL 1, UNF BL2 =
unfiltered BL 2, MF BL = microfiltered BL, UF BL = ultrafiltered BL, CC = column
chromatography, RC ECH = Tat separated using RC-ECH functionalized membrane
126

UNFBL1E
UNFBL2E
MFBLE
UFBLE
CCE
CCE
MWt.UNFBL1E
UNFBL2E
MFBLE
UFBLE
CCE
CCE
MWt.
Tat
Figure 5.20 Western Blot analysis of different purified Tat eluates from bacterial lysate
(BL). E = Tat eluates, UNF BL1 = unfiltered BL 1, UNF BL2 = unfiltered BL 2, MF BL
= microfiltered BL, UF BL = ultrafiltered BL, CC = column chromatography
127

Effect of pre-filtration on processing time and recovery: Pre-filtration has a critical
impact on the processing time of not only the affinity separation, but also the overall
process, i.e. including the washing and pre-conditioning for cleavage steps. Comparison
of processing time for various steps of membrane separation is given in Figure 5.21 for
different BL feeds. It can be observed from the Figure that pre-filtration step was able to
substantially reduce the overall processing time.
Although pre-filtration step itself has incurred significant time, it has dramatically
reduced processing time for affinity separation, two washing cycles and pre-conditioning
by cleavage buffer. Time required for affinity separation of pre-filtered feed was less due
to overall higher flux (lower fouling). Similarly, time for subsequent wash and cleavage
buffers was less due to higher fluxes for the pre-filtered cases. Time for washing cycles
was also less because lower amount of wash buffers were sufficient to remove the non-
specifically adsorbed proteins. However, the isolation of Tat by Factor Xa required same
amount of time for all the three cases as it was dependent on the kinetics of cleavage by
the protease.
The amount of Tat recovered was significantly higher for UF BL (1050 µg Tat),
followed by MF BL (750 µg Tat), whereas, it was substantially lower for UNF BL2 (270
µg Tat). Amount of biotinylated-Tat fed and avidin immobilized in membranes were
same for all the three cases. This shows that pre-filtration step has significantly improved
the extent of Tat recovery, i.e., separation efficiency, due to the enhanced accessibility.
The processing time to treat 0.55 µmole of biotin in feed has reduced from around 9 hr
for unfiltered BL feed to 6.5-7 hr for pre-filtered BL feeds. Point to note that processing
time needed to recover 250 µg of Tat by packed-bead column chromatography was
almost 11 hr. However, if the processing time is represented in terms of time required per
unit amount of Tat isolated then the values obtained are 2.6, 2, 0.5, 0.4 min/µg for
column chromatography, unfiltered BL feed, MF BL feed and UF BL feed in membranes,
respectively. This demonstrates, that for pre-filtered BL feed, the processing time per unit
amount of Tat isolated is five times lower than that for column chromatography.
128

0
100
200
300
400
500
600Pr
oces
sing
Tim
e, m
in Isolation Cleavage buffer Wash buffer2 Wash buffer 1 Affinity separation Pre-filtration
UNF BL2 feed UF BL feed MF BL feed
Figure 5.21 Comparison of total processing time for unfiltered BL feed (UNF BL2 feed),
microfiltered BL feed (MF BL feed) and ultrafiltered BL feed (UF BL feed) in separation
and purification of Tat from BL. For all cases, external membrane area = 33.2 cm2,
volume of BL feed = 250 cm3 with 95 % permeate water recovery; Amount of
biotinylated-Tat fed = 0.55 µmole, maximum possible Tat recovery = 0.18 µmole (1500
µg)
129

RC-ECH TAT: Tat separation was carried out using 4-stack functionalized RC-ECH-
avidin membranes. Since, this is just an initial study showing RC-ECH membranes can
be used for separation of Tat protein from BL; all analyses were not done. Only, SDS-
PAGE analysis was carried out with the Tat eluate to show that pure Tat is isolated.
Figure 5.19 illustrates that this functionalized membranes system was indeed able to
isolate satisfactorily pure Tat as confirmed from the distinct band near 13-14 KDa.
5.2 Conclusions
Affinity based separation technique was applied to obtain high quality Tat protein
from bacterial lysate (BL) supernatant using avidin-biotin interaction in functionalized
stacked MF membranes. Tat protein obtained by this technique was superior in quality
than that obtained by conventional packed-bead column chromatographic separation as
demonstrated by SDS-PAGE, Western Blot and biotin analyses. Membrane purified Tat
was pure and monomeric in nature compare to polymeric Tat obtained for conventional
packed-bead column chromatographic separation. The amount of biotin impurities in Tat
protein purified by conventional packed-bead column chromatographic separation was 17
mole %, whereas, biotin impurities were not detected for membrane purified Tat.
The major factors associated with this separation are the accessibility of
covalently immobilized avidin sites by the biotinylated protein and fouling of the
membranes due to permeation of significant quantity of non-biotinylated proteins. In this
research, accessibility of avidin sites was quantified using different biotinylated-species.
It was observed that in case of covalent immobilization of avidin, only half of the total
avidin sites were actually accessible by biotin moiety present in a small biotinylated
probe molecule. The accessibility decreases further for pure biotinylated model protein,
and becomes least for the target protein, Tat, in bacterial lysate due to the presence of
substantial amount of non-biotinylated proteins (97-99 wt %). The avidin immobilized
membranes were also susceptible to non-specific protein adsorption causing significant
flux drop due to fouling. For permeation of BL, the flux decreased by 80 % of the initial
value due to fouling.
130
In order to improve the efficiency of the technique, a pre-filtration step was
introduced. The pre-filtration step was effective in removing high molecular weight
proteins and other impurities from BL feed. Accessibility of immobilized avidin sites,
and hence the separation efficiency of biotinylated-Tat protein was significantly
enhanced for the pre-filtered BL feed (normalized accessibility = 0.5-0.7) compared to
unfiltered BL feed (normalized accessibility = 0.18-0.35). Significant improvement was
also observed in the flux decline behavior of the pre-filtered BL feed due to reduced
fouling. The processing time was also reduced (5 times lower) for the pre-filtered BL
feed. The pre-filtered BL feed has also allowed the analysis of biotinylated-Tat content of
different process streams of affinity separation directly by HABA-avidin complex
method.
Pre-filtration step was able to restrict the fouling only within the pores of the
membranes. Hence, under the experimental conditions mentioned in this research work,
standard blocking model was sufficient to predict the flux decline due to fouling for the
pre-filtered BL feeds in affinity separation. However, a combined model considering
adsorption on both external surface and pores of the membrane was necessary to predict
fouling behavior of unfiltered BL feed.
Copyright © Saurav Datta 2007
131

Chapter 6 Enzymatic Oxidation of Glucose to Gluconic Acid and H2O2 by
Electrostatically Immobilized Glucose Oxidase in Functionalized Membranes
Glucose oxidase (GOX) is one of the most widely used enzymes due to its ability
to detect glucose, and remove oxygen and glucose from the system by forming gluconic
acid and hydrogen peroxide. The focus of this research study was to form high capacity,
highly active, stable and reusable GOX-immobilized functionalized polymeric
membranes for catalytic oxidation of glucose using Layer-By-Layer (LBL) technique
within nylon based membrane and in-situ polymerization of acrylic acid in hydrophobic
PVDF membrane. Functionalization of membranes and immobilization of GOX was
described in Chapter 4. This Chapter discusses the experimental results obtained for
kinetics of enzymatic oxidation of glucose, effects of pH and flow rate on activity of the
immobilized GOX under convective flow condition, and some other important
observations. One of the major achievements in this research was the reusability of the
membranes. To the best of our knowledge, this is the first time that a study has been
carried out to detach and reattach enzyme from membranes to explore the reusability.
6.1 Results and discussion
In order to check the reproducibility of the results, all experiments were
triplicated. The error bars shown in different figures represent standard deviations.
6.1.1 Steady state experiment
Steady state concentration of H2O2 produced as a function of time, for a fixed
substrate concentration and flow rate, is represented in Figure 6.1. From the Figure it is
evident, that the concentration of H2O2 in permeate has reached steady state from the
beginning itself for both of the substrate concentrations studied. The variation is within
the error range of 5 %. It was also observed that the amount of H2O2 produced in the feed
side of the membrane was < 5 % after t = 30 minutes for all the cases. This is because the
surface immobilization of GOX was insignificant compare to pore immobilization.
132

0
0.1
0.2
0.3
0.4
0 5 10 15 20 25 30
Time, min
Con
cent
ratio
n of
H2O
2, m
M
15 mM Glucose75 mM Glucose
Figure 6.1 Determination of the steady state concentration of H2O2 produced in LBL
assembled nylon membrane for fixed flow rate and substrate concentration. Two different
substrate concentrations, 15 mM and 75 mM glucose, were studied. Amount of GOX
immobilized = 1.5 mg, permeate flux = 140 x 10-4 cc/cm2.s, residence time = 0.6 s, pore
radius of LBL assembled nylon membrane = 125 nm, external membrane area = 13.2 cm2,
membrane thickness = 165 µm, pH = 5.5, Temperature = 25 0C
133

However, if the experiment is carried out for long time, the production of H2O2
will be significant as it behaves like a batch reactor on the feed side. Therefore, to avoid
production of H2O2 on feed side, all activity data were collected within first 5-10 minutes
of the experiments.
6.1.2 Importance of O2
Figure 6.2 represents the normalized activity of immobilized GOX as a function
of time for three different regimes; (i) initial phase of air supply, (ii) air supply replaced
with N2, and (iii) re-establishment of air supply. As air was replaced by N2, activity
started dropping dramatically and reached a minimum. Then, with reestablishment of the
air supply, the activity increased sharply. This shows that depletion of O2 from the
reaction mixture could severely affect the activity of enzyme. Thus, it was necessary to
maintain the saturation condition of O2 in the reaction mixture for all experiments. Higher
activity observed in the latter phase of the experiment was due to the increase in
concentration of H2O2 in the feed side with time.
6.1.3 Kinetics of glucose oxidation by GOX
Homogeneous phase kinetics: Homogeneous phase catalytic oxidation of glucose was
carried out using free GOX. Well known Michaelis-Menten rate equation (Voet et al.
2004) is used to describe the kinetics of homogeneous phase glucose oxidation. The
equation expressing the rate, v is as follows
( )sKsv
vm +
= max (6.1)
where, s is the substrate concentration, vmax is the maximum possible rate at an imaginary
substrate concentration of infinity, Km is the Michaelis-Menten rate constant and is
defined as the substrate concentration at which rate becomes half of vmax.
Equation (6.1) can be manipulated to give
svK
vvm
maxmax
11+= (6.2)
134

0
0.2
0.4
0.6
0.8
1
0 20 40 60 80 100 120 140 160
Time, min
Nor
mal
ized
Act
ivity
Air Supply N2 SupplyAir Supply
Figure 6.2 Importance of O2 in enzymatic oxidation of glucose by GOX immobilized in
LBL assembled nylon membrane. Activity is calculated based on concentration of H2O2
produced, and normalized by dividing with maximum activity for this experiment, which
is [H2O2] / [H2O2]max. Concentration of glucose fed = 0.75 mM, Amount of GOX
immobilized = 1.5 mg, permeate flux = 140 x 10-4 cc/cm2.s, residence time = 0.6 s, pore
radius of LBL assembled nylon membrane = 125 nm, external membrane area = 13.2 cm2,
membrane thickness = 165 µm, pH = 5.5, temperature = 25 0C
135

Equation (6.2) is used to determine the kinetic parameters by a straight line plot
(Lineweaver-Burke Plot) of 1/v vs. 1/s and then calculating vmax and Km from intercept
and slope, respectively.
The rate (v) for a particular substrate concentration is considered to be equal to
the initial rate, assuming the conversion is negligible initially. Initial rate were estimated
by determining the slope of the activity vs. time data at t = 0 for each substrate
concentration (not shown). Then, v is plotted as a function of s and represented in Figure
6.3. It can be observed that v increases sharply with s at lower range of s, then gradually
flattens out at higher s (Smuleac et al. 2006). This is a typical behavior of enzymatic
reaction kinetics. Rate data are also utilized to determine the Michaelis-Menten kinetic
parameters. Lineweaver-Burke Plot for homogeneous phase reaction is demonstrated in
Figure 6.4, and then vmax and Km are calculated using equation (6.2). Experimental data
were extremely linear in nature as illustrated by the R2 value of > 0.99 in Figure 6.4. The
values of intercept and slopes are around 3.72 and 71.5, respectively. From these, the
values of vmax and Km are calculated to be 0.27 mmole/mg-min and 19 mM, respectively.
It is very difficult to compare the experimentally obtained value of homogeneous phase
vmax with the literature values as it varies from µmole to mmole range (Table 2.1). The
reported values of homogeneous phase Km also varies from 3- 70 mM (Table 2.1).
This enormous deviation is probably because of the variations in experimental
conditions and set-up. It is also probably due to the fact that GOX is available in different
forms and activities from different manufacturers. The experimentally obtained value of
homogeneous phase vmax, in our case, is close to that has been reported by the
manufacturer (0.3 mmole/mg-min). The experimentally obtained value of Km also
matches reasonably well with an earlier reported value (Ahuja et al. 2007). Hence, these
experimentally obtained values of vmax and Km for homogeneous phase GOX are used
further in this dissertation.
It is worth mentioning here that for free GOX and glucose in homogeneous phase
batch reaction the rate must be expressed in the unit of mmole/mg-min, as the volume of
reaction mixture used is important. For example, if 75 mM glucose solution is oxidized in
presence of GOX in 25 ml reaction mixture, then the initial rate is 8.26 mM/mg-min,
whereas, for 50 ml reaction mixture it is 4.13 mM/mg-min.
136

0
0.05
0.1
0.15
0.2
0.25
0 10 20 30 40 50 60 70 8
s, mM
v, m
mol
e/m
g-m
in
0
Figure 6.3 Rate (v) vs substrate concentration (s) for free GOX in homogeneous phase
batch reaction. Concentration of glucose solution = 0.75 - 75 mM, reactor volume = 25
cm3, amount of GOX = 0.25 mg, temperature = 25 0C, pH of NaOAc-HCl buffer = 5.5
137

y = 71.499x + 3.7187R2 = 0.9991
0
20
40
60
80
100
120
0 0.2 0.4 0.6 0.8 1 1.2 1.4
1/s, mM-1
1/v,
(mm
ole/
mg-
min
)-1
Figure 6.4 Lineweaver-Burke plot for free GOX in homogeneous phase batch reaction.
Concentration of glucose solution = 0.75-75 mM (1/s = 1.33 - 0.013 mM-1), reactor
volume = 25 cm3, amount of GOX = 0.25 mg, temperature = 25 0C, pH of NaOAc-HCl
buffer = 5.5
138

Nonetheless, in terms of mmole/mg-min the rate is 0.27 for both the cases.
However, for the combination of GOX immobilized in membrane and convective flow of
glucose solution, the scenario is different and is explained in detail later.
Immobilized phase kinetics: To analyze the rate of reaction for GOX immobilized in a
membrane reactor and the substrate solution permeating through it, understanding of
hydrodynamics within the reactor is important. Ideally, each molecule of glucose, inside
the membrane reactor, should spend equal time in contact with GOX i.e. the residence
time, which is the ratio of volume of membrane reactor to volumetric flow rate. Thus,
residence time calculation is important to determine the activity of immobilized GOX.
Determination of volume of membrane reactor, in this case, is not trivial.
There are two regions inside a membrane pore; polyelectrolyte region, where
GOX is immobilized, and a region void of GOX (Figure 6.5). Reaction mixture flows
through both the regions. The polyelectrolyte layers were developed from the pore wall
toward the pore center. The other region, devoid of GOX, was located near the center of
the pore and known as the core region. A fraction of glucose molecules permeating
through the core region never interacts with enzyme. This phenomenon is known as core
leakage. Core leakage has significant effect in the calculations of enzyme activity
(Smuleac et al. 2006). Thus, it is reasonable to consider only the volume of membrane
pore containing the enzyme as the effective volume of membrane reactor.
Calculation of effective volume of membrane reactor: For LBL membrane, cumulative
thickness of layers after GOX immobilization = 100 nm, pore radius of pure membrane =
225 nm
Therefore, the core region volume = (225-100)2/2252) x pore volume = 0.30 x pore
volume
Effective membrane reactor volume = 0.7 x pore volume = 0.7 x ε x Am x l
Where, ε = porosity of the Immunodyne membrane = 0.8, Am = external area of
membrane =13.2 cm2, l = length of the membrane = 165 x 10-4 cm
So, effective membrane reactor volume for LBL membrane = 0.7 x 0.8 x 13.2 x 165 x10-4
= 0.122 cm3.
139

+ ++
+
++ ++ ++
++
+ +++
---- - -
- --
---
- --
--
-
-- - ---- --
--
- - --
--- -
- - --- ---
--
---
--
--
- ---
--
-- -
--
Core Leakage
+ ++
+
++ ++
+ ++
+
++ ++ ++
++
+ +++
+++
+
+ +++
---- - ----- - -
- --
---
- --
---
- --
--
-- -
--
--
-- - --- -- - ---- --
--
-- -
--
-- - --
---
- --
--- -
- - --- -- - --- --
--
--
---
--
---
--
--
---
--
-
- ---
--- -
---
--- -
-- -- -
--
Core Leakage
+ ++
+
++ ++
Layers of polyelectrolytes or domain of polymers (PAA) with net positive charge
---- - -
Negatively charged GOX
+ ++
+
++ ++
+ ++
+
++ ++
Layers of polyelectrolytes or domain of polymers (PAA) with net positive charge
---- - ----- - -
Negatively charged GOX
Figure 6.5 Schematic diagram of electrostatically immobilized GOX in polyelectrolyte /
polymer domain for both LBL-GOX and PVDF-GOX membranes. There are two distinct
regions; one containing GOX and the other devoid of GOX. The first region is
responsible for the catalytic action of the membrane, whereas, the latter one is associated
with core leakage
140

Similarly, for PVDF-PAA membrane the effective reactor volume = 0.8 x 0.75 x
13.2 x 125 x 10-4 = 0.1 cm3.
Based on this effective membrane reactor volume, residence time (τ) is calculated
for different flow rates. Then, rate for immobilized GOX is calculated as follows.
enzymemgC
Rate OHP
×=
τ22 (6.3)
where, is the concentration of H22OHPC 2O2 in permeate
Under steady state condition and for a fixed residence time, the concentration of
H2O2 produced in permeate is constant, irrespective of volume of the reaction mixture
permeated. Hence, it is appropriate to present the rate in terms of mM/mg-min. While
comparing the rate of immobilized GOX with free GOX, the conversion of rate unit from
mM/mg-min to mmole/mg-min is delicate as it raises the issue of what permeate volume
to consider for the conversion. In the author’s opinion it would be completely unfair, in
this case, to compare the rates between free and immobilized GOX, as hydrodynamics is
completely different. Hence, only the rate data obtained for different cases of
immobilized GOX are discussed. Similarly, although the units of the Km values are same,
they can not be compared on the basis of different dimensions of rate.
Rate of oxidation of glucose for GOX immobilized both in LBL (LBL-GOX-
convective) and PVDF (PVDF-GOX-convective) membranes, with convective flow of
reaction mixture, are determined for different substrate concentration using equation (6.3)
and plotted in Figure 6.6. As observed from the Figure, at lower s, the rate increases very
sharply with s, and then flattens out gradually at higher substrate concentration. For
example, the rate increases from 3 mM/mg-min to 10 mM/mg-min as glucose
concentration increases from 0.15 mM to 0.75 mM, whereas the rate increases only to 21
mM/mg-min as glucose concentration increases to 75 mM. For comparison, the rate for
the same GOX immobilized LBL membrane in soaking mode (LBL-GOX-soaking), and
GOX covalently immobilized in an Immunodyne membrane (covalent-GOX-convective),
are also presented in Figure 6.6. For soaking mode, the rate is calculated similarly as free
GOX in homogeneous phase, whereas, for covalently attached GOX equation (6.3) is
used.
141

0
5
10
15
20
25
0 10 20 30 40 50 60 70 80
s, mM
v fo
r im
mob
ilize
d G
OX,
mM
/mg-
min
LBL-GOX-convectivePVDF-GOX-convectiveLBL-GOX-soakingCovalent-GOX-convective
Figure 6.6 Rate of oxidation of glucose as a function of substrate concentration for
different GOX immobilization experiments. Amount of GOX immobilized = 1.8 mg, 1.5
mg and 1 mg for PVDF membrane, LBL membrane and covalent immobilization,
respectively. Residence time for all experiments were around 0.6 s, temperature = 25 0C,
pH of NaOAc-HCl buffer = 5.5
142

For 75 mM substrate concentration, the rates are 21, 5 and 0.1 mM/mg-min for
LBL-GOX-convective, Covalent-GOX-convective and LBL-GOX-soaking mode,
respectively. The residence time was around 0.6 s for all convective flow experiments.
Figure 6.6 illustrates that activity of electrostatically immobilized GOX under convective
flow of glucose solution is superior to both covalently immobilized GOX under
convective flow and electrostatically immobilized GOX under soaking mode. The
soaking mode results show that surface immobilization of GOX is negligible and reaction
rate is hindered by severe diffusional resistance.
Michaelis-Menten rate equation is again used to describe the immobilized phase
reaction kinetics for the substrate concentration range of 0.75 - 75 mM, and it has
revealed some interesting facts as explained here. Lineweaver-Burke plot is constructed
from the rate data and presented in Figure 6.7. It can be observed that Lineweaver-Burke
plots are non-linear for both LBL-GOX-convective and PVDF-GOX-convective. From
the non-linear nature of the plots, it can be speculated that Michaelis-Menten rate
equation is not effective in predicting the immobilized phase reaction kinetics accurately
in the substrate concentration range studied. In other words, for immobilized GOX, the
rate of glucose oxidation is not as sensitive to substrate concentration as expected from
Michaelis-Menten rate equation in the range of 0.75 - 75 mM (1/s = 1.33 - 0.013 mM-1)
glucose solution. This can also be observed by comparing Figures 6.3 and 6.6 for
homogeneous and immobilized phase, respectively. Homogeneous phase rate has
substantially higher effect of substrate concentration than immobilized phase.
In order to study the behavior of kinetics of immobilized GOX in different
regions of substrate concentration, Lineweaver-Burke plots are constructed for both LBL-
GOX-convective and PVDF-GOX-convective cases (shown as insert of Figure 6.7) in the
substrate concentration range of 15 - 75 mM (1/s = 0.067 - 0.013 mM-1). For both the
cases, the straight line plots fit the experimental data extremely well as evident from the
R2 values of > 0.99. vmax and Km values are determined from Lineweaver-Burke plots in
this concentration range. vmax for LBL-GOX-convective and PVDF-GOX-convective are
24 mM/mg-min and 22 mM/mg-min, respectively. Km of LBL-GOX-convective is 13
mM and Km of PVDF-GOX-convective is 4.6 mM.
143

0
0.02
0.04
0.06
0.08
0.1
0.12
0 0.2 0.4 0.6 0.8 1 1.2 1.4Substrate Concentration-1, mM-1
Rat
e-1, (
mM
/mg-
min
)-1
LBL-GOX Convective ModePVDF-GOX Convective Mode
y = 0.5429x + 0.0415R2 = 0.9917
y = 0.2057x + 0.0451R2 = 0.9977
0
0.02
0.04
0.06
0.08
0.1
0 0.01 0.02 0.03 0.04 0.05 0.06 0.07Substrate Concentration-1, mM-1
Rat
e-1, (
mM
/mg-
min
)-1
Figure 6.7 Lineweaver-Burke plot for GOX immobilized in functionalized LBL (LBL-
GOX-convective) and PVDF (PVDF-GOX-convective) membranes. Concentration of
glucose solution = 0.75 - 75 mM (1/s = 1.33 - 013 mM-1), amount of GOX immobilized =
1.5 and 1.8 mg for LBL and PVDF membranes, respectively, temperature = 25 0C, pH of
NaOAc-HCl buffer = 5.5. Inset figure shows Lineweaver-Burke plot for the substrate
concentration range of 15 - 75 mM (1/s = 0.067 - 0.013 mM-1)
144

This study suggests that Michaelis-Menten kinetics is valid for immobilized
phase GOX in the substrate concentration range of 15-75 mM. However, it fails to
explain the rate behavior at lower range. Km values obtained here are significantly lower
than most of the reported Km values for covalently immobilized GOX in Table 2.1. For
covalently immobilized GOX in PAA grafted PVDF membrane (Ying et al.) and soaking
mode oxidation of glucose, the value of Km is 10.5. This again demonstrates the
advantage of electrostatic immobilization and covalent flow over covalent
immobilization and diffusive flow for an enzyme-substrate system.
6.1.4 Effect of residence time, i.e., flow rate
Effect of residence time on activity and rate of production of H2O2 by
immobilized GOX in both LBL and PVDF membranes is described considering them as
Plug Flow reactor (PFR), i.e., assuming no concentration gradient in radial direction and
no mixing in axial direction. Material balance is done within membrane pore and
Michaelis-Menten reaction kinetics is incorporated to obtain a mathematical expression
for the exit concentration of H2O2 in permeate as follows.
( )0ln max
0
0 22
22=−
−− τv
sCs
kC OHPmOHP (6.4)
Then, conversion is calculated as follows.
0
22
sC
Conversion OHP= (6.5)
where, is the concentration of H22OHPC 2O2 in permeate, s0 is the initial substrate
concentration, and τ is the residence time. Km and vmax for immobilized GOX,
determined from the experimental rate values for the immobilized GOX in the substrate
concentration range of 15-75 mM, are used for calculations. Equation 6.4 is solved to
obtain model predicted concentration of H2O2 in permeate for different substrate
concentrations and residence times. From the model predicted concentration of H2O2 in
permeate, conversion and rate are determined using equations (6.5) and (6.3),
respectively. The results for 15 mM substrate concentration are represented in Figures 6.8
and 6.9 along with the experimentally obtained values.
145

0
0.5
1
1.5
2
2.5
3
0 5 10 15 20 25
Permeate Flow rate, cm3/min
Con
vers
ion,
%
0
4
8
12
16
20
Rate, m
M/m
g-min
LBL Expt . ConversionLBL Model ConversionLBL Expt . RateLBL Model Rate
LBL Expt . ConversionLBL Model ConversionLBL Expt . RateLBL Model Rate
Figure 6.8 Effect of flow rate, i.e. residence time, on conversion of glucose and rate of
formation of H2O2 for 15 mM glucose solution fed in LBL assembled nylon membrane.
Rate and conversions are calculated from equations (6.3) and (6.5). Model values are
calculated based on equation of PFR (equation 6.4). Amount of GOX immobilized = 1.5
mg, volume of LBL membrane reactor 0.122 cm3, pH = 5.5, temperature = 25 0C,
permeate flux = (75 - 265) x 10-4 cm3/cm2-s, residence time = 0.4 - 1.25 s
146

0
0.5
1
1.5
2
2.5
3
3.5
4
4.5
0 5 10 15 20Permeate Flow rate, cm3/min
C
Figure 6.9 Effect of flow rate, i.e. residence time, on conversion of glucose and rate of
formation of H2O2 for 15 mM glucose solution fed in functionalized PVDF membrane.
Rate and conversions are calculated from equations (6.3) and (6.5). Model values are
calculated based on equation of PFR (equation 6.4). Amount of GOX immobilized = 1.8
mg, volume of PVDF membrane reactor = 0.1 cm3, pH = 5.5, temperature = 25 0C,
permeate flux = (60 - 200) x 10-4 cm3/cm2-s, residence time varied from 0.4 - 1.25 s
onve
rs
0
4
8
12
16
20
Rate, m
M/m
g-min
PVDF Expt. Conversion
PVDF Expt. Rate PVDF Model Rate
PVDF Model Conversion
ion,
%
147

Conversion of glucose represents concentration of H2O2 in permeates. It can be
observed from the Figures 6.8 and 6.9 that as flow rate increases, i.e., residence time
decreases, the concentration of H2O2 in permeate decreases and hence the conversion.
This is because the product formation for a flow reactor is a function of residence time,
whereas, rate of product formation is not. That is elucidated by the model predicted
values in Figures 6.8 and 6.9. The experimentally obtained values of conversion and rate
of glucose oxidation match satisfactorily with the model predicted values at higher flow
rates. Discrepancy (over prediction) at lower flow rate is probably due to the resistance in
accessibility. Lower flow rate corresponds to lower shear stress, due to which glucose
molecules was not able to access all the active sites of immobilized GOX in the domain
of polyelectrolytes. As flow rate increases accessibility increases, and eventually after
certain flow rate all sites become accessible and reaction rate becomes independent of
flow rate. This constant reaction rate for a particular substrate concentration is used for
kinetic calculations discussed earlier. The results also demonstrate that the assumption of
PFR for both membrane configurations is reasonable and Michaelis-Menten kinetic
parameters determined in the higher range of glucose concentrations are acceptable.
6.1.5 Effect of pH
Effect of pH on activity of free GOX has been reported in literature (Chen and
Weng 1986; Ozyilmaz et al. 2005). It has been observed that there is a distinct maximum
for the activity of free GOX at pH 5.5, and activity decreases dramatically on either side
of that pH. For example, in a study by Ozyilmaz and co-workers, the normalized activity
(with respect to activity at pH 5.5) for 100 mM glucose solution was reported to be 35 %
at pH 4.5 and 50 % at pH 7. Our study for free GOX, covering a range of 0.75 -75 mM of
glucose concentration, also exhibited similar trend as shown in Figure 6.10. The effect of
pH on activity of LBL-GOX system is also represented in Figure 6.10. It can be observed
that although the activity curve goes through a maximum, the range of optimum pH is
broad, and the decrease in activity on either side of the optimum pH range is also less.
This proves that GOX immobilized in membrane can be operated over a wide range of
pH without sacrificing the activity significantly.
148

0.5
0.6
0.7
0.8
0.9
1
4 4.5 5 5.5 6 6.5 7 7.5
pH
HomogeneousLBL
ity
ctiv
d A
oa
eliz
rmN
Figure 6.10 Effect of pH on activity for both free GOX and immobilized GOX in LBL
assembled membrane. Activity is calculated based on concentration of H2O2 in permeate
and is normalized by dividing with maximum activity, i.e., (CPH2O2)/ (CPH2O2) max.
Amount of GOX immobilized = 1.5 mg, volume of LBL membrane reactor = 0.122 cm3,
permeate flux = 140 x 10-4 cc/cm2.s, residence time = 0.6 s, external membrane area =
13.2 cm2, membrane thickness = 165 µm, pH = 5.5, Temperature = 25 0C, concentration
of glucose fed = 0.75 - 75 mM
149

6.1.6 Stability
Figure 6.11 demonstrates the stability of the GOX, immobilized in LBL
assembled nylon membrane as well as PVDF-PAA-PAH membrane, as a function of time.
It can be observed from Figure 6.11 that after 28 days the activity of immobilized GOX
reduced to only 80 % of the initial activity, whereas, according to Ozyilmaz and co-
workers (Ozyilmaz et al. 2005), the activity reduced to 25 % after 28 days for free GOX.
In another study (Ahuja 2006) the activity was reported to reduce to 30 % after first 7
days. For both the literature studies and our work storage of GOX was carried out at 4 0C.
This shows that immobilized GOX within membrane matrix is well protected and retains
its activity over a longer period of time compare to free GOX.
6.1.7 Reusability of membrane matrix by detachment and reattachment of GOX
LBL-GOX membrane: A novel study was carried out on detachment and reattachment
of GOX from the polyelectrolyte matrix. After using the GOX immobilized LBL
membrane for several times, the GOX was detached from the membrane matrix by
lowering the pH. Amount of detached GOX was 90 ± 3 % of the immobilized GOX. It
can be hypothesized that the undetached GOX molecules are either situated in such
domains of polyelectrolyte layers that they are inaccessible or they are too strongly bound
to detach by changing pH alone. The detached GOX was unaffected by the drastic change
in pH environment and showed 90 % activity of the fresh GOX in free form as revealed
by the homogeneous phase experiments. After the homogeneous phase activity studies,
the remaining detached GOX was reattached in the same LBL membrane matrix
electrostatically. Activity of the reattached GOX was 90 ± 5 % of the activity prior to the
detachment. Same steps of detachment and reattachment were repeated and similar
results were obtained. After that, GOX was detached and fresh GOX was attached in the
same membrane matrix. The attachment was identical as obtained for the newly made 7-
layers LBL membrane. The activity of the immobilized fresh GOX was around 90 % of
the activity obtained for fresh GOX in newly made 7-layers LBL membrane. This proves
the reusability of the LBL membrane matrix for GOX immobilization.
150

0
0.2
0.4
0.6
0.8
1
1 6 11 16 21 26 31
Time, days
Nor
mal
ized
act
ivity
Immobilized GOX
Free GOX (Ozyilmaz et al. 2005)
Free GOX (Ahuja et al. 2006)
Figure 6.11 Stability of GOX immobilized in LBL assembled nylon membrane as well as
PVDF-PAA-PAH membrane based on the change in activity over a period of time. The
stability is compared with that reported (Ahuja 2006; Ozyilmaz et al. 2005) for free GOX.
Activity is calculated based on concentration of H2O2 and is normalized by dividing with
the activity on first day of immobilization at pH = 5.5
151

The immobilization as well as the activity is reproducible after several
experiments and pH treatments. Although the current study deals with GOX only, it can
potentially be extended for other enzymes as well.
PVDF-GOX membrane: Detachment of GOX, in this case, was different than the GOX-
LBL membrane. Since, carboxylic acid groups of PAA have a pKa of 4.7, at pH 4 the
whole PAH-GOX domain dislocates from PVDF-PAA domain. Therefore, each time
fresh PAH and GOX were attached in the PVDF-PAA membrane. The amount and
activity of fresh GOX attached in the same PVDF-PAA membrane matrix were highly
reproducible as observed by multiple studies. This proves that the functionality within the
membrane is very consistent and there is no leakage of the components.
6.2 Conclusions
Activity of electrostatically immobilized GOX in two different kinds of charged
functionalized membrane domain was studied using glucose as a substrate. In one case,
membrane domain was created by electrostatic attachments of polyelectrolytes using
LBL technique, and in the other by in-situ polymerization of acrylic acid. Study of
homogeneous phase reaction kinetics of free GOX was carried out. Comparative kinetics
studies have been presented between free, electrostatically immobilized and covalently
immobilized GOX, as well as between convective and soaking mode of glucose solution.
Electrostatic immobilization and convective mode were observed to be beneficial than
others. Effect of flow rate and pH on activity of GOX was also studied. It was observed
that higher flow rate of reaction mixture through the membrane utilizes maximum active
sites of the enzyme. It was also demonstrated that GOX immobilized in functionalized
membrane has a wide range of operating pH and associated with higher stability compare
to free GOX. The potential of reusability of the membrane matrices was one of the most
important findings in this research. The reusability of the membrane matrices has been
explored with extensive study of the detachment and reattachment of GOX from
membrane matrix, along with the activity measurements.
Copyright © Saurav Datta 2007
152

Chapter 7 Oxidative Dechlorination of Trichlorophenol (TCP) by Functionalized
2-Stack Membranes Containing Electrostatically Immobilized GOX and Fe+2
A practical application of enzymatic production of H2O2 from glucose, by
electrostatically immobilized glucose oxidase (GOX), in functionalized membrane is
demonstrated in this chapter. For the first time an attempt has been made to use a 2-stack
functionalized membranes system for simultaneous enzymatic production of hydrogen
peroxide in first membrane, and oxidative dechlorination of TCP in the second membrane
by Fenton reaction.
7.1 Introduction and background studies
In Chapter 6, it was observed that constant production of H2O2 can be achieved by
GOX based catalytic oxidation of glucose in membranes. It is also well known that H2O2
and ferrous iron (Fe+2) react to form very reactive hydroxyl radicals (OH·), which has the
capability of oxidizing organic molecules (Pignatello et al. 2006). This chapter describes
the research study, which combines these two techniques using a unique system of two
functionalized membranes, and implements it for the destruction of a chlorinated organic
molecule. Two membranes were used so that the immobilized GOX remains separated
from the highly reactive hydroxyl radicals. 2, 4, 6-trichlorophenol (TCP) was chosen as
the model chloro-compound and PVDF membranes were used for functionalization.
Chlorinated organics are widely used as pesticides, disinfectant, coolant and
preservative of woods, and one of the major components of ground water and soil
contaminants. Destruction of these compounds is carried out by either reductive or
oxidative dechlorination pathways. Reductive dechlorination of different chlorinated
organics has been reported in the literature (Ahuja et al. 2004; Schrick et al. 2002; Xu et
al. 2005) and out of scope of this study. Fenton reaction is a popular technique for the
destruction of chlorinated compounds by oxidative dechlorination (Huston and Pignatello
1999; Li et al. 2005; Pignatello et al. 2006). An enormous number of rate constants for
this free radical based reaction has been reported (Ahuja 2006; Buxton et al. 1988).
153

Fenton (Fenton 1894) was the first researcher to observe the oxidation of tartaric
acid by Fe+2 and H2O2. However, the mechanism and the role of hydroxyl radical was
discovered and reported first by Haber and Weiss (Haber and Weiss 1934). The role of
additional reactions in determining the fate of free radicals has also been demonstrated
(Barb et al. 1949; Barb et al. 1951a, b). For the convenience of understanding, all of the
above mentioned reactions are discussed later in experimental section of this chapter. A
comprehensive review of the mechanism, important parameters, kinetics and applications
of Fenton reaction is available in literature (Pignatello et al. 2006). Although the history
of Fenton reaction goes back to 1900, it attracted the attention of academic researchers
only around 1990. After that Fenton reaction has been used for the treatment of
chlorophenols (Ahuja 2006; De et al. 2006; Watts et al. 1990), trichloroethylene (Xu and
Bhattacharyya 2007), polychlorinated bi-phenyls (Aronstine and Rice 1995) and
nitroaromatic explosives (Liou and Lu 2007).
Dechlorination of chlorophenols and polychlorinated biphenyls have been
extensively studied by our research group. Ahuja and co-workers (Ahuja et al. 2007)
have studied the enzymatic production of H2O2 and gluconic acid by immobilized GOX
in functionalized beads. Then the produced gluconic acid and H2O2 was used for
homogeneous phase dechlorination of TCP by adding Fe+2 extraneously. Effect of
gluconate anion as chelate was also studied. Li and co-workers (Li et al. 2007) have
studied soaking mode dechlorination of 2, 2’-dichlorobiphenyl (DCB) by Fe+2
immobilized in a PAA functionalized PVDF membrane, and adding commercially
available H2O2 extraneously. However, simultaneous production of H2O2 and
dechlorination of the chlorinated organics in a solid matrix have never been studied.
7.2 Experimental and analytical procedures
7.2.1 Equipment and materials
Experiments were carried out in a stainless steel membrane cell from Osmonics.
The effective external surface area of the membranes in this cell was 13.2 cm2.
Hydrophobic PVDF membrane (pore diameter 0.45 µm, thickness 125 µm, porosity 75 %
as supplied by manufacturer) were purchased from Millipore Corporation. The enzyme,
154

glucose oxidase, from Aspergillus Niger (GOX, Product No. G0543, MWt. 160000) and
β-D (+) glucose (Product No. G5250, MWt. 180) were purchased from Sigma. 15 %
solution of titanium oxysulfate in dilute H2SO4 (Product No. 495379), benzoyl peroxide
(Product No. 179981), trimethylolpropane triacrylate (TMPTA, Product No. 246808),
anhydrous toluene (Product No. 244511), acrylic acid (Product No. 147230, MWt. 72)
and 2, 4, 6-trichlorophenol (TCP, Product No. 139481000, MWt. 197.5) were purchased
from Aldrich. Tribromophenol (TBP, Product No. CUS-6624) was purchased from Ultra
Scientific. The reagents for Bradford assay were purchased from Bio-Rad Laboratories.
Unless mentioned otherwise, rest of the chemicals, including the de-ionized ultra filtered
water (DIUF), were purchased from Fisher Scientific.
7.2.2 Analytical procedures
All spectrophotometric measurements in the UV and visible range were done by
UV-VIS Spectrophotometer (Varian, Cary 300). Analysis of GOX, polyallylamine
hydrochloride (PAH) and H2O2 were carried out using Bradford Protein Assay, Total
Organic Carbon (TOC) analysis and a method reported by Clapp et al. (Clapp et al. 1989),
respectively. These analytical procedures are already mentioned in Chapter 3. TCP, Fe,
Na and Cl- analyses were conducted as mentioned below.
Analysis of Na and Fe: Na and Fe analyses were done by Atomic Absorption
Spectrometer (Varian 220 Fast Sequential). The measurements were performed at 372 nm
wavelength for Fe and at 330.2 nm wave length for Na. The linear range of calibration
curve was 1-100 ppm for both of them, with 3-6 % analytical error for Fe and 3-10 %
analytical error for Na.
Analysis of TCP: A HPLC (Agilent 1100 Series) method was developed to analyze TCP
in an aqueous solution also containing glucose, gluconic acid, H2O2 and sodium acetate-
acetic acid. A 25:25:1 mixture of methanol, water and acetic acid was used as the mobile
phase. TBP was used as internal standard for all the analyses by HPLC. The column used
155

was purchased from Supelco (LC-8). The retention time for TCP was around 5 min and
that for TBP was 6.6 min.
Analysis of Cl-: Free Cl- present in permeate after dechlorination reaction was analyzed
using Orion 9617 Combination Cl- electrode along with an Ion Meter from Fisher
Scientific (AR 25). The range of calibration curve for Cl- analysis was 1-10 ppm and
analytical error was 3-10 %.
7.2.3 Electrostatic immobilization of GOX in functionalized PVDF membrane
Hydrophobic PVDF membranes were functionalized with polyacrylic acid (PAA),
followed by PAH, and then, GOX was electrostatically immobilized in functionalized
PVDF membranes as described in Chapter 3. The activity of immobilized GOX was
studied using 1 mM glucose solution in sodium acetate-acetic acid (NaOAc-AcOH)
buffer of pH 5.5. This GOX immobilized membrane was used as the first membrane in
the 2-stack membranes system for dechlorination of TCP.
7.2.4 Immobilization of Fe+2 in functionalized PVDF membrane by ion exchange
Fe+2 immobilization within PAA-functionalized PVDF membrane was carried out
by ion exchange with Na+. Na+ was present in the system as counter-ion of carboxylic
acid group of PAA. This step was very delicate and needed extra precautions. Fe+2 is
susceptible to oxidation to Fe+3 by any O2 present in the solution, and Fe+3 precipitates at
any pH ≥ 5. Hence, the ion exchange step was carried out with de-oxygenated water.
DIUF water was de-oxygenated by purging N2 gas. Fe+2 also has a tendency to precipitate
at any pH ≥ 6 and pKa of carboxylate group of PAA is 4.7. So, the ion exchange step was
carried out in a very narrow range of operating pH of 5-5.5 for all the experiments. 100
ml of 750 ppm FeCl2.4H2O (MWt. 199) was permeated to immobilize Fe+2. Prior to and
after the ion exchange step, membrane matrix was washed with a copious amount of
deoxygenated water. Since, Fe+2 is prone to oxidation in exposure to air, the Fe+2
immobilized membranes were used immediately after functionalization.
156

7.2.5 Experimental procedure for dechlorination of TCP
In order to carry out Fenton reaction, a reaction mixture containing TCP and
glucose was prepared in O2 saturated NaOAc-AcOH buffer of pH 5.5, and permeated
under N2 atmosphere. Two different concentrations of TCP, 15 ppm (0.07 mM) and 30
ppm (0.14 mM) were studied. Glucose concentration was deliberately kept at a lower
value of 1 mM to avoid any potential complexity that might arise from the un-reacted
glucose molecules. The flow rate was kept constant through out the reaction. Permeate of
the first membrane containing TCP, H2O2, gluconic acid, un-reacted glucose and O2 then
enters second membrane.
This reaction is critical in the existing system in terms of presence of oxygen. For
maximum H2O2 production O2 saturation is required, whereas, for maximum
dechlorination efficiency, absence of O2 is necessary as it converts Fe+2 to Fe+3. From
material balance calculation it was confirmed that the amount of Fe+2 immobilized in the
membrane was such that even if the un-reacted O2 converts Fe+2 to Fe+3, the excess Fe+2
would be sufficient to generate hydroxyl radicals and carry out dechlorination. During
dechlorination experiments, samples were taken at regular intervals. After dechlorination
reaction, the system was washed with DIUF. Then the samples were analyzed for TCP,
Cl- and H2O2. The activity of GOX in first membrane was checked after dechlorination.
7.3 Results and discussions
In order to check the reproducibility of the results, all experiments were
triplicated. The error bars shown in different figures represent standard deviations.
7.3.1 Electrostatically immobilized GOX in functionalized PVDF membrane
Amount of GOX immobilized electrostatically on the functionalized PVDF
membranes was 1 ± 0.1 mg (1.12 x 10⁻⁵ mmole). Concentration of H2O2 produced by
oxidation of 1 mM glucose (pH 5.5) using the GOX immobilized membrane was around
0.1 mM. These membranes were then used as the first membrane in the 2-stack
membranes system for different dechlorination experiments.
157

7.3.2 Fe+2 in functionalized PVDF membrane
The amount of Fe+2 immobilized into the membranes was 5 ± 0.5 mg (around
0.09 mmole), which corresponds to a positive charge of 0.18 mmole. Fe+2 was
immobilized by ion exchange with Na+ present in PAA-functionalized PVDF membrane
in Na-form. To maintain the electro neutrality, 2 moles of Na+ should be released from
the matrix for each mole of Fe+2 immobilized. From the AA analysis of different
solutions it was determined that amount of Fe immobilized was 0.09 mole (5 mg), and
the amount of Na released was 0.21 mmole (5 mg), which corresponds to a reasonable Fe
to Na ratio of 1:2.3. The Fe+2 immobilized membranes were then used as the second
membrane in the 2-stack membranes system for different dechlorination experiments.
7.3.3 Dechlorination of TCP
Dechlorination of TCP was carried out in a 2-stack membranes system containing
GOX-PVDF membrane prior to Fe+2-PVDF membrane as shown in Figure 7.1. The idea
was to produce H2O2 in the first membrane by enzymatic oxidation of glucose in presence
of GOX. TCP remains inert in this membrane. In the second membrane, H2O2 reacts with
immobilized Fe+2 to generate hydroxyl radical (OH.). These hydroxyl radicals then
participate in Fenton reaction with TCP and dissociate it. The participating reactions are
given below.
⋅++→+ −++ OHOHFeOHFe 322
2 (7.1) −⋅ +⎯⎯→⎯→⋅+ ClPIOHTCP OH (7.2)
where, I is the intermediate compounds formed and P is the oxidized product of TCP.
Other than these two, number of side reactions takes place during oxidative
dechlorination of TCP. A detail description of those is beyond the scope of this study.
However, the relevant ones are mentioned below.
⋅+→⋅+ 2222 HOOHOHOH (7.3)
22OHOHOH →⋅+⋅ (7.4) −++ +→+⋅ OHFeFeOH 32 (7.5)
158

- ---- -- ---
Figure 7.1 Schematic of formation of 2-stack functionalized membranes system for
oxidative dechlorination of TCP by Fenton reaction. Membrane 1 and 2 were
functionalized with electrostatically immobilized GOX and Fe+2, respectively
+ Glucose + O2 + TCP
H2O2 + TCP
Dechlorinated Product + Cl-
+++++ +++
++
- -- - -- - ---
+++++
+++++
+++++
++++
+
---- - -
----
--
-- - ---
- ----
--- - ---
Membrane 1 (PVDF-PAH-GOX)
- ---- -- ---++ ++
++
++
++++
Membrane 2 (PVDF-Fe+2)
+ PAH + GOX + Fe+2
Pure PVDF Membrane
PVDF-PAA mbraneMe
2-Stack membranessystem
Core Leakage
Core Leakage
+ Acrylic Acid (In-situ polymerization)
- - ----- -
-- ++
+++++
Fe+2
PAA PAH
GOX
- ---- -- ---- ----- ---- -- --- -- ---
+ Glucose + O2 + TCP
H2O2 + TCP
Dechlorinated Product + Cl-
+++++
+++++ +++
+++++++
- -- -- - -- - -- - -- --- ---
+++++
+++++
+++++
+++++
+++++
+++++
++++
+++++
+
---- - ----- - -
----
------
--
-- - --- -- - ---
- ----
-- -
---
--- - --- -- - ---
Membrane 1 (PVDF-PAH-GOX)
- ----- ---- -- --- -- ---++ ++
++
++
++++
Membrane 2 (PVDF-Fe+2)
+ PAH + GOX + Fe+2+ PAH + GOX + Fe+2
Pure PVDF Membrane
PVDF-PAA mbraneMe
2-Stack membranessystem
Core Leakage
Core Leakage
+ Acrylic Acid (In-situ polymerization)
- - ----- -
-- ++
+++++
Fe+2
PAA PAH
GOX
- - ---- - ----- -
---- -
-- ++
+++++
+++++
Fe+2
PAA PAH
GOX
159

The above mentioned side reactions hinder the dechlorination of TCP by
consuming both OH. radical and Fe+2.
Concentration of TCP in different solutions was analyzed by reverse phase HPLC.
The analyses reveal destruction of TCP inside the 2-stack functionalized membrane
system. Blank experiments have been conducted, with 2-stack functionalized PVDF
membranes without GOX, to take care of the adsorption of TCP in the system.
Dechlorination of TCP results are summarized in Figures 7.2-7.4 for 15 and 30 ppm TCP.
Figure 7.2 represents typical breakthrough curves of both H2O2 and TCP for 15 ppm
(0.07 mM) TCP in feed. Untill around 15 min, the amount of H2O2 formed in the first
membrane was totally consumed in the second membrane. Then, the concentration of
H2O2 in permeate gradually increased and a breakthrough is observed. On the other hand,
for TCP, the breakthrough is observed at around 5 min. This illustrates the involvement
of H2O2 in other side reactions, such as Equation (7.3).
Figure 7.3 demonstrates conversion of TCP as a function of cumulative amount of
TCP permeated through the system for 15 ppm (0.07 mM) and 30 ppm (0.14 mM) TCP.
It can be observed from the figure that simultaneous enzymatic production of H2O2 and
production of hydroxyl radicals by Fe+2 in a 2-stack membranes system is efficient in
dechlorination of TCP. Initially, up to 98 % and 85 % conversion of TCP was obtained
for 15 ppm and 30 ppm TCP in feed, respectively. However, with time, conversion
decreases because of other competitive side reactions, such as Equations (7.1-7.3), which
consume the reactants. It is also important to emphasize here that the production of H2O2
from the first membrane is under steady state and the concentration of TCP in the
permeate of first membrane is constant (the feed concentration of TCP). Hence, if the
amount of Fe+2 immobilized in the second membrane is in large excess, then ideally
conversion of TCP should remain constant. This indicates that further studies are
necessary with higher amount of immobilized Fe+2 into the membrane to demonstrate the
constancy in the conversion. The overall conversion of TCP obtained in this study was 78
% and 70 % for 15 ppm and 30 ppm TCP, respectively. The obtained conversion was
significantly higher than the reported value of 40 % conversion for 2, 2’-polychlorinated
biphenyl by PVDF-PAA membrane in soaking mode (Li et al. 2007).
160

0
0.05
0.1
0.15
0.2
0.25
0.3
0.35
0 5 10 15 20 25 30 35
Time, min
[H2O
2]P/
[H2O
2]ss
0
0.05
0.1
0.15
0.2
0.25
0.3
0.35
0 5 10 15 20 25 30
Time, min
[TC
P]P /
[TC
P]F
0
0.05
0.1
0.15
0.2
0.25
0.3
0.35
0 5 10 15 20 25 30 35
Time, min
[H2O
2]P/
[H2O
2]ss
0
0.05
0.1
0.15
0.2
0.25
0.3
0.35
0 5 10 15 20 25 30
Time, min
[TC
P]P /
[TC
P]F
Figure 7.2 Breakthrough curve for H2O2 in the permeate of 2-stack functionalized-PVDF
membranes system used for dechlorination of TCP. Y-axis represents the ratio of
concentration of H2O2 in permeate at time t ([H2O2]P) to the concentration of H2O2
produced in first membrane under steady state condition ([H2O2]ss). Inset figure
represents the breakthrough curve of TCP for the same experiment. Y-axis of inset figure
represents the ratio of concentration of TCP in permeate ([TCP]P) at time t to the
concentration of TCP in feed ([TCP]F). [H2O2]ss = 0.1 mM, [TCP]F = 0.07 mM (15 ppm),
Fe loading = 0.09 mmole, residence time in the first membrane = 2.7 s, residence time in
the second membrane = 2 s
161

0
0.2
0.4
0.6
0.8
1
0 0.001 0.002 0.003 0.004 0.005 0.006 0.007 0.008
Cumulative amount of TCP permeated, mmole
C
TCP conversion for 15 ppm TCP in feed
TCP conversion for 30 ppm TCP in feed
Figure 7.3 The conversion of TCP during the dechlorination reaction as a function of
cumulative amount of TCP permeated. Conversion of TCP is the ratio of cumulative
amount of TCP dechlorinated at any time to cumulative amount of TCP permeated at that
time. Steady state concentration of H2O2 from the first membrane is around 0.1 mM, Fe
loading = 0.09 mmole, residence time in the first membrane = 2.7 s, residence time in the
second membrane = 2 s
onve
rson
of
P T
Ci
162

y = 2.013xR2 = 0.9974
y = 2.4313xR2 = 0.9989
0
0.002
0.004
0.006
0.008
0.01
0.012
0.014
0.016
0 0.0005 0.001 0.0015 0.002 0.0025 0.003 0.0035 0.004 0.0045 0.005
Cumulative amount of TCP Converted, mmole
Cum
ulat
ive
Am
ount
of C
l- For
med
, mm
ole
15 ppm TCP in Feed
30 ppm TCP in Feed
Maximum Chloride formed toTCP converted (3:1)
Figure 7.4 Total amount of Cl- formed as a function of total amount of TCP converted
during the dechlorination reaction. The dotted line is constructed by considering 1 mole
of TCP conversion corresponds to maximum of 3 mole of chloride formation. Slope of
the solid lines represent experimentally obtained ratio of chloride formed to TCP
converted. Steady state concentration of H2O2 from the first membrane is around 0.1 mM,
Fe loading = 0.09 mmole, residence time in the first membrane = 2.7 s, residence time in
the second membrane = 2 s
163

Figure 7.4 represents cumulative amount of Cl- formed as a function of
cumulative amount of TCP converted. For both cases, amount of Cl- increases with time,
because oxidation of TCP ruptures its aromatic ring and liberates free Cl-. If complete
dechlorination takes place then 1 mole of TCP consumption liberates a maximum of 3
moles of Cl-. It can be observed that the ratio of consumption of TCP to formation of free
Cl- was 2.1 and 2.4 for 15 ppm and 30 ppm TCP in feed, respectively. This again
demonstrates satisfactory efficiency of the system to dechlorinate TCP.
After dechlorination experiments, the activity study of GOX in first membrane
showed only 3-8 % reduction in activity. This has allowed reusing the membrane for
further dechlorination experiments. After several cycles, when the activity of GOX was
reduced to less than 60 %, the GOX was detached and fresh GOX was attached as
described in Chapter 3. The Fe-immobilized membrane could also be reused by
dislodging Fe+3 with concentrated nitric acid and reattaching Fe+2. However, for this
research work, the Fe-immobilized membranes were not reused.
7.4 Conclusions
Implementation of a 2-stack functionalized PVDF membranes system for
simultaneous enzymatic production of hydrogen peroxide in first membrane and
oxidative dechlorination of TCP in the second membrane by Fenton reaction has been
successful as evident from the results. The initial dechlorination was 98 % and 85 % for
two different concentrations of TCP, with an overall dechlorination of 70-80 %. The ratio
of Cl- produced to TCP dechlorinated is more than 2, which re-confirms the efficacy of
the technique for oxidative dechlorination. Different process parameters, such as,
concentration of glucose in feed, amount of Fe+2 and GOX immobilized, need to be tuned
to find the optimum operating conditions. If utilized properly this system has the
capability of sustaining constant conversion of TCP under continuous mode, which could
be very promising for industrial purposes. This technique also provides additional benefit
of reusing the same membrane matrices by reattaching fresh GOX and Fe+2.
Copyright © Saurav Datta 2007
164

Chapter 8 Conclusions
The research work discussed in this dissertation was directed towards extensive
experimental and theoretical studies of development of functionalized polymeric
membranes, critical analysis of interaction between membrane and/or biomolecules, and
applications of functionalized membranes for bioseparation and biocatalysis. This chapter
summarizes the important findings of the research work.
8.1 Overall scientific and technological advancements
The overall scientific and technological advancements achieved in this research
study were,
Better understanding of the fundamental aspects related to the accessibility of
covalently immobilized biomolecules, and the fouling in the membrane structure
due to permeation of biomolecules, with proper quantification.
Isolation of pure monomeric high value protein, with enhanced recovery and
lower processing time, using affinity membrane separation.
Development of high capacity, highly active, stable and reusable enzyme-
substrate system based on electrostatic immobilization.
Development and implementation of a 2-stack functionalized membranes system
for simultaneous enzymatic production of hydrogen peroxide in first membrane
and oxidative dechlorination of a chloro-organic in the second membrane by
Fenton reaction.
165

8.2 Specific accomplishments
The specific accomplishments for functionalized membrane based bioseparation
and biocatalysis research work were as follows.
8.2.1 Functionalized membranes for affinity based bioseparation
Quantification of the accessibility of covalently immobilized avidin sites by biotin
moieties present in different probe molecules. Maximum achievable accessibility
of covalently immobilized avidin sites in activated nylon membrane was
determined to be 50 % of the accessibility obtained in homogeneous phase.
Pure monomeric HIV-Tat protein was isolated from a complex fermentation broth
(bacterial lysate, BL) using an efficient affinity separation technique based on
avidin-biotin interaction in functionalized stacked microfiltration membranes. The
membrane purified Tat was superior in quality than conventional column
chromatographically purified Tat as demonstrated by different analytical tools,
such as, SDS-PAGE, Western Blot and biotin analyses.
A prefiltration step was effective in enhancing the normalized accessibility of
immobilized avidin sites from 20-35 % for unfiltered cases to 50-70 % for pre-
filtered cases. It was also able to reduce the fouling of membrane structure from
80 % for unfiltered cases to 10-50 % for pre-filtered cases. The processing time
per unit amount of purified Tat isolated was also reduced by 5 times for pre-
filtered affinity separation.
Decrease in permeate flux due to the fouling was mathematically described
considering adsorption of protein molecules both inside the pores and on the
surface of the membranes for unfiltered BL feed. On the other hand, for pre-
filtered BL feed, assumption of protein adsorption only on the pores of the
membrane was sufficient to describe the fouling.
166

8.2.2 Functionalized membranes for biocatalysis
Development of functionalized membrane domain by Layer-By-Layer (LBL)
assembly of polyelectrolytes and by in-situ polymerization of acrylic acid for
electrostatic immobilization of Glucose Oxidase (GOX) enzyme.
Electrostatic immobilization of GOX in functionalized membranes was associated
with high capacity (1.5-1.8 mg), activity and stability (20 % reduction in activity
after 1 month). The optimum working range of pH for electrostatically
immobilized GOX was observed to be broader than free GOX.
The functionalized membranes developed for GOX immobilization, possess the
advantage of regeneration. The attached GOX was successfully detached from the
membrane matrix, the activity of detached GOX was examined, and then it was
reattached in the same matrix. During this process about 90 % retention of the
activity of GOX was observed. Fresh GOX was also attached in the same
membrane matrix.
A 2-stack PAA-functionalized PVDF membranes system was used for
simultaneous enzymatic production of hydrogen peroxide in first membrane by
electrostatically immobilized GOX, and oxidative dechlorination of 2, 4, 6-
trichlorophenol (TCP) in the second membrane by Fenton reaction using
electrostatically immobilized Fe+2. The overall conversion of TCP was 70-80 %
and the ratio of Cl- formed to TCP converted was 2-2.4 out of a maximum
achievable ratio of 3.
Copyright © Saurav Datta 2007
167

Nomenclature
A0 Area of avidin immobilized membrane pore at t = 0, cm2
Am External surface area of membrane, cm2
Cf Concentration of biotin in feed, µmole/ml
CP Concentration of biotin in permeate, µmole/ml
CPH2O2 Concentration of H2O2 in permeate, mM
Jv Permeate flux at any time t, cm3/cm2-s
Jv0 Initial permeate flux through avidin immobilized membrane, cm3/cm2-s
Jw Permeate flux of pure water, cm3/cm2-s
Km Michaelis-Menten kinetic constant, mM
KS Rate constant of surface protein adsorption, min-1
KT Rate constant of total protein adsorption, min-1
l Thickness of Immunodyne membrane, cm
L Thickness of 4-stack Immunodyne membranes = 4l, cm
MS Mass of protein adsorbed on the external surface of the membrane at t, µg
MS* Final amount of protein adsorbed on the external surface of the membrane at t, µg
MT Mass of total protein adsorbed on the membrane (surface + pore) at t, µg
MT* Final amount of total protein adsorbed on the membrane (surface + pore), µg
NP Total number of membrane pores
Qw0 Volumetric flow rate of water through bare membrane, cm3/s
Qw Volumetric flow rate of water through fouled membrane, cm3/s
r Radius of membrane pore at time t, cm
168

r0 Radius of avidin immobilized membrane pore at t = 0, cm
ravidin Radius of avidin immobilized membrane pore, cm
rP Radius of fouled membrane pore, cm
Rm Intrinsic membrane resistance, cm-1
RP Resistance of protein layer in membrane, cm-1
s Substrate concentration, mM
s0 Initial substrate concentration, mM
v Rate of glucose oxidation by GOX, mmole/mg-min or mM/mg-min
vmax Maximum rate in Michaelis-Menten kinetics, mmole/mg-min or mM/mg-min
V Cumulative permeate volume, cm3
X Volume of total protein adsorbed per unit volume of permeate
Greek letters
ε membrane porosity
δavidin Effective thickness of covalently immobilized avidin layer, nm
δavidin Calculated thickness of n-th layer of polyelectrolytes in LBL membrane, nm
δP Effective thickness of adsorbed protein layer, nm
δT Effective thickness of total protein layer = δavidin + δP , nm
ρ mass of protein adsorbed in pores per unit volume of adsorbed layer, µg/cm3
∆P Transmembrane pressure drop, bar
τ’ Tortuosity of membrane
µ viscosity of water (gm cm-1 s-1)
τ residence time (s)
169

Material Abbreviations
PVDF Polyvinylidene Fluoride
LBL Layer-By-Layer
GOX Glucose Oxidase
TCP 2, 4, 6-trichlorophenol
HIV Human Immunodeficiency Virus
TAT Trans-Activator of Transcription
BL Bacterial Lysate
PABA para-amino benzoic acid
BABA Biotin-4-amidobenzoic acid
HABA 2-4'-hydroxyazobenzene benzoic acid
BSA Bovine Serum Albumin
GG Gamma Globulin
BBSA Biotinylated Bovine Serum Albumin
RC Regenerated Cellulose
CDI 1, 1'-carbonyldiimidazole
ECH Epichlorohydrin
CA Cellulose Acetate
BDDE 1, 4-butanediol diglycidol ether
PES Polyether sulfone
PLL Poly-L-Lysine
PAH Poly-allylamine hydrochloride
170

PSS Poly-sodium, 4-styrene sulfonate
TMPTA Trimethylolpropane triacrylate
PAA Poly-acrylic acid
TBP 2, 4, 6-tribromophenol
DIUF De-Ionized Ultrafiltered Water
RNA Ribonucleic acid
TAR Trans-Activating Responsive
DTT Dithiothreitol
PMSF Phenylmethyl sulfonyl fluoride
WB 1 Wash Buffer 1
WB 2 Wash Buffer 2
CB Cleavage Buffer
CC Column Chromatography
P Permeate
R Retentate
F Feed
E Tat eluate
UNF BL Unfiltered bacterial lysate
UF BL Ultrafiltered bacterial lysate
MF BL Microfiltered bacterial lysate
171

Method and Technique Abbreviations
RO Reverse Osmosis
PV Pervaporation
NF Nanofiltration
UF Ultrafiltration
MF Microfiltration
ED Electrodialysis
PI Isoelectric Point
HPLC High Performance Liquid Chromatography
MWCO Molecular Weight Cut-Off
IMAC Immobilized Metal Affinity Chromatography
SEM Scanning Electron Microscopy
EDX Energy Dispersive X-Ray
FTIR Fourier Transform Infrared
ELISA Enzyme Linked Immuno Sorbent Assay
SDS-PAGE Sodium Dodecyl Sulfate-Poly Acrylamide Gel Electrophoresis
TOC Total Organic Carbon
172

References
Abu-Amer, Y., Dowdy, S.F., Ross, F.P., Clohisy, J.C., Teitelbaum, S.L., 2001. TAT
fusion proteins containing tyrosine 42-deleted IkappaBalpha arrest osteoclastogenesis.
The Journal of biological chemistry 276(32), 30499-30503.
Ahuja, D.K., 2006. Degradation of toxic chloroethylenes and chloroaromatics by vitamin
B12-based reductive dechlorination and by hydroxyl radical-based oxidative
dechlorination reactions. Chemical and Materials Engineering. University of Kentucky,
Lexington.
Ahuja, D.K., Bachas, L.G., Bhattacharyya, D., 2007. Modified Fenton reaction for
trichlorophenol dechlorination by enzymatically generated H2O2 and gluconic acid
chelate. Chemosphere 66(11), 2193-2200.
Ahuja, D.K., Gavalas, V.G., Bachas, L.G., Bhattacharyya, D., 2004. Aqueous-Phase
Dechlorination of Toxic Chloroethylenes by Vitamin B12 Cobalt Center: Conventional
and Polypyrrole Film-Based Electrochemical Studies. Industrial & Engineering
Chemistry Research 43(4), 1049-1055.
Amounas, M., Innocent, C., Cosnier, S., Seta, P., 2000. A membrane based reactor with
an enzyme immobilized by an avidin-biotin molecular recognition in a polymer matrix.
Journal of Membrane Science 176(2), 169-176.
Ariga, K., Hill, J.P., Ji, Q., 2007. Layer-by-layer assembly as a versatile bottom-up
nanofabrication technique for exploratory research and realistic application. Phys. Chem.
Chem. Phys. 9(19), 2319-2340.
173

Aronstine, B.N., Rice, L.E., 1995. Biological and integrated chemical-biological
treatment of PCB congeners in soil/sediment-containing systems. Journal of Chemical
Technology & Biotechnology 63(4), 321-328.
Avramescu, M.-E., Girones, M., Borneman, Z., Wessling, M., 2003. Preparation of
mixed matrix adsorber membranes for protein recovery. J. Membr. Sci. 218(1-2), 219-
233.
Bao, J., Furumoto, K., Yoshimoto, M., Fukunaga, K., Nakao, K., 2003. Competitive
inhibition by hydrogen peroxide produced in glucose oxidation catalyzed by glucose
oxidase. Biochemical Engineering Journal 13(1), 69-72.
Barb, W.G., Baxendale, J.H., George, P., Hargrave, K.R., 1949. Reactions of ferrous and
ferric ions with hydrogen peroxide. Nature (London, U. K.) 163, 692-694.
Barb, W.G., Baxendale, J.H., George, P., Hargrave, K.R., 1951a. Reactions of ferrous
and ferric ions with hydrogen peroxide. I. Ferrous-ion reaction. Transactions of the
Faraday Society 47, 462-500.
Barb, W.G., Baxendale, J.H., George, P., Hargrave, K.R., 1951b. Reactions of ferrous
and ferric ions with hydrogen peroxide. II. Ferric-ion reaction. Transactions of the
Faraday Society 47, 591-616.
Barth, H.G., Jackson, C., Boyes, B.E., 1994. Size Exclusion Chromatography. Analytical
Chemistry 66(12), 595R-620R.
Bayer, P., Kraft, M., Ejchart, A., Westendorp, M., Frank, R., Roesch, P., 1995. Structural
studies of HIV-1 Tat protein. Journal of Molecular Biology 247(4), 529-535.
174

Bhardwaj, A., Lee, J., Glauner, K., Ganapathi, S., Bhattacharyya, D., Butterfield, D.A.,
1996. Biofunctional membranes: an EPR study of active site structure and stability of
papain non-covalently immobilized on the surface of modified poly(ether)sulfone
membranes through the avidin-biotin linkage. Journal of Membrane Science 119(2), 241-
252.
Bhattacharyya, D., Butterfield, D.A., 2003. New Insights into Membrane Science and
Technology: Polymeric and Biofunctional Membranes. [In: Membr. Sci. Technol. Ser.,
2003; 8].
Blitz, J.P., Murthy, R.S.S., Leyden, D.E., 1987. Ammonia-catalyzed silylation reactions
of Cab-O-Sil with methoxymethylsilanes. Journal of the American Chemical Society
109(23), 7141-7145.
Boi, C., Dimartino, S., Sarti, G.C., 2007. Modelling and simulation of affinity membrane
adsorption. J. Chromatogr., A 1162(1), 24-33.
Bowen, W.R., Calvo, J.I., Hernandez, A., 1995. Steps of membrane blocking in flux
decline during protein microfiltration. Journal of Membrane Science 101(1-2), 153-165.
Bowen, W.R., Gan, Q., 1991. Properties of microfiltration membranes: flux loss during
constant pressure permeation of bovine serum albumin. Biotechnology and
Bioengineering 38(7), 688-696.
Bradford, M.M., 1976. A rapid and sensitive method for the quantitation of microgram
quantities of protein utilizing the principle of protein-dye binding. Analytical
Biochemistry 72(1-2), 248-254.
Brandt, S., Goffe, R.A., Kessler, S.B., O'Connor, J.L., Zale, S.E., 1988. Membrane-based
affinity technology for commercial scale purifications. Bio/Technology 6(7), 779-782.
175

Briefs, K.G., Kula, M.R., 1992. Fast protein chromatography on analytical and
preparative scale using modified microporous membranes. Chemical Engineering
Science 47(1), 141-149.
Bright, H.J., Appleby, M., 1969. pH dependence of the individual steps in the glucose
oxidase reaction. Journal of Biological Chemistry 244(13), 3625-3634.
Brooks, H., Lebleu, B., Vives, E., 2005. Tat peptide-mediated cellular delivery: back to
basics. Advanced Drug Delivery Reviews 57(4), 559-577.
Butterfield, D.A., Bhattacharyya, D., 2003. Biofunctional membranes: Site-specifically
immobilized enzyme arrays. Membrane Science and Technology Series 8(New Insights
into Membrane Science and Technology: Polymeric and Biofunctional Membranes,
2003), 233-240.
Butterfield, D.A., Bhattacharyya, D., Daunert, S., Bachas, L., 2001. Catalytic
biofunctional membranes containing site-specifically immobilized enzyme arrays: a
review. Journal of Membrane Science 181(1), 29-37.
Buxton, G.V., Greenstock, C.L., Helman, W.P., Ross, A.B., 1988. Critical review of rate
constants for reactions of hydrated electrons, hydrogen atoms and hydroxyl radicals
(.OH/.O-) in aqueous solution. Journal of Physical and Chemical Reference Data 17(2),
513-886.
Caron, N.J., Torrente, Y., Camirand, G., Bujold, M., Chapdelaine, P., Leriche, K.,
Bresolin, N., Tremblay, J.P., 2001. Intracellular delivery of a Tat-eGFP fusion protein
into muscle cells. Molecular Therapy 3(3), 310-318.
176

Caruso, F., Caruso, R.A., Moehwald, H., 1998a. Nanoengineering of inorganic and
hybrid hollow spheres by colloidal templating. Science (Washington, D. C.) 282(5391),
1111-1114.
Caruso, F., Caruso, R.A., Moehwald, H., 1999. Production of Hollow Microspheres from
Nanostructured Composite Particles. Chemistry of Materials 11(11), 3309-3314.
Caruso, F., Furlong, D.N., Ariga, K., Ichinose, I., Kunitake, T., 1998b. Characterization
of Polyelectrolyte-Protein Multilayer Films by Atomic Force Microscopy, Scanning
Electron Microscopy, and Fourier Transform Infrared Reflection-Absorption
Spectroscopy. Langmuir 14(16), 4559-4565.
Chaga, G.S., 2001. Twenty-five years of immobilized metal ion affinity chromatography:
past, present and future. J. Biochem. Biophys. Methods 49(1-3), 313-334.
Champluvier, B., Kula, M.R., 1991. Microfiltration membranes as pseudo-affinity
adsorbents: modification and comparison with gel beads. Journal of Chromatography
539(2), 315-325.
Chan, R., Chen, V., 2004. Characterization of protein fouling on membranes:
opportunities and challenges. J. Membr. Sci. 242(1-2), 169-188.
Charcosset, C., 1998. Purification of proteins by membrane chromatography. Journal of
Chemical Technology & Biotechnology 71(2), 95-110.
Chen, T.L., Weng, H.S., 1986. A method for the determinations of the activity and
optimal pH of glucose oxidase in an unbuffered solution. Biotechnology and
Bioengineering 28(1), 107-109.
177

Chen, W., McCarthy, T.J., 1997. Layer-by-Layer Deposition: A Tool for Polymer
Surface Modification. Macromolecules 30(1), 78-86.
Cheryan M., M.M.A., 1986. Membrane Bioreactors. In: McGregor, W.C. (Ed.),
Membrane separations in biotechnology, pp. 255-295. Marcel Dekker, New York.
Chun, K.-Y., Stroeve, P., 2001. External Control of Ion Transport in Nanoporous
Membranes with Surfaces Modified with Self-Assembled Monolayers. Langmuir 17(17),
5271-5275.
Clapp, P.A., Evans, D.F., Sheriff, T.S.S., 1989. Spectrophotometric determination of
hydrogen peroxide after extraction with ethyl acetate. Analytica Chimica Acta 218(2),
331-334.
Dai, J., Jensen, A.W., Mohanty, D.K., Erndt, J., Bruening, M.L., 2001. Controlling the
Permeability of Multilayered Polyelectrolyte Films through Derivatization, Cross-
Linking, and Hydrolysis. Langmuir 17(3), 931-937.
Datta, S., Bhattacharyya, D., Ray, P.D., Nath, A., Toborek, M., 2007. Effect of Pre-
Filtration on Selective Isolation of Tat Protein by Affinity Membrane Separation:
Analysis of Flux, Separation Efficiency, and Processing Time. Separation Science and
Technology 42(11), 2451-2471.
Datta, S., Ray, P.D., Nath, A., Bhattacharyya, D., 2006. Recognition based separation of
HIV-Tat protein using avidin-biotin interaction in modified microfiltration membranes.
Journal of Membrane Science 280(1+2), 298-310.
De, A.K., Dutta, B.K., Bhattacharjee, S., 2006. Reaction kinetics for the degradation of
phenol and chlorinated phenols using Fenton's reagent. Environmental Progress 25(1),
64-71.
178

de Mareuil, J., Carre, M., Barbier, P., Campbell, G.R., Lancelot, S., Opi, S., Esquieu, D.,
Watkins, J.D., Prevot, C., Braguer, D., Peyrot, V., Loret, E.P., 2005. HIV-1 Tat protein
enhances microtubule polymerization. Retrovirology 2, No pp given.
Decher, G., 1997. Fuzzy nanoassemblies: toward layered polymeric multicomposites.
Science (Washington, D. C.) 277(5330), 1232-1237.
Decher, G., Hong, J.D., 1991. Buildup of ultrathin multilayer films by a self-assembly
process. 1. Consecutive adsorption of anionic and cationic bipolar amphiphiles on
charged surfaces. Makromolekulare Chemie, Macromolecular Symposia 46(Eur. Conf.
Organ. Org. Thin Films, 3rd, 1990), 321-327.
Decher, G., Lvov, Y., Schmitt, J., 1994. Proof of multilayer structural organization in
self-assembled polycation-polyanion molecular films. Thin Solid Films 244(1-2), 772-
777.
Degen, P.J., Martin, J.M., Schriefer, J.L., Shirley, B.W., 1986. Concentrating ligands and
active membranes used therefor. p. 73 pp. (Pall Corp., USA). Application: EP
Dotzauer, D.M., Dai, J., Sun, L., Bruening, M.L., 2006. Catalytic Membranes Prepared
Using Layer-by-Layer Adsorption of Polyelectrolyte/Metal Nanoparticle Films in Porous
Supports. Nano Letters 6(10), 2268-2272.
Duke, F.R., Weibel, M., Page, D.S., Bulgrin, V.G., Luthy, J., 1969. Glucose oxidase
mechanism. Enzyme activation by substrate. J. Amer. Chem. Soc. 91(14), 3904-3909.
Ekinci, O., Boyukbayram, A.E., Kiralp, S., Toppare, L., Yagci, Y., 2007.
Characterization and Potential Applications of Immobilized Glucose Oxidase and
Polyphenol Oxidase. Journal of Macromolecular Science, Part A: Pure and Applied
Chemistry 44(8), 801-808.
179
Fausnaugh, J.L., Kennedy, L.A., Regnier, F.E., 1984a. Comparison of hydrophobic-
interaction and reversed-phase chromatography of proteins. Journal of Chromatography
317, 141-155.
Fausnaugh, J.L., Pfannkoch, E., Gupta, S., Regnier, F.E., 1984b. High-performance
hydrophobic interaction chromatography of proteins. Anal. Biochem. 137(2), 464-472.
Feins, M., Sirkar, K.K., 2004. Highly selective membranes in protein ultrafiltration.
Biotechnology and Bioengineering 86(6), 603-611.
Fenton, H.J.H., 1894. Oxidation of tartaric acid in presence of iron. Journal of the
Chemical Society, Transactions 65, 899-910.
Fery, A., Schoeler, B., Cassagneau, T., Caruso, F., 2001. Nanoporous Thin Films Formed
by Salt-Induced Structural Changes in Multilayers of Poly(acrylic acid) and
Poly(allylamine). Langmuir 17(13), 3779-3783.
Fisher, A.G., Feinberg, M.B., Josephs, S.F., Harper, M.E., Marselle, L.M., Reyes, G.,
Gonda, M.A., Aldovini, A., Debouk, C., Gallo, R.C., 1986. The trans-activator gene of
HTLV-III is essential for virus replication. Nature 320(6060), 367-371.
Frankel, A.D., Pabo, C.O., 1988. Cellular uptake of the tat protein from human
immunodeficiency virus. Cell 55(6), 1189-1193.
Frederick, K.R., Tung, J., Emerick, R.S., Masiarz, F.R., Chamberlain, S.H., Vasavada, A.,
Rosenberg, S., Chakraborty, S., Schopfer, L.M., Massey, V., 1990. Glucose oxidase from
Aspergillus niger. Cloning, gene sequence, secretion from Saccharomyces cerevisiae and
kinetic analysis of a yeast-derived enzyme [Erratum to document cited in
CA113(7):53410s]. Journal of Biological Chemistry 265(19), 11405.
180

Gabriel, E.M., Gillberg, G.E., 1993. In situ modification of microporous membranes.
Journal of Applied Polymer Science 48(12), 2081-2090.
Gallo, R.C., 1999. Tat as one key to HIV-induced immune pathogenesis and Pat toxoid as
an important component of a vaccine. Proc. Natl. Acad. Sci. U. S. A. 96(15), 8324-8326.
Gibson, Q.H., Swoboda, B.E.P., Massey, V., 1964. Kinetics and mechanism of action of
glucose oxidase. Journal of Biological Chemistry 239(11), 3927-3934.
Green, N.M., 1965. A spectrophotometric assay for avidin and biotin based on binding of
dyes by avidin. Biochemical Journal 94(3), 23c-24c.
Green, N.M., 1975. Avidin. Advances in Protein Chemistry 29, 85-133.
Grimshaw, P.E., Grodzinsky, A.J., Yarmush, M.L., 1992. Dynamically controlling the
transport of a molecule across a polyelectrolyte membrane for separations and drug
delivery systems providing controlled drug delivery. pp. 24 pp Cont -in-part of U S Ser
No 324,381. (Massachusetts Institute of Technology, USA). Application: US
Grubmuller, H., Heymann, B., Tavan, P., 1996. Ligand binding: molecular mechanics
calculation of the streptavidin-biotin rupture force. Science (New York, N.Y.) 271(5251),
997-999.
Gsell, T.C., Salinaro, R.F., Degen, P.J., 1988. A chemically activated medium with low
affinity for materials containing peptide groups. p. 17 pp. (Pall Corp., USA). Application:
EP
Guo, W., Ruckenstein, E., 2003. Separation and purification of horseradish peroxidase by
membrane affinity chromatography. J. Membr. Sci. 211(1), 101-111.
181

Haber, F., Weiss, J., 1934. The catalytic decomposition of hydrogen peroxide by iron
salts. Proc. Roy. Soc. (London) A147, 332-351.
He, P., Hu, N., Rusling, J.F., 2004. Driving forces for layer-by-layer self-assembly of
films of SiO2 nanoparticles and heme proteins. Langmuir 20(3), 722-729.
Hearn, M.T., 1987. 1,1'-Carbonyldiimidazole-mediated immobilization of enzymes and
affinity ligands. Methods in enzymology 135, 102-117.
Hecht, H.J., Kalisz, H.M., Hendle, J., Schmid, R.D., Schomburg, D., 1993. Crystal
structure of glucose oxidase from Aspergillus niger refined at 2.3 .ANG. resolution.
Journal of Molecular Biology 229(1), 153-172.
Hendry, R.M., Herrmann, J.E., 1980. Immobilization of antibodies on nylon for use in
enzyme-linked immunoassay. Journal of Immunological Methods 35(3-4), 285-296.
Hestekin, J.A., Bachas, L.G., Bhattacharyya, D., 2001. Poly(amino acid)-Functionalized
Cellulosic Membranes: Metal Sorption Mechanisms and Results. Industrial &
Engineering Chemistry Research 40(12), 2668-2678.
Hlavacek, M., Bouchet, F., 1993. Constant flowrate blocking laws and an example of
their application to dead-end microfiltration of protein solutions. Journal of Membrane
Science 82(3), 285-295.
Ho, C.-C., Zydney, A.L., 2000. A Combined Pore Blockage and Cake Filtration Model
for Protein Fouling during Microfiltration. Journal of Colloid and Interface Science
232(2), 389-399.
Ho, C.-C., Zydney, A.L., 2006. Overview of fouling phenomena and modeling
approaches for membrane bioreactors. Sep. Sci. Technol. 41(7), 1231-1251.
182

Ho, W., Sirkar, K.K. (Eds.), 1992. Membrane Handbook. van Nostrand Reinhold, New
York.
Hollman, A.M., Bhattacharyya, D., 2002. Controlled permeability and ion exclusion in
microporous membranes functionalized with poly(L-glutamic acid). Langmuir 18(15),
5946-5952.
Hollman, A.M., Bhattacharyya, D., 2004. Pore assembled multilayers of charged
polypeptides in microporous membranes for ion separation. Langmuir 20(13), 5418-5424.
Hollman, A.M., Christian, D.A., Ray, P.D., Galey, D., Turchan, J., Nath, A.,
Bhattacharyya, D., 2005. Selective Isolation and Purification of Tat Protein via Affinity
Membrane Separation. Biotechnology Progress 21(2), 451-459.
Hoshi, T., Sagae, N., Daikuhara, K., Takahara, K., Anzai, J.-i., 2007. Multilayer
membranes via layer-by-layer deposition of glucose oxidase and Au nanoparticles on a Pt
electrode for glucose sensing. Materials Science & Engineering, C: Biomimetic and
Supramolecular Systems 27(4), 890-894.
Hou, K.C., Hou, C.J., Roy, S., Zaniewski, R., 1989. Immobilization of protein G on
nylon membrane for the removal of IgG from human plasma. Polymeric Materials
Science and Engineering 61, 670-674.
Hou, X., Liu, B., Deng, X., Zhang, B., Chen, H., Luo, R., 2007. Covalent immobilization
of glucose oxidase onto poly(styrene-co-glycidyl methacrylate) monodisperse fluorescent
microspheres synthesized by dispersion polymerization. Anal. Biochem. 368(1), 100-110.
Hout, M.S., Federspiel, W.J., 2003. Mathematical and Experimental Analyses of
Antibody Transport in Hollow-Fiber-Based Specific Antibody Filters. Biotechnol. Prog.
19(5), 1553-1561.
183

Huston, P.L., Pignatello, J.J., 1999. Degradation of selected pesticide active ingredients
and commercial formulations in water by the photo-assisted Fenton reaction. Water
Research 33(5), 1238-1246.
Ichinose, I., Senzu, H., Kunitake, T., 1996. Stepwise adsorption of metal alkoxides on
hydrolyzed surfaces: A surface sol-gel process. Chemistry Letters(10), 831-832.
Iler, R.K., Colloid, J., 1966. Multilayers of colloidal particles. Interface Sci. 21(6), 569-
594.
Irvine, G.B., 1997. Size-exclusion high-performance liquid chromatography of peptides:
a review. Analytica Chimica Acta 352(1-3), 387-397.
Iwata, H., Saito, K., Furusaki, S., Sugo, T., Okamoto, J., 1991. Adsorption characteristics
of an immobilized metal affinity membrane. Biotechnol Prog 7(5), 412-418.
J.-L. Guesdon, T.T., Avrameas S., 1979. The use of avidin biotin interaction in
immunoenzymatic techniques. Journal of Histochemistry and Cytochemistry 27, 1131-
1139.
Jahraus, A., Tjelle, T.E., Berg, T., Habermann, A., Storrie, B., Ullrich, O., Griffiths, G.,
1998. In vitro fusion of phagosomes with different endocytic organelles from J774
macrophages. J. Biol. Chem. 273(46), 30379-30390.
Jain, P., Sun, L., Dai, J., Baker, G.L., Bruening, M.L., 2007. High-Capacity Purification
of His-tagged Proteins by Affinity Membranes Containing Functionalized Polymer
Brushes. Biomacromolecules 8(10), 3102-3107.
Jeang, K.-T., Xiao, H., Rich, E.A., 1999. Multifaceted activities of the HIV-1
transactivator of transcription, Tat. J. Biol. Chem. 274(41), 28837-28840.
184

Jin W., T.A., Tieke B, 2003. Use of polyelectrolyte Layer-By-Layer assemblies as
nanofiltration and reverse osmosis membranes. Langmuir 19, 2550-2553.
Johnson, K.A., Kroa, B.A., Yourey, T., 2002. Factors affecting reaction kinetics of
glucose oxidase. Journal of Chemical Education 79(1), 74-76.
Kelly, S.T., Zydney, A.L., 1995. Mechanisms for BSA fouling during microfiltration.
Journal of Membrane Science 107(1-2), 115-127.
Kesting, R.E., 1971. Synthetic Polymeric Membranes.
Khopade, A.J., Caruso, F., 2002. Investigation of the Factors Influencing the Formation
of Dendrimer/Polyanion Multilayer Films. Langmuir 18(20), 7669-7676.
Klein, E., 1991. Affinity Membranes. Wiley, New York.
Klein, E., 2000. Affinity membranes: a 10-year review. Journal of Membrane Science
179(1-2), 1-27.
Klein, E., Silva, L.K., 1991. Hydrophilic semipermeable membranes based on
copolymers of acrylonitrile and hydroxyalkyl (meth)acrylates. p. 7 pp. (USA).
Application: US
US.
Ko, H., Jiang, C., Tsukruk, V.V., 2005. Encapsulating Nanoparticle Arrays into Layer-
by-layer Multilayers by Capillary Transfer Lithography. Chemistry of Materials 17(22),
5489-5497.
185

Kotov, N.A., Dekany, I., Fendler, J.H., 1995. Layer-by-Layer Self-Assembly of
Polyelectrolyte-Semiconductor Nanoparticle Composite Films. Journal of Physical
Chemistry 99(35), 13065-13069.
Krasemann, L., Tieke, B., 1998. Ultrathin self-assembled polyelectrolyte membranes for
pervaporation. Journal of Membrane Science 150(1), 23-30.
Krasemann, L., Toutianoush, A., Tieke, B., 2001. Self-assembled polyelectrolyte
multilayer membranes with highly improved pervaporation separation of ethanol/water
mixtures. J. Membr. Sci. 181(2), 221-228.
Krass, H., Papastavrou, G., Kurth, D.G., 2003. Layer-by-layer self-assembly of a
polyelectrolyte bearing metal ion coordination and electrostatic functionality. Chem.
Mater. 15(1), 196-203.
Kugel, K., Moseley, A., Harding, G.B., Klein, E., 1992. Microporous polycaprolactam
hollow fibers for therapeutic affinity adsorption. J. Membr. Sci. 74(1-2), 115-129.
Ladhe, A.R., Radomyselski, A., Bhattacharyya, D., 2006. Ethoxylated Nonionic
Surfactants in Hydrophobic Solvent: Interaction with Aqueous and Membrane-
Immobilized Poly(acrylic acid). Langmuir 22(2), 615-621.
Lechtken, A., Zuendorf, I., Dingermann, T., Firla, B., Steinhilber, D., 2006.
Overexpression, refolding, and purification of polyhistidine-tagged human retinoic acid
related orphan receptor RORalpha 4. Protein Expression and Purification 49(1), 114-120.
Lehninger, A.L., 1977. Biochemistry. 2nd Ed.
186

Lensmeyer, G.L., Onsager, C., Carlson, I.H., Wiebe, D.A., 1995. Use of particle-loaded
membranes to extract steroids for high-performance liquid chromatographic analyses.
Improved analyte stability and detection. J. Chromatogr., A 691(1-2), 239-246.
Leskovac, V., Trivic, S., Wohlfahrt, G., Kandrac, J., Pericin, D., 2005. Glucose oxidase
from Aspergillus niger: the mechanism of action with molecular oxygen, quinones, and
one-electron acceptors. International Journal of Biochemistry & Cell Biology 37(4), 731-
750.
Levison, P.R., 2003. Large-scale ion-exchange column chromatography of proteins.
Comparison of different formats. J. Chromatogr., B: Anal. Technol. Biomed. Life Sci.
790(1-2), 17-33.
Lewin, M., Carlesso, N., Tung, C.H., Tang, X.W., Cory, D., Scadden, D.T., Weissleder,
R., 2000. Tat peptide-derivatized magnetic nanoparticles allow in vivo tracking and
recovery of progenitor cells. Nature biotechnology 18(4), 410-414.
Li, Y., Bachas, L.G., Bhattacharyya, D., 2007. Selected Chloro-Organic Detoxifications
by Polychelate (Poly(acrylic acid)) and Citrate-Based Fenton Reaction at Neutral pH
Environment. Ind. Eng. Chem. Res. 46(24), 7984-7992.
Li, Y.C., Bachas, L.G., Bhattacharyya, D., 2005. Kinetics Studies of Trichlorophenol
Destruction by Chelate-Based Fenton Reaction. Environmental Engineering Science
22(6), 756-771.
Li, Z.F., Kang, E.T., Neoh, K.G., Tan, K.L., 1998. Covalent immobilization of glucose
oxidase on the surface of polyaniline films graft copolymerized with acrylic acid.
Biomaterials 19(1-3), 45-53.
187

Lingeman, H., Hoekstra-Oussoren, S.J., 1997. Particle-loaded membranes for sample
concentration and/or clean-up in bioanalysis. Journal of chromatography. B, Biomedical
sciences and applications 689(1), 221-237.
Liou, M.-J., Lu, M.-C., 2007. Catalytic degradation of nitroaromatic explosives with
Fenton's reagent. Journal of Molecular Catalysis A: Chemical 277(1-2), 155-163.
Liu, J., Wang, J., Bachas, L.G., Bhattacharyya, D., 2001. Activity Studies of Immobilized
Subtilisin on Functionalized Pure Cellulose-Based Membranes. Biotechnology Progress
17(5), 866-871.
Liu, X., Bruening, M.L., 2004. Size-selective transport of uncharged solutes through
multilayer polyelectrolyte membranes. Chemistry of Materials 16(2), 351-357.
Liu, Y.-C., Suen, S.-Y., Huang, C.-W., ChangChien, C.-C., 2005. Effects of spacer arm
on penicillin G acylase purification using immobilized metal affinity membranes. J.
Membr. Sci. 251(1-2), 201-207.
Livnah, O., Bayer, E.A., Wilchek, M., Sussman, J.L., 1993. Three-dimensional structures
of avidin and the avidin-biotin complex. Proc. Natl. Acad. Sci. U. S. A. 90(11), 5076-
5080.
Loeb, S., Sourirajan, S., 1964. The preparation of high-flow semi-permeable membranes
for separation of water from saline solutions. p. 9 pp. (University of California).
Application: US
Lundberg, M., Holmgren, A., Johansson, M., 2006. Human glutaredoxin 2 affinity tag for
recombinant peptide and protein purification. Protein Expr Purif FIELD Full Journal
Title:Protein expression and purification 45(1), 37-42.
188

Lvov, Y., Ariga, K., Ichinose, I., Kunitake, T., 1995. Layer-by-layer architectures of
concanavalin A by means of electrostatic and biospecific interactions. Journal of the
Chemical Society, Chemical Communications(22), 2313-2314.
Lvov, Y., Haas, H., Decher, G., Moehwald, H., Mikhailov, A., Mtchedlishvily, B.,
Morgunova, E., Vainshtein, B., 1994. Successive Deposition of Alternate Layers of
Polyelectrolytes and a Charged Virus. Langmuir 10(11), 4232-4236.
Ma, M., Nath, A., 1997. Molecular determinants for cellular uptake of Tat protein of
human immunodeficiency virus type 1 in brain cells. Journal of Virology 71(3), 2495-
2499.
Makkuni, A., Varma, R.S., Sikdar, S.K., Bhattacharyya, D., 2007. Vapor Phase Mercury
Sorption by Organic Sulfide Modified Bimetallic Iron-Copper Nanoparticle Aggregates.
Industrial & Engineering Chemistry Research 46(4), 1305-1315.
Malaisamy, R., Bruening, M.L., 2005. High-Flux Nanofiltration Membranes Prepared by
Adsorption of Multilayer Polyelectrolyte Membranes on Polymeric Supports. Langmuir
21(23), 10587-10592.
Mandaro R. M., R.S., Hou K. C., 1987. Filtration supports for affinity separation.
Bio/Technology 5, 928-932.
Marshal, A., Munro, P., Tragradh, G., 1993. The effect of protein fouling in
microfiltration and ultrafiltration on permeate flux, protein retention and selectivity: A
literature review. Desalination 91, 65-108.
Matsuno, H., Nagasaka, Y., Kurita, K., Serizawa, T., 2007. Superior Activities of
Enzymes Physically Immobilized on Structurally Regular Poly(methyl methacrylate)
Surfaces. Chem. Mater. 19(9), 2174-2179.
189

McGregor, W.C., Editor, 1986. Bioprocess Technology, Vol. 1: Membrane Separations
in Biotechnology.
Mohr C. M., E.D.E., Leeper S. A., Charboneau B. L., 1989. Membrane Applications and
Research in Food Processing. Noyes Data Corporation, Park Ridge, NJ, USA.
Mulder, M., 1991. Basic Principles of Membrane Technology Kluwer Academic
Publishers, Netherlands.
Muller, D., 1928. Studies on the new enzyme glucoseoxidase. I. Biochemische Zeitschrift
199, 136-170.
Nagai, K., Thøgersen, H.C., 1984. Generation of Beta-globin by sequence-specific
proteolysis of a hybrid protein produced in Escherichia coli. Nature 309, 810-812.
Nath, A., Chauhan, A., 2005. Neurology of AIDS. Oxford University Press, USA.
Nath, A., Geiger, J., 1998. Neurobiological aspects of human immunodeficiency virus
infection: neurotoxic mechanisms. Progress in Neurobiology (Oxford) 54(1), 19-33.
Nguyen, Q.T., Ping, Z., Nguyen, T., Rigal, P., 2003. Simple method for immobilization
of bio-macromolecules onto membranes of different types. J. Membr. Sci. 213(1-2), 85-
95.
Nystrom, M., Aimar, P., Luque, S., Kulovaara, M., Metsamuuronen, S., 1998.
Fractionation of model proteins using their physiochemical properties. Colloids and
Surfaces, A: Physicochemical and Engineering Aspects 138(2-3), 185-205.
190

Onda, M., Lvov, Y., Ariga, K., Kunitake, T., 1996. Sequential reaction and product
separation on molecular films of glucoamylase and glucose oxidase assembled on an
ultrafilter. Journal of Fermentation and Bioengineering 82(5), 502-506.
Ozyilmaz, G., Tukel, S.S., Alptekin, O., 2005. Activity and storage stability of
immobilized glucose oxidase onto magnesium silicate. Journal of Molecular Catalysis B:
Enzymatic 35(4-6), 154-160.
Palacio, L., Ho, C.C., Pradanos, P., Hernandez, A., Zydney, A.L., 2003. Fouling with
protein mixtures in microfiltration: BSA-lysozyme and BSA-pepsin. Journal of
Membrane Science 222(1-2), 41-51.
Pandey, P., Singh, S.P., Arya, S.K., Gupta, V., Datta, M., Singh, S., Malhotra, B.D., 2007.
Application of Thiolated Gold Nanoparticles for the Enhancement of Glucose Oxidase
Activity. Langmuir 23(6), 3333-3337.
Parker, J.W., Schwartz, C.S., 1987. Modeling the kinetics of immobilized glucose
oxidase. Biotechnology and Bioengineering 30(6), 724-735.
Pemawansa, K.P., 1993. Durable ultrafiltration membranes of polysulfones having
optimized molecular weight. p. 10 pp. (Koch Membrane Systems, Inc., USA).
Application: EP
EP.
Peterson, E.A., 1978. Ion-exchange displacement chromatography of serum proteins,
using carboxymethyldextrans as displacers. Anal. Biochem. 90(2), 767-784.
Pignatello, J.J., Oliveros, E., MacKay, A., 2006. Advanced oxidation processes for
organic contaminant destruction based on the Fenton reaction and related chemistry.
Critical Reviews in Environmental Science and Technology 36(1), 1-84.
191

Piramowicz, M.d.O., Czuba, P., Targosz, M., Burda, K., Szymonski, M., 2006. Dynamic
force measurements of avidin-biotin and streptavidin-biotin interactions using AFM. Acta
Biochimica Polonica 53(1), 93-100.
Polyakov, V., Sharma, V., Dahlheimer, J.L., Pica, C.M., Luker, G.D., Piwnica-Worms,
D., 2000. Novel Tat-peptide chelates for direct transduction of technetium-99m and
rhenium into human cells for imaging and radiotherapy. Bioconjugate chemistry 11(6),
762-771.
Porath, J., Flodin, P., 1959. Gel filtration: a method for desalting and group separation.
Nature (London, United Kingdom) 183, 1657-1659.
Prendergast, M.A., Rogers, D.T., Mulholland, P.J., Littleton, J.M., Wilkins, L.H., Self,
R.L., Nath, A., 2002. Neurotoxic effects of the human immunodeficiency virus type-1
transcription factor Tat require function of a polyamine sensitive-site on the N-methyl-D-
aspartate receptor. Brain Research 954(2), 300-307.
Ramratnam, B., Mittler, J.E., Zhang, L., Boden, D., Hurley, A., Fang, F., Macken, C.A.,
Perelson, A.S., Markowitz, M., Ho, D.D., 2000. The decay of the latent reservoir of
replication-competent HIV-1 is inversely correlated with the extent of residual viral
replication during prolonged anti-retroviral therapy. Nature Medicine (New York) 6(1),
82-85.
Rana, T.M., Jeang, K.-T., 1999. Biochemical and Functional Interactions between HIV-1
Tat Protein and TAR RNA. Archives of Biochemistry and Biophysics 365(2), 175-185.
Ratner, B.D., Hoffman, A.S., Schoen, F.J., Lemons, J.E., Editors, 2004. Biomaterials
Science, An Introduction to Materials in Medicine, 2nd Edition.
192

Rauf, S., Ihsan, A., Akhtar, K., Ghauri, M.A., Rahman, M., Anwar, M.A., Khalid, A.M.,
2006. Glucose oxidase immobilization on a novel cellulose acetate-
polymethylmethacrylate membrane. Journal of biotechnology 121(3), 351-360.
Regnier, F.E., 1987a. Chromatography of complex protein mixtures. J Chromatogr 418,
115-143.
Regnier, F.E., 1987b. HPLC of biological macromolecules: the first decade.
Chromatographia 24, 241-251.
Riggin, A., Regnier, F.E., Sportsman, J.R., 1991. Quantification of antibodies to human
growth hormone by high-performance protein G affinity chromatography with
fluorescence detection. Anal Chem 63(5), 468-474.
Ritchie, S.M.C., Bachas, L.G., Olin, T., Sikdar, S.K., Bhattacharyya, D., 1999. Surface
Modification of Silica- and Cellulose-Based Microfiltration Membranes with Functional
Polyamino Acids for Heavy Metal Sorption. Langmuir 15(19), 6346-6357.
Ritter, K., 1991a. Affinity purification of antibodies from sera using
polyvinylidenedifluoride (PVDF) membranes as coupling matrices for antigens presented
by autoantibodies to triosephosphate isomerase. J Immunol Methods 137(2), 209-215.
Ritter, K., 1991b. Affinity purification of antibodies from sera using
polyvinylidenedifluoride (PVDF) membranes as coupling matrixes for antigens. Journal
of Immunological Methods 137(2), 209-215.
Rivas, B.L., Jara, M., Pereira, E.D., 2003. Preparation and adsorption properties of the
chelating resins containing carboxylic, sulfonic, and imidazole groups. Journal of
Applied Polymer Science 89(10), 2852-2856.
193

Roper, D.K., Lightfoot, E.N., 1995. Separation of biomolecules using adsorptive
membranes. J. Chromatogr., A 702(1 + 2), 3-26.
Ruan, G., Agrawal, A., Marcus, A.I., Nie, S., Imaging and Tracking of Tat Peptide-
Conjugated Quantum Dots in Living Cells: New Insights into Nanoparticle Uptake,
Intracellular Transport, and Vesicle Shedding. Journal of the American Chemical Society,
ACS ASAP.
Ruben, S., Perkins, A., Purcell, R., Joung, K., Sia, R., Burghoff, R., Haseltine, W.A.,
Rosen, C.A., 1989. Structural and functional characterization of human
immunodeficiency virus tat protein. J Virol FIELD Full Journal Title:Journal of virology
63(1), 1-8.
Ruckenstein, E., Guo, W., 2004. Cellulose and glass fiber affinity membranes for the
chromatographic separation of biomolecules. Biotechnology Progress 20(1), 13-25.
Ruckenstein, E., Zeng, X., 1997. Macroporous chitin affinity membranes for lysozyme
separation. Biotechnol. Bioeng. 56(6), 610-617.
Rusnati, M., Coltrini, D., Oreste, P., Zoppetti, G., Albini, A., Noonan, D., Di Fagagna,
F.D.a., Giacca, M., Presta, M., 1997. Interaction of HIV-1 Tat protein with heparin. Role
of the backbone structure, sulfation, and size. Journal of Biological Chemistry 272(17),
11313-11320.
Saksena, S., Zydney, A.L., 1994. Effect of solution pH and ionic strength on the
separation of albumin from immunoglobulins (IgG) by selective filtration. Biotechnology
and Bioengineering 43(10), 960-968.
Savage, M.D., 1992. Components of Avidin-Biotin Technology. Avidin-Biotin
Chemistry. Pierce Chemical Co.
194

Schisla, D.K., Carr, P.W., Cussler, E.L., 1995. Hollow Fiber Array Affinity
Chromatography. Biotechnol. Prog. 11(6), 651-658.
Schrick, B., Blough, J.L., Jones, A.D., Mallouk, T.E., 2002. Hydrodechlorination of
Trichloroethylene to Hydrocarbons Using Bimetallic Nickel-Iron Nanoparticles.
Chemistry of Materials 14(12), 5140-5147.
Schwarze, S.R., Ho, A., Vocero-Akbani, A., Dowdy, S.F., 1999. In vivo protein
transduction: delivery of a biologically active protein into the mouse. Science (New York,
N.Y.) 285(5433), 1569-1572.
Scott, K., 1995. Handbook of Industrial Membranes, First ed. Elsevier, Oxford, UK.
Shang, Z., Zhou, D., Guo, W., Yu, Y., Zhou, L., Pan, M., Zhou, K., 1998. Study on
affinity membrane of polyamide used for endotoxin removal. I. Preparation and
characterization of affinity membrane. Fenxi Ceshi Xuebao 17(1), 1-4.
Smuleac, V., Butterfield, D.A., Bhattacharyya, D., 2004. Permeability and separation
characteristics of polypeptide-functionalized polycarbonate track-etched membranes.
Chemistry of Materials 16(14), 2762-2771.
Smuleac, V., Butterfield, D.A., Bhattacharyya, D., 2006. Layer-by-Layer-Assembled
Microfiltration Membranes for Biomolecule Immobilization and Enzymatic Catalysis.
Langmuir 22(24), 10118-10124.
Smuleac, V., Butterfield, D.A., Sikdar, S.K., Varma, R.S., Bhattacharyya, D., 2005.
Polythiol-functionalized alumina membranes for mercury capture. J. Membr. Sci. 251(1-
2), 169-178.
195

Stauber, R.H., Pavlakis, G.N., 1998. Intracellular trafficking and interactions of the HIV-
1 Tat protein. Virology 252(1), 126-136.
Stoellner, D., Scheller, F.W., Warsinke, A., 2002. Activation of cellulose membranes
with 1,1'-carbonyldiimidazole or 1-cyano-4-dimethylaminopyridinium tetrafluoroborate
as a basis for the development of immunosensors. Analytical Biochemistry 304(2), 157-
165.
Su, X., Zong, Y., Richter, R., Knoll, W., 2005. Enzyme immobilization on poly(ethylene-
co-acrylic acid) films studied by quartz crystal microbalance with dissipation monitoring.
Journal of Colloid and Interface Science 287(1), 35-42.
Suen, S.-Y., Lin, S.-Y., Chiu, H.-C., 2000. Effects of spacer arms on Cibacron Blue 3GA
immobilization and lysozyme adsorption using regenerated cellulose membrane discs.
Ind. Eng. Chem. Res. 39(2), 478-487.
Suen, S.-Y., Liu, Y.-C., Chang, C.-S., 2003. Exploiting immobilized metal affinity
membranes for the isolation or purification of therapeutically relevant species. J.
Chromatogr., B: Anal. Technol. Biomed. Life Sci. 797(1-2), 305-319.
Suen, S.Y., Etzel, M.R., 1992. A mathematical analysis of affinity membrane
bioseparations. Chemical Engineering Science 47(6), 1355-1364.
Suki, A., Fane, A.G., Fell, C.J.D., 1984. Flux decline in protein ultrafiltration. Journal of
Membrane Science 21(3), 269-283.
T. Hoshi, J.-I.A., T. Osa, 1995. Controlled deposition of glucose oxidase on platinum
electrode based on an avidin/biotin system for the regulation of output current of glucose
sensors. Anal. Chem. 63.
196

Tang, T., Qu, J., Muellen, K., Webber, S.E., 2006. Molecular Layer-by-Layer Self-
Assembly of Water-Soluble Perylene Diimides through p-p and Electrostatic Interactions.
Langmuir 22(1), 26-28.
Tarvainen, T., Nevalainen, T., Sundell, A., Svarfvar, B., Hyrsyla, J., Paronen, P., Jarvinen,
K., 2000. Drug release from poly(acrylic acid) grafted poly(vinylidene fluoride)
membrane bags in the gastrointestinal tract in the rat and dog. Journal of Controlled
Release 66(1), 19-26.
Tedeschi, C., Caruso, F., Moehwald, H., Kirstein, S., 2000. Adsorption and desorption
behavior of an anionic pyrene chromophore in sequentially deposited polyelectrolyte-dye
thin films. Journal of the American Chemical Society 122(24), 5841-5848.
Thoemmes, J., Kula, M.R., 1995. Membrane chromatography - an integrative concept in
the downstream processing of proteins. Biotechnology Progress 11(4), 357-367.
Tomotani, E.J., Vitolo, M., 2007. Immobilized glucose oxidase as a catalyst to the
conversion of glucose into gluconic acid using a membrane reactor. Enzyme and
Microbial Technology 40(5), 1020-1025.
Torchilin, V.P., Rammohan, R., Weissig, V., Levchenko, T.S., 2001. TAT peptide on the
surface of liposomes affords their efficient intracellular delivery even at low temperature
and in the presence of metabolic inhibitors. Proc. Natl. Acad. Sci. U. S. A. 98(15), 8786-
8791.
Torres, A.R., Peterson, E.A., 1990. Purification of monoclonal antibodies by complex-
displacement chromatography on CM-cellulose. J Chromatogr 499, 47-54.
197

Toutianoush, A., Jin, W., Deligoez, H., Tieke, B., 2005. Polyelectrolyte multilayer
membranes for desalination of aqueous salt solutions and seawater under reverse osmosis
conditions. Applied Surface Science 246(4), 437-443.
Tracy, E., Davis, R., 1994. Protein fouling of track-etched polycarbonate microfiltration
membranes. J. Colloid Interface Sci 167, 104-116.
Trau, D., Renneberg, R., 2003. Encapsulation of glucose oxidase microparticles within a
nanoscale layer-by-layer film: immobilization and biosensor applications. Biosens.
Bioelectron. 18(12), 1491-1499.
Ulbricht, M., Riedel, M., 1998. Ultrafiltration membrane surfaces with grafted polymer
'tentacles': preparation, characterization and application for covalent protein binding.
Biomaterials 19(14), 1229-1237.
Ulbricht, M., Yang, H., 2005. Porous Polypropylene Membranes with Different Carboxyl
Polymer Brush Layers for Reversible Protein Binding via Surface-Initiated Graft
Copolymerization. Chemistry of Materials 17(10), 2622-2631.
Urmenyi, A.M., Poot, A.A., Wessling, M., Mulder, M.H.V., 2005. Affinity membranes
for hormone removal from aqueous solutions. Journal of Membrane Science 259(1-2),
91-102.
van Eijndhoven, R.H.C.M., Saksena, S., Zydney, A.L., 1995. Protein fractionation using
electrostatic interactions in membrane filtration. Biotechnology and Bioengineering 48(4),
406-414.
Varilova, T., Madera, M., Pacakova, V., Stulik, K., 2006. Separation media in affinity
chromatography of proteins - a critical review. Current Proteomics 3(1), 55-79.
198

Velasco, C., Ouammou, M., Calvo, J.I., Hernandez, A., 2003. Protein fouling in
microfiltration: deposition mechanism as a function of pressure for different pH. Journal
of Colloid and Interface Science 266(1), 148-152.
Voet, D., Pratt, C.W., Voet, J.G., 2004. Fundamentals of Biochemistry, Take Note!, 2nd
Edition.
Wadia, J.S., Dowdy, S.F., 2003. Modulation of cellular function by TAT mediated
transduction of full length proteins. Current Protein and Peptide Science 4(2), 97-104.
Wadia, J.S., Dowdy, S.F., 2005. Transmembrane delivery of protein and peptide drugs by
TAT-mediated transduction in the treatment of cancer. Advanced Drug Delivery Reviews
57(4), 579-596.
Watts, R.J., Udell, M.D., Rauch, P.A., 1990. Treatment of pentachlorophenol-
contaminated soils using Fenton's reagent. Hazardous Waste & Hazardous Materials 7(4),
335-345.
Weibel, M.K., Bright, H.J., 1971. Glucose oxidase mechanism. Interpretation of the pH
dependence. Journal of Biological Chemistry 246(9), 2734-2744.
Whitaker, J.R., 1994. Principles of Enzymology for the Food Sciences, Second Edition.
[In: Food Sci. Technol. (N. Y.), 1994; 61].
Wolpert, S., 1997. Aldehyde activated microporous membranes. J. Membr. Sci. 132(1),
23-32.
Wong, D., Editor, 1995. Food Enzymes: Structure and Mechanism.
Woodward, J., Editor, 1985. Immobilized Cells and Enzymes. A Practical Approach.
199

Xu, J., Bhattacharyya, D., 2007. Fe/Pd Nanoparticle Immobilization in Microfiltration
Membrane Pores: Synthesis, Characterization, and Application in the Dechlorination of
Polychlorinated Biphenyls. Ind. Eng. Chem. Res. 46(8), 2348-2359.
Xu, J., Dozier, A., Bhattacharyya, D., 2005. Synthesis of Nanoscale Bimetallic Particles
in Polyelectrolyte Membrane Matrix for Reductive Transformation of Halogenated
Organic Compounds. Journal of Nanoparticle Research 7(4-5), 449-467.
Yang, H., Viera, C., Fischer, J., Etzel, M.R., 2002. Purification of a large protein using
ion-exchange membranes. Industrial & Engineering Chemistry Research 41(6), 1597-
1602.
Ying, L., Kang, E.T., Neoh, K.G., 2002. Covalent immobilization of glucose oxidase on
microporous membranes prepared from poly(vinylidene fluoride) with grafted
poly(acrylic acid) side chains. J. Membr. Sci. 208(1-2), 361-374.
Zeman, L.J., 1983. Adsorption effects in rejection of macromolecules by ultrafiltration
membranes. Journal of Membrane Science 15, 213-230.
Zeng, X., Ruckenstein, E., 1998. Crosslinked macroporous chitosan anion-exchange
membranes for protein separations. J. Membr. Sci. 148(2), 195-205.
Zeng, X., Ruckenstein, E., 1999. Membrane Chromatography: Preparation and
Applications to Protein Separation. Biotechnol. Prog. 15(6), 1003-1019.
Zhang, H., Zhou, Z., Yang, B., Gao, M., 2003. The Influence of Carboxyl Groups on the
Photoluminescence of Mercaptocarboxylic Acid-Stabilized CdTe Nanoparticles. Journal
of Physical Chemistry B 107(1), 8-13.
200

Zhao, H., Ju, H., 2006. Multilayer membranes for glucose biosensing via layer-by-layer
assembly of multiwall carbon nanotubes and glucose oxidase. Analytical Biochemistry
350(1), 138-144.
Zheng Liu, M.D.A., 2004. FT-IRRAS spectroscopic studies of the interaction of avidin
with biotinylated dendrimer surfaces. Colloids and Surfaces B: Biointerfaces 35, 197-203.
Zhou, X., Arnold, M.A., 1995. Internal enzyme fiber-optic biosensors for hydrogen
peroxide and glucose. Analytica Chimica Acta 304(2), 147-156.
Zorko, M., Langel, U., 2005. Cell-penetrating peptides: mechanism and kinetics of cargo
delivery. Advanced Drug Delivery Reviews 57(4), 529-545.
Zou, H., Luo, Q., Zhou, D., 2001. Affinity membrane chromatography for the analysis
and purification of proteins. Journal of Biochemical and Biophysical Methods 49(1-3),
199-240.
201

Vita
Saurav Datta was born on 19th of April, 1976 in Calcutta, India. He has received
his Bachelor of Science degree in Chemistry and Bachelor of Technology degree in
Chemical Engineering from University of Calcutta, India in 1997 and 2000, respectively.
After that he has pursued in education and obtained Masters of Technology in Chemical
Engineering from Indian Institute of Technology, Kanpur, India in 2002. Then, he has
continued his career in Indian Institute of Technology, Kanpur as Research Associate till
2003. Then, He has joined Department of Chemical Engineering, University of Kentucky
for PhD curriculum.
Awards:
• One of the five recipients of Schering Plough Corporation Research Travel Award for
presenting in AIChE 2006
• Recipient of North American Membrane Society Research Travel Award , 2005
• Honorary mention in the 2005 AIChE Separation Division Graduate Student Award
in the area of Membranes
• Ranked among the top 15 and received Indian National Merit Scholarship for
excellent performance in Bachelor of Science Examination in 1997
Publications:
• S. Datta, C. Cecil, D. Bhattacharyya, Enzymatic Production of H2O2 with Glucose
Oxidase Immobilized in Functionalized Membranes Created by Layer-By-Layer
Attachment of Polyelectrolytes and In-Situ Polymerization of Acrylic Acid, to be
submitted to the Special centennial issue of I&EC Res.
• S. Datta, Philip D. Ray, A. Nath, D. Bhattacharyya, Selective separation of HIV-Tat
protein using functionalized stacked microfiltration membranes: Enhancement of flux
and recovery of protein, Separation Science and Technology 42 (2007) 2451-2471
202

• S. Datta, Philip D. Ray, A. Nath, D. Bhattacharyya, Recognition based separation of
HIV-Tat protein using avidin-biotin interaction in modified microfiltration
membranes, Journal of Membrane Science 280 (2006) 298-310
• S. Datta, P. K. Bhattacharya, N. Verma, Removal of aniline from aqueous solution in
a MFR using emulsion liquid membrane, Journal of Membrane Science 226 (2003)
185-201
Presentations:
• S. Datta, D. Bhattacharyya, Affinity Based Separation of Proteins using
Functionalized Microfiltration Membranes, 2007 Annual Meeting of American
Institute of Chemical Engineers, Salt Lake City, UT
• S. Datta, D. Bhattacharyya, Functionalized Microfiltration Membranes for Bio-
Catalysis and Bio-Separations, 2007 Annual Meeting of American Institute of
Chemical Engineers, Salt Lake City, UT
• S. Datta, A. Nath, D. Bhattacharyya, Separation and purification of a target protein
from mixture of proteins using different membrane separation processes in series,
Oral presentation in 2007 Annual Meeting of North American Membrane Society
(NAMS), Orlando, FL
• S. Datta, D. Bhattacharyya, Development and Applications of Functionalized
Microfiltration Membranes, Poster presentation in 2007 Annual Meeting of North
American Membrane Society (NAMS), Orlando, FL
• S. Datta, P. D. Ray, A. Nath, D. Bhattacharyya, Selective separation of HIV-Tat
protein using functionalized microfiltration membranes, Oral presentation in 2006
Annual Meeting of American Institute of Chemical Engineers (AIChE), San
Francisco, CA
• S. Datta, P. D. Ray, A. Nath, D. Bhattacharyya, Selective separation of high value
proteins by functionalized microfiltration membranes, Poster presentation in 2006
Annual Meeting of North American Membrane Society (NAMS), Chicago, IL
203

• D. Bhattacharyya, S. Datta, P. D. Ray, A. Hollman, A. Nath, Selective Isolation and
Purification of Genetically Modified Tat Protein by Stacked Affinity Membrane
System, Poster presentation in Experimental Biology 2006, San Francisco, CA
• S. Datta, P. D. Ray, A. Nath, D. Bhattacharyya, Recognition Based Separation of
Proteins Using Avidin-Biotin Interaction in MF Membranes, Oral presentation in
2005 Eastern Regional Chemical Engineering Graduate Symposium organized by
University of West Virginia, Morgantown, WV
• S. Datta, P. D. Ray, A. Nath, D. Bhattacharyya, Recognition based separation of
proteins using avidin-biotin interaction in modified stacked microfiltration
membranes, Oral presentation in 2005 Annual Meeting of North American
Membrane Society, Providence, RI
• S. Datta, A. Nath, D. Bhattacharyya, Recognition based separation of biotinylated-
protein using surface modified microfiltration membranes, Poster presentation in
2004 Annual Meeting of American Institute of Chemical Engineers, Austin, TX
204