Embed Size (px)
Citation preview
Functionality of Banks and Hedge Funds and
Contagion Between Financial Institutions: A System Dynamics Approach
Wednesday, March 13
Mila Getmansky
Andrew W. Lo
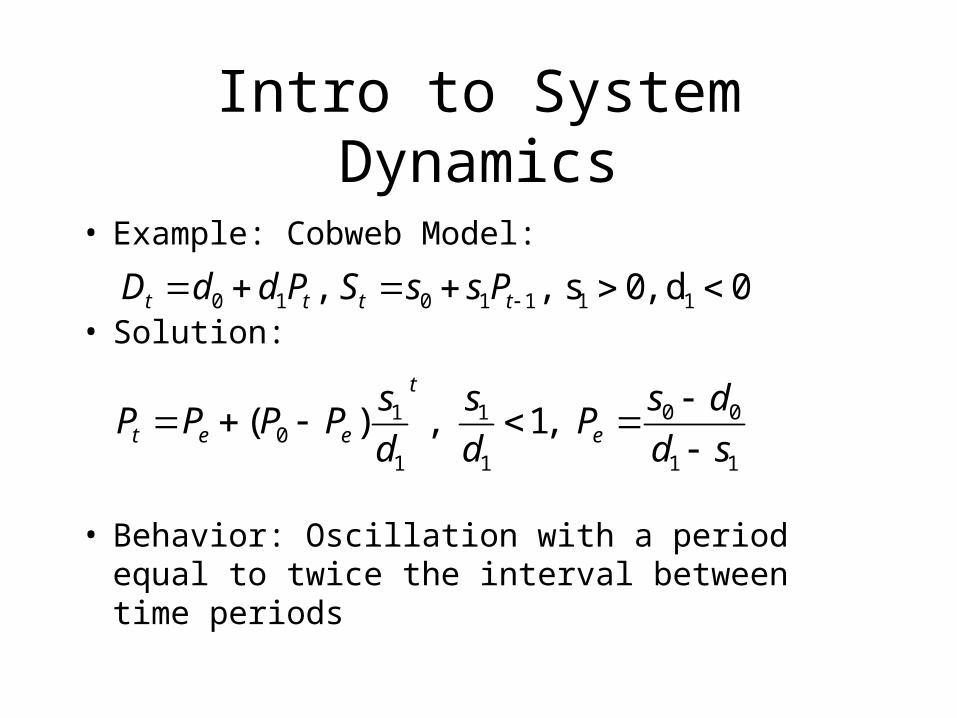
Intro to System Dynamics
• Example: Cobweb Model:
• Solution:
• Behavior: Oscillation with a period equal to twice the interval between time periods
0 1 0 1 1 1 1, , s 0, d 0t t t tD d d P S s s P
0 01 10
1 1 1 1
( ) , 1, t
t e e e
s ds sP P P P P
d d d s
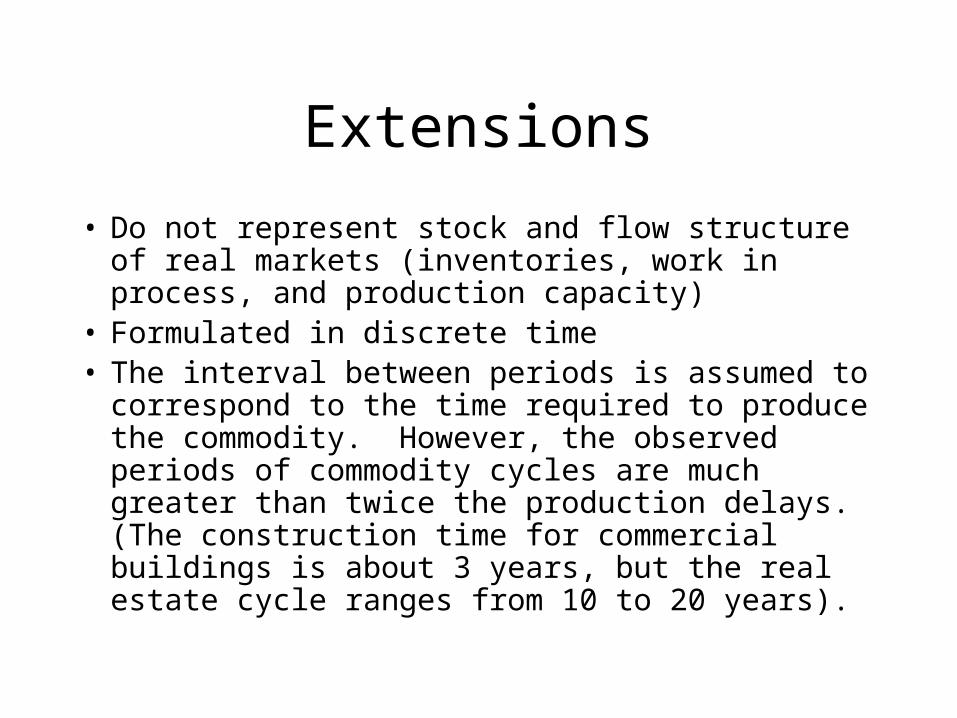
Extensions
• Do not represent stock and flow structure of real markets (inventories, work in process, and production capacity)
• Formulated in discrete time• The interval between periods is assumed to
correspond to the time required to produce the commodity. However, the observed periods of commodity cycles are much greater than twice the production delays. (The construction time for commercial buildings is about 3 years, but the real estate cycle ranges from 10 to 20 years).
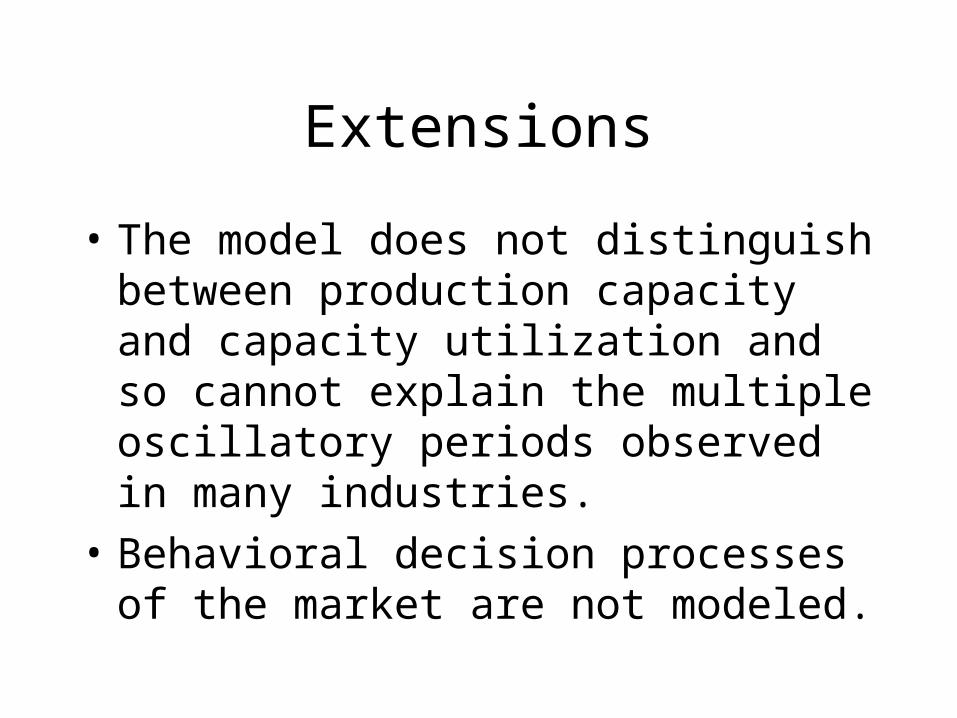
Extensions
• The model does not distinguish between production capacity and capacity utilization and so cannot explain the multiple oscillatory periods observed in many industries.
• Behavioral decision processes of the market are not modeled.
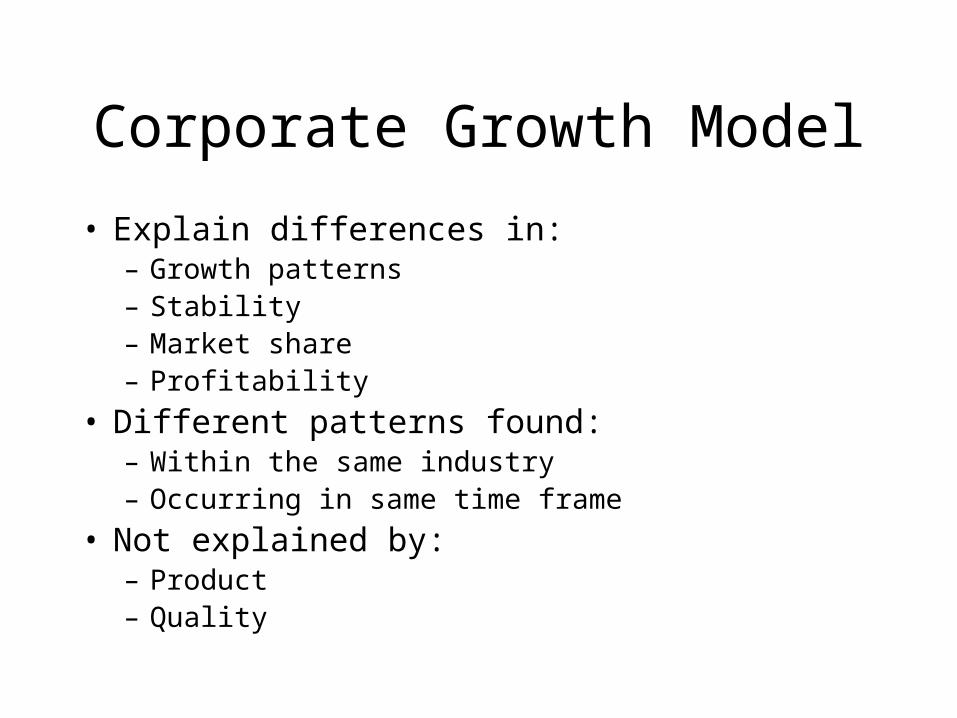
Corporate Growth Model
• Explain differences in: – Growth patterns– Stability– Market share– Profitability
• Different patterns found:– Within the same industry– Occurring in same time frame
• Not explained by:– Product– Quality
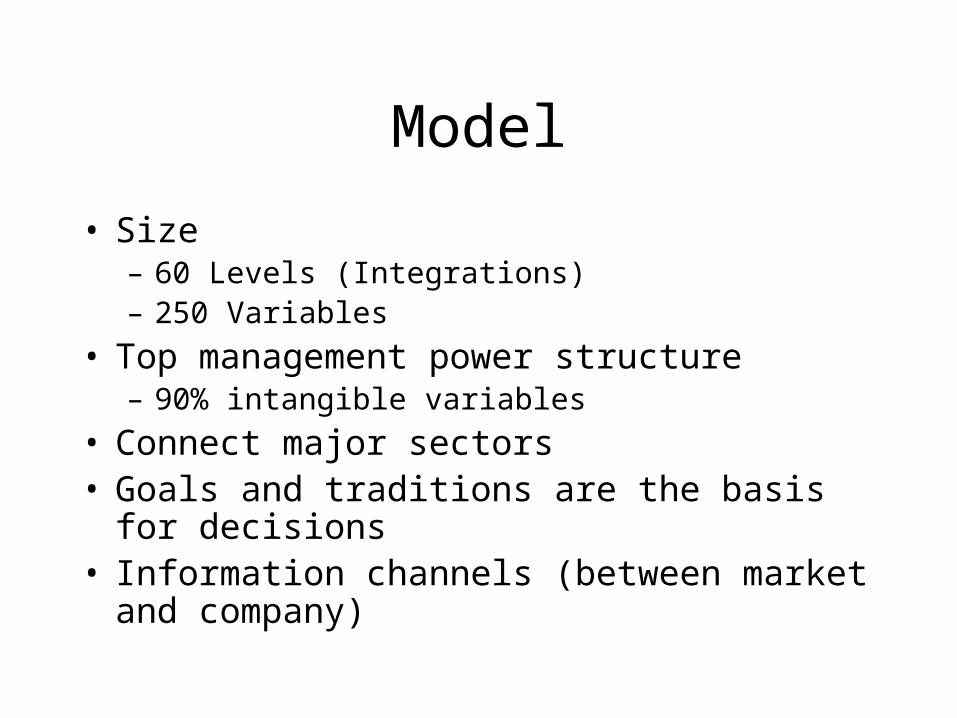
Model
• Size– 60 Levels (Integrations)– 250 Variables
• Top management power structure– 90% intangible variables
• Connect major sectors• Goals and traditions are the basis for decisions• Information channels (between market and
company)
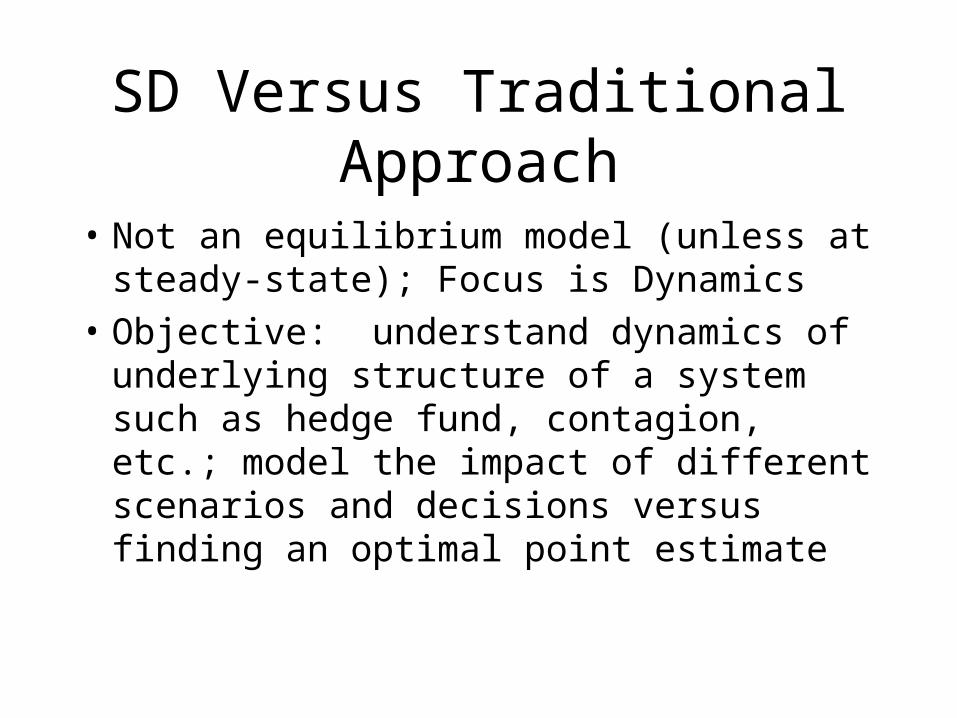
SD Versus Traditional Approach
• Not an equilibrium model (unless at steady-state); Focus is Dynamics
• Objective: understand dynamics of underlying structure of a system such as hedge fund, contagion, etc.; model the impact of different scenarios and decisions versus finding an optimal point estimate
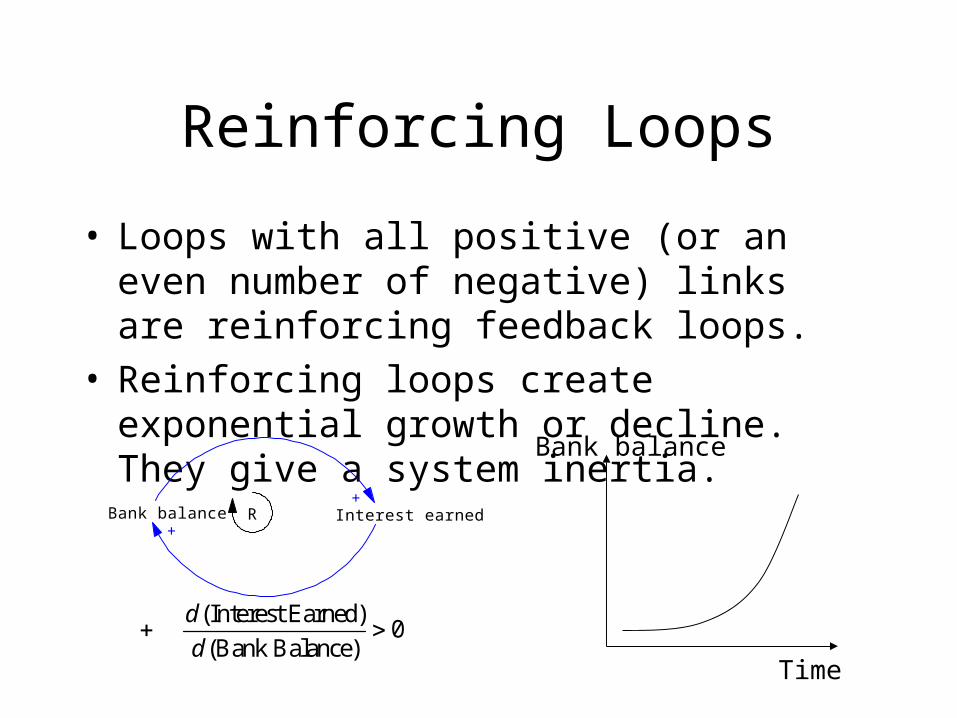
Reinforcing Loops
• Loops with all positive (or an even number of negative) links are reinforcing feedback loops.
• Reinforcing loops create exponential growth or decline. They give a system inertia.
Bank balance Interest earned+
+R
Time
Bank balance
(Interest Earned) 0
(Bank Balance)
d
d
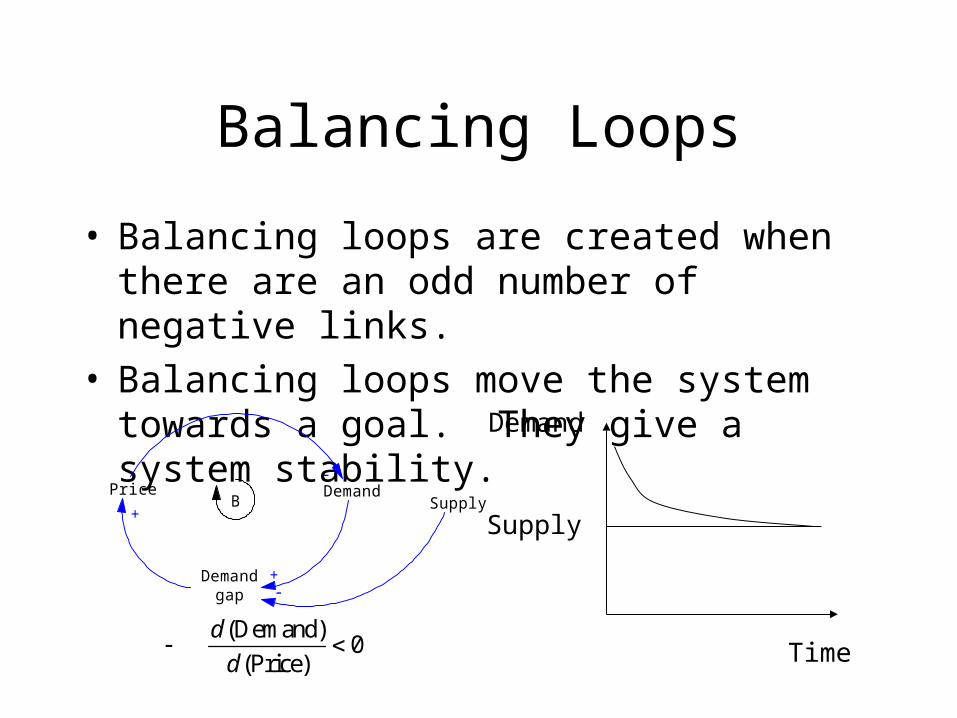
Balancing Loops
• Balancing loops are created when there are an odd number of negative links.
• Balancing loops move the system towards a goal. They give a system stability.
Price Demand-
B
Demandgap
+
+Supply
-
Time
Demand
Supply
(Demand) 0
(Price)
d
d
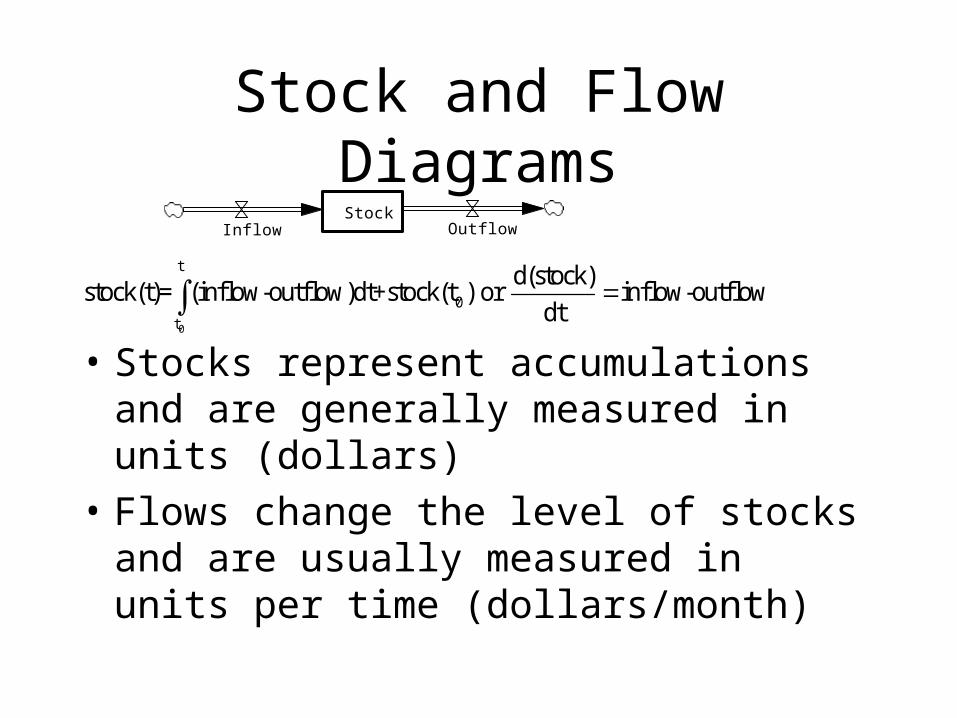
Stock and Flow Diagrams
• Stocks represent accumulations and are generally measured in units (dollars)
• Flows change the level of stocks and are usually measured in units per time (dollars/month)
0
t
0
t
d(stock)stock(t)= (inflow-outflow)dt+stock(t ) or inflow-outflow
dt
StockInflow Outflow
Hedge Funds – An Overview
• What are hedge funds?– Unregulated investment partnerships available
to wealthy individuals and institutions (“sophisticated accredited investors”)
– Seek above-average returns using aggressive, high-risk strategies unavailable to mutual funds and other traditional money managers
More on Hedge Funds
• Investing strategies include, but are not limited, to:– Short selling
– Leverage
– Arbitrage
– Derivatives
• Compensation structure is as follows:– Percentage of assets under management (usually 1%)
– Percentage of profits (usually 20%)
Why Are Hedge Funds Interesting?
• Due to their unregulated nature, hedge funds can take on huge positions, affect market dynamics and cause financial collapses:– LTCM in the 1997 Asian crisis and the 1998 Russian
debt crisis ($3.6 billion bailout plan to rescue the fund)– Soros in the 1992 ERM crisis (funded a $10 billion short
position in sterling, using collateral and margins)
• Understanding the role of hedge funds in the global financial markets might help prevent future crises
Types of Hedge Funds
• Major investment styles are the following:– Macro funds
– Global funds
– Long only funds
– Market-neutral funds
– Sectoral hedge funds
– Dedicated short sales funds
– Event-driven funds
– Funds of funds
More Types of Hedge Funds
• Additional categories of hedge funds include:– Special situation funds
– Pure equity funds
– Convertible arbitrage funds
– Commodity trading advisor funds
– Private equity funds
– Risk arbitrage funds
– Emerging market funds
– Restructured or defaulted security funds
Objective of Paper
• Understand the conditions under which a financial institution (hedge fund or bank) can fail
• Determine when the collapse of such an institution can trigger a contagion effect that leads to the failure of another institution
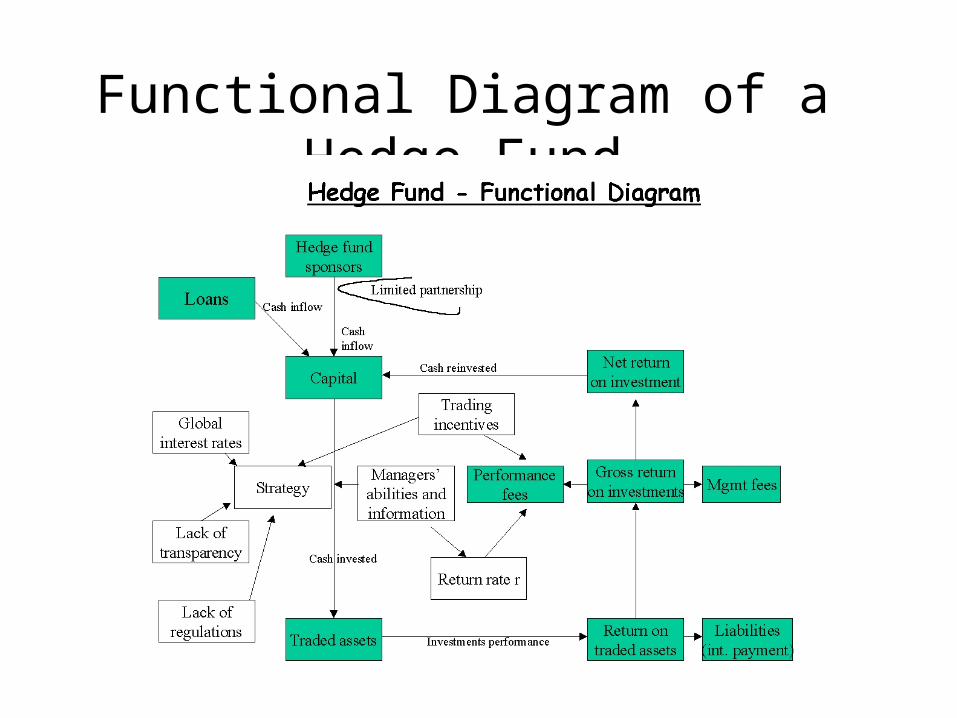
Functional Diagram of a Hedge Fund
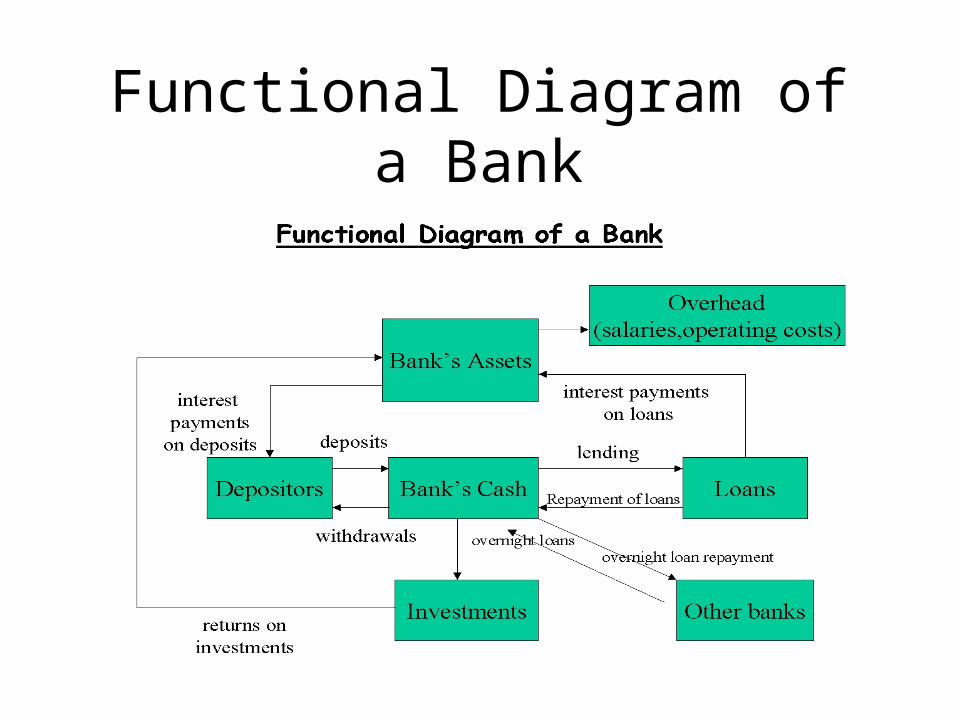
Functional Diagram of a Bank
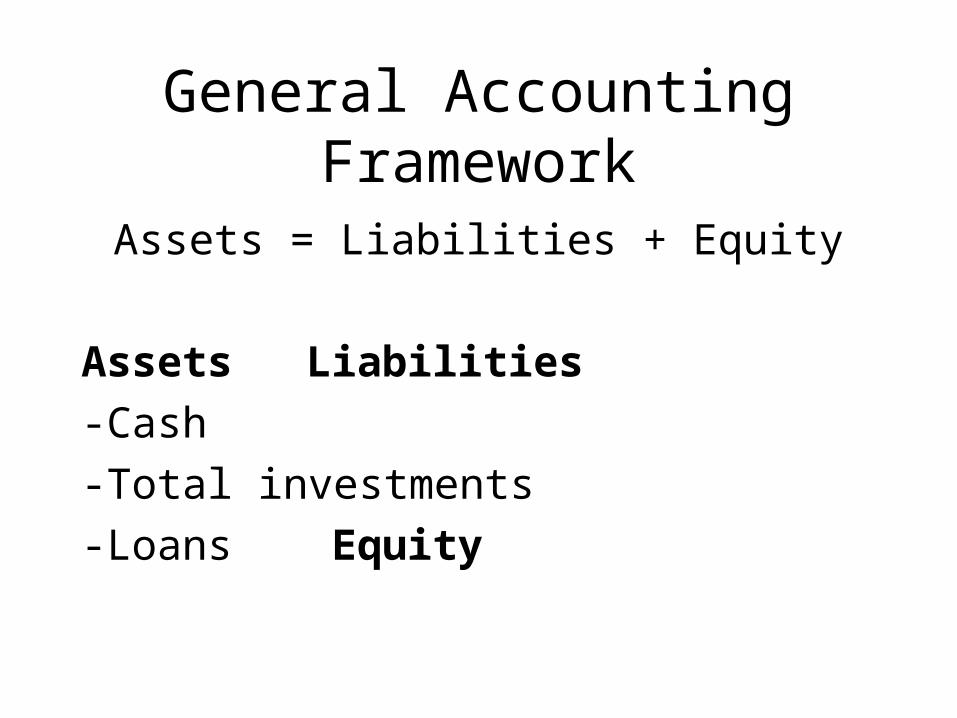
General Accounting Framework
Assets = Liabilities + Equity
Assets Liabilities
-Cash
-Total investments
-Loans Equity
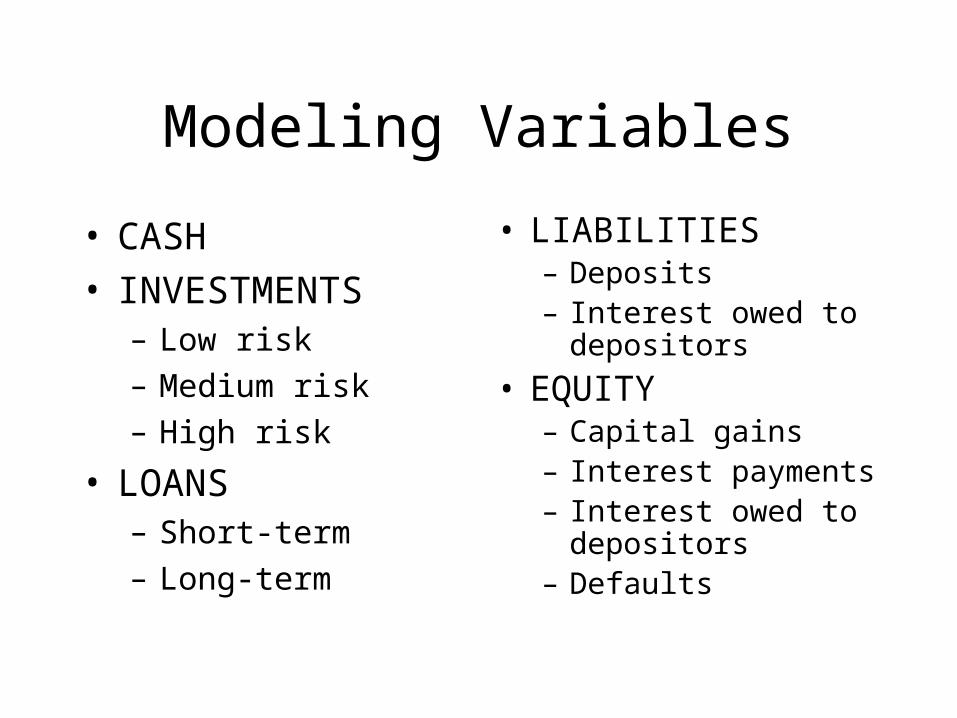
Modeling Variables
• CASH• INVESTMENTS
– Low risk
– Medium risk
– High risk
• LOANS– Short-term
– Long-term
• LIABILITIES– Deposits– Interest owed to
depositors
• EQUITY– Capital gains– Interest payments– Interest owed to
depositors– Defaults
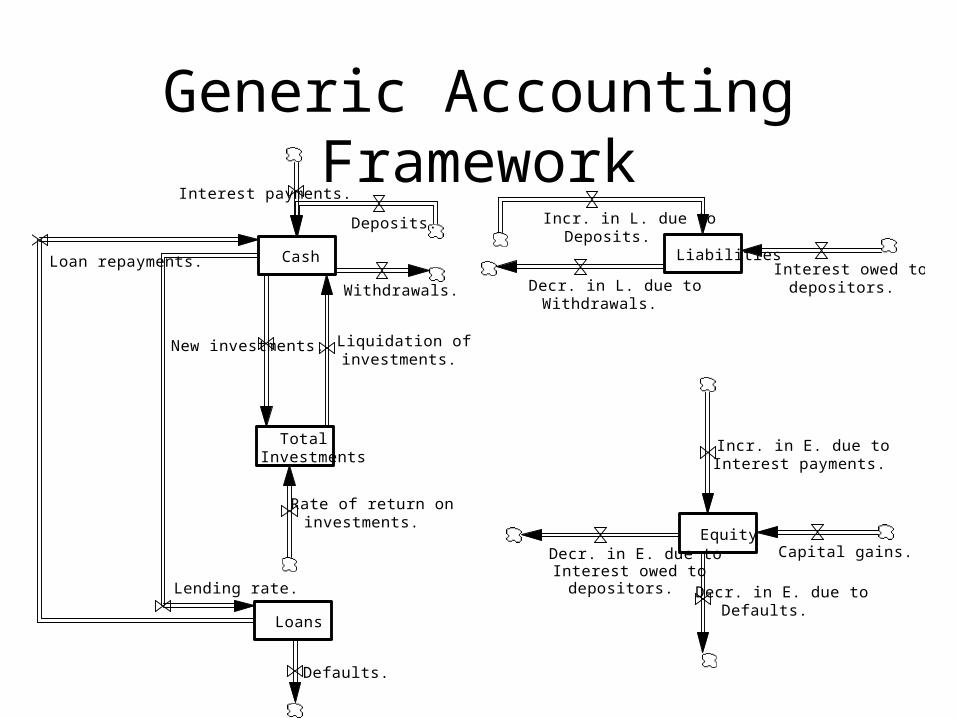
Generic Accounting Framework
Cash
TotalInvestments
Loans
Liabilities
Equity
Lending rate.
Loan repayments.
Liquidation ofinvestments.
New investments.
Interest payments.
Rate of return oninvestments.
Defaults.
Decr. in E. due toDefaults.
Capital gains.
Interest owed todepositors.
Incr. in E. due toInterest payments.
Withdrawals.
Incr. in L. due toDeposits.
Decr. in L. due toWithdrawals.
Deposits.
Decr. in E. due toInterest owed to
depositors.
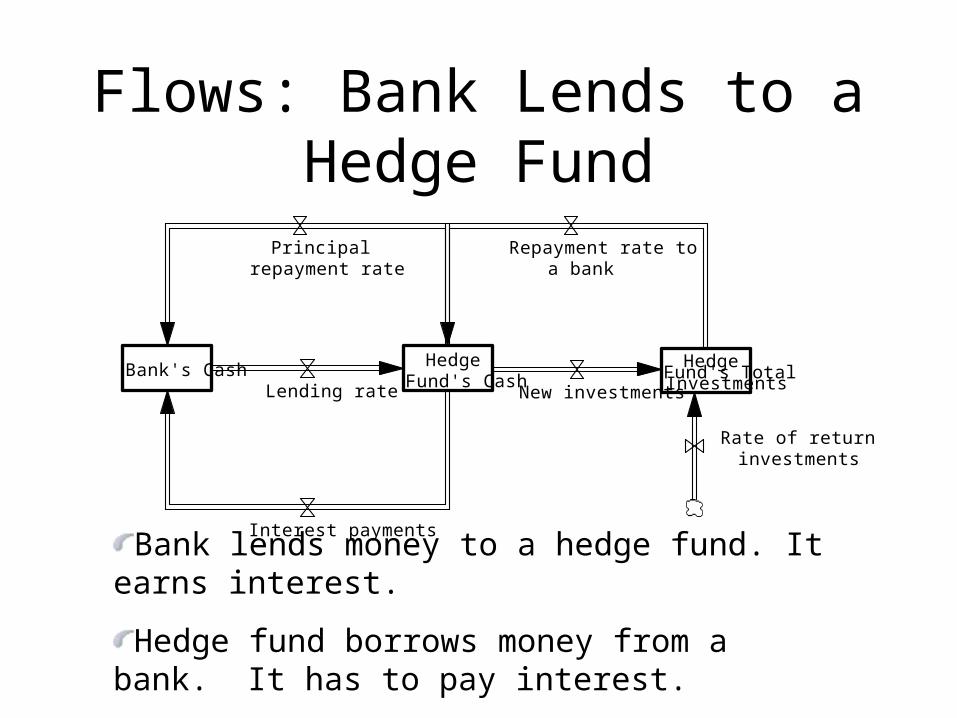
Flows: Bank Lends to a Hedge Fund
Bank's CashHedge
Fund's CashHedge
Fund's TotalInvestmentsNew investmentsLending rate
Interest payments
Principalrepayment rate
Repayment rate toa bank
Rate of return oninvestments
Bank lends money to a hedge fund. It earns interest.
Hedge fund borrows money from a bank. It has to pay interest.
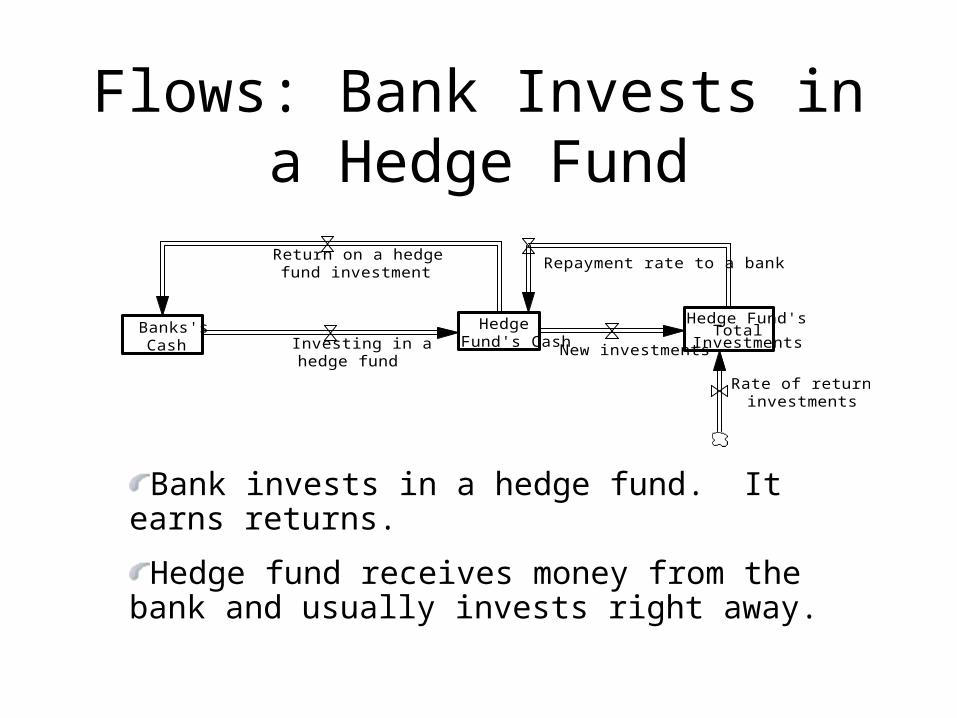
Flows: Bank Invests in a Hedge Fund
Banks'sCash
HedgeFund's Cash
Return on a hedgefund investment
Investing in ahedge fund
Hedge Fund'sTotal
InvestmentsNew investments
Rate of return oninvestments
Repayment rate to a bank
Bank invests in a hedge fund. It earns returns.
Hedge fund receives money from the bank and usually invests right away.
Ways a Bank Can Fail, Equity<0, Reserve Ratio<Required RR
• No capital gains (capital losses)– Bank does not make prudent decisions in risky
investments– Market collapses– Hedge fund makes poor investments
• Defaults on principal– Hedge fund or another borrower defaults on
loans• Defaults on interest payments
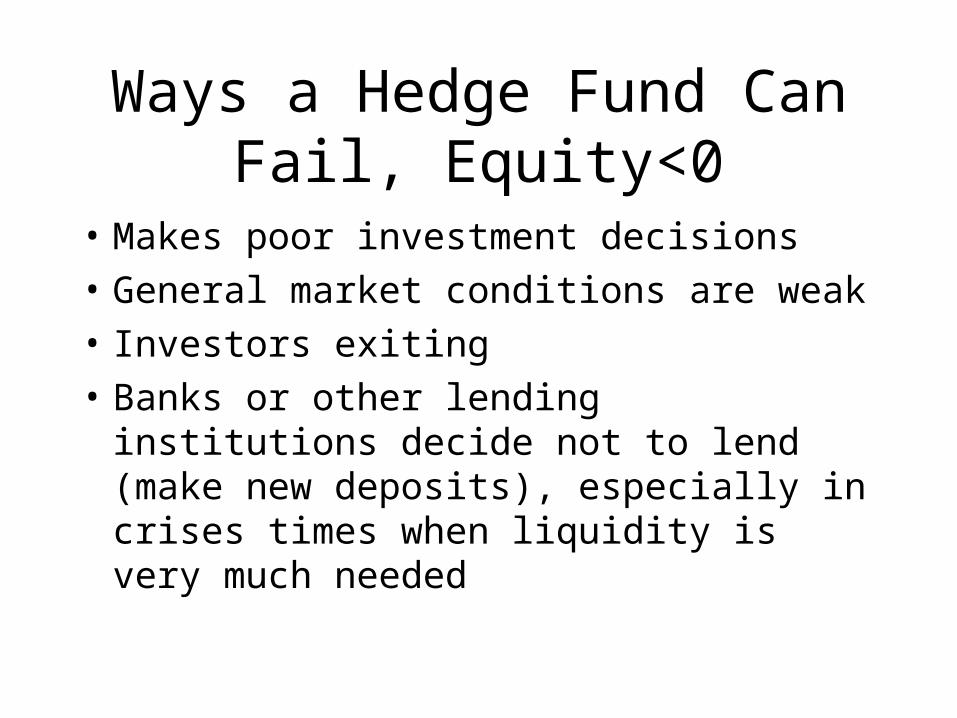
Ways a Hedge Fund Can Fail, Equity<0
• Makes poor investment decisions
• General market conditions are weak
• Investors exiting
• Banks or other lending institutions decide not to lend (make new deposits), especially in crises times when liquidity is very much needed
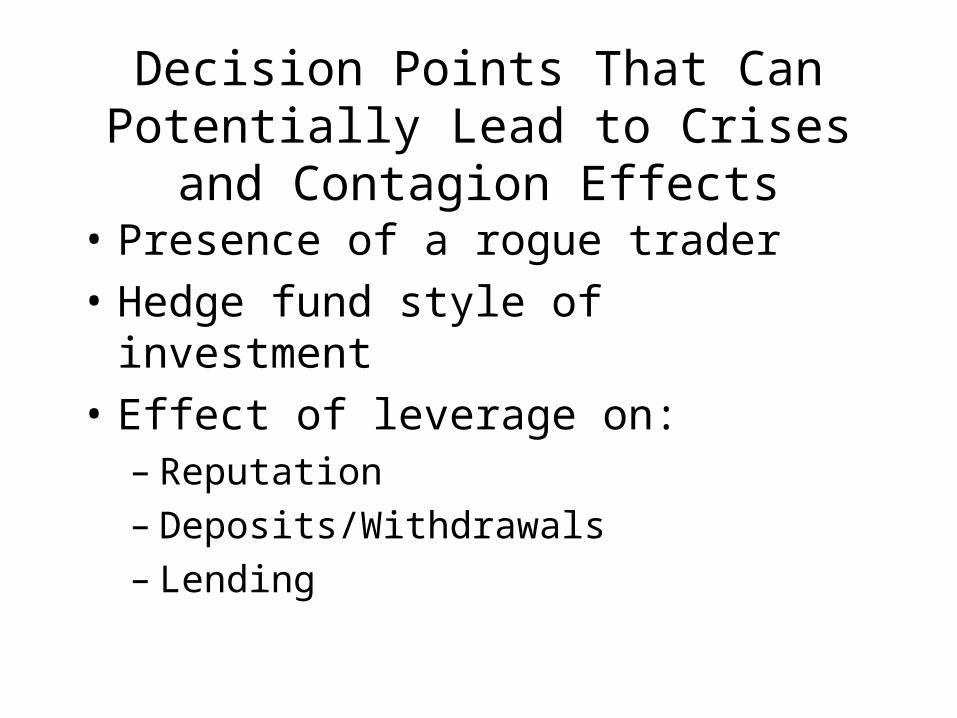
Decision Points That Can Potentially Lead to Crises and Contagion Effects
• Presence of a rogue trader
• Hedge fund style of investment
• Effect of leverage on: – Reputation– Deposits/Withdrawals– Lending
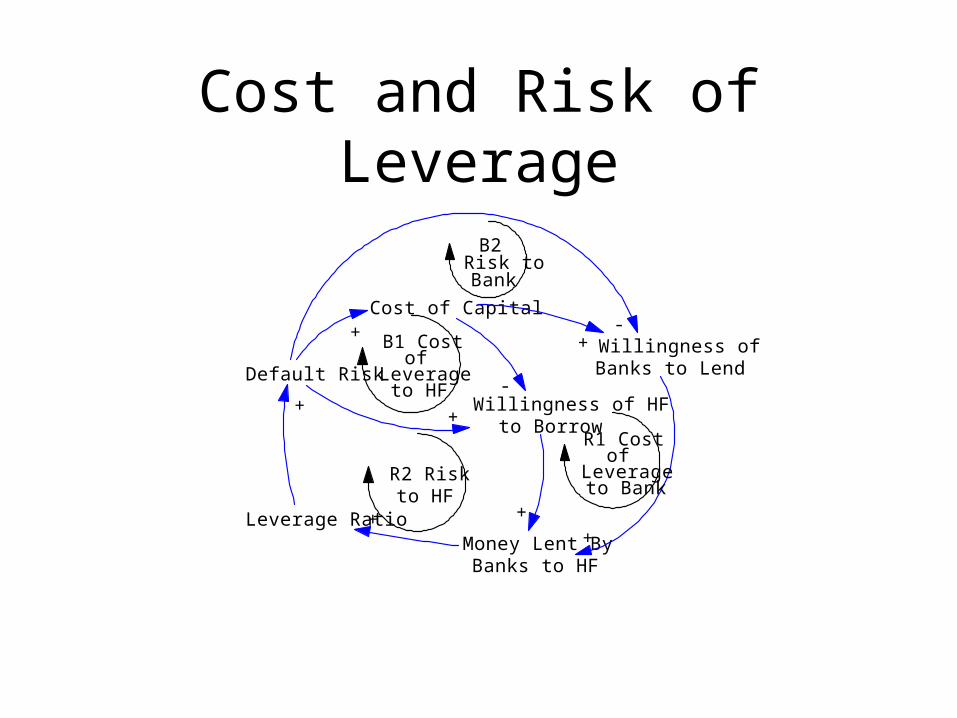
Cost and Risk of Leverage
Leverage Ratio
Default Risk
Cost of Capital+
Money Lent ByBanks to HF
Willingness of HFto Borrow
-
++
B1 Costof
Leverageto HF
+
Willingness ofBanks to Lend
+
+
R1 Costof
Leverageto Bank
+
-
R2 Riskto HF
B2Risk toBank
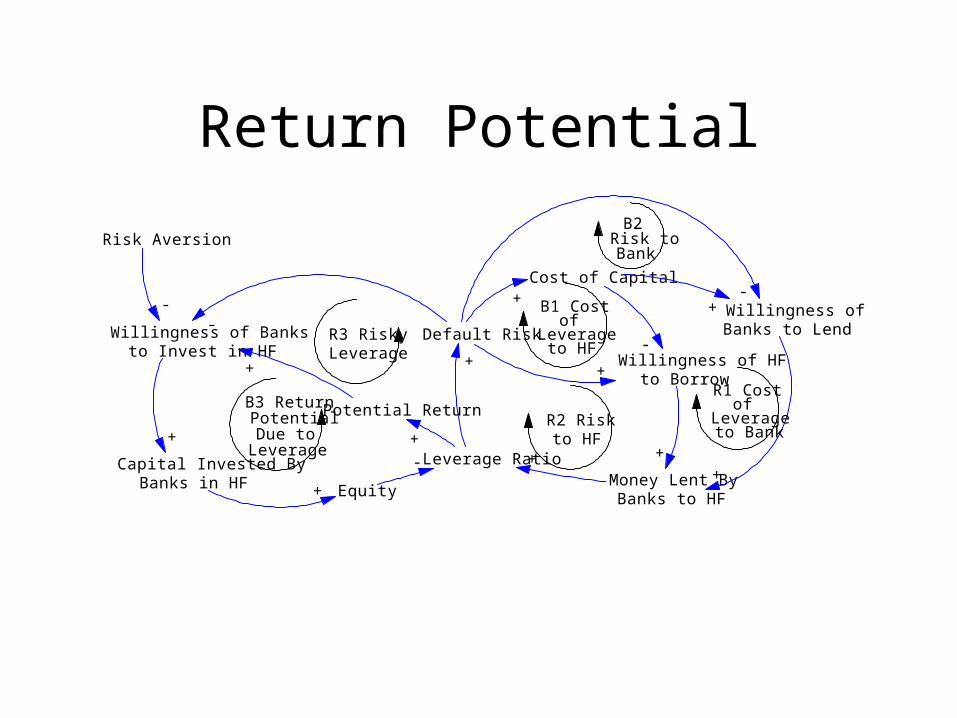
Return Potential
Capital Invested ByBanks in HF
Leverage Ratio
Default Risk
Cost of Capital+
Money Lent ByBanks to HF
Willingness of HFto Borrow
-
++
B1 Costof
Leverageto HF
Willingness of Banksto Invest in HF
-
+
Equity+
-
R3 RiskyLeverage +
Potential Return
+
+
B3 ReturnPotentialDue to
Leverage
Risk Aversion
- Willingness ofBanks to Lend
+
+
R1 Costof
Leverageto Bank
+
-
R2 Riskto HF
B2Risk toBank
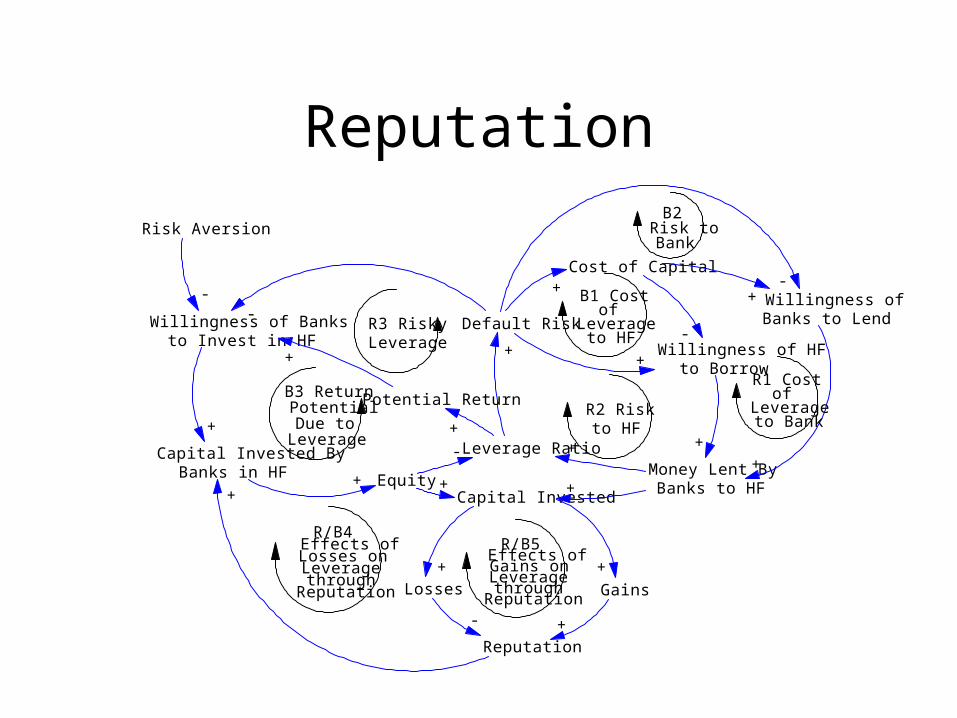
Reputation
Capital Invested ByBanks in HF
Leverage Ratio
Default Risk
Cost of Capital+
Money Lent ByBanks to HF
Willingness of HFto Borrow
-
++
B1 Costof
Leverageto HF
Willingness of Banksto Invest in HF
-
+
Equity+
-
R3 RiskyLeverage +
Losses Gains
Reputation
- +
+
R/B5Effects ofGains onLeveragethrough
Reputation
R/B4Effects ofLosses onLeveragethrough
Reputation
Potential Return
+
+
B3 ReturnPotentialDue to
Leverage
Risk Aversion
- Willingness ofBanks to Lend
+
+
R1 Costof
Leverageto Bank
Capital Invested+ +
++
+
-
R2 Riskto HF
B2Risk toBank
Rogue Trader
• Losses
• Bets
• Probability of a rogue trader
• Skill
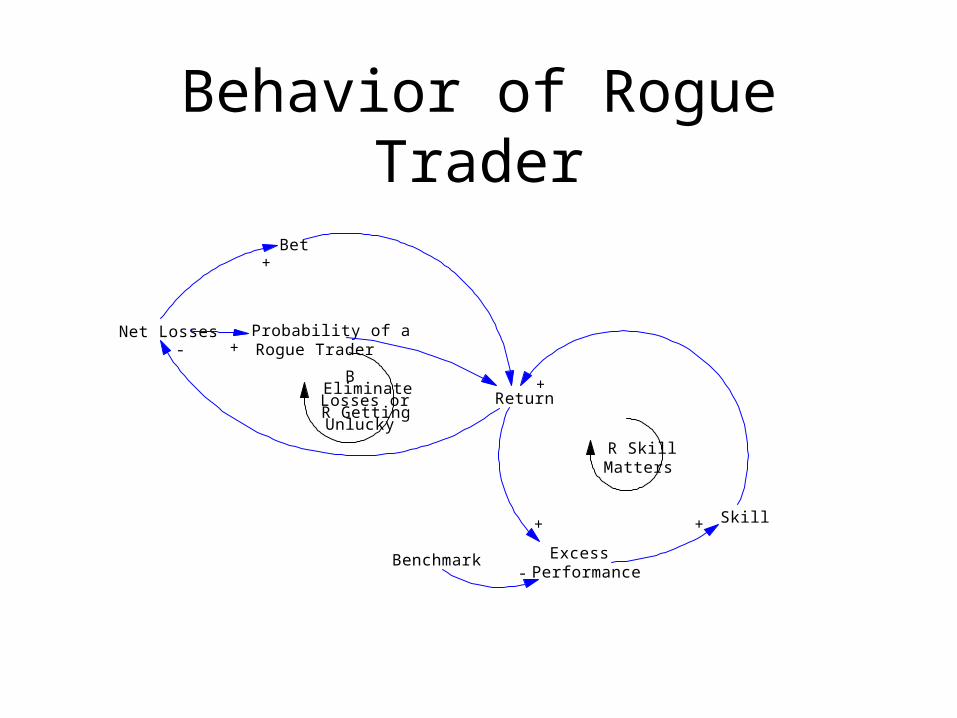
Behavior of Rogue Trader
Net Losses
Bet
Return
Skill
ExcessPerformance
Benchmark
+
+
+
-
Probability of aRogue Trader
+
+-
R SkillMatters
BEliminateLosses orR GettingUnlucky
Summary and Conclusions
• Dynamics Are Critical
• Effects Are Highly Nonlinear
• Implications for:– Credit– Liquidity– Volatility– Regulatory Environment