Embed Size (px)
Citation preview

Tree transpiration varies spatially in response toatmospheric but not edaphic conditions
Elizabeth Traver1, Brent E. Ewers*,1,2, David S. Mackay3 and Michael M. Loranty3
1Department of Botany, University of Wyoming, Laramie, Wyoming 82071, USA; 2Program in Ecology, University of
Wyoming, Laramie, Wyoming 82071, USA; and 3Department of Geography, SUNY-Buffalo, Buffalo, New York 14260,
USA
Summary
1. Measuring transpiration simultaneously in time and space can establish a better understand-ing of how to mechanistically scale spatiotemporal values.
2. This study tested the following predictions to falsify a tree hydraulic hypothesis of spatial var-iation in transpiration: (i) stands with larger trees will a have longer range and greater sill and
nugget at a given vapour pressure deficit (D); (ii) the range, sill and nugget will decline faster withincreasing D with larger trees; and (iii) soil moisture, texture and ⁄or N levels will be correlated
with transpiration.3. We used cyclic sampling to efficiently collect spatial sap flux data from 144 trees in two
forested stands in northern Wisconsin: an Aspen-dominated stand with small trees and aMaple–Pine-dominated stand with larger trees.4. In the Maple stand, the range of spatial autocorrelation in half-hourly transpiration dropped
from 80 to 20 m with increased D, whereas in the Aspen stand the range dropped from 55 to35 m with a similar increase in D.
5. Differences in the range of spatial autocorrelation at a given D were driven by sapwood area,which is a function of tree size.
6. These results show that species and tree size as well as individual tree hydraulics drive spatialvariability in transpiration with little additional variation explained by the measured edaphic
conditions.7. Scaling from individual tree transpiration to the landscape in time and space should incorpo-
rate atmospheric drivers in time and investigate other potential drivers of tree size in space suchas light competition.
Key-words: geostatistics, scaling, sapflux, plant hydraulics, vapour pressure deficit
Introduction
Most ecological processes occur in patches or are distrib-
uted along gradients, and this non-stochastic distribution
violates the assumptions of classical statistics (Robertson
1987; Legendre & Fortin 1989; Legendre 1993). Legendre
(1993) suggests that spatial or temporal autocorrelation in
ecosystem properties promotes diversity of species and
functional traits, and that small scales will exhibit autocor-
relation, whereas larger scales will exhibit trends. This prop-
erty of temporal and spatial autocorrelation has been
observed at practically all scales (Legendre 1993) from
microbe (Franklin et al. 2002) to landscape (Bishop, Sch-
roder & Colby 2003) and forms an important foundation of
the structure of ecological communities (Reiners & Driese
2004). Recent work on tree transpiration suggests spatial
properties are connected to drivers in time (Adelman, Ewers
& Mackay 2008; Loranty et al. 2008) but has not tested
how these connections may change with different stand
types. This study compares the spatial dynamics in tree
transpiration of two stands varying in species composition
and structure.
Tree transpiration, because it can be estimated continu-
ously via sapflux (Granier 1987), scaled between stems and
leaves with allometrics (Wullschleger, Meinzer & Vertessy
1998), and has a relatively well-understood mechanistic basis
(Sperry et al. 2002), serves as an excellent venue for quantify-
ing connections between temporal and spatial controls over
ecosystem patchiness. Transpiration varies over a diurnal
cycle that is driven by vapour pressure deficit (D), due to tree*Correspondence author. E-mail: [email protected]
! 2009 The Authors. Journal compilation ! 2009 British Ecological Society
Functional Ecology 2010, 24, 273–282 doi: 10.1111/j.1365-2435.2009.01657.x

hydraulic responses and photosynthetically active radiation
(Q0) at a particular soil moisture content (Whitehead et al.
1996; Hinckley et al. 1998). Stomatal conductance responds
to the rate of water loss at the leaf level and is limited by the
product of hydraulic conductivity (k) and the water potential
gradient (W) between leaves and soil (Franks, Drake & Fro-
end 2007). This limitation results in a saturating relationship
between transpiration andD due to hydraulic stress with trees
having a larger initial stomatal conductance declining faster
(Oren et al. 1999; Ewers et al. 2005). Hydraulic stress in trees
is further increased by coarser soil texture (Hacke et al. 2000),
increased soil N (Ewers, Oren & Sperry 2000) and decreased
light conditions in the canopy (Schafer, Oren & Tenhunen
2000).
Recent work has shown that transpiration demonstrates
spatial autocorrelation that is driven temporally by D (Adel-
man, Ewers & Mackay 2008; Loranty et al. 2008). The most
relevant spatial parameters within each range of temporal
environmental drivers (e.g. low D or high D) are the range
that is the distance of spatial autocorrelation, sill that is the
maximum spatial variation and the nugget the minimum spa-
tial variation. As predicted from a plant hydraulics hypothe-
sis of spatial variation in time driven by D (Adelman, Ewers
&Mackay 2008; Loranty et al. 2008), whenD is low, trees are
not hydraulically stressed and most trees’ stomatal conduc-
tance is high, the range is relatively long and the sill and nug-
get are low. When D is high, most trees are hydraulically
stressed, and so individual tree variability in stomatal
response leads to a shorter range and larger sill and nugget.
No studies have tried to expand the predictions of the hydrau-
lic hypothesis of these temporal (response to D) and spatial
(change in range, sill or nugget with increasingD) patterns to
edaphic conditions other than soil moisture or have
attempted to predict how changing patterns of trees size will
influence the rate of change in the spatial patterns.
We compared two stands in northernWisconsin to test the
relationship between edaphic conditions and spatiotemporal
patterns of transpiration across varying species composition
and stand structure. One stand had a forested wetland domi-
nated by alder (Alnus incana L. Moench) that transitioned
into an upland with trembling aspen (Populus tremuloides
Michx) whereas the other stand was a mix of much larger
sugar maple (Acer saccharumMarsh) and red pine (Pinus res-
inosa Ait). We predict that the (i) stand with larger trees will
a have longer range and greater sill and nugget at a given D;
(ii) the range, sill and nugget will decline faster with increasing
D in the stand with large trees; and (iii) soil moisture, texture
and ⁄or N levels will be correlated with transpiration within a
stand.
Materials and methods
STAND DESCRIPT IONS
The stands, hereafter referred to as Aspen and Maple for the most
common species in each, are located in northernWisconsin near Park
Falls in the Chequamegon-Nicolet National Forest, c. 800 m south-
east and north-east, for Aspen and Maple respectively, of the WLEF
eddy covariance tall tower (45Æ945"N, 90Æ272"W; Bakwin et al. 1998;
part of the Chequamegon Ecosystem Atmospher Study, ChEAS).
These stands encompass the four major forest cover types that char-
acterize the region (Burrows et al. 2002). The bedrock is comprised of
Precambrian metamorphic and igneous rock, overlain by 8–90 m of
glacial and glaciofluvial material deposited c. 10–12 thousand years
before present. The topography is slightly rolling with an elevation
range of tens of metres while outwash, pitted outwash and moraines
(a)
(b)0–20 m
0–15 m
Fig. 1. Layout of tree measurements in cyclic plot designs in (a)Aspen stand and (b) Maple stand, with single letters representing thelocation of the sample plot centre. Soil samples were taken along eachof the dotted transects. NW corner of A dominated by white cedar(Thuja occidentalis) not analyzed in this study, boldedMD in (b) rep-resents the sugar maple dominated areas and the grey area representsthe red pine dominated area (bolded PD). Locations with M ⁄P orP ⁄M are mixed red pine or sugar maple. Scales for each map are inmetres.
! 2009 The Authors. Journal compilation ! 2009 British Ecological Society, Functional Ecology, 24, 273–282
274 E. Traver et al.

are the dominant geomorphic landforms. The climate is cool conti-
nental with annual precipitation of c. 800 mm and mean January and
July temperatures of 19 "C and)12 "C respectively.
TheAspen stand (tree age = 20 years) has a soil moisture gradient
from a wetland in the northwest corner to drier uplands in the other
three corners (Fig. 1), although the elevational gain was only about
2 m. The drier uplands are dominated by trembling aspen (Populus
tremuloides) whereas speckled alder (Alnus incana) are prevalent in
the lower, poorly drained wetlands with Sphagnum spp. present in all
hummocks. On 9 June 2005 (one of the days soil moisture measure-
ments were made), the wetlands averaged 60%, the transition 20%
and the uplands <15% volumetric soil moisture. These results were
used to divide the stand into three areas based on average soil volu-
metric water content values (Table 1, Fig. 1).
The Maple stand is dominated by sugar maple (Acer saccharum)
with a swath of red pine (Pinus resinosa) running diagonally through
the stand from the middle of the northern edge to the middle of the
eastern edge. There are also a few red pines scattered throughout the
rest of the stand. All of the red pines are the remnants of a plantation.
Tree ages are 50 and 50–70 years for red pine and sugarmaple respec-
tively. The plot was divided into two areas (sugar maple dominated
and red pine dominated) because of the distinctive patterning of the
species (Fig. 1).
SAMPL ING DES IGN
A 3 ⁄ 7 cyclic sampling design that maximizes spatial information with
a minimal number of samples (Burrows et al. 2002) was used to deter-
mine the location of plots. From preliminary soil moisture and basal
area spatial measurements described in Loranty et al. (2008), the plot
locations were based on a 5-m plot diameter for the Aspen stand and
a 6Æ6-m plot diameter was chosen for the Maple stand as the trees are
larger and spaced further apart. Additionally, the two sides of the
Maple stand grid mirror each other to increase the number of plots in
the sugar maple–red pine transition areas. Each stand has 144 plots so
the Aspen stand was 120 · 120 m, and the Maple stand was
132 · 140 m (Fig. 1).
SAP FLUX MEASUREMENTS
Details of sap flux sampling are in Table 2. Transpiration per xylem
areas (JS) was measured with constant-heat sensors (Granier 1987)
during June–August of 2005. One sensor pair was placed on the north
side of each tree; the intra-tree scaling was from Ewers et al. (2002)
and accounts for bark thickness, sapwood depth and radial and
circumferential trends in sap flux. The largest tree in each plot was
chosen for the sap flux sensor and a second if it was also dominant.
Adelman, Ewers & Mackay (2008) and Loranty et al. (2008) justified
this sampling design because tree size impacts on sap flux can still be
investigated when many trees are sampled. Sap flux measurements
were recorded every 30 s and averaged to 30 min values with a data
logger (CR10X; Campbell Scientific, Logan, UT, USA). To include
nighttime transpiration, baselines were determined from the maxi-
mum temperature difference over a week long period using the
approach of Oishi, Oren & Stoy (2008). Aspen and alder were
sampled in the Aspen stand as they were the dominant species in each
soil moisture area (Loranty et al. 2008). Sugar maple and red pine
were the only canopy trees throughout theMaple stand.
CALCULAT ION OF SAP FLUX SCALARS
Sapwood area (AS) was calculated usingDBH (diameter breast height
at 1Æ3 m) and species-specific allometric equations derived from trees
on sites of similar edaphic conditions!10 km from the present study
(Ewers et al. 2002). Leaf area (AL) was calculated from allometric
relationships for foliar biomass by Ter-Mikaelian & Korzukhin
(1997) and specific leaf area estimated by Ewers, Mackay & Samanta
(2007). Canopy transpiration per tree (EC) is the product of AS and
Table 1. Comparison of soil texture andmoisture in the Aspen andMaple sites
Aspen site n % Silt % Sand % Clay nMean soil moisture (%)9 June 2005 14 July 2005
W 10 23Æ2 (10Æ6) a 63Æ5 (11Æ5) a 13Æ3 (1Æ5) a 50 59Æ4 (21Æ9) a 40Æ4 (19Æ9) aT 8 15Æ5 (3Æ8) b 72Æ1 (3Æ1) b 12Æ5 (1Æ9) a 31 19Æ3 (10Æ3) b 14Æ4 (8Æ4) bU 18 13Æ8 (2Æ7) b 73Æ9 (3Æ5) b 12Æ4 (1Æ8) a 63 14Æ6 (5Æ6) c 10Æ8 (5Æ9) bMaple site 4 August 2005
MD 6 13Æ4 (4Æ6) a 74Æ7 (4Æ1) a 11Æ9 (1Æ4) a 4 17Æ39 (3Æ4) aPD 3 17Æ8 (3Æ1) a 69Æ5 (2Æ7) b 12Æ7 (1Æ8) b 39 15Æ47 (3Æ0) b
Values with different letters are significantly different (a = 0Æ05). 9 June is a representative day and 14 July is the last and driest soil moisturetaken in the Aspen site. 4 August is the only soil measurement at the Maple site. W is wetland, T is transition, U is upland areas (Fig. 1). MDis maple dominated; PD is pine-dominated areas (Fig. 2).
Table 2. Tree species, sapflux sample size, mean size by diameterbreast height at 1Æ3 m (DBH) and mean sapwood area with standarderrors in parentheses
Species n DBH (cm) Sapwood (cm2)
Aspen standW Alder 35 5Æ27 (1Æ2) 22Æ8 (9Æ5)
Aspen 5 6Æ5 (1Æ1) 32Æ9 (10Æ4)T Alder 1 6Æ2 30Æ2
Aspen 30 9Æ56 (3Æ1) 74Æ0 (44Æ1)U Alder 5 4Æ6 (0Æ9) 17Æ1 (6Æ2)
Aspen 58 8Æ9 (2Æ9) 64Æ3 (39Æ5)Maple standMD Maple 83 22Æ2 (7Æ2) 365Æ38 (193Æ1)
Pine 22 38Æ0 (7Æ3) 946Æ53 (304Æ3)PD Maple 16 26Æ5 (9Æ8) 515Æ85 (385Æ7)
Pine 19 39Æ2 (7Æ9) 1006Æ71 (314Æ6)
W is wetland, T is transition and U is upland areas (Fig. 1). MD issugar maple dominated; PD is pine-dominated areas of the Maplestand (Fig. 1).
! 2009 The Authors. Journal compilation ! 2009 British Ecological Society, Functional Ecology, 24, 273–282
Spatial tree transpiration 275

JS. Canopy transpiration per unit leaf area (EL) is the quotientEC and
AL.
ATMOSPHERIC DATA
Temperature and relative humidity were measured (HMP 45C; Vai-
sala Oyj, Helsinki, Finland) at 2 ⁄ 3 (!7 m) canopy height at theAspen
stand to calculate vapour pressure deficit (D). The values forD at the
Maple stand were taken from the WLEF tower data sets that can be
found on the ChEAS website (http://cheas.psu.edu/); some values
were gap-filled or interpolated when data were missing (Cook et al.
2004; Desai et al. 2005). Ewers et al. (2008) showed that stands in this
area, including other aspen and sugar maple-dominated ones, are
well-coupled to the atmosphere becauseDmeasurements at 2 ⁄ 3 can-opy height from six different stands are the same asDmeasurements
at 30 m on the WLEF tower (slope of the two measurements was not
different from 1 and the intercept was not different from 0). This also
justifies an assumption of D being spatially unaffected by varying
transpiration rates in each stand. The WLEF tower values for photo-
synthetic photon flux density (Q0) were used for both stands.
SOIL MEASUREMENTS
Prior work in these stand types has shown that low soil moisture does
not control transpiration except during times of rare drought (Mac-
kay et al. 2002; Ewers, Mackay & Samanta 2007; Samanta et al.
2008); a condition that did not occur during this study. We thus
focused our measurements on surface soil to facilitate spatial sam-
pling and to detect excessive soil moisture that would limit tree func-
tion in the wetland areas. Soil moisture was measured with a time
domain reflectometry-type probe to 6 cm (ML2· probe, HH2 mois-
ture meter; Delta-T Devises, Cambridge, UK) at three random loca-
tions in each of the 144 plots of both stands and then averaged to
obtain a plot value. The measurements were taken four times in the
Aspen stand (9 June, 13 June, 12 July, 14 July 2005) and once in the
Maple stand (4 August 2005). Mineral soil samples were collected
with a soil corer (10 · 3Æ4 cm) in both stands. Soils were oven dried
for 24 h at 40 "C (Robertson et al. 1999), and bulk density calculated.
Mineral soil samples were collected at every plot in the Aspen stand
and at 18 plots in the Maple stand (Fig. 1); a subset of 38 plots in the
Aspen stand and 9 plots in the Maple stand was analyzed for total
carbon (C), total nitrogen (N) and C : N ratios using an Elementar
Vario Analyzer (MACRO Elemental Analyzer, Hanau, Germany).
The same subset of plots in both stands was also analyzed for soil
texture (GLOBE Program 2005). The three Aspen stand transects
represented the soil moisture gradient whereas the two Maple stand
transects covered the areas dominated by the two different tree
species.
DATA REDUCT ION
Atmospheric drivers (Q0 and D) were both binned to smooth tempo-
ral variation (Ewers et al. 2007) and better quantify spatial patterns
(Loranty et al. 2008). Two methods of binning (equal points per bin
or equal sizes of bins) were tested to ensure adequate numbers of
points per bin (Martin et al. 1997; Schafer, Oren & Tenhunen 2000).
Only the equal size bins were effective. There is typically a lag between
atmospheric drivers and a tree’s response to those drivers (Schulze
et al. 1985; Phillips et al. 1997, 2009; Ford et al. 2005; Burgess &
Dawson 2008). Therefore, a cross-correlation function was used to
analyze the lag between transpiration and both D and Q0 (SYSTAT 9;
Systat Software, Inc., San Jose, CA, USA 1998) to verify they were
the same as those found by Ewers, Mackay & Samanta (2007) for
these species in nearby stands. These individual lag values were used
to adjust the transpiration values vs. D and Q0 and then the values
were rebinned.
Rain days, and days with very low daily D (<0Æ1 kPa; Phillips &
Oren 1998), were removed from the data sets because additional
errors in sap flow on such days are the result of tree transpiration,
hydraulic refilling, nighttime transpiration or low D measurement
uncertainty (Ewers &Oren 2000; Dawson et al. 2007).
GEOSTAT IST ICAL ANALYSES
Semi-variogram analysis was applied to JS, EL and EC for all D and
Q0 bins. The interpretation of semi-variograms requires empirical
models to quantify the nugget (errors ⁄ variation at distance smaller
than sampled), sill (absolute amount of variation) and range (distance
where point pairs are spatially independent). The range is of interest
for quantifying spatial autocorrelation (Isaaks & Srivastava 1989).
Both spherical and exponential models (Cressie 1993; Schabenberger
& Gotway 2005) were fitted to the data with weighted regression by
point-pair counts, minimizing residuals and maximizing r2 (Legendre
& Legendre 1998), using GS+ (ver. 7; Gamma Software, Plainwell,
MI, USA) and SIGMAPLOT (ver. 10.0; Systat).
In both stands, the method of Adelman, Ewers & Mackay (2008)
was used to exclude four outliers in the Aspen and none in the Maple
stand from the spatial analyses. Because semi-variograms require sec-
ond-order stationarity across a study site (Cressie 1993; Schabenber-
ger & Gotway 2005), both stands were tested for drift and anisotropy
using directional variograms (GS+; Gamma Software; Isaaks &
Srivastava 1989), unpaired t-tests (Sigma Plot, San Jose, CA) between
the different areas of the stands (Fig. 1), and manual verification of
the presence of a sill (Legendre & Legendre 1998). If a significant
(a = 0Æ05) difference was found, a normalizing value equal to the
ratio of themeans was applied for second-order stationarity.
Results
TRANSPIRAT ION IN T IME AND DRIVERS
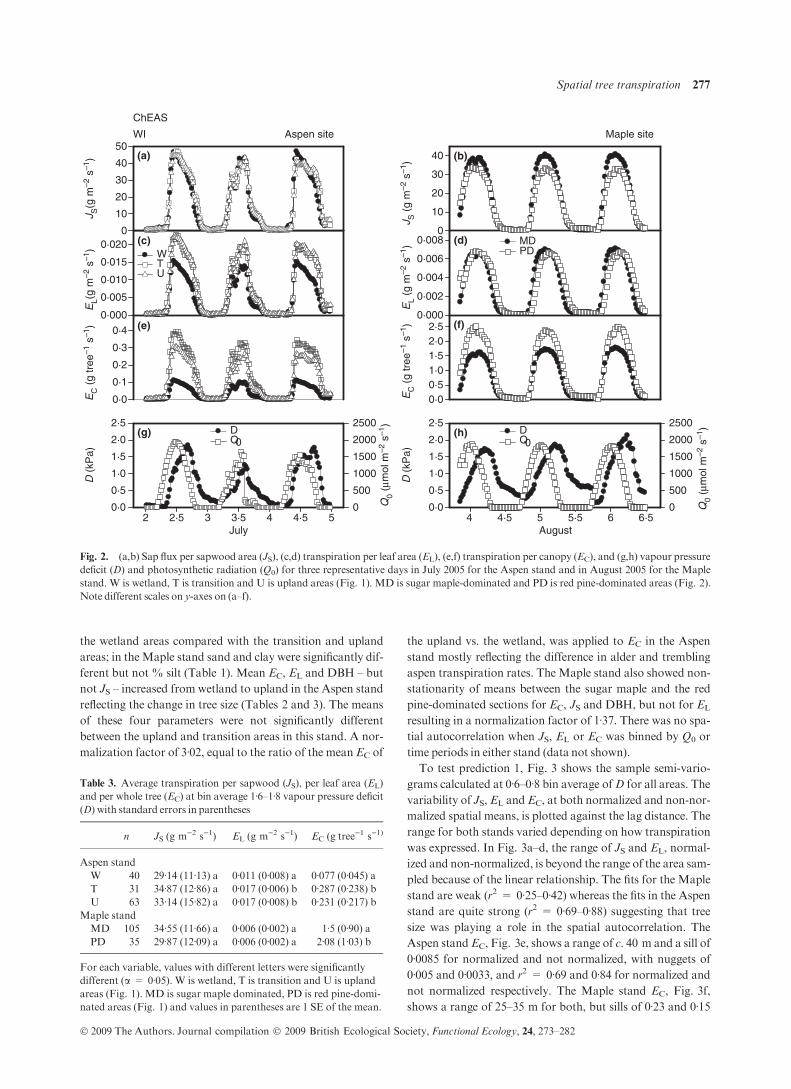
Figure 2 illustrates JS, EL and EC values of transpiration for
each of the areas within the stands, averaged half-hourly, over
a representative 3-day period. In the Aspen stand, upland and
transition trees had higher EC rates than wetlands
(P < 0Æ01), wetland EL was lowest (P < 0Æ05), but JS was
not different (P > 0Æ1). In the Maple stand, the sugar maple-
dominated areas had similar JS and EL, but significantly
lower EC (Fig. 2; P < 0Æ01) than red pine-dominated areas.
Within all species and spatial locations, the response toD and
Q0 was the same (data not shown). These results show that
the temporal response of transpiration to D or Q0 was not
dependent on tree species or size and allows us to test the
impact of tree size and species on spatial patterns.
SPAT IAL PATTERNS
To test our three predictions, we first determined how the
stand properties changed in space. In the Aspen stand, soil
moisture and % silt and sand were significantly different in
! 2009 The Authors. Journal compilation ! 2009 British Ecological Society, Functional Ecology, 24, 273–282
276 E. Traver et al.
the wetland areas compared with the transition and upland
areas; in theMaple stand sand and clay were significantly dif-
ferent but not % silt (Table 1). Mean EC, EL and DBH – but
not JS – increased from wetland to upland in the Aspen stand
reflecting the change in tree size (Tables 2 and 3). The means
of these four parameters were not significantly different
between the upland and transition areas in this stand. A nor-
malization factor of 3Æ02, equal to the ratio of the meanEC of
the upland vs. the wetland, was applied to EC in the Aspen
stand mostly reflecting the difference in alder and trembling
aspen transpiration rates. The Maple stand also showed non-
stationarity of means between the sugar maple and the red
pine-dominated sections for EC, JS and DBH, but not for EL
resulting in a normalization factor of 1Æ37. There was no spa-
tial autocorrelation when JS, EL or EC was binned by Q0 or
time periods in either stand (data not shown).
To test prediction 1, Fig. 3 shows the sample semi-vario-
grams calculated at 0Æ6–0Æ8 bin average ofD for all areas. The
variability of JS, EL andEC, at both normalized and non-nor-
malized spatial means, is plotted against the lag distance. The
range for both stands varied depending on how transpiration
was expressed. In Fig. 3a–d, the range of JS and EL, normal-
ized and non-normalized, is beyond the range of the area sam-
pled because of the linear relationship. The fits for the Maple
stand are weak (r2 = 0Æ25–0Æ42) whereas the fits in the Aspen
stand are quite strong (r2 = 0Æ69–0Æ88) suggesting that tree
size was playing a role in the spatial autocorrelation. The
Aspen standEC, Fig. 3e, shows a range of c. 40 m and a sill of
0Æ0085 for normalized and not normalized, with nuggets of
0Æ005 and 0Æ0033, and r2 = 0Æ69 and 0Æ84 for normalized and
not normalized respectively. The Maple stand EC, Fig. 3f,
shows a range of 25–35 m for both, but sills of 0Æ23 and 0Æ15
EL
(g m
–2 s
–1)
0·000
0·002
0·004
0·006
0·008
EC (
g tr
ee–1
s–1
)
0·0
0·1
0·2
0·3
0·4
EL(
g m
–2 s
–1)
0·000
0·005
0·010
0·015
0·020
Aspen site
J S(g
m–2
s–1
)
0
10
20
30
40
50
WTU
July
D (
kPa)
0·0
0·5
1·0
1·5
2·0
2·5
Q0
(µm
ol m
–2 s
–1)
0
500
1000
1500
2000
2500DQ0
2 2·5 3 3·5 4 5
ChEAS
WI
4·5
Maple site
J S (
g m
–2 s
–1)
0
10
20
30
40
MDPD
EC (
g tr
ee–1
s–1
)0·00·51·01·52·02·5
4 4·5 5August
D (
kPa)
0·0
0·5
1·0
1·5
2·0
2·5
Q0
(µm
ol m
–2 s
–1)
0
500
1000
1500
2000
2500DQ0
5·5 6 6·5
(a) (b)
(c) (d)
(e) (f)
(g) (h)
Fig. 2. (a,b) Sap flux per sapwood area (JS), (c,d) transpiration per leaf area (EL), (e,f) transpiration per canopy (EC), and (g,h) vapour pressuredeficit (D) and photosynthetic radiation (Q0) for three representative days in July 2005 for the Aspen stand and in August 2005 for the Maplestand. W is wetland, T is transition and U is upland areas (Fig. 1). MD is sugar maple-dominated and PD is red pine-dominated areas (Fig. 2).Note different scales on y-axes on (a–f).
Table 3. Average transpiration per sapwood (JS), per leaf area (EL)and per whole tree (EC) at bin average 1Æ6–1Æ8 vapour pressure deficit(D) with standard errors in parentheses
n JS (g m)2 s)1) EL (g m)2 s)1) EC (g tree)1 s)1)
Aspen standW 40 29Æ14 (11Æ13) a 0Æ011 (0Æ008) a 0Æ077 (0Æ045) aT 31 34Æ87 (12Æ86) a 0Æ017 (0Æ006) b 0Æ287 (0Æ238) bU 63 33Æ14 (15Æ82) a 0Æ017 (0Æ008) b 0Æ231 (0Æ217) b
Maple standMD 105 34Æ55 (11Æ66) a 0Æ006 (0Æ002) a 1Æ5 (0Æ90) aPD 35 29Æ87 (12Æ09) a 0Æ006 (0Æ002) a 2Æ08 (1Æ03) b
For each variable, values with different letters were significantlydifferent (a = 0Æ05). W is wetland, T is transition and U is uplandareas (Fig. 1). MD is sugar maple dominated, PD is red pine-domi-nated areas (Fig. 1) and values in parentheses are 1 SE of the mean.
! 2009 The Authors. Journal compilation ! 2009 British Ecological Society, Functional Ecology, 24, 273–282
Spatial tree transpiration 277

and nuggets of 0Æ14 and 0Æ09 for normalized and not normal-
ized respectively, and the r2 values of 0Æ48 and 0Æ49 for each
are comparable. These results falsified the range part of pre-
diction 1 but supported the nugget and sill portion. Using the
normalizing factor increased the amount of variability (the
sill) in both stands with a greater increase in the Maple. The
range was not significantly modified. Because EC is the most
relevant to stand transpiration and shows consistent spatial
autocorrelation, we focus our analyses of spatial patterns on
EC.
Figure 4 provides maps of the EC spatial trends in both
stands based on the semivariogram information. The 0Æ7 kPa
D values correspond to the semivarigrams for EC in Fig. 3
without normalization. The other panels of the figure show
spatial variability in EC with increasing D at 1Æ3 kPa D. The
amount of variability appears visually to be greater in
the Maple than the Aspen stand lending visual support to
prediction 2. Figure 5 quantitatively tests prediction 2 by
plotting the nugget, sill and range from each EC semivario-
gram against D bins. All four combinations of lagging and
normalizing are shown. The lagged values followed the non-
lagged values very closely indicating that lagging was not nec-
essary to estimate spatial autocorrelation. In both stands, the
nugget and sill show a rise in variability as well as a plateau at
the highest values. The range in Fig. 5 shows an exponential
decline, indicating that EC became more heterogeneous or
patchy with increasing D. The Maple nugget and sill had
more than 2 orders of magnitude greater variability than in
the Aspen stand reflecting the higher relative differences inEC
between the stands (Table 3); further supporting prediction 2.
TheMaple stand had a greater rate of change of range withD
(80–20 m over a change in D from 0Æ2 to 0Æ8 kPa) compared
to the Aspen site (50–36 m over 0Æ2–1Æ3 kPa) supporting our
second prediction.
h (lag distance)0 20 40 60 80 100
EC
γ (h)
0·003
0·004
0·005
0·006
0·007
0·008
0·009
EL
γ (h)
0
5e–6
1e–5
2e–5
2e–5
3e–5
3e–5
Aspen Site
J S–
γ(h)
0
50
100
150
200
250
300
350
400
Normalized
Not Normalized
r 2 = 0·69
r 2 = 0·84
r 2 = 0·69
r 2 = 0·88
r 2 = 0·77
r 2 = 0·75
ChEASWI Maple Site
J Sγ (h
)
10
20
30
40
50
60
h (lag distance)0 20 40 60 80 100
EC
γ (h)
0·08
0·10
0·12
0·14
0·16
0·18
0·20
0·22
0·24
EL
γ (h)
4·0e–7
6·0e–7
8·0e–7
1·0e–6
1·2e–6
1·4e–6
r 2 = 0·49
r 2 = 0·48
r 2 = 0·40
r 2 = 0·23
r 2 = 0·35
r 2 = 0·23
(a) (b)
(c) (d)
(e) (f)
Fig. 3. (a,b) Sap flux per sapwood area (JS), (c,d) transpiration per leaf area (EL), and (e,f) transpiration per tree canopy (EC) semi-variance onthe y-axis and lag distance on the x-axis at the 0Æ6–0Æ8 kPa D bin. Normalized refers to forced stationarity of the means across the study standsand not normalized is unconvertedmeans (Table 3). In (a–d), fitted curves are linear. In (e) and (f), a spherical model was fit to the data.
! 2009 The Authors. Journal compilation ! 2009 British Ecological Society, Functional Ecology, 24, 273–282
278 E. Traver et al.

EDAPHIC CONDIT IONS
In the Maple stand, soil moisture showed no correlation with
EC, sapwood or DBH spatially (P > 0Æ3 for all, data not
shown), although the pine and maple areas were significantly
different (Table 1). In theAspen stand, higher rates ofEC cor-
responded to aspen trees and lower soil moisture (see Fig. S1)
with both soil moisture and total N showing a weak inverse
Vapor pressure deficit0.7 kPa
0–15 m
0–20 m
1.3 kPaAspen stand
(EC g tree–1 s–1)
Maple stand
Fig. 4. Kriged maps of transpiration percanopy (EC) for the Aspen site (top two pan-els) and Maple site (bottom two panels) attwo different vapour pressure deficit values.Scales for each map are in metres and aredirectly comparable with Fig. 1.
D (kPa)
0·0 0·5 1·0 1·5 2·0 2·5
Ran
ge (
m)
35
40
45
50
Aspen Site
Nug
get (
mm
s–1
)2
0·000
0·005
0·010
0·015
0·020
0·025
Sill
(m
m s
–1)2
0·00
0·01
0·02
0·03
0·04
0·05
ChEASWI
r2 = 0·96
r2 = 0·98
r2 = 0·86
D (kPa)
0·0 0·2 0·4 0·6 0·8 1·0 1·2 1·4
Ran
ge (
m)
20
40
60
80
Maple Site
Nug
get (
mm
s–1)2
0·0
0·2
0·4
0·6
0·8
1·0
Sill
(m
m s
–1)2
0·0
0·5
1·0
1·5Norm–LagNorm–Not LagNot Norm–Not LagNot Norm–Lag
r2 = 0·98
r2 = 0·99
r2 = 0·99
(a) (b)
(c) (d)
(e) (f)
Fig. 5. (a,b) Nugget values, (c,d) sill values,and (e,f) range values of transpiration per treecanopy (EC) across all binned vapour pres-sure deficit (D) values. Lag refers to the timelag between EC and D. Note different scaleson the y-axis.
! 2009 The Authors. Journal compilation ! 2009 British Ecological Society, Functional Ecology, 24, 273–282
Spatial tree transpiration 279

relationship to EC values by species but not spatial location
within species. Within a species, there was no relationship
with any measured soil variable. Distance from the wetland
area boundary to each tree in the other areas was calculated
and plotted against EC to explore a possible correlation with
topography or wetland edge, but no correlation was found
(P > 0Æ8, data not shown). No other measured soil variable
correlated to EC, DBH or sapwood area in either stand
(P > 0Æ2, data not shown). We thus reject our third
prediction.
Discussion
DRIVERS OF EC TEMPORALLY AND SPAT IALLY
D is a well-known temporal driver of transpiration and much
work has supported the hypothesis that this is due to tree
hydraulics (Jarvis 1980; Monteith 1995; Oren et al. 1999;
Pataki, Oren & Smith 2000; Ewers et al. 2005; Ford et al.
2005). Our temporal data for all four species agreedwith anal-
yses by Ewers, Mackay & Samanta (2007) in time. Because
neither JS nor EL exhibits the same amount of spatial auto-
correlation as EC (Fig. 3), sapwood area (and thus tree size
reflected in diameter and sapwood area) must be driving
spatial variability within a given bin ofD. Ewers et al. (2002)
observed in these same species that although sapwood area
per ground area determines EC, some species of trees have
different relationships between size, sapwood area and tran-
spiration rate. Pataki, Oren & Smith (2000), for example,
found that aspen transpires at higher rates than other trees.
Because EC incorporates tree size using allometrics (Meinzer,
Goldstein & Andrade 2001), tree diameter is an important
variable for scaling (Hatton, Moore & Reece 1995), and
therefore spatial heterogeneity is inherent in tree growth
(Fox, Bi &Ades 2007a,b).
TEMPORAL AND SPAT IAL ANALYSIS OF EC
Similar to Adelman, Ewers & Mackay (2008) and Loranty
et al. (2008) sorting transpiration data and binning byD into
0Æ2-kPa groups was the only appropriate method. Low values
of D increase uncertainties in tree transpiration, hydraulic
refilling, nighttime transpiration or errors in low D measure-
ment (Ewers & Oren 2000; Dawson et al. 2007). Our results
showed that lagging did not influence or explain the changes
in spatial autocorrelation (Fig. 5) likely because of relatively
small tree size (Phillips et al. 2002; Ewers et al. 2005, 2007)
and indicates that potential issues with temporal resolution in
these types of sap flux sensors (Burgess & Dawson 2008;
response by Phillips et al. 2009) are not influencing the spatial
analyses.
Non-stationarity was found in both stands for more than
one variable tested (DBH, EC, JS; Table 2). However, the
causes of non-stationarity differed between the stands. A soil
moisture gradient was the most likely underlying cause of the
non-stationarity in the Aspen stand (see Fig. S1), which influ-
ences tree species and sizes, whereas the location of dominant
tree species, and their relative sizes, was likely the underlying
cause of non-stationarity in the Maple stand. Figure 5 shows
that normalization increased the sill and nugget values, the
variability ofEC, but did not change the range of spatial auto-
correlation. These results rule out stationarity violations as
an explanatory factor of the temporal changes in spatial auto-
correlation.
POTENT IAL EXPLANAT IONS FOR CHANGES IN SPAT IAL
PATTERNS
Although tree size and spacing are clearly the drivers of spa-
tial patterns within bins ofD at both stands (Fig. 3), tree size
and spacing cannot explain the temporal changes in spatial
autocorrelation with changing D (Fig. 5). Recent works by
Adelman, Ewers & Mackay (2008) in a subalpine forest and
by Loranty et al. (2008) modelling the spatial transpiration
patterns in the Aspen stand of this study support the hypothe-
sis that spatial changes with D are due to tree hydraulics.
When D is low, trees can easily keep up with water transport
demand and thus all trees have water loss rates limited solely
by D. As D increases, some trees must close their stomata
which results in the saturation of EC with increasing D (Oren
et al. 1999; Pataki, Oren & Smith 2000) to prevent excessive
and catastrophic cavitation (Ewers, Oren & Sperry 2000;
Ewers et al. 2005) and this has been verified for the species in
this study (Ewers, Mackay & Samanta 2007). Because not all
trees will have the same response toD, spatial autocorrelation
decreases asD increases. Evidence now exists to supportD as
the driver of temporal variability in spatial autocorrelation of
EC from the two very different stands in this study as well as a
subalpine forest in Wyoming, USA (Adelman, Ewers &
Mackay 2008). Future studies should explore this mechanism
beyond these forest types. For instance, once D is very high,
most trees would have low stomatal conductance so spatial
autocorrelation may increase again at higherD than found in
these forests. However, our results rejected prediction 3 so
that we rule out soil factors as driving the spatial variability at
a given D bin. Overall our tests of the three predictions
strongly support the tree hydraulics hypothesis to explain
temporally varying spatial patterns in transpiration.
Loranty et al. (2008) has suggested that even though there
was amoisture gradient across the Aspen stand, the trees were
not water limited during the duration of the study. This result
is supported by multiyear analysis in Mackay et al. (2002,
2007) showing that drought is rare in these stands and model-
ling work of Samanta et al. (2008) showing that low soil mois-
ture limitation inclusion in mechanistic models does not
improve predictive power in these stand types. Our use of
shallow (6 cm) soil moisture does not attempt to explain how
soil moisture deficit limits transpiration, but rather indicates
how excessive soil moisture may limit transpiration. Excessive
soil moisture in the Aspen stand appears to be the more
important factor (see Fig. S1) and a large total N would be a
strong indicator of poorly aerated soils. In northern temper-
ate and boreal forest stands, saturated soils are common and
result in well-known declines in transpiration and stomatal
! 2009 The Authors. Journal compilation ! 2009 British Ecological Society, Functional Ecology, 24, 273–282
280 E. Traver et al.

conductance in species that poorly respond to anaerobic con-
ditions (Kozlowski 1984; Zhang & Davies 1987; Else et al.
1996) and increases in species that require flooded soils (Ew-
ers,Mackay & Samanta 2007).Modelling studies have shown
that incorporating saturated soil impacts on transpiration
and stomatal conductance (Chen et al. 2005) and net primary
productivity (Grant 2004) is crucial to increasing predictive
understanding of these forest types. Our results further show
that correctly modelling spatial pattern change in time also
requires incorporating transpiration response to saturated
soil conditions in these forest types.
In the Maple stand, most of the trees were large com-
pared with the Aspen stand trees and may have created
their own microhabitats that exist on scales smaller than
that measured with soil samples (Jackson & Caldwell 1996;
Young 1998; Young et al. 1998). The Maple stand, with its
higher rates of EC, showed a greater decrease in spatial
autocorrelation as D increased and generally demonstrated
higher variability, as shown by the sill and nugget (Fig. 5),
than the Aspen stand. This result supports predictions 2
and 3 because the changes in spatial autocorrelation in
response to D are likely due to plant hydraulic controls.
Large trees have more variation in canopy conductance at
a given D and thus more variation in their response to
changes in D (Oren et al. 1999). The plantation organiza-
tion of the red pines may have removed the natural spatial
effect because the distribution of red pine is anthropogenic
in the Maple stand.
Because tree size drives spatial autocorrelation within a
givenD bin, there is a need to continue to look for those envi-
ronmental conditions that place the fewest limits on a tree’s
growth and allow for the greatest increase in sapwood area
and thus EC. We suggest as a further hypothesis that above-
ground competition for light may explain the patterns of spa-
tial variation within each stand; a previous study has shown a
weak negative relationship between competing sapwood area
and sap flux (Oren et al. 1998). Additional factors that drive
tree growth and size in this region may also prove to be very
useful for scaling from trees to stands and need to be identi-
fied. The approach presented here can ultimately be used to
quantify temporal and spatial drivers of tree transpiration in
any forest, and potentially other types of vegetation, resulting
in more rigorous and effective up-scaling using testable
mechanisms.
Acknowledgements
This research was supported by NSFGrants EAR-0405306 and EAR-0405381.Jonathan and Sarah Adelman provided an invaluable amount of field work,and we thank Julia Angstmann, Matthew Bell and Eric Kruger for their fieldand ⁄ or laboratory assistance. Dave Williams and Pete Stahl provided com-ments that improved an earlier draft. This work complies with all current lawsof theUSA.
References
Adelman, J.D., Ewers, B.E. &Mackay, D.S. (2008)Use of temporal patterns invapor pressure deficit to explain spatial autocorrelation dynamics in treetranspiration.Tree Physiology, 28, 647–658.
Bakwin, P.S., Tans, P.P., Hurst, D.F. & Zhao, C. (1998) Measurements ofcarbon dioxide on very tall towers: results of the NOAA ⁄CMDL program.Tellus Series B: Chemical and PhysicalMeterology, 50, 401–415.
Bishop,M.P., Schroder, J.F. &Colby, J.D. (2003) Remost sensing and geomor-phology for studying relief production in high mountains. Geomorphology,55, 345–361.
Burgess, S.O.O. & Dawson, T.E. (2008) Using branch and basal trunk sap flowmeasurements to estimate whole-plant water capacitance: a caution. Plantand Soil, 305, 5–13.
Burrows, S.N., Gower, S.T., Clayton, M.K., Mackay, D.S., Ahl, D.E., Nor-man, J.M. & Diak, G. (2002) Application of geostatistics to characterizeLAI for flux towers to landscapes.Ecosystems, 5, 667–679.
Chen, J.M., Chen, X., Ju, W. & Geng, X. (2005) Distributed hydrologicalmodel for mapping evapotranspiration using remote sensing inputs. Journalof Hydrology, 305, 15–39.
Cook, B.D., Davis, K.J., Wang, W., Desai, A.B.B.W., Teclas, R.M., Martin,J.G., Bostad, P.V., Bakwin, P.S., Yi, C. & Heilman, W. (2004) Carbonexchange and venting anomalies in an upland deciduous forest in northenWisconsin, USA.Agricultural and ForestMeteorology, 126, 271–295.
Cressie, N.A.C. (1993)Statistics for Spatial Data. Wiley, NewYork.Dawson, T.E., Burgess, S.O.O., Tu,K.P., Oliveira, R.S., Santiago, L.S., Fisher,
J.B., Simonin, K.A. & Ambrose, A.R. (2007) Nighttime transpiration inwoody plants from contrasting ecosystems.Tree Physiology, 27, 561–575.
Desai, A.R., Bostad, P.V., Cook, B.D., Davis, K.J. & Carey, E.V. (2005) Com-paring net ecosystem exchange of carbon dioxide between an old-growthandmature forest in upperMidwest, USA.Agricultural and ForestMeteorol-ogy, 128, 33–55.
Else, M.A., Tiekstra, A.E., Croker, S.J., Davies, W.J. & Jackson, M.B. (1996)Stomatal closure in flooded tomato plants involves abscisic acid and a chem-ically unidentified antitranspirant in xylem sap. Plant Physiology, 112, 239–247.
Ewers, B.E., Mackay, D.S. & Samanta, S. (2007) Interannual consistency incanopy stomatal conductance control of leaf water potential across seventree species.Tree Physiology, 27, 11–24.
Ewers, B.E. & Oren, R. (2000) Analysis of assumptions and errors in the calcu-lation of stomatal conductance from sap flux measurements. Tree Physiol-ogy, 20, 579–589.
Ewers, B.E., Oren, R. & Sperry, J.S. (2000) Influence of nutrient versus watersupply on hydraulic architecture and water balance inPinus taeda.Plant Cell& Environment, 23, 1055–1066.
Ewers, B.E., Mackay, D.S., Gower, S.T., Ahl, D.E., Burrows, S.N. & Samanta,S.S. (2002) Tree species effects on stand transpiration in northernWisconsin.Water Resources Research, 38, DOI: 10.1029/2001WR000830.
Ewers, B.E., Gower, S.T., Bond-Lamberty, B. & Wang, C.K. (2005) Effects ofstand age and tree species on canopy transpiration and average stomatalconductance of boreal forests.Plant, Cell and Environment, 28, 660.
Ewers, B.E., Oren, R., Kim, H.-S., Bohrer, G. & Lai, C.-T. (2007) Effects ofhydraulic architecture and spatial variation in light on mean stomatal con-ductance of tree branches and crowns. Plant, Cell and Environment, 30, 483–496.
Ewers, B.E., Mackay, D.S., Tang, J., Bolstad, P.V. & Samanta, S. (2008) Inter-comparison of sugar maple (Acer saccharum Marsh.) stand transpirationresponses to environment conditions from the Western Great Lakes Regionof theUnited States.Agricultural and ForestMeteorology, 148, 231–246.
Ford, C.R., Goranson, C.E., Mitchell, R.J., Will, R.E. & Teskey, R.O. (2005)Modeling canopy transpiration using time series analysis: a case study illus-trating the effect of soil moisture deficit onPinus taeda.Agricultural and For-estMeteorology, 130, 163–175.
Fox, J.C., Bi, H. & Ades, P.K. (2007a) Spatial dependence and individual-treegrowth models I. Characterising spatial dependence. Forest Ecology andManagement, 245, 10–19.
Fox, J.C., Bi, H. & Ades, P.K. (2007b) Spatial dependence and individual-treegrowth models I. Modelling spatial dependence. Forest Ecology and Man-agement, 245, 20–30.
Franklin, R.B., Blum, L.K.,McComb, A.C. &Mills, A.L. (2002) A geostatisti-cal analysis of small-scale spatial variability in bacterial abundance and com-munity structure in salt marsh creek bank sediments. FEMS MicrobiologyEcology, 42, 71–80.
Franks, P.J., Drake, P.L. & Froend, R.H. (2007) Anisohydric but isohydrody-namic: seasonally constant plant water potential gradient explained by a sto-matal control mechanism incorporating variable plant hydraulicconductance.Plant, Cell and Environment, 30, 19–30.
GLOBE Program (2005) Particle Size Distribution Protocol. Available at:http://www.globe/gov/tctg/partsize.pdf?sectionId=96 (accessed August2007).
! 2009 The Authors. Journal compilation ! 2009 British Ecological Society, Functional Ecology, 24, 273–282
Spatial tree transpiration 281

Granier, A. (1987) Evaluation of transpiration in a Douglas fir stand by meansof sap flowmeasurements.Tree Physiology, 3, 309–320.
Grant, R.F. (2004)Modeling topographic effects on net ecosystem productivityof borealblack spruce forests.Tree Physiology, 24, 1–18.
Hacke, U.G., Sperry, J.S., Ewers, B.E., Ellsworth, D.S., Schafer, K.V.R. &Oren, R. (2000) Influence of soil porosity on water use in Pinus taeda. Oeco-logia, 124, 495–505.
Hatton, T.J., Moore, S.J. & Reece, P.H. (1995) Estimating stand transpi-ration in a Eucalyptus-Populnea woodland with the heat pulse method- measurement errors and sampling strategies. Tree Physiology, 15,219–227.
Hinckley, T.M., Sprugel, D.G., Brooks, J.R., Brown, K.J., Martin, T.A.,Schapp, W. & Wang, D. (1998) Scaling and integration in trees. EcologicalScale: Theory and Application (eds D.L. Peterson & V.T. Parker), pp. 309–337. ColumbiaUniversity Press, NewYork.
Isaaks, E.H.& Srivastava, R.M. (1989)An Introduction to Applied Geostatistics.OxfordUniversity Press, NewYork.
Jackson, R.B. & Caldwell, M.M. (1996) Geostatistical patterns of soilheterogeneity around individual perennial plants. Journal of Ecology,81, 683–692.
Jarvis, P.G. (1980) Stomatal response to water stress in conifers. Adaptation ofPlants to Water and High Temperature Stress (eds N.C. Turner & P.J. Kra-mer), pp. 105–122.Wiley, NewYork.
Kozlowski, T.T. (ed.) (1984) Flooding and Plant Growth. AcademicPress, NewYork, p. 356.
Legendre, P. (1993) Spatial autocorrelation: trouble or new paradigm?Ecology,74, 1659–1673.
Legendre, P. & Fortin, M.J. (1989) Spatial pattern and ecological analysis.Plant Ecology, 80, 107–138.
Legendre, L. & Legendre, P. (1998) Numerical Ecology. Elsevier Scientific,Amsterdam, TheNetherlands.
Loranty, M.M., Mackay, D.S., Ewers, B.E., Adelman, J.D. & Kruger, E.L.(2008) Environmental drivers of spatial variation in whole-tree transpirationin an aspen-dominated upland-to-wetland forest gradient.Water ResourcesResearch, 44, 1–15.
Mackay, D.S., Ahl, D.E., Ewers, B.E., Gower, S.T., Burrows, S.N., Samanta,S. & Davis, K.J. (2002) Effects of aggregated classifications of forest compo-sition on estimates of evapotranspiration in a northern Wisconsin forest.Global Change Biology, 8, 1253–1265.
Mackay, D.S., Ewers, B.E., Cook, B.D. & Davis, K.J. (2007) Environmentaldrivers of evapotranspiration in a shrub wetland and an upland forest inNorthern Wisconsin. Water Resources Research, 43, W03442; doi: 10.1029/2006WR005149.
Martin, T.A., Brown, K.J., Cermak, J., Ceulemans, R., Kucera, J., Meinzer,F.C., Rombold, D.G., Sprugel, G. & Hinckley, T.M. (1997) Crown conduc-tion and tree and stand transpiration in a second growth Abies amabilisstand.Canadian Journal of Forest Research, 27, 797–808.
Meinzer, F.C., Goldstein, G. & Andrade, J.L. (2001) Regulation of water fluxthrough tropical forest canopy trees: do universal rules apply? Tree Physiol-ogy, 21, 19–26.
Monteith, J.L. (1995) A reinterpretation of stomatal response to humitidy.Plant, Cell and Environment, 18, 357–364.
Oishi, A.C., Oren, R. & Stoy, P.C. (2008) Estimating components of forestevapotranspiration: a footprint approach for scaling sap fluxmeasurements.Agricultural and ForestMeteorology, 148, 1719–1732.
Oren, R., Phillips, N., Katul, G., Ewers, B.E. & Pataki, D.E. (1998) Scalingxylem sap flux and soil water balance, and calculating variance: a method forpartitioning water flux in forests. Annales des Sciences, Forestieres, 55, 191–216.
Oren, R., Sperry, J.S., Katul, G.G., Pataki, D.E., Ewers, B.E., Phillips, N. &Schafer, K.V.R. (1999) Survey and synthesis of intra- and interspecific varia-tion in stomatal sensitivity to vapour pressure deficit. Plant, Cell and Envi-ronment, 22, 1515–1526.
Pataki, D.E., Oren, R. & Smith,W.K. (2000) Sap flux of co-occurring species ina western subalpine forest during seasonal soil drought. Ecology, 81, 2557–2566.
Phillips, N. & Oren, R. (1998) A comparison of daily representations of canopyconductance based on two conditional time-averaging methods.Annales desSciences Forestieres, 55, 191–216.
Phillips, N., Nagchaudhuri, A., Oren, R. & Katul, G. (1997) Time constant forwater transport in loblolly pine trees estimated from time series of evapora-tive demand and stem sapflow.Trees, 11, 412–419.
Phillips, N., Bond, B.J., McDowell, N.G. & Ryan, M.G. (2002) Canopy andhydraulic conductance in young, mature and old Douglas-fir trees. TreePhysiology, 22, 205–211.
Phillips, N., Scholz, F.G., Bucci, S.J., Goldstein, G. & Meinzer, F.C. (2009)Using branch and basal sap flow measurements to estimate whole-plantwater capacitance: comment on Burgess and Dawson (2008). Plant and Soil,315, 315–324.
Reiners, W.A. & Driese, K.L. (2004) Transport Processes in Nature: Propaga-tion of Ecological Influences through Environmental Space. Cambridge Uni-versity Press, Cambridge, UK.
Robertson,G.P. (1987)Geostatistics in ecology: interpolating with known vari-ables.Ecology, 68, 744–748.
Robertson, G.P., Coleman, D.C., Bledsoe, C.S. & Sollins, P. (1999) StandardSoil Methods for Long-term Ecological Research. Oxford University Press,NewYork.
Samanta, S., Clayton, M.K., Mackey, D.S., Kruger, E.L. & Ewers, B.E. (2008)Quantitative comparison of canopy conductance models using aBaysian approach. Water Resources Research; 44, W09431, DOI: 10.1029/2007WR006761.
Schabenberger, O. & Gotway, C.A. (2005) Statistical Methods for Spatial DataAnalysis. CRC, Boca Raton, FL.
Schafer, K.V.R., Oren, R. & Tenhunen, J.D. (2000) The effect of tree heighton crown level stomatal conductance. Plant, Cell and Environment, 23, 365–375.
Schulze, E.-D., Cermak, J.M.R., Penka, M., Zimmerman, R., Vasicek, F.,Gries, W. & Kucera, J. (1985) Canopy transpiration and water fluxes in thexylem of the trunk of Larix and Picea trees – a comparison of xylem flow,porometer and cuvette measurements.Oecologia, 66, 475–483.
Sperry, J.S., Hacke, U.G., Oren, R. & Comstock, J.P. (2002)Water deficits andhydraulic limits to leaf water supply. Plant, Cell and Environment, 25, 251–263.
Ter-Mikaelian, M.T. & Korzukhin, M.D. (1997) Biomass equations for sixty-fiveNorth American tree species.Forest Ecology andManagement, 97, 1–24.
Whitehead, D., Livingston, N.J., Kelliher, F.M., Hogan, K.P., Pepin, S.,McSeveny, T.M. & Byers, J.N. (1996) Response of transpiration and photo-synthesis to a transient change in illuminated foliage area for Pinus radiataD.Don tree.Plant, Cell and Environment, 19, 949–957.
Wullschleger, S.D., Meinzer, F.C. & Vertessy, R.A. (1998) A review of whole-plant water use studies in trees.Tree Physiology, 18, 495–512.
Young, I.M. (1998) Biophysical interactions at the root-soil interface: a review.Journal of Agricultural Science, 130, 1–7.
Young, I.M., Blanchart, E., Chenu, C., Dangerfield, M., Fragoso, C., Grim-aldi, M., Ingram, J. & Monrozier, L.J. (1998) The interaction of soil biotaand soil structure under global change.Global Change Biology, 4, 703–712.
Zhang, J. & Davies, W.J. (1987) ABA in roots and leaves of flooded pea plants.Journal of Experimental Botany, 38, 649–659.
Received 22May 2009; accepted 29 September 2009Handling Editor: DavidWhitehead
Supporting information
Additional Supporting Information may be found in the online
version of this article.
Fig. S1.Transpiration response to soil moisture and nitrogen.
As a service to our authors and readers, this journal provides
supporting information supplied by the authors. Such materials may
be re-organized for online delivery, but are not copy-edited or typeset.
Technical support issues arising from supporting information (other
thanmissing files) should be addressed to the authors.
! 2009 The Authors. Journal compilation ! 2009 British Ecological Society, Functional Ecology, 24, 273–282
282 E. Traver et al.


