Embed Size (px)
Citation preview
1
Functional Testing, Structural Testing and Code Reading: What Fault Type do they Each Detect?
Natalia Juristo, Sira Vegas
Facultad de Informática. Universidad Politécnica de Madrid Campus de Montegancedo, 28660, Boadilla del Monte, Madrid, Spain
{natalia,svegas}@fi.upm.es
Abstract. The origin of the study described here is the experiment performed by Basili and Selby, further replicated by Kamsties and Lott, and once again by Wood et al. These experiments investigated the effectiveness and efficiency of different code evaluation techniques (functional and structural testing and code reading). The working hypotheses are the same in all three experiments, although some experimental conditions were changed. The experiments described here use the experiment package elaborated by Kamsties and Lott and examine some of the questions posed as a result of these experiments. Wood et al. concluded in their replication of the original study that the relative effectiveness of the techniques depends on the program and fault type. In fact, they suggest formulating a fault taxonomy based on technique sensitivity. Our study intends to compare the relative effectiveness of the testing techniques and to relate the testing techniques to fault types.
1 Introduction
One of the most important activities within software systems development is code evaluation. Code evaluation takes place after coding the system and aims to discover as many defects as possible. There are two complementary forms of evaluating a program: • Static analysis • Dynamic analysis In static analysis, the code is examined, the aim being to discover as many
inaccuracies as possible through observation. Static analysis techniques differ as to the way in which the code is observed or read. In dynamic analysis, the code is executed, the aim being to discover code errors by observing system behaviour and trying to deduce whether or not it is satisfactory.
Additionally, whereas static analysis detects the faults the software contains (a fault is an inaccuracy in a software product), all dynamic analysis can do is detect failures (failures occur when a software system does not behave as expected owing to the existence of faults). As the ultimate aim of evaluation is to correct any faults in the software, dynamic analysis calls for a further step to identify faults from the observed failures.
2
Many static and dynamic techniques for evaluating software system code have been proposed in the literature. However, not much work has gone into finding out the strengths and weaknesses of each technique. The experiment proposed here aims to contribute to clarifying what differences there between techniques for practical purposes such as how many and what type of errors they detect.
The roots of this study go back to the work of Hetzel [3] and Myers [7]. More precisely, it is the continuation of a line of experiments run by other authors, which have added to the knowledge provided by previous experiments. The original study was conducted by Basili in 1982, 83 and 84 [1]. This experiment studied the effectiveness and efficiency of different code evaluation techniques. Kamsties and Lott first replicated the study in 1995 [5]. This replication assumed the same working hypotheses as in Basili’s experiments, but the experiment differed as to the programming language used, as well as the fault detection process. The experiment was replicated again, this time by Wood, Roper, Brooks and Miller, in 1997 [9]. In this case, the experiment followed exactly the same guidelines as the experiment run by Kamsties and Lott (who had built a laboratory package to ease external replication of the experiment1), although new analyses were added.
Our experiment follows on from the experiments already performed, although some hypotheses have been altered. For this purpose, we had to modify the laboratory package supplied by Kamsties and Lott.
Table 1 and Table 2 give an overview of the four studies carried out in this series of experiments.
The rest of the document has been organised as follows: Section 2 gives an overview of the objectives of the study. Section 3 and Section 4 present each the first and second experiment respectively. Section 5 shows the conclusions obtained in the study.
2 Study Objectives
One of the findings of the experiment run by Wood et al. toys with the idea that the relative effectiveness of testing techniques depends on the program and fault types. Indeed, they suggest developing a fault taxonomy based on technique sensitivity. The fact, detected in this same experiment by Wood et al., that techniques are much more effective used in combination than used separately backs this hypothesis. On the other hand, however, they also discovered and examined other effects, i.e., subjects applying the same techniques did not generally find the same faults, which have to be taken into account.
The study described here is based on the following recommendation made by Wood et al. The relationships between fault type and testing technique effectiveness should be examined in more detail.
1 This package is available at: the ESERNET repository.
3
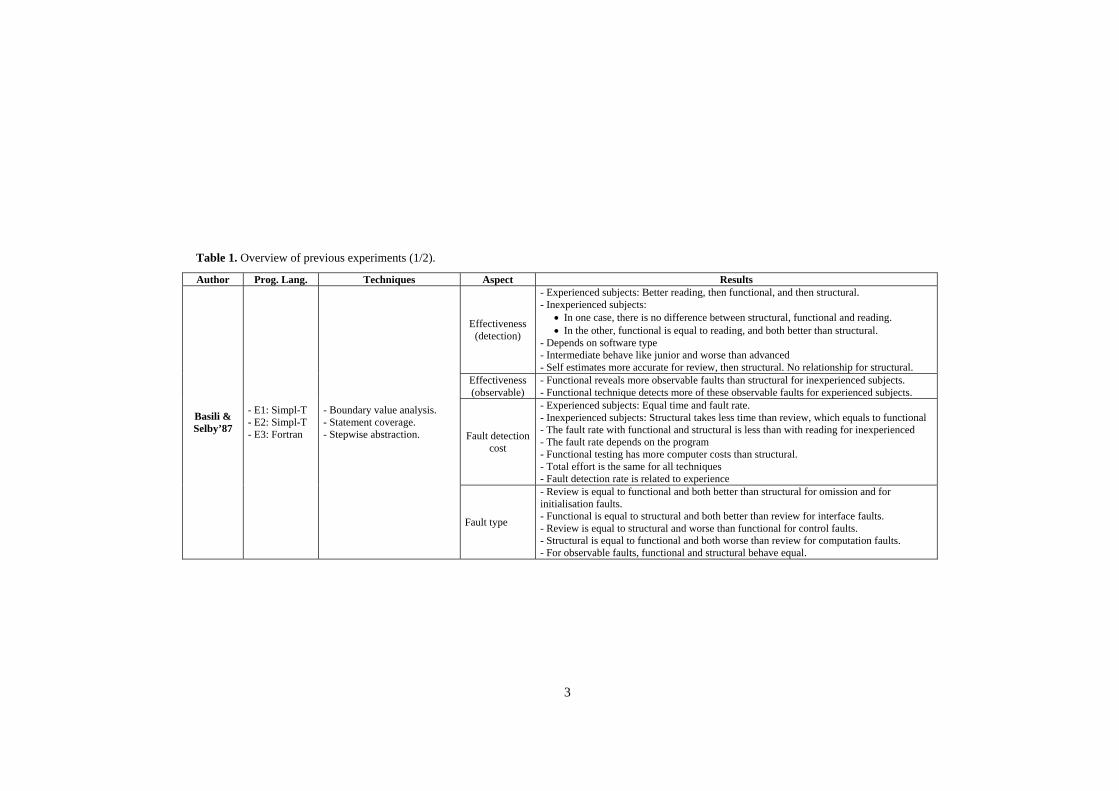
Table 1. Overview of previous experiments (1/2).
Author Prog. Lang. Techniques Aspect Results
Effectiveness (detection)
- Experienced subjects: Better reading, then functional, and then structural. - Inexperienced subjects:
• In one case, there is no difference between structural, functional and reading. • In the other, functional is equal to reading, and both better than structural.
- Depends on software type - Intermediate behave like junior and worse than advanced - Self estimates more accurate for review, then structural. No relationship for structural.
Effectiveness (observable)
- Functional reveals more observable faults than structural for inexperienced subjects. - Functional technique detects more of these observable faults for experienced subjects.
Fault detection cost
- Experienced subjects: Equal time and fault rate. - Inexperienced subjects: Structural takes less time than review, which equals to functional - The fault rate with functional and structural is less than with reading for inexperienced - The fault rate depends on the program - Functional testing has more computer costs than structural. - Total effort is the same for all techniques - Fault detection rate is related to experience
Basili & Selby’87
- E1: Simpl-T - E2: Simpl-T - E3: Fortran
- Boundary value analysis. - Statement coverage. - Stepwise abstraction.
Fault type
- Review is equal to functional and both better than structural for omission and for initialisation faults. - Functional is equal to structural and both better than review for interface faults. - Review is equal to structural and worse than functional for control faults. - Structural is equal to functional and both worse than review for computation faults. - For observable faults, functional and structural behave equal.
4
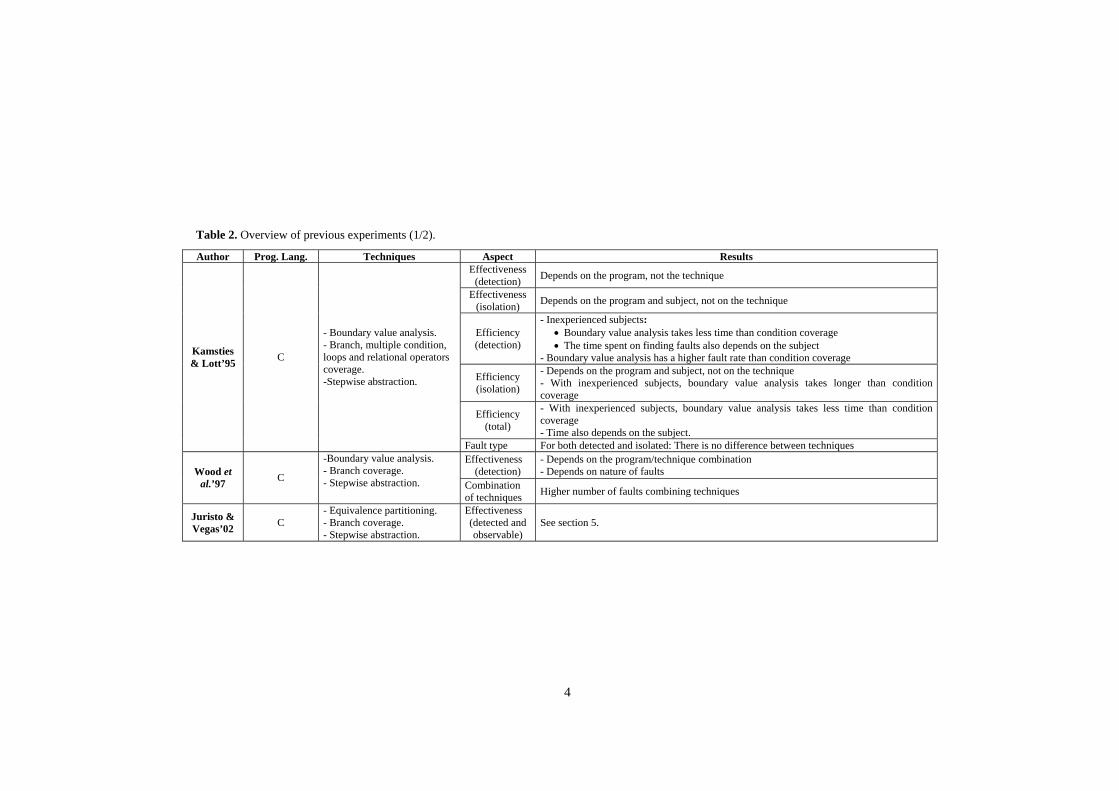
Table 2. Overview of previous experiments (1/2).
Author Prog. Lang. Techniques Aspect Results Effectiveness
(detection) Depends on the program, not the technique
Effectiveness (isolation) Depends on the program and subject, not on the technique
Efficiency (detection)
- Inexperienced subjects: • Boundary value analysis takes less time than condition coverage • The time spent on finding faults also depends on the subject
- Boundary value analysis has a higher fault rate than condition coverage
Efficiency (isolation)
- Depends on the program and subject, not on the technique - With inexperienced subjects, boundary value analysis takes longer than condition coverage
Efficiency (total)
- With inexperienced subjects, boundary value analysis takes less time than condition coverage - Time also depends on the subject.
Kamsties & Lott’95 C
- Boundary value analysis. - Branch, multiple condition, loops and relational operators coverage. -Stepwise abstraction.
Fault type For both detected and isolated: There is no difference between techniques Effectiveness
(detection) - Depends on the program/technique combination - Depends on nature of faults Wood et
al.’97 C
-Boundary value analysis. - Branch coverage. - Stepwise abstraction. Combination
of techniques Higher number of faults combining techniques
Juristo & Vegas’02 C
- Equivalence partitioning. - Branch coverage. - Stepwise abstraction.
Effectiveness (detected and observable)
See section 5.
5
So, our study aims to compare the relative effectiveness of different testing techniques and relate the testing techniques to the fault types detected. For this purpose, the study is composed of two experiments, designed differently to study different factors.
The general hypotheses of the study are:
H0: Technique effectiveness is independent of the fault type. H1: Technique effectiveness is dependent on the fault type.
However, H1 is decomposed as follows: technique ti is the most effective for faults of type fj, where there are ixj different subhypotheses.
The study presented here consisted of two phases, which took place at the Universidad Politécnica de Madrid in the autumn of 2001 and 2002, and are called Experiment I and Experiment II respectively. The sequential experimentation has enabled the initial hypotheses to be expanded and resolved by further analysis. The hypotheses were further refined by discussions of the preliminary results.
For an overview of the experimentation methodology applied in this study see [4].
3 Round 1: Experiment I
3.1 Hypothesis and Response Variable
To test the hypothesis, that is, whether or not the effectiveness of the testing techniques can be said to be related to the fault types in the program, Experiment I is conceived as follows.
We are going to investigate whether or not technique effectiveness depends on the fault type. Accordingly, the variable we intend to examine is effectiveness, which will be the response variable and will be measured in terms of the number of subjects who detect a given fault for each fault in the program. As what we intend to test is a relationship (dependency of effectiveness with respect to fault type), the experiment will collect data on the effectiveness for each technique and each fault. We will then examine the statistical significance of the observed differences in effectiveness and, having established significance, we will study whether there is any type of relationship between the techniques and faults in terms of effectiveness.
The techniques and fault type are the factors of this study, whose impact on effectiveness we intend to ascertain. However, if we take into account Wood et al.’s description, which mentions program type, there would appear to be (or at least there is a reasonable doubt about the existence of) another variable (factor) that influences technique effectiveness, which would be program type. Hence, we have opted to include this variable in the list of factors.
To examine the relationship between the response variable and the factors, we intend to study how the technique, program and fault type combination influences fault detection. The possible outcomes of the experiment are:
6
• The technique/fault combination is significant with respect to the number of detected faults. In this case, there will be techniques that behave better for some fault types and we will have to analyse which ones they are. (This is equivalent to saying that the technique/fault interaction is significant.) • The technique/program combination is significant with respect to the number of detected faults. In this case, there will be techniques that behave better for some programs and we will have to analyse which ones they are. (This is equivalent to saying that the technique/program interaction is significant.) • The fault/program combination is significant with respect to the number of detected faults. In this case, there will be faults that behave better for some programs and we will have to analyse which ones they are. (This is equivalent to saying that the fault/program interaction is significant.) • Neither of the above combinations is significant with respect to the number of detected faults, in which case there are three possibilities:
- There is a technique that detects more faults irrespective of the fault type. (This is equivalent to saying that the effect of the technique is statistically significant.)
- There is a fault that is more often detected irrespective of the technique type. (This is equivalent to saying that the effect of the fault type is statistically significant.)
- There is a program in which more faults are detected irrespective of the technique used and the fault type. (This is equivalent to saying that the effect of the program is statistically significant.)
Therefore, the hypotheses of Experiment I can be detailed as follows:
H01: The fault detection technique has no impact on the number of detected faults. H11: The fault detection technique has an impact on the number of detected faults.
H02: The fault type has no impact on the number of detected faults. H12: The fault type has an impact on the number of detected faults.
H03: The use of different fault detection techniques for different fault types has no
impact on the number of detected faults. H13: The use of different fault detection techniques for different fault types has an
impact on the number of detected faults. H04: The use of different fault detection techniques for different programs has no
impact on the number of detected faults. H14: The use of different fault detection techniques for different programs has an
impact on the number of detected faults. H05: Different fault types in different programs have no impact on the number of
detected faults. H15: Different fault types in different programs have an impact on the number of
detected faults.
7
3.2 Factors and Alternatives
As mentioned above, there are three factors in this experiment: the technique to be used, the fault type and the program. These factors are described below.
3.2.1 Factor 1: Fault types We will consider that all the faults cause observable failures and that, therefore, no fault hides another. The faults are selected to assure that the programs fail only for some inputs, where a failure can be a total failure (no output whatsoever), a serious problem (incorrect output) or a minor problem (a wrongly spelt word in the output). The number of faults should be the same for all the programs, and they all have to contain the same fault distribution with respect to fault type.
As the experiment has been conceived, we needed a fault classification. Unfortunately, there are not many classifications in the literature. We have opted to use the classification followed by Basili in the first experiment of the series [1]. In each case, he makes a distinction between something that is missing (faults of omission) and something that is incorrect (faults of commission): • Initialisation (commission and omission): An initialisation fault is an incorrect initialisation of a data structure. For example, assigning an incorrect value to a variable when entering a module would be an error of commission, whereas failure to initialise when necessary would be an error of omission. Initialisation faults of both commission and omission will be used for the experiment. • Control (commission and omission): A control fault means that the program follows an incorrect control flow path in a given situation. For example, an incorrect predicate in an if-then-else sentence would be a control fault of commission, whereas a missing predicate would be fault of omission. Control faults of both commission and omission will be used for the experiment. • Computation (not used): These are faults that lead to an incorrect calculation. For example, an incorrect arithmetic operator on the right-hand side of an assignation would be a computation fault. They will not be used for the experiment, as the computations to be made in the program types used are too simple (basically they would refer to variable increments for loop control). • Interface (not used): Interface faults occur when a module uses entities that are outside the module’s local environment and assumes things that are untrue. A possible interface fault would be, for example, passing an incorrect argument to a procedure or assuming that a module would fill in an array passed as an argument with blanks. They will not be used for the experiment, because they can be considered integration rather than unit faults and the study has always focused on unit faults so far. • Data (not used): Data faults are faults caused by the incorrect use of a data structure, for example, incorrectly determining the index of the last element in an array. They will not be used for the experiment, because they can be considered integration rather than unit faults. • Cosmetic (commission and omission): Cosmetic faults of commission can result, for example, in a spelling mistake in an error message. Faults of omission
8
are faults where an error message should appear and does not. Cosmetic faults of both commission and omission will be used for the experiment.
Note that this study addresses a subset of faults rather than all fault types. This approach was taken for two reasons: first, because two of the fault types are related to integration testing, whereas the study focuses, at least for the time being, on unit testing, and second, because the study is not intended to be exhaustive but rather to test whether the hypothesis is true.
The faults entered in each program for the purposes of the experiment were: • F1: Cosmetic, omission. • F2: Cosmetic, commission. • F3: Initialisation, omission. • F4: Initialisation, commission. • F5: Initialisation, commission • F6: Control, omission. • F7: Control, omission. • F8: Control, commission. • F9: Control, commission. Note that there are three replicated faults: F4 and F5 are the same type of fault, as
are F6 and F7 and F8 and F9. The aim here was to introduce replicated fault types, thereby increasing the reliability of the results of the experiment.
3.2.2 Factor 2: Techniques We have used basically the same fault detection techniques as in the previous experiment: functional testing, structural testing and code reading/review. What we have changed is the criterion of the functional tests, using equivalence class partitioning. This has been done due to time constraints during the operation of the experiment. For the structural technique, the subjects have not used any tool to assure branch coverage, because we wanted to compare the techniques under the same conditions (see [2], [8] for a detailed description of the dynamic analysis techniques used). This will affect the time it will take the subjects to generate the test cases (not the quality of the task performance, as the programs are simple enough for subjects to be able to do without a testing tool). Nevertheless, test case generation time is not relevant, as this experiment will not examine this response variable. All the techniques are applied for failure observation, that is, subjects look for observable differences between the program and the specification. The failure isolation step has been removed during technique application, that is, after finding a failure, subjects proceed to detect the fault that caused it. We did not consider failure isolation to be necessary for technique comparison, because the techniques provide no help for this task.
So, the techniques will be used as follows: • The technique reading by step-wise abstraction [6] will be used for code review. For this purpose, subjects are supplied with a program listing. They identify subroutines, writing their respective specifications, they group the subroutines and the specifications and repeat the process until they have abstracted the source code, conforming the program specifications. After this, they are given the official
9
specifications and they identify the failures through inconsistencies between the abstracted and supplied specifications. • The functional tests will be based on the standard techniques of equivalence class partitioning and boundary value analysis. Subjects are supplied with an executable version of the program and its specification. The test cases are derived from the specification, they are executed using the executable program and the failures are observed in terms of unexpected results. • For the structural tests, subjects are expected to get a result as close to sentence coverage and decision coverage as possible. Subjects are given the source code without a specification. They store the test data and results. Having completed this step, they are given a specification to test the correctness of the results. The incorrect results represent program failures.
3.2.3 Factor 3: Program We are going to use four different programs, specifically two very similar programs of each software type, using two software types. We have used the programs created by Kamsties and Lott, also used by Wood et al., plus one that we have developed. The programs used for this experiment were: • Cmdline (functional): Program that reads the input line and outputs a summary. • Trade (functional): Program that reads a trade transaction file and outputs statistics about the transactions it contains. • Nametbl (data): Program that implements the data structure of a symbol table, as well as its operations. • Ntree (data): Program that implements the data structure of an n-ary tree, as well as its operations.
3.3 Parameters
The variables used as parameters (that is, whose value has remained unchanged throughout the experiment) are: • Program length. The average program length is similar to the length of the programs suggested by Basili in the first experiment. They contain approximately 200 lines of code, excluding blank lines and comments. • Subject type. Fifth-year students from the School of Computer Science, Universidad Politécnica de Madrid, 1983 syllabus, were used for both experiments. They are subjects with very little experience. During the experiment they will be asked to fill in a self-assessment sheet with regard to their knowledge of the programming language, etc. • Programming language used. The programming language C was used for both experiments so as not to have to recode the programs provided by Woods and, in doing so, involuntarily introduce a fault. • Time limit used. For logistic reasons, the code review time had to be limited to two hours, while no time limit was imposed in the other two cases. • Faults. Each program has the same number of faults of the same type. There is a total of 9 faults, where 2 are initialisation faults of commission, 1 is a cosmetic
10
fault of commission, 2 are control faults of commission, 1 is an initialisation fault of commission, 2 are control faults of omission and 1 is a cosmetic fault of omission.
3.4 Experiment Design
The students are fifth-year computer science students. They are already familiar with the techniques, because they took a related subject in their fourth year, although their practical knowledge will be generally quite limited. Each group represents a set of people who performed the experiment (individually) at the same time (and, therefore, using the same program) applying the same technique. Therefore, we consider that each experimental unit (a program to which a technique is applied) is replicated as many times as subjects there in the group and as many times as different programs have been used in each experiment (in this case two). The people were assigned to each group depending on the available resources: 25 computers and a classroom with capacity for 40 people.
There are a total of 195 students. Bearing in mind these restrictions, we would have 8 groups of 12 people (four groups will perform structural tests and the other four functional tests) and four groups of 25 people (who will perform code review).
With the aim of maximising experiment randomness, the procedure for assigning groups to days and programs and techniques to groups was as follows: the experiment designer drew slips of paper from a bag that contained the different groups (from 1 to 12). For every three lots drawn, a slip of paper was taken from the bag that contained the days (from 1 to 4) and another from the bag that contained the programs (P1, P2, P3 and P4) until all the lots had been drawn from all three bags.
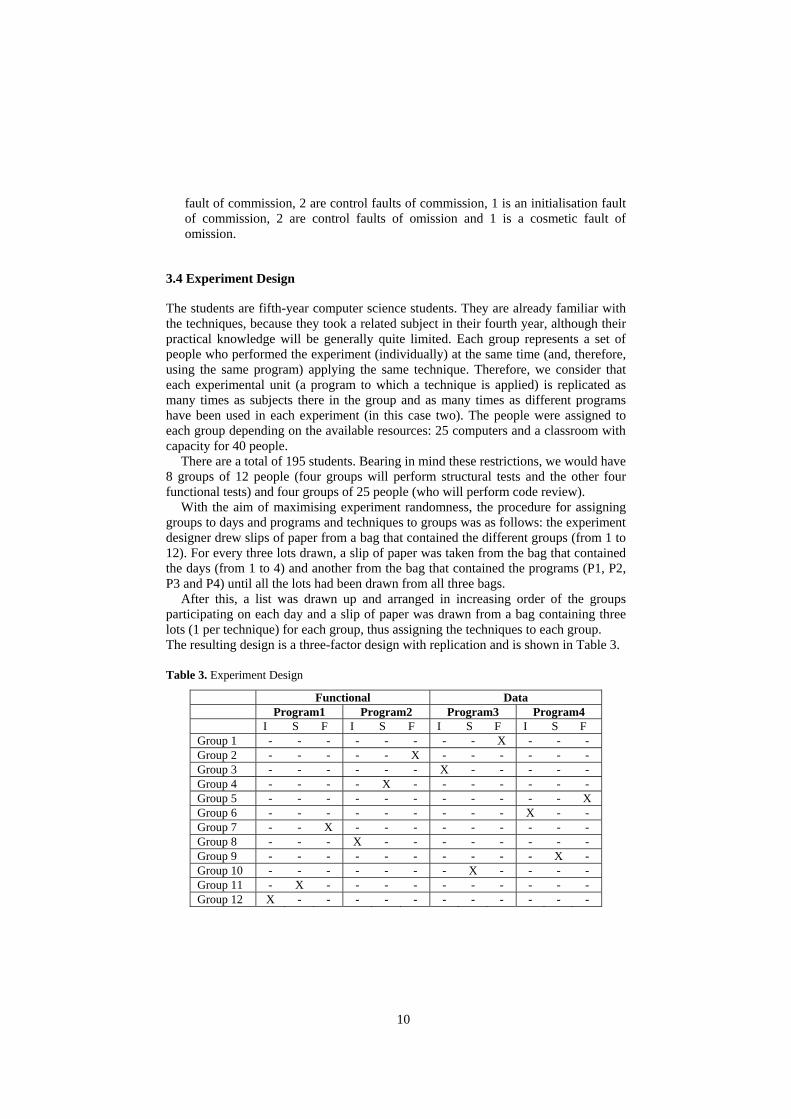
After this, a list was drawn up and arranged in increasing order of the groups participating on each day and a slip of paper was drawn from a bag containing three lots (1 per technique) for each group, thus assigning the techniques to each group. The resulting design is a three-factor design with replication and is shown in Table 3.
Table 3. Experiment Design
Functional Data Program1 Program2 Program3 Program4
I S F I S F I S F I S F Group 1 - - - - - - - - X - - - Group 2 - - - - - X - - - - - - Group 3 - - - - - - X - - - - - Group 4 - - - - X - - - - - - - Group 5 - - - - - - - - - - - X Group 6 - - - - - - - - - X - - Group 7 - - X - - - - - - - - - Group 8 - - - X - - - - - - - - Group 9 - - - - - - - - - - X - Group 10 - - - - - - - X - - - - Group 11 - X - - - - - - - - - - Group 12 X - - - - - - - - - - -
11
3.5 Running the Experiment
The experiment was organised in five different sessions, as shown in Table 4, and the reason for the experiment was explained and the respective documentation delivered in the first session. The students are aware at all times that they are participating in an experiment and that the results will be used for grading (they will be graded using two parameters: technique application and number of faults detected). The students will be asked to study the documentation (they are already familiar with the techniques, as they have studied them earlier in their degree course) and they will have to hand in completed exercise applying the three techniques, obliging them to assimilate the concepts that have been explained.
The students do not know what technique they have been assigned or what program they are going to work on until the experiment starts.
Table 4. Experiment operation.
Day Day 0 Day 1 Day 2 Day 3 Day 4 Program P4 P3 P2 P1 Group 6 Group 9 Group 5
Review Structural Functional
Group 3 Group 10 Group 1
Review Structural Functional
Group 8 Group 4 Group 2
Review Structural Functional
Group 12 Group 11 Group 7
Learning session and introduction to the experiment
Review Structural Functional
3.6 Validity Threats
Validity threats like learning have been eliminated, as each individual applies a single technique to just one program. We have also eliminated the influence of individual characteristics, as all the individuals are equally experienced and have fairly homogeneous profiles. The differences with regard to aptitude are eliminated by the random factor of group composition, that is, given the number of subjects and their random assignation to the technique to be applied, it is to be expected that the distribution of more and less able students will be equal for all the techniques.
We have attempted to assure that the faults and program types are representative of reality, that is, we have tried to assure that they simulate the faults programmers would really make during coding.
12
3.7 Data Analysis
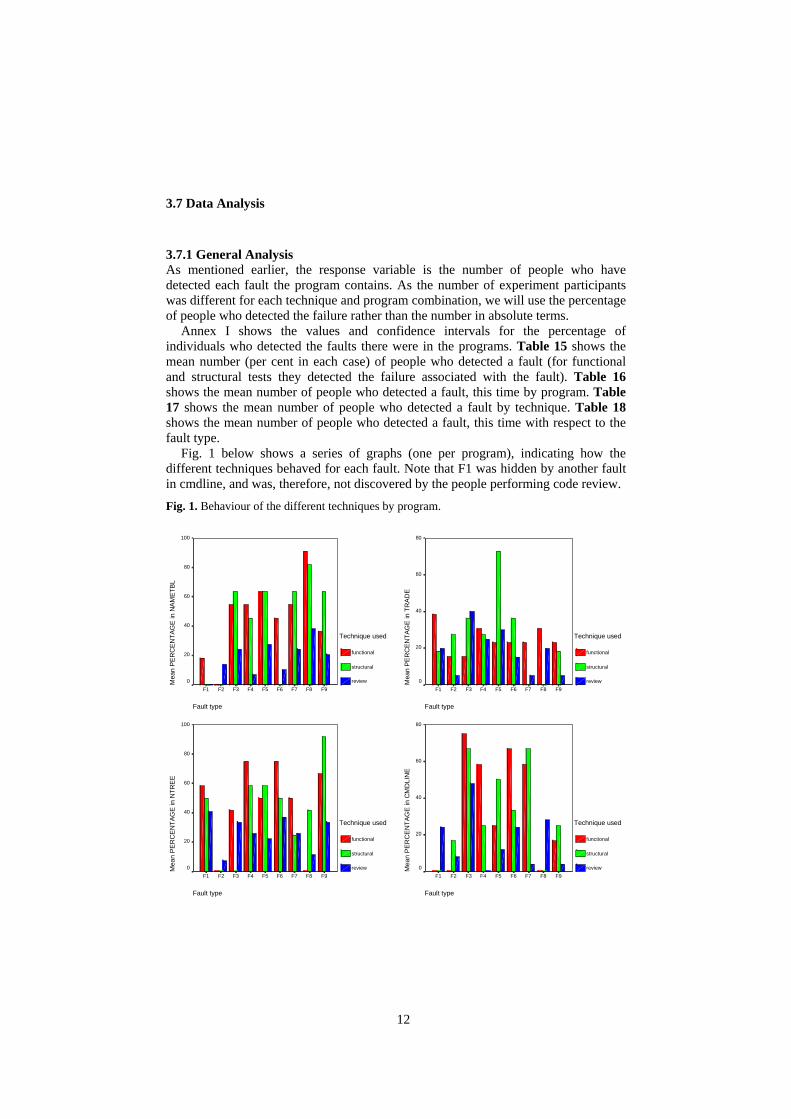
3.7.1 General Analysis As mentioned earlier, the response variable is the number of people who have detected each fault the program contains. As the number of experiment participants was different for each technique and program combination, we will use the percentage of people who detected the failure rather than the number in absolute terms.
Annex I shows the values and confidence intervals for the percentage of individuals who detected the faults there were in the programs. Table 15 shows the mean number (per cent in each case) of people who detected a fault (for functional and structural tests they detected the failure associated with the fault). Table 16 shows the mean number of people who detected a fault, this time by program. Table 17 shows the mean number of people who detected a fault by technique. Table 18 shows the mean number of people who detected a fault, this time with respect to the fault type.
Fig. 1 below shows a series of graphs (one per program), indicating how the different techniques behaved for each fault. Note that F1 was hidden by another fault in cmdline, and was, therefore, not discovered by the people performing code review.
Fig. 1. Behaviour of the different techniques by program.
Fault type F9F8 F7 F6 F5 F4 F3F2 F1 M
ean
PE
RC
EN
TAG
E in
NA
MET
BL
100
80
60
40
20
0
Technique used
functional
structural
review
Fault type F9F8 F7 F6 F5 F4 F3F2 F1 M
ean
PE
RC
EN
TAG
E in
NTR
EE
100
80
60
40
20
0
Technique used
functional
structural
review
Fault type
F9 F8F7F6F5F4F3F2F1
Mea
n P
ER
CE
NTA
GE
in T
RA
DE
80
60
40
20
0
Technique used functional structural review
Fault type
F9 F8F7F6F5F4F3F2F1
Mea
n P
ER
CE
NTA
GE
in C
MD
LIN
E
80
60
40
20
0
Technique used functional structural review
13
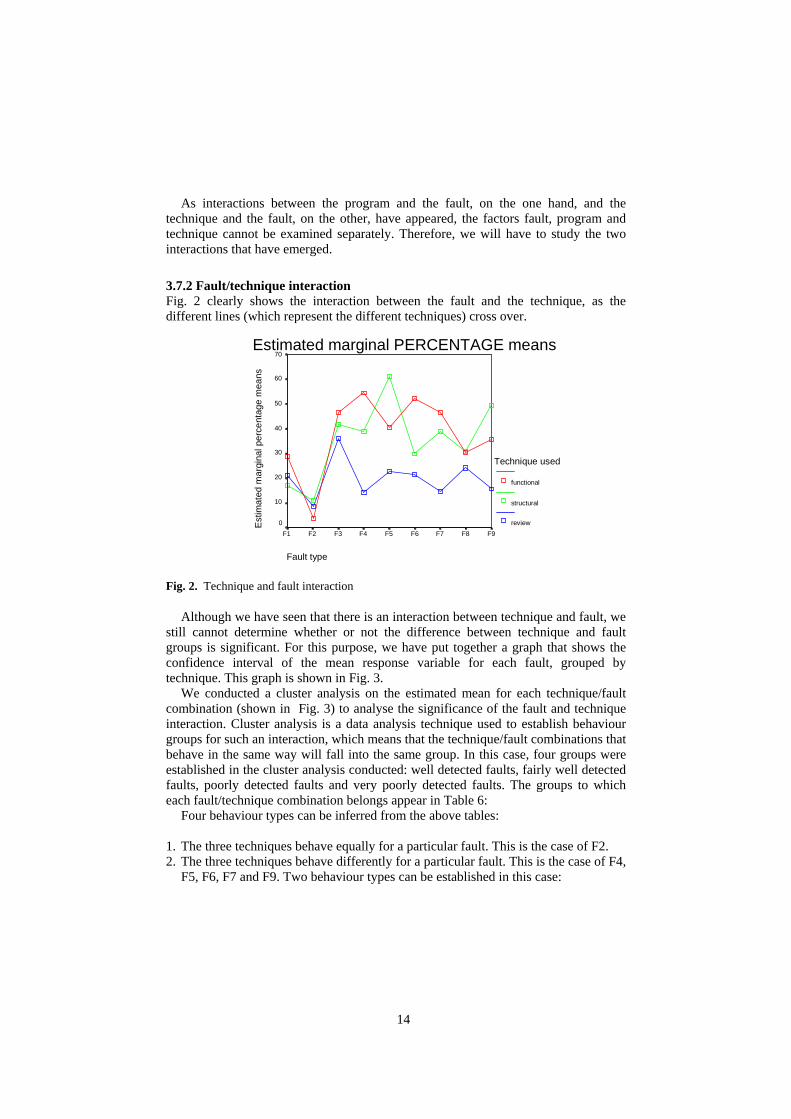
Table 5 below shows the result of applying analysis of variance to the response variable with respect to the factors program, technique and fault. We have studied both the main effects and the second-order interactions. It is not possible to study the third-order interaction, because there are no response variable replications (this interaction is confused with error). In any case, the experiment was not designed to examine this interaction. Accordingly, we are considering that the third-order interaction is negligible.
Table 5. Relationships between the parameters and the response variable.
Source Sum of squares gl Mean
square F Sig.
PROGRAM 4028.727 3 1342.909 5.820 0.002 TECHNIQUE 6706.951 2 3353.476 14.534 0.000 FAULT 10727.572 8 1340.947 5.812 0.000 PROGRAM * TECHNIQUE 1184.047 6 197.341 .855 0.534 PROGRAM * FAULT 21637.310 24 901.555 3.907 0.000 TECHNIQUE * FAULT 6777.885 16 423.618 1.836 0.054 Error 11075.324 48 230.736 Total 166297.829 108
As we can see from Table 5, the main effects (program, technique and fault) are all
significant, as is the program and fault interaction. With respect to the technique and fault interaction, it could in principle be considered as insignificant, as it is not significant for a confidence interval of 95% (the p-value is greater than 0.05). However, it is significant at 90% (the p-value is less than 0.1). Therefore, we will consider that it is significant.
Hence, we have that the number of people who will detect a fault depends on the program being tested, the technique being used and the actual fault. Additionally, there are faults that behave better for certain programs and faults that are better detected using certain techniques.
The fact that a fault behaves better with a particular program could be interpreted as meaning that the fault cannot be taken into account separately from the environment (for want of a better word) in which it occurs. One possibility is to examine not the actual fault but the failure it causes. Remember that, in the ultimate analysis, structural and functional testing techniques detect failures not faults, whereas review directly detects faults.
Additionally, within the dynamic techniques, it is interesting to note that a subject’s failure to detect a fault can be due to two very different reasons: • No test case was generated to show up the fault. • The test case was generated, but the subject was unable to see the failure on screen.
For this reason, we suggest that it would be interesting to make a distinction between two separate things in the second-round experimentation (Experiment II): detection of the failures caused by faults (to study visibility) and technique fault detection capability. As this experiment has been designed, it is impossible to separate one thing from the other.
14
As interactions between the program and the fault, on the one hand, and the technique and the fault, on the other, have appeared, the factors fault, program and technique cannot be examined separately. Therefore, we will have to study the two interactions that have emerged.
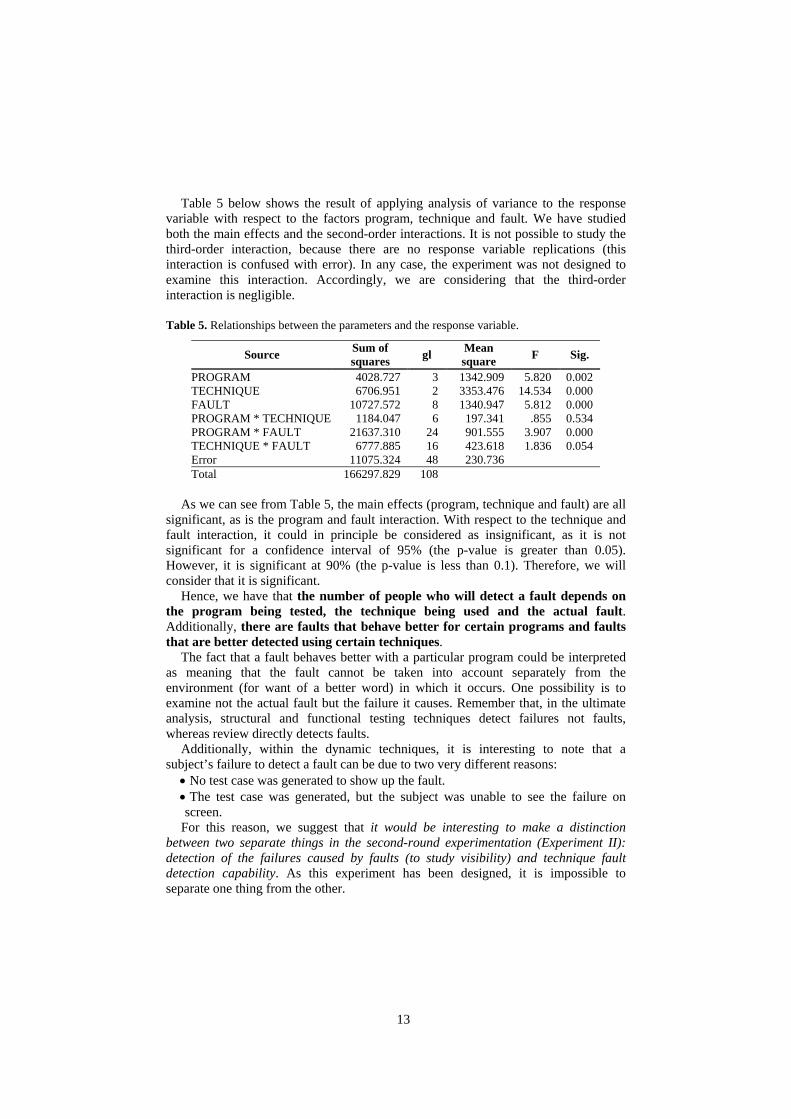
3.7.2 Fault/technique interaction Fig. 2 clearly shows the interaction between the fault and the technique, as the different lines (which represent the different techniques) cross over.
Estimated marginal PERCENTAGE means
Fault type
F9F8F7F6F5F4F3F2 F1 Est
imat
ed m
argi
nal p
erce
ntag
e m
eans
70 60 50 40 30 20 10
0
Technique used functional
structural
review
Fig. 2. Technique and fault interaction
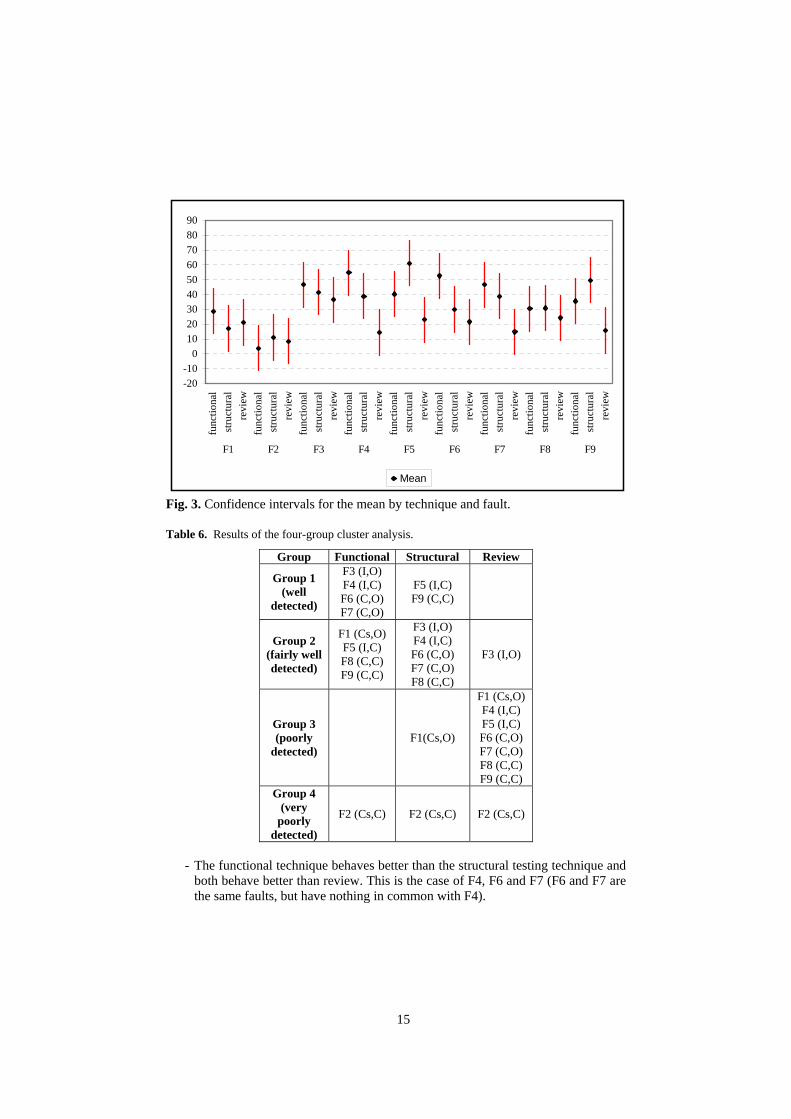
Although we have seen that there is an interaction between technique and fault, we still cannot determine whether or not the difference between technique and fault groups is significant. For this purpose, we have put together a graph that shows the confidence interval of the mean response variable for each fault, grouped by technique. This graph is shown in Fig. 3.
We conducted a cluster analysis on the estimated mean for each technique/fault combination (shown in Fig. 3) to analyse the significance of the fault and technique interaction. Cluster analysis is a data analysis technique used to establish behaviour groups for such an interaction, which means that the technique/fault combinations that behave in the same way will fall into the same group. In this case, four groups were established in the cluster analysis conducted: well detected faults, fairly well detected faults, poorly detected faults and very poorly detected faults. The groups to which each fault/technique combination belongs appear in Table 6:
Four behaviour types can be inferred from the above tables:
1. The three techniques behave equally for a particular fault. This is the case of F2. 2. The three techniques behave differently for a particular fault. This is the case of F4,
F5, F6, F7 and F9. Two behaviour types can be established in this case:
15
-20-10
0102030405060708090
func
tiona
lst
ruct
ural
revi
ewfu
nctio
nal
stru
ctur
alre
view
func
tiona
lst
ruct
ural
revi
ewfu
nctio
nal
stru
ctur
alre
view
func
tiona
lst
ruct
ural
revi
ewfu
nctio
nal
stru
ctur
alre
view
func
tiona
lst
ruct
ural
revi
ewfu
nctio
nal
stru
ctur
alre
view
func
tiona
lst
ruct
ural
revi
ew
F1 F2 F3 F4 F5 F6 F7 F8 F9
Mean
Fig. 3. Confidence intervals for the mean by technique and fault.
Table 6. Results of the four-group cluster analysis.
Group Functional Structural Review
Group 1 (well
detected)
F3 (I,O) F4 (I,C) F6 (C,O) F7 (C,O)
F5 (I,C) F9 (C,C)
Group 2 (fairly well detected)
F1 (Cs,O) F5 (I,C) F8 (C,C) F9 (C,C)
F3 (I,O) F4 (I,C) F6 (C,O) F7 (C,O) F8 (C,C)
F3 (I,O)
Group 3 (poorly
detected) F1(Cs,O)
F1 (Cs,O) F4 (I,C) F5 (I,C) F6 (C,O) F7 (C,O) F8 (C,C) F9 (C,C)
Group 4 (very
poorly detected)
F2 (Cs,C) F2 (Cs,C) F2 (Cs,C)
- The functional technique behaves better than the structural testing technique and
both behave better than review. This is the case of F4, F6 and F7 (F6 and F7 are the same faults, but have nothing in common with F4).
16
- The structural testing technique behaves better than the functional testing technique, and both behave better than review. This is the case of F5 and F9 (both faults of commission).
3. The structural technique behaves the same as review, and both behave worse than the functional testing technique. This is the case of F1 and F3 (both are faults of omission).
4. The functional technique behaves identically to the structural testing technique, and both behave better than review. This is the case of F8 (control and commission). The findings from the above are as follows: • The cosmetic faults are the most difficult to detect (F1 and F2 are in groups 3 and 4, except faults of omission using the functional testing technique which are in group 2). • Generally, it could be said that the fault and technique combination has an impact for the functional and structural testing techniques, as review always behaves worse than the other two, irrespective of the fault type. Note that all the faults fall into group 3 for review, except F2 (cosmetic fault of commission, which belongs to group 4) and F3 (initialisation fault of omission, which belongs to group 2). That is, the fault type appears to have practically no impact on review effectiveness, although this technique turns out to be the less effective one in this experiment. • Given the fault classification used and that, as we have seen from the ANOVA, fault detection depends on the fault and the technique, we would expect the same fault types to behave equally. That is, given that F4 and F5 are faults of the same type (initialisation, commission), they should behave equally, as should F6 and F7 (both control faults of omission) and F8 and F9 (control, commission). However, we find that this only happens in exceptional cases, like F6 and F7 (for all techniques) and F8 and F9 (for functional testing and review). This makes us think that perhaps the fault classification scheme is not the appropriate one, as it does not allow the detection of the fault type for which the functional and structural techniques are more adequate. • The functional testing technique detects faults of omission better than faults of commission (three out of four), whereas the structural testing technique is not very good at detecting faults of omission (they are all in group 2).
Neither can any definitive conclusions be drawn according to each individual classification examined separately.
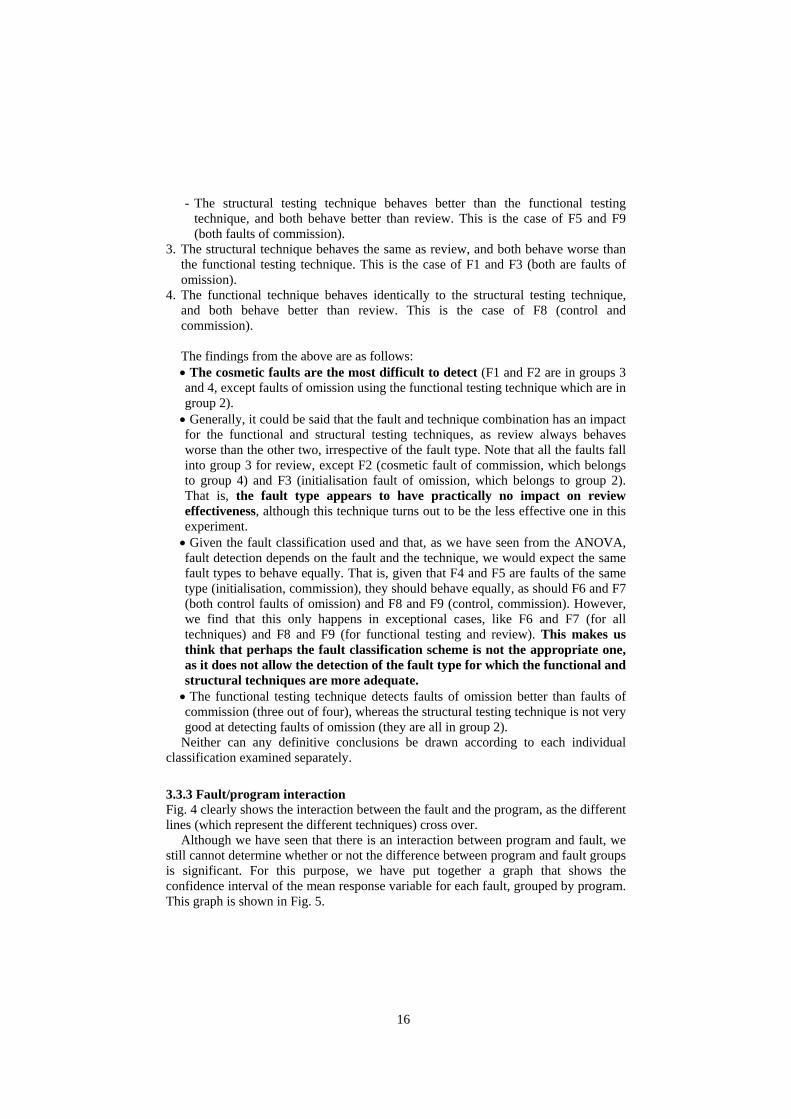
3.3.3 Fault/program interaction Fig. 4 clearly shows the interaction between the fault and the program, as the different lines (which represent the different techniques) cross over.
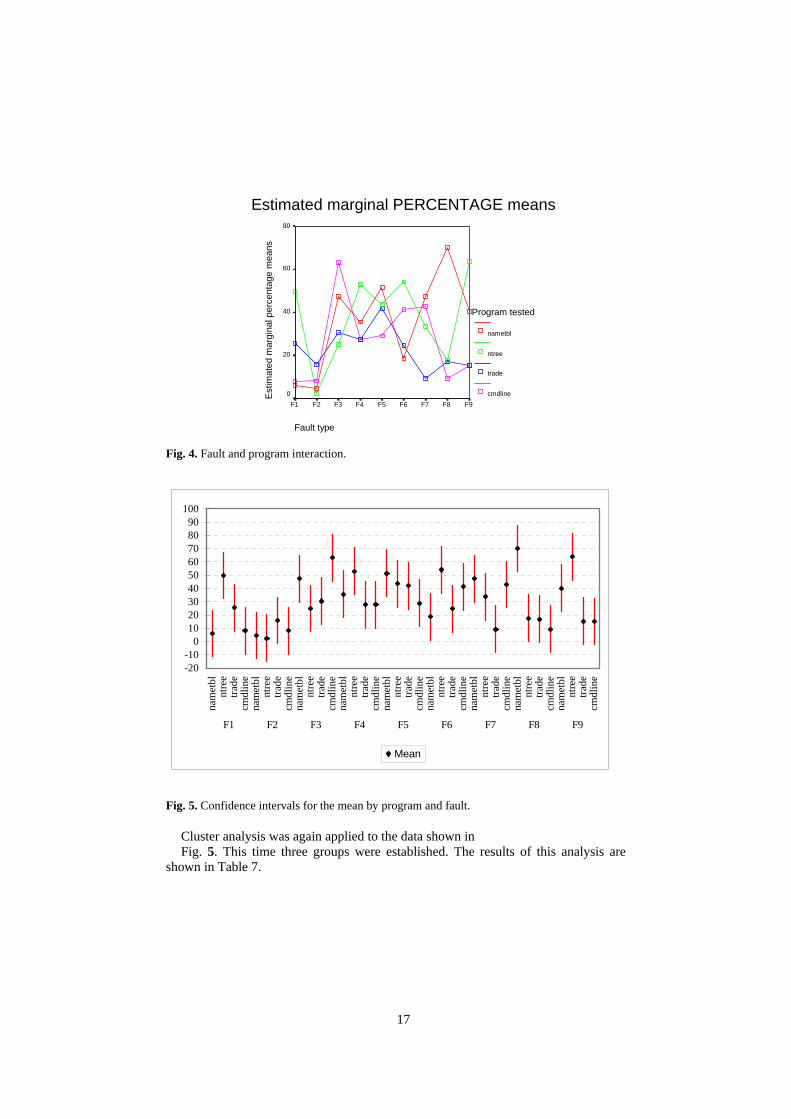
Although we have seen that there is an interaction between program and fault, we still cannot determine whether or not the difference between program and fault groups is significant. For this purpose, we have put together a graph that shows the confidence interval of the mean response variable for each fault, grouped by program. This graph is shown in Fig. 5.
17
Estimated marginal PERCENTAGE means
Fault type
F9F8F7F6F5F4F3F2 F1 Est
imat
ed m
argi
nal p
erce
ntag
e m
eans
80
60
40
20
0
Program tested
nametbl
ntree
trade
cmdline
Fig. 4. Fault and program interaction.
-20-10
0102030405060708090
100
nam
etbl
ntre
etra
decm
dlin
ena
met
blnt
ree
trade
cmdl
ine
nam
etbl
ntre
etra
decm
dlin
ena
met
blnt
ree
trade
cmdl
ine
nam
etbl
ntre
etra
decm
dlin
ena
met
blnt
ree
trade
cmdl
ine
nam
etbl
ntre
etra
decm
dlin
ena
met
blnt
ree
trade
cmdl
ine
nam
etbl
ntre
etra
decm
dlin
e
F1 F2 F3 F4 F5 F6 F7 F8 F9
Mean
Fig. 5. Confidence intervals for the mean by program and fault.
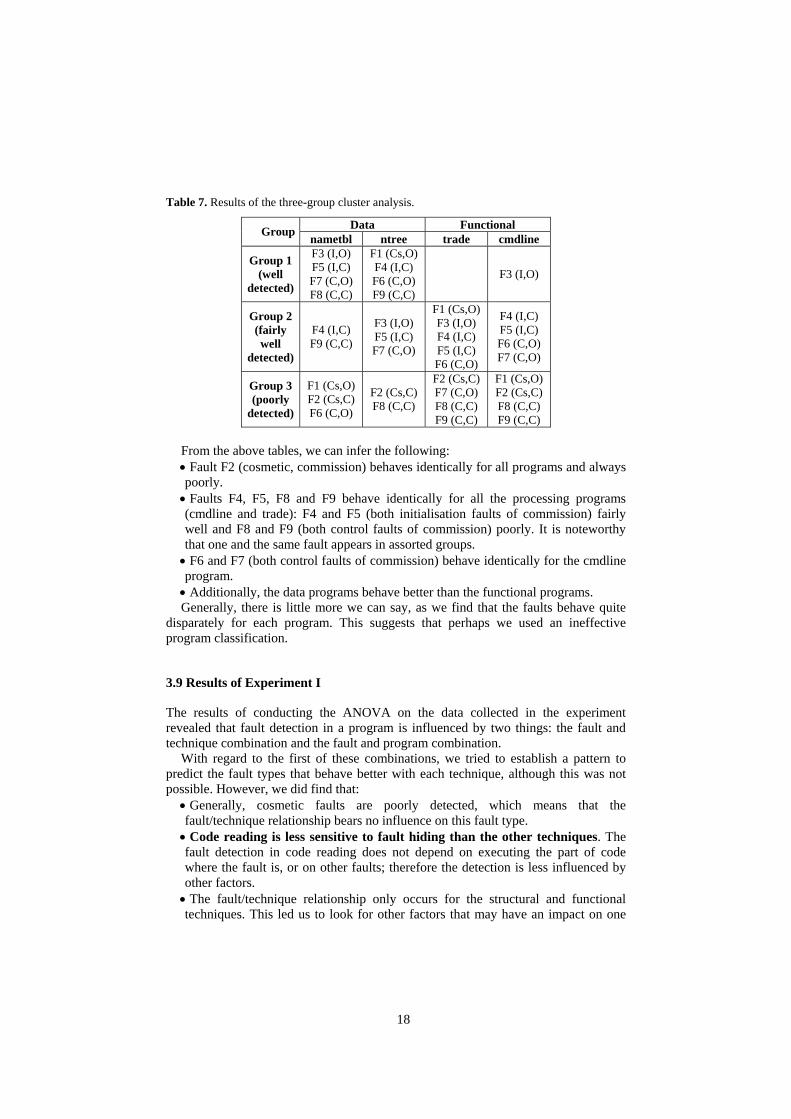
Cluster analysis was again applied to the data shown in Fig. 5. This time three groups were established. The results of this analysis are
shown in Table 7.
18
Table 7. Results of the three-group cluster analysis.
Data Functional Group nametbl ntree trade cmdline
Group 1 (well
detected)
F3 (I,O) F5 (I,C) F7 (C,O) F8 (C,C)
F1 (Cs,O) F4 (I,C) F6 (C,O) F9 (C,C)
F3 (I,O)
Group 2 (fairly well
detected)
F4 (I,C) F9 (C,C)
F3 (I,O) F5 (I,C) F7 (C,O)
F1 (Cs,O) F3 (I,O) F4 (I,C) F5 (I,C) F6 (C,O)
F4 (I,C) F5 (I,C) F6 (C,O) F7 (C,O)
Group 3 (poorly
detected)
F1 (Cs,O) F2 (Cs,C) F6 (C,O)
F2 (Cs,C) F8 (C,C)
F2 (Cs,C) F7 (C,O) F8 (C,C) F9 (C,C)
F1 (Cs,O) F2 (Cs,C) F8 (C,C) F9 (C,C)
From the above tables, we can infer the following: • Fault F2 (cosmetic, commission) behaves identically for all programs and always poorly. • Faults F4, F5, F8 and F9 behave identically for all the processing programs (cmdline and trade): F4 and F5 (both initialisation faults of commission) fairly well and F8 and F9 (both control faults of commission) poorly. It is noteworthy that one and the same fault appears in assorted groups. • F6 and F7 (both control faults of commission) behave identically for the cmdline program. • Additionally, the data programs behave better than the functional programs. Generally, there is little more we can say, as we find that the faults behave quite
disparately for each program. This suggests that perhaps we used an ineffective program classification.
3.9 Results of Experiment I
The results of conducting the ANOVA on the data collected in the experiment revealed that fault detection in a program is influenced by two things: the fault and technique combination and the fault and program combination.
With regard to the first of these combinations, we tried to establish a pattern to predict the fault types that behave better with each technique, although this was not possible. However, we did find that: • Generally, cosmetic faults are poorly detected, which means that the fault/technique relationship bears no influence on this fault type. • Code reading is less sensitive to fault hiding than the other techniques. The fault detection in code reading does not depend on executing the part of code where the fault is, or on other faults; therefore the detection is less influenced by other factors. • The fault/technique relationship only occurs for the structural and functional techniques. This led us to look for other factors that may have an impact on one
19
particular fault being detected more often than another in code reviews. For Experiment II, we propose to examine fault location in the program. • Since the subjects executed their own test cases, and the response variable measured the number of people who detected the failure produced by the fault, it was impossible to detect whether the actual technique did not generate a test case to show up the fault or the subject was unable to see the fault uncovered by the technique. This led us to consider examining actual fault detection capability (generation of test cases which are able to show up the failure) and failure visibility (the subject sees the failure once this is shown up) in Experiment II. Basili and Selby already studied this. • Related to the previous bullet, we have also not taken into account the possibility of subject randomisation not working properly (subjects better prepared will find more faults independently of the technique). The previous studies to this one, already discovered that subjects applying the same techniques did not find, generally, the same faults. This lead us to consider changing the design of the experiment for Experiment II, where all subjects will apply all techniques. • As far as the functional and structural testing techniques are concerned, it is difficult to establish a behaviour pattern for the different faults. Although the functional technique behaves better than the structural testing technique in most cases, the cases in which the two techniques behave identically or better than each other occur indistinctly for each replication of fault type. For example, the functional technique behaves better than the structural technique for F1 (cosmetic, commission), F3 (initialisation, omission), F4 (initialisation, commission) and F6 and F7 (both control faults of omission), the structural technique behaves better than the functional technique for F5 (initialisation, commission) and F9 (control, commission), and both techniques behave identically for F8 (control, commission). On the other hand, the fact that no conclusions can be drawn from the original classification suggests that all the faults should be replicated, and not just some as we did in this experiment (F1, F2 and F3 were not replicated). This led us to consider creating two versions of each program inserting different faults, albeit of the same type, for Experiment II. This contrasts with the differences Basili and Selby found for omission faults and for initialisation, interface, control and computation faults, and with the differences that Kamsties and Lott could not find. • Bearing in mind the fault classification we used, F4 is the same fault as F5 (initialisation, commission), and the same goes for F6-F7 (control, omission) and F8-F9 (control, commission). This means that they should behave identically, but this is only the case for F6 and F7 (control, omission). However, it does appear that the functional technique behaves better than the structural technique for faults of omission (all except F4), and the structural technique behaves better or identically to the functional technique for faults of commission. This contrasts with what Basili and Selby found about behaving functional technique and code reading equal and better than structural and the no difference found by Kamsties and Lott.
As regards the second relationship, the fault/program combination, our findings
were:
20
• The cosmetic faults of commission are again the ones that behave worst for all programs. This is not true of the cosmetic faults of omission. • Again, the program classification (data and functions) does not appear to be significant, as no pattern of fault behaviour can be established. This suggests that we should look for other program classifications, taking into account things like complexity, embedding, etc. This will not be taken into account in Experiment II, and will be left for future research. • Again, we have encountered problems with the fault classification, as we were unable to establish any fault type pattern with regard to the programs developed. This will be further investigated in Experiment II, creating two versions of each program, as mentioned above.
4 Round 2: Experiment II
We have run another experiment based on the findings of the first, which involved refining the earlier experiment to be able to reach conclusions that could not be drawn from Experiment I due to design limitations.
4.1 Hypothesis, Parameters and Response Variable
The goal of this second experiment is to investigate three things: • Influence of fault visibility. We were unable to deduce from the earlier experiment whether the fact that a subject does not detect a fault is because the technique does not produce a test case that causes the failure to occur or because the actual subject does not observe the failure when it occurs. This was due to the fact that subjects executed the test cases that they generated to detect the possible program faults. In this experiment, the subjects will be asked to execute a set of test cases that we generate and that detect all the program defects. Accordingly, we will find out how visible the failures caused by the faults are. Additionally, by examining the test cases generated by each individual, we will be able to find out which faults the test cases generated by a given technique potentially detect. • Influence of the technique and fault type. Owing to the above, we cannot be sure that the findings reached in the earlier experiment with regard to the fault/technique interaction are true. Therefore, we want to investigate to what extent the use of one or another testing technique influences fault detection again. • Influence of fault position. In the earlier experiment, we also saw discovered that there was practically no difference between the number of people who detected each fault for code review. This prompted us to look for another fault characteristic that may influence review effectiveness. It occurred to us that it might perhaps be easier to see certain faults because of their position in the program. This will also be investigated.
Another result of the earlier experiment was that the program classification used was not useful for identifying the behavioural differences between the techniques with regard to programs. However, this is something that has been left for future research
21
and will not be taken into account in this experiment, which will employ a subset of the programs used in Experiment I.
Additionally, the experimental design has been changed, as detailed later in the respective sections.
Accordingly, Experiment II will test the hypotheses investigated in Experiment I (see section 3.1), plus the following:
H06: The visibility of the failures generated by the faults has no impact on effectiveness.
H16: The visibility of the failures generated by the faults has an impact on effectiveness.
H07: The position of the faults has no impact on effectiveness. H17: The position of the faults has an impact on effectiveness. Both the parameters and the response variable used for this experiment are the
same as used in the earlier experiment.
4.2 Factors and Alternatives
The earlier experiment was composed of three factors: technique, fault and program. Although we have already mentioned that this experiment will not investigate the impact of the program, this does not mean that it should no longer appear as a factor, since its influence has already been confirmed. Moreover, we found some indications in the earlier experiment that perhaps the fault classification we were using was not suitable. We were, however, unable to confirm this for two reasons. One, which we have already mentioned, is related to the influence of failure visibility on fault detection. The other is that three of the six faults entered in the program occurred only once, whereas the other three were replicated (occurred twice). As the programs are not very long, however, it is not possible to insert a lot of faults, so we opted to implement two versions of each program. This will provide for fault replication in the programs. The version is introduced as a new factor in the experiment.
4.2.1 Factor 1: Fault types The same fault types as used for the first experiment will be employed, save that the number of faults will vary as a result of the introduction of the version factor. In this case, the programs will each include 7 faults, these being: • F1: Cosmetic, omission. • F2: Cosmetic, commission. • F3: Initialisation, omission. • F4: Initialisation, commission. • F5: Control, commission. • F6: Control, omission. • F7: Computation, commission. Clearly, all the fault types are different, which was not the case in Experiment I.
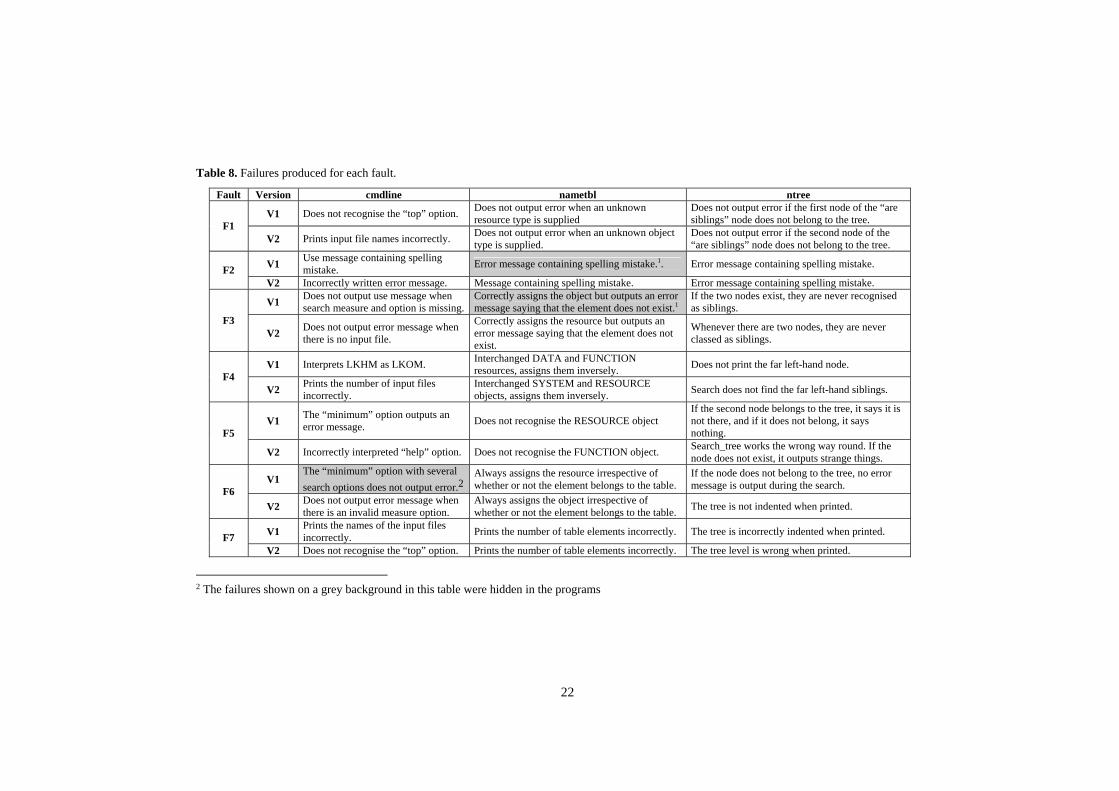
We did this because there are two versions for each program in Experiment II, this being how the faults are replicated. Additionally, we have tried to assure, as far as possible, that the same faults generate the same failures. They are shown in Table 8.
22
Table 8. Failures produced for each fault.
Fault Version cmdline nametbl ntree
V1 Does not recognise the “top” option. Does not output error when an unknown resource type is supplied
Does not output error if the first node of the “are siblings” node does not belong to the tree. F1
V2 Prints input file names incorrectly. Does not output error when an unknown object type is supplied.
Does not output error if the second node of the “are siblings” node does not belong to the tree.
V1 Use message containing spelling mistake. Error message containing spelling mistake.1. Error message containing spelling mistake. F2
V2 Incorrectly written error message. Message containing spelling mistake. Error message containing spelling mistake.
V1 Does not output use message when search measure and option is missing.
Correctly assigns the object but outputs an error message saying that the element does not exist.1
If the two nodes exist, they are never recognised as siblings.
F3 V2 Does not output error message when
there is no input file.
Correctly assigns the resource but outputs an error message saying that the element does not exist.
Whenever there are two nodes, they are never classed as siblings.
V1 Interprets LKHM as LKOM. Interchanged DATA and FUNCTION resources, assigns them inversely. Does not print the far left-hand node.
F4 V2 Prints the number of input files
incorrectly. Interchanged SYSTEM and RESOURCE objects, assigns them inversely. Search does not find the far left-hand siblings.
V1 The “minimum” option outputs an error message. Does not recognise the RESOURCE object
If the second node belongs to the tree, it says it is not there, and if it does not belong, it says nothing. F5
V2 Incorrectly interpreted “help” option. Does not recognise the FUNCTION object. Search_tree works the wrong way round. If the node does not exist, it outputs strange things.
V1 The “minimum” option with several search options does not output error.2
Always assigns the resource irrespective of whether or not the element belongs to the table.
If the node does not belong to the tree, no error message is output during the search. F6
V2 Does not output error message when there is an invalid measure option.
Always assigns the object irrespective of whether or not the element belongs to the table. The tree is not indented when printed.
V1 Prints the names of the input files incorrectly. Prints the number of table elements incorrectly. The tree is incorrectly indented when printed. F7
V2 Does not recognise the “top” option. Prints the number of table elements incorrectly. The tree level is wrong when printed.
2 The failures shown on a grey background in this table were hidden in the programs
23
4.2.2 Factor 2: Techniques The same techniques as in the first experiment will be used in this experiment. However, the procedure followed to run the structural and functional tests will differ, because, as already discussed, we intend to separate test case generation and fault detection by the tester from each other. • The subjects will apply the technique to generate test cases. These test cases will be used in the experimental analysis to determine what faults each technique detects. • Afterwards, the subjects will execute the test cases we supply, which detect all the program faults. This will enable us to examine whether failure visibility influences failure detection, that is, to check whether the results obtained in Experiment I on the functional and structural techniques are valid and there is no bias.
4.2.3 Factor 3: Program Of the four programs used for the first experiment, one will be discarded. Accordingly, for this experiment, we will use the three genuine programs that came with the original experimental package. The reason for this was to balance the experimental design. We found from the previous experiment that randomisation was perhaps not enough to isolate the possible effect of subject capability on whether or not they detect a fault. Therefore, this experiment has been designed differently, and the subject has been introduced as a blocking variable.
4.2.4 Factor 4: Version We have already discussed the reason for introducing program versions. The idea is to replicate all the faults under study for each program. As the programs are small in size, we cannot insert as many faults as we would like to without violating the premise of some faults masking others. The solution to this problem is to introduce the concept of version: two versions differ as to the faults they contain, but they always have to contain the same number of faults and the faults have to be of the same type.
4.3 Experimental Design
For this experiment, we have 46 subjects. As discussed above, this time each subject will apply all three techniques, leading to the experimental design shown in Table 9 and Table 10. Each group in the experiment will be composed of 7 to 8 people.
4.4 Data Analysis
Again, we have used the ANOVA for data analysis. For ease of reading, we have structured the analysis of Experiment II differently to the analysis of Experiment I. This time we will conduct the analysis on the basis of the findings of Experiment I and discussing the results of Experiment II with respect to the results of Experiment I.
24
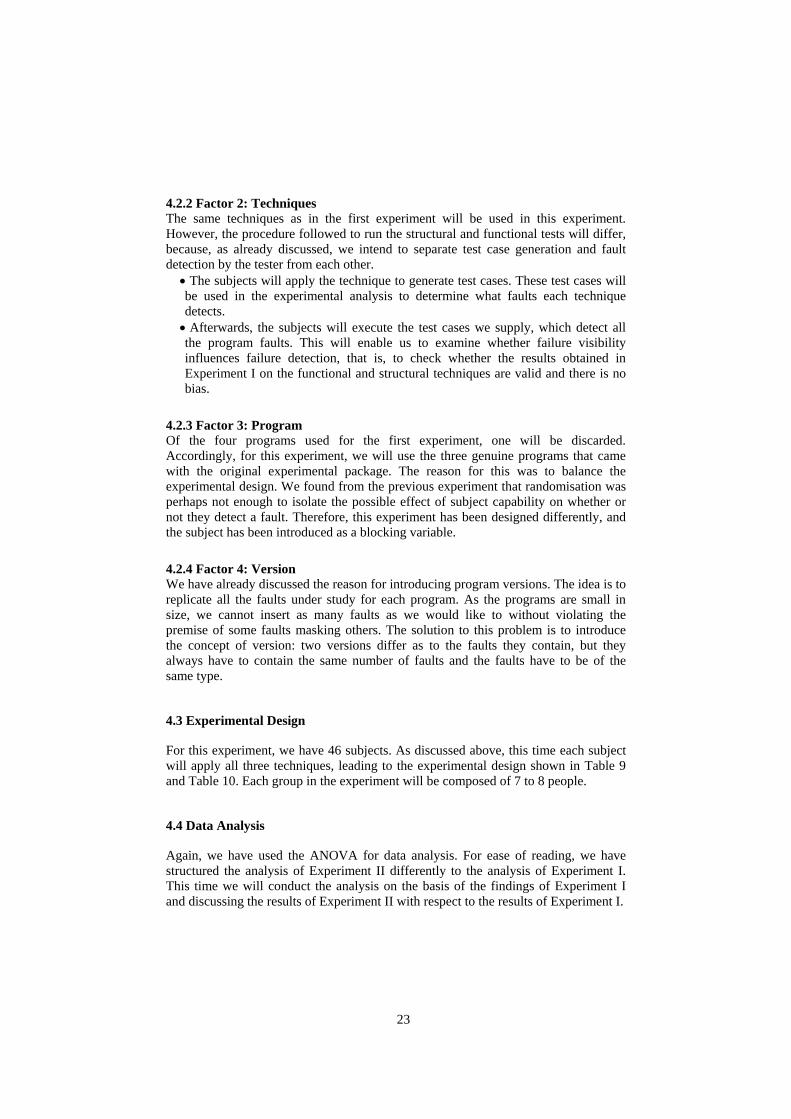
Table 9. Experimental design.
Program cmdline ntree nametbl Technique I S F I S F I S F Group 1 X - - - X - - - X Group 2 X - - - - X - X - Group 3 - X - - - X X - - Group 4 - X - X - - - - X Group 5 - - X X - - - X - Group 6 - - X - X - X - -
Table 10. Experiment execution.
Day Day 1 Day 2 Day 3 Program cmdline ntree nametbl Group 1, Group 2 Group 3, Group 4 Group 5, Group 6
Review Structural Functional
Group 4, Group 5 Group 1, Group 6 Group 2, Group 3
Review Structural Functional
Group 3, Group 6 Group 2, Group 5 Group 1, Group 4
Review Structural Functional
The results of each of the three aspects examined during this experiment, which are influence of the testing technique and fault type, failure visibility and fault visibility for code review, are discussed below. Annex II contains the ANOVA tables.
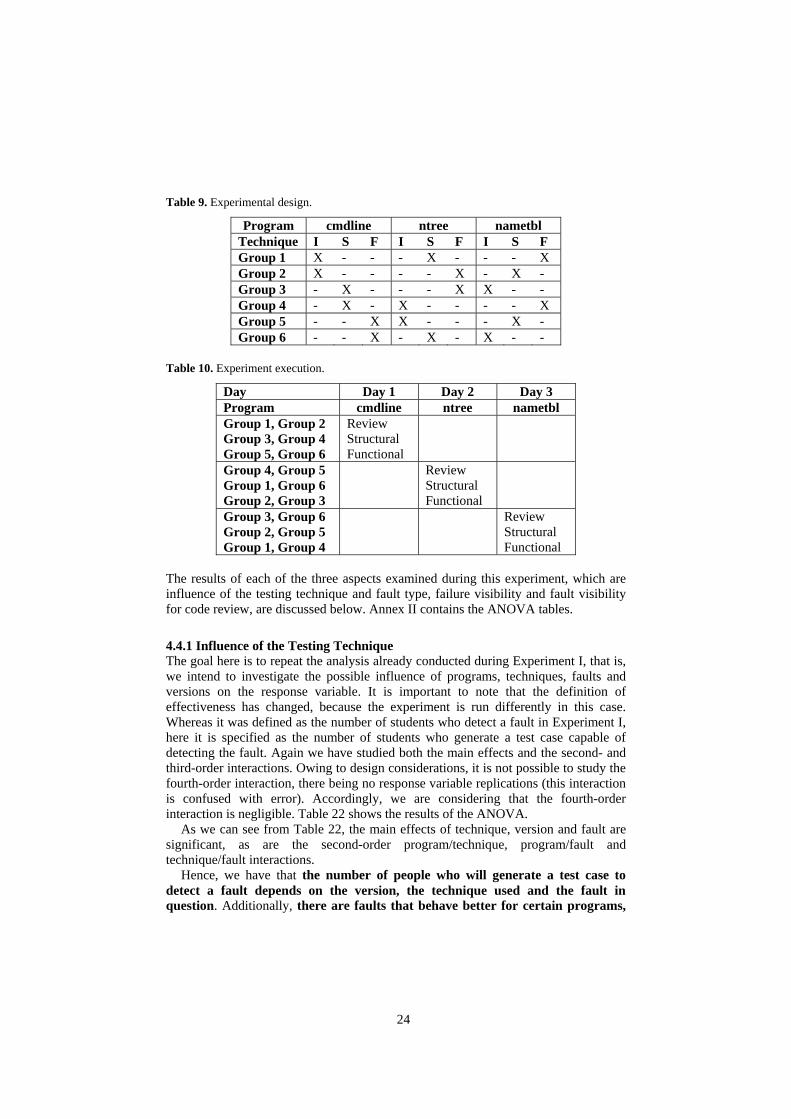
4.4.1 Influence of the Testing Technique The goal here is to repeat the analysis already conducted during Experiment I, that is, we intend to investigate the possible influence of programs, techniques, faults and versions on the response variable. It is important to note that the definition of effectiveness has changed, because the experiment is run differently in this case. Whereas it was defined as the number of students who detect a fault in Experiment I, here it is specified as the number of students who generate a test case capable of detecting the fault. Again we have studied both the main effects and the second- and third-order interactions. Owing to design considerations, it is not possible to study the fourth-order interaction, there being no response variable replications (this interaction is confused with error). Accordingly, we are considering that the fourth-order interaction is negligible. Table 22 shows the results of the ANOVA.
As we can see from Table 22, the main effects of technique, version and fault are significant, as are the second-order program/technique, program/fault and technique/fault interactions.
Hence, we have that the number of people who will generate a test case to detect a fault depends on the version, the technique used and the fault in question. Additionally, there are faults that behave better for certain programs,
25
faults that are better detected using certain techniques and programs that behave better for certain techniques.
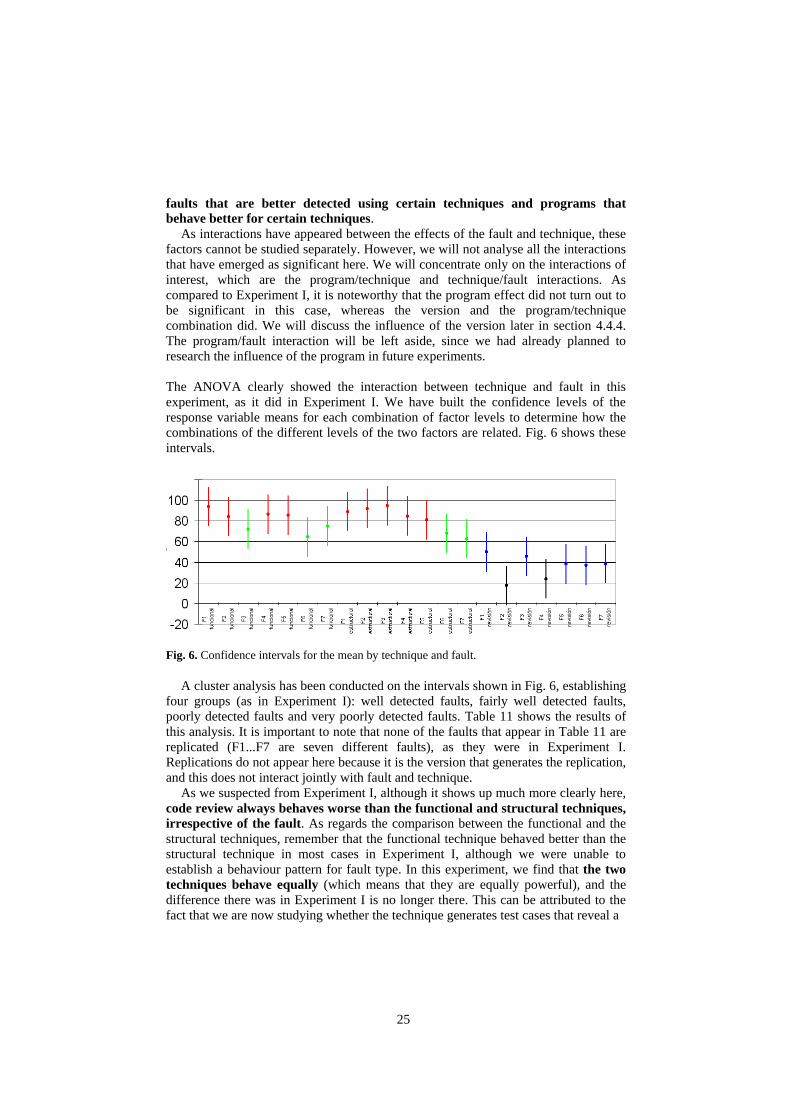
As interactions have appeared between the effects of the fault and technique, these factors cannot be studied separately. However, we will not analyse all the interactions that have emerged as significant here. We will concentrate only on the interactions of interest, which are the program/technique and technique/fault interactions. As compared to Experiment I, it is noteworthy that the program effect did not turn out to be significant in this case, whereas the version and the program/technique combination did. We will discuss the influence of the version later in section 4.4.4. The program/fault interaction will be left aside, since we had already planned to research the influence of the program in future experiments. The ANOVA clearly showed the interaction between technique and fault in this experiment, as it did in Experiment I. We have built the confidence levels of the response variable means for each combination of factor levels to determine how the combinations of the different levels of the two factors are related. Fig. 6 shows these intervals.
Fig. 6. Confidence intervals for the mean by technique and fault.
A cluster analysis has been conducted on the intervals shown in Fig. 6, establishing four groups (as in Experiment I): well detected faults, fairly well detected faults, poorly detected faults and very poorly detected faults. Table 11 shows the results of this analysis. It is important to note that none of the faults that appear in Table 11 are replicated (F1...F7 are seven different faults), as they were in Experiment I. Replications do not appear here because it is the version that generates the replication, and this does not interact jointly with fault and technique.
As we suspected from Experiment I, although it shows up much more clearly here, code review always behaves worse than the functional and structural techniques, irrespective of the fault. As regards the comparison between the functional and the structural techniques, remember that the functional technique behaved better than the structural technique in most cases in Experiment I, although we were unable to establish a behaviour pattern for fault type. In this experiment, we find that the two techniques behave equally (which means that they are equally powerful), and the difference there was in Experiment I is no longer there. This can be attributed to the fact that we are now studying whether the technique generates test cases that reveal a
26
Table 11. Cluster analysis results for four groups.
Group Functional Structural Review Group 1
(well detected)
F1 (Cs,O) F2 (Cs,C) F4 (I,C) F5 (C,C)
F1 (Cs,O) F2 (Cs,C) F3 (I,O) F4 (I,C) F5 (C,C)
--
Group 2 (fairly well detected)
F3 (I,O) F6 (C,O)
F7 (Cm,C)
F6 (C,O) F7 (Cm,C) --
Group 3 (poorly
detected) -- --
F1 (Cs,O) F3 (I,O) F5 (C,C) F6 (C,O)
F7 (Cm,C) Group 4
(very poorly
detected)
-- -- F2 (Cs,C) F4 (I,C)
given fault type. What Table 11 tells us is that both the functional and the structural techniques are equally effective at generating test cases. Additionally, the behaviour pattern for fault types, which we were unable to establish from Experiment I, can be found here, as we can see that there are faults that behave worse than others (as is the case of F6 and F7).
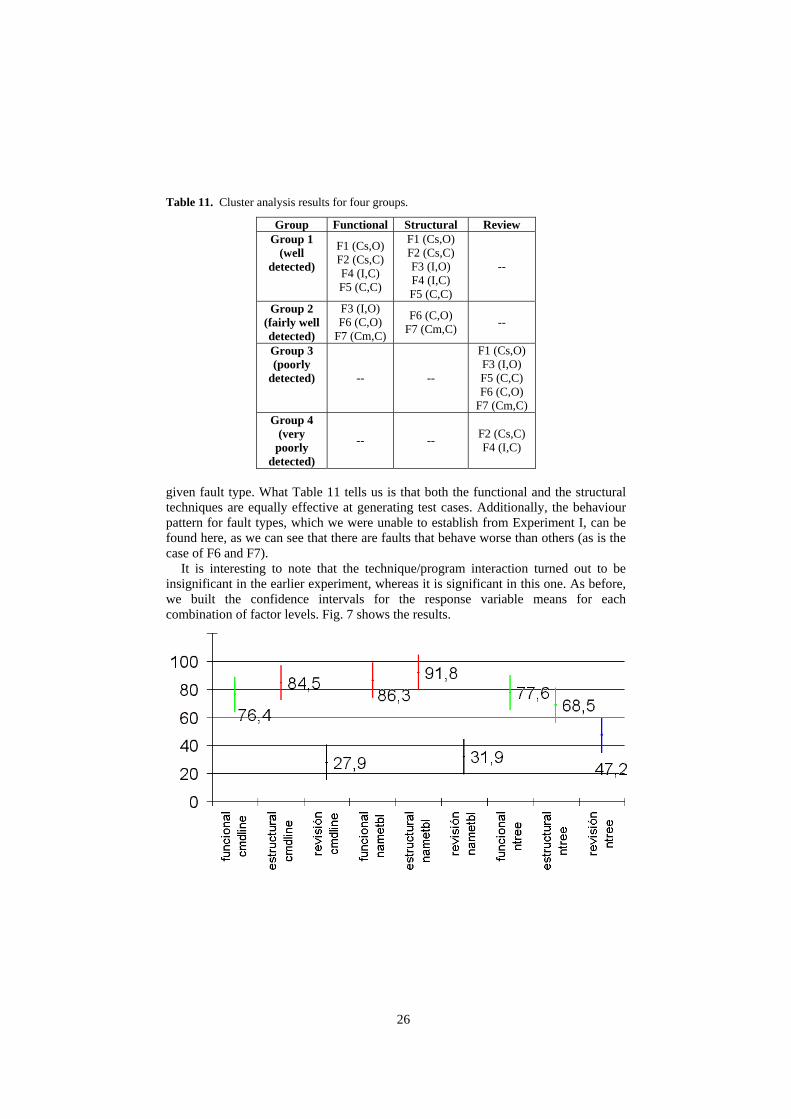
It is interesting to note that the technique/program interaction turned out to be insignificant in the earlier experiment, whereas it is significant in this one. As before, we built the confidence intervals for the response variable means for each combination of factor levels. Fig. 7 shows the results.
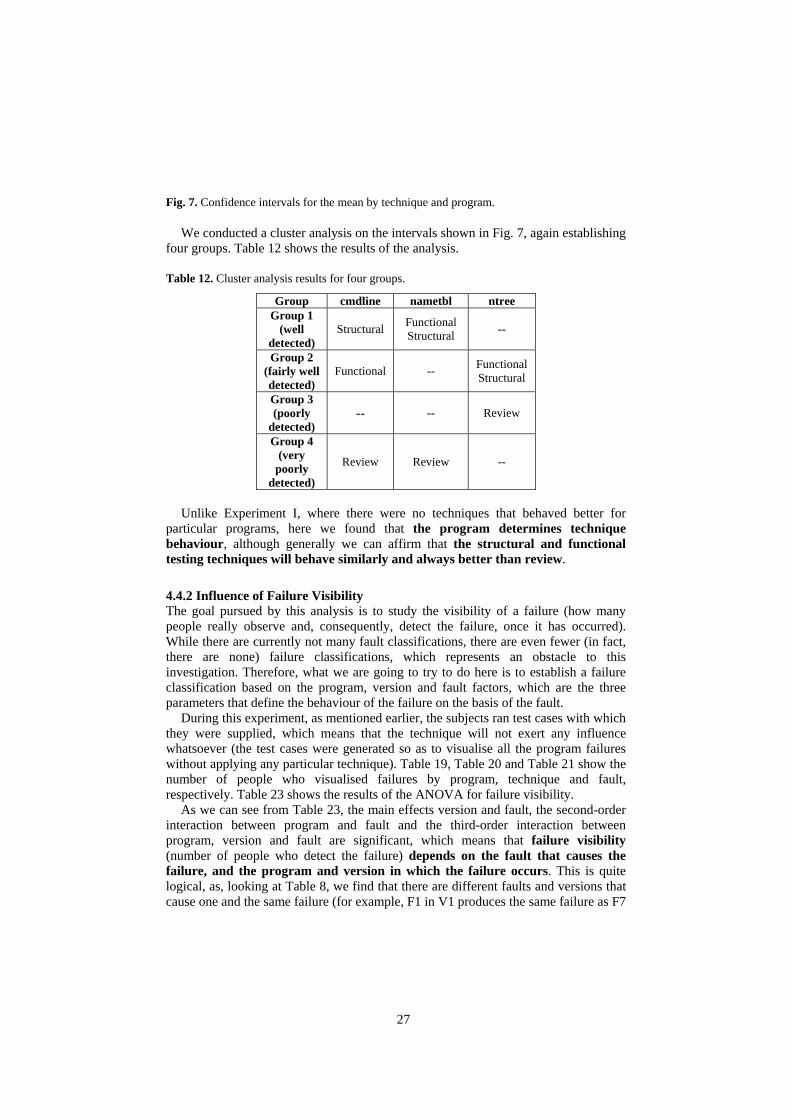
27
Fig. 7. Confidence intervals for the mean by technique and program.
We conducted a cluster analysis on the intervals shown in Fig. 7, again establishing four groups. Table 12 shows the results of the analysis.
Table 12. Cluster analysis results for four groups.
Group cmdline nametbl ntree Group 1
(well detected)
Structural Functional Structural --
Group 2 (fairly well detected)
Functional -- Functional Structural
Group 3 (poorly
detected) -- -- Review
Group 4 (very
poorly detected)
Review Review --
Unlike Experiment I, where there were no techniques that behaved better for
particular programs, here we found that the program determines technique behaviour, although generally we can affirm that the structural and functional testing techniques will behave similarly and always better than review.
4.4.2 Influence of Failure Visibility The goal pursued by this analysis is to study the visibility of a failure (how many people really observe and, consequently, detect the failure, once it has occurred). While there are currently not many fault classifications, there are even fewer (in fact, there are none) failure classifications, which represents an obstacle to this investigation. Therefore, what we are going to try to do here is to establish a failure classification based on the program, version and fault factors, which are the three parameters that define the behaviour of the failure on the basis of the fault.
During this experiment, as mentioned earlier, the subjects ran test cases with which they were supplied, which means that the technique will not exert any influence whatsoever (the test cases were generated so as to visualise all the program failures without applying any particular technique). Table 19, Table 20 and Table 21 show the number of people who visualised failures by program, technique and fault, respectively. Table 23 shows the results of the ANOVA for failure visibility.
As we can see from Table 23, the main effects version and fault, the second-order interaction between program and fault and the third-order interaction between program, version and fault are significant, which means that failure visibility (number of people who detect the failure) depends on the fault that causes the failure, and the program and version in which the failure occurs. This is quite logical, as, looking at Table 8, we find that there are different faults and versions that cause one and the same failure (for example, F1 in V1 produces the same failure as F7
28
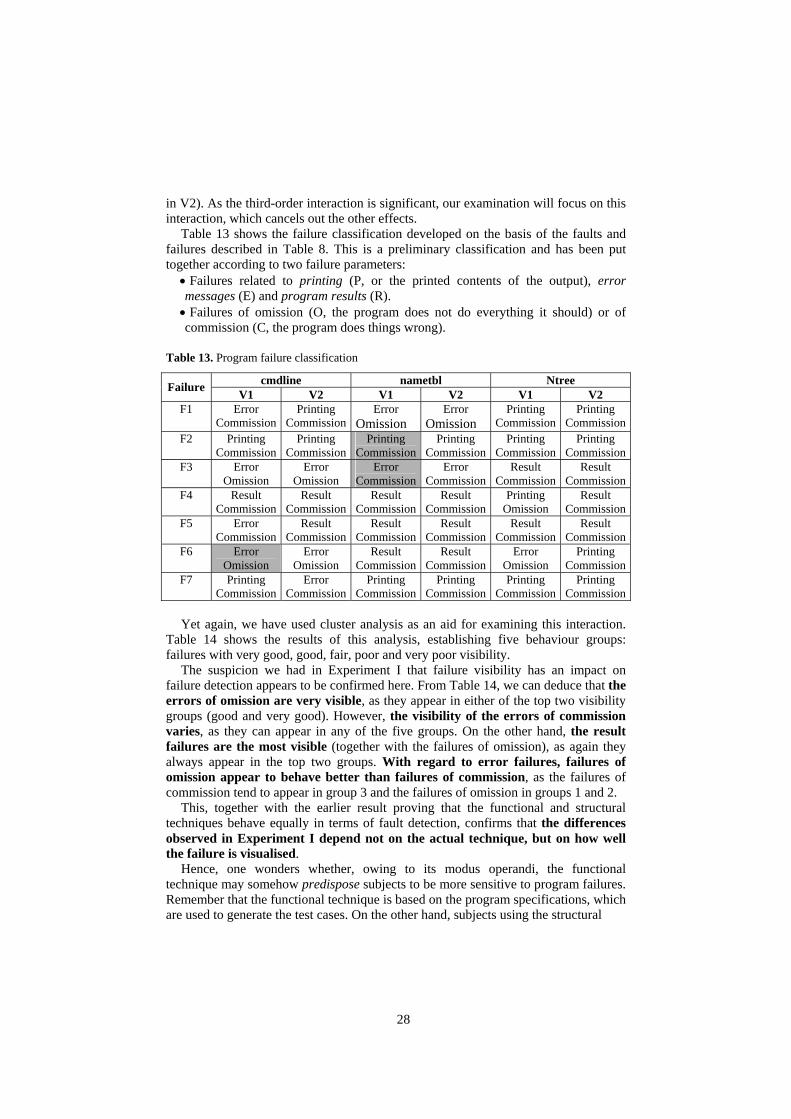
in V2). As the third-order interaction is significant, our examination will focus on this interaction, which cancels out the other effects.
Table 13 shows the failure classification developed on the basis of the faults and failures described in Table 8. This is a preliminary classification and has been put together according to two failure parameters: • Failures related to printing (P, or the printed contents of the output), error messages (E) and program results (R). • Failures of omission (O, the program does not do everything it should) or of commission (C, the program does things wrong).
Table 13. Program failure classification
cmdline nametbl Ntree Failure V1 V2 V1 V2 V1 V2 F1 Error
Commission Printing
CommissionError
Omission Error
Omission Printing
CommissionPrinting
Commission F2 Printing
Commission Printing
CommissionPrinting
CommissionPrinting
CommissionPrinting
CommissionPrinting
Commission F3 Error
Omission Error
Omission Error
CommissionError
CommissionResult
CommissionResult
Commission F4 Result
Commission Result
CommissionResult
CommissionResult
CommissionPrinting
Omission Result
Commission F5 Error
Commission Result
CommissionResult
CommissionResult
CommissionResult
CommissionResult
Commission F6 Error
Omission Error
Omission Result
CommissionResult
CommissionError
Omission Printing
Commission F7 Printing
Commission Error
CommissionPrinting
CommissionPrinting
CommissionPrinting
CommissionPrinting
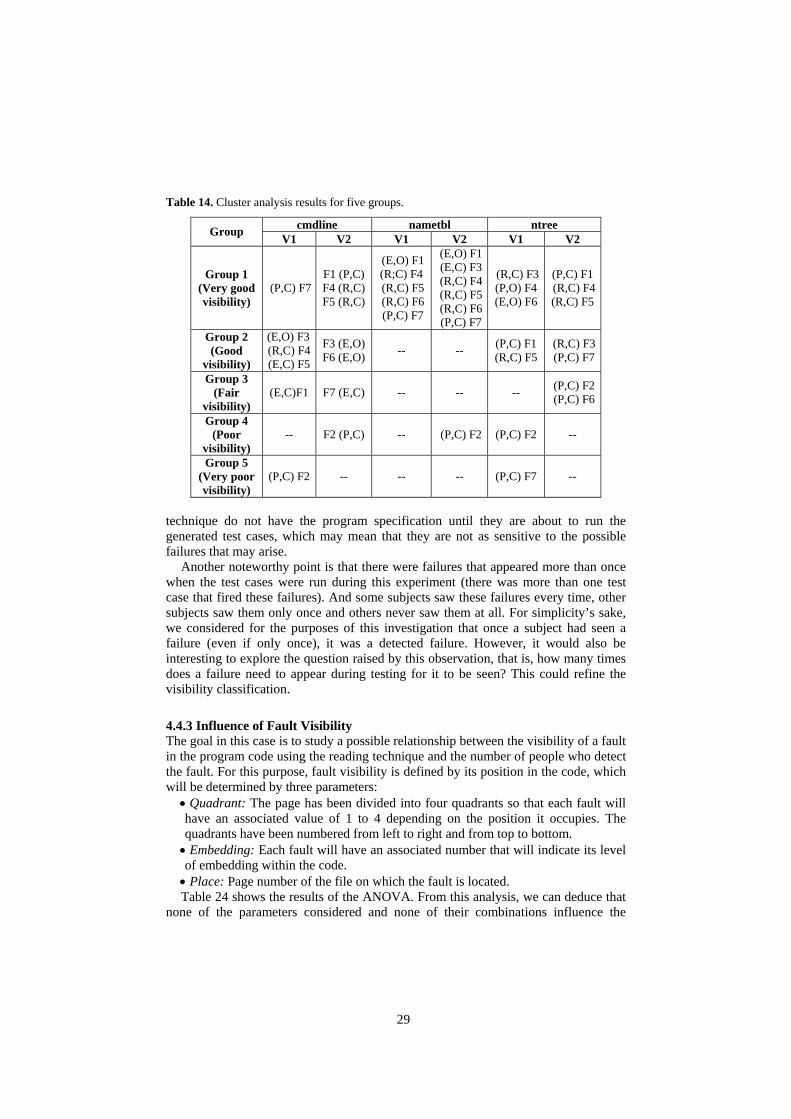
Commission Yet again, we have used cluster analysis as an aid for examining this interaction.
Table 14 shows the results of this analysis, establishing five behaviour groups: failures with very good, good, fair, poor and very poor visibility.
The suspicion we had in Experiment I that failure visibility has an impact on failure detection appears to be confirmed here. From Table 14, we can deduce that the errors of omission are very visible, as they appear in either of the top two visibility groups (good and very good). However, the visibility of the errors of commission varies, as they can appear in any of the five groups. On the other hand, the result failures are the most visible (together with the failures of omission), as again they always appear in the top two groups. With regard to error failures, failures of omission appear to behave better than failures of commission, as the failures of commission tend to appear in group 3 and the failures of omission in groups 1 and 2.
This, together with the earlier result proving that the functional and structural techniques behave equally in terms of fault detection, confirms that the differences observed in Experiment I depend not on the actual technique, but on how well the failure is visualised.
Hence, one wonders whether, owing to its modus operandi, the functional technique may somehow predispose subjects to be more sensitive to program failures. Remember that the functional technique is based on the program specifications, which are used to generate the test cases. On the other hand, subjects using the structural
29
Table 14. Cluster analysis results for five groups.
cmdline nametbl ntree Group V1 V2 V1 V2 V1 V2
Group 1 (Very good visibility)
(P,C) F7 F1 (P,C) F4 (R,C) F5 (R,C)
(E,O) F1 (R;C) F4 (R,C) F5 (R,C) F6 (P,C) F7
(E,O) F1 (E,C) F3 (R,C) F4 (R,C) F5 (R,C) F6 (P,C) F7
(R,C) F3(P,O) F4 (E,O) F6
(P,C) F1 (R,C) F4 (R,C) F5
Group 2 (Good
visibility)
(E,O) F3 (R,C) F4 (E,C) F5
F3 (E,O) F6 (E,O) -- -- (P,C) F1
(R,C) F5 (R,C) F3 (P,C) F7
Group 3 (Fair
visibility) (E,C)F1 F7 (E,C) -- -- -- (P,C) F2
(P,C) F6
Group 4 (Poor
visibility) -- F2 (P,C) -- (P,C) F2 (P,C) F2 --
Group 5 (Very poor visibility)
(P,C) F2 -- -- -- (P,C) F7 --
technique do not have the program specification until they are about to run the generated test cases, which may mean that they are not as sensitive to the possible failures that may arise.
Another noteworthy point is that there were failures that appeared more than once when the test cases were run during this experiment (there was more than one test case that fired these failures). And some subjects saw these failures every time, other subjects saw them only once and others never saw them at all. For simplicity’s sake, we considered for the purposes of this investigation that once a subject had seen a failure (even if only once), it was a detected failure. However, it would also be interesting to explore the question raised by this observation, that is, how many times does a failure need to appear during testing for it to be seen? This could refine the visibility classification.
4.4.3 Influence of Fault Visibility The goal in this case is to study a possible relationship between the visibility of a fault in the program code using the reading technique and the number of people who detect the fault. For this purpose, fault visibility is defined by its position in the code, which will be determined by three parameters: • Quadrant: The page has been divided into four quadrants so that each fault will have an associated value of 1 to 4 depending on the position it occupies. The quadrants have been numbered from left to right and from top to bottom. • Embedding: Each fault will have an associated number that will indicate its level of embedding within the code. • Place: Page number of the file on which the fault is located. Table 24 shows the results of the ANOVA. From this analysis, we can deduce that
none of the parameters considered and none of their combinations influence the
30
results and, therefore, the number of subjects who detect a fault using the reading technique does not depend on fault visibility. This means that code review has no preference for specific fault types. This is the same result as we found for the functional and structural techniques, which behave equally for all faults. At this point, one might wonder what advantages review then has over the dynamic techniques. On the one hand, one of the most valuable features of review is that it is applicable not only to code but also to any software product, which enables earlier fault detection and lowers the cost of correction. On the other hand, we have the point identified in Experiment I that review is not influenced by fault interdependency.
4.4.4 Influence of the Version This experiment yielded an unexpected result, which was that the version influenced the number of people who detected a fault. This means that, irrespective of the program, technique and fault type, more subjects generated test cases that detected faults in version 2 than in version 1. Note that the versions 1 and 2 of each program are identical, the only difference being the faults entered.
This is an interesting result, because it says that it is the instance of the actual fault and not the program type or form that determines how well a fault will be detected by the testing techniques. This contrasts with the finding from Experiment I that the program was influential.
This raises the ineludible question of which parameters are likely to influence fault detection by a test case. Could it be how well the subject applies the technique? This is an open question to be addressed in later studies.
5 Conclusions
In this chapter, we presented two successive experiments that aim to clarify the fault detection capability of three code evaluation techniques: two dynamic analysis (functional and structural) and one static analysis (code reading by stepwise abstraction) techniques. The first experiment is based on the earlier findings of the experiment performed by Woods et al., which concluded that the relationship between evaluation techniques and the fault types they detect needed to be investigated.
The design of the first experiment included four programs, four fault types per program (although they contain two faults of three of the types, adding up to a total of nine faults per program) and each subject applied a single technique. From Experiment I, we found that the cosmetic faults showed up worst (irrespective of the technique and the program) and that code review was not affected by the fault type (they were all detected equally). This contrasts with Basili and Selby’s findings, of review detecting better certain types of faults, and Kamsties and Loot’s finding of no difference between fault type. As regards the actual techniques, the functional technique came out better than the structural technique for faults of omission (the same finding as Basily and Selby) and the structural technique behaved equally or better than the functional technique for faults of commission (Basili and Selby did not find this, but all behaved equally), although, on the whole, the functional technique tended to behave better (as in one of the experiments of Basili). However, we did not
31
manage to discern a clear behaviour pattern as regards what fault types each of the two techniques detects better (contrasting with Basili and Selby’s findings).
Some of the findings of Experiment I, however, led to the preparation Experiment II. The fact that not all the faults were replicated in Experiment I led to the creation of two versions of each program in the second experiment. As replicated faults behaved differently (which was strange), we thought that perhaps it could be the failure that caused this variation. Therefore, we examined failure visibility during Experiment II. For this purpose, we generated test cases that detected all the fault and asked the subjects to use these test cases instead of running their own. As the fault did not appear to be have an impact on the static technique, we decided to investigate fault visibility in the static technique in Experiment II. Finally, we also suspected that the subjects might have influenced fault detection in Experiment I, which led us to have all the subjects apply all the techniques rather than just one as in Experiment II.
Experiment II was run on the basis of these premises. The findings from the experiment corroborated some of the suspicions we had had during the first experiment. Firstly, as regards the possible impact of the fault and the technique, we found that the functional and structural techniques behaved identically (this contrasts with Basiili and Selby´s findings of functional technique behaving better). This refutes the finding from Experiment I that the functional technique behaved better than the structural technique for some fault types. This is because there was a hidden effect in Experiment I, namely, failure type. This was influencing failure detection.
As regards failure visibility, this does indeed have an influence. Hence, we have been able to establish a failure taxonomy, where error messages that do not appear and incorrect results are the most visible. So, the results observed in Experiment I were due to failure visibility not to the power of the techniques. It is not clear, however, whether perhaps the functional technique, owing to its modus operandi, tends to make subjects more sensitive to the detection of certain faults. From this we can deduce that it is not only important to teach subjects the testing techniques, but it would also make sense to teach them to see the failures. This would involve training them to use heuristics and checklists concerning the failure types they should look for (for example, check that all the error messages are output and output at the right time). However, the failure visibility classification needs to be refined, which leaves room for an extension of this study.
Additionally, a new thing we found was that the program/technique combination has an impact on the number of faults detected (as Wood et al. already found), although the functional and structural techniques again behaved equally in all cases for the same program. This means that technique effectiveness (irrespective of whether it is the structural or functional technique) is affected by the program. In other words, whatever the technique (structural or function) we apply, it will always be less effective for a given program type than for another.
Another interesting result was that the position of a fault has no influence on the number of people who see the fault using the reading technique. This suggests that we should look for other factors that may have an impact (perhaps experience, which has been addressed in earlier experiments). Although neither of these experiments has taken this into account, aspects like subject experience have been investigated in earlier experiments examining code review effectiveness.
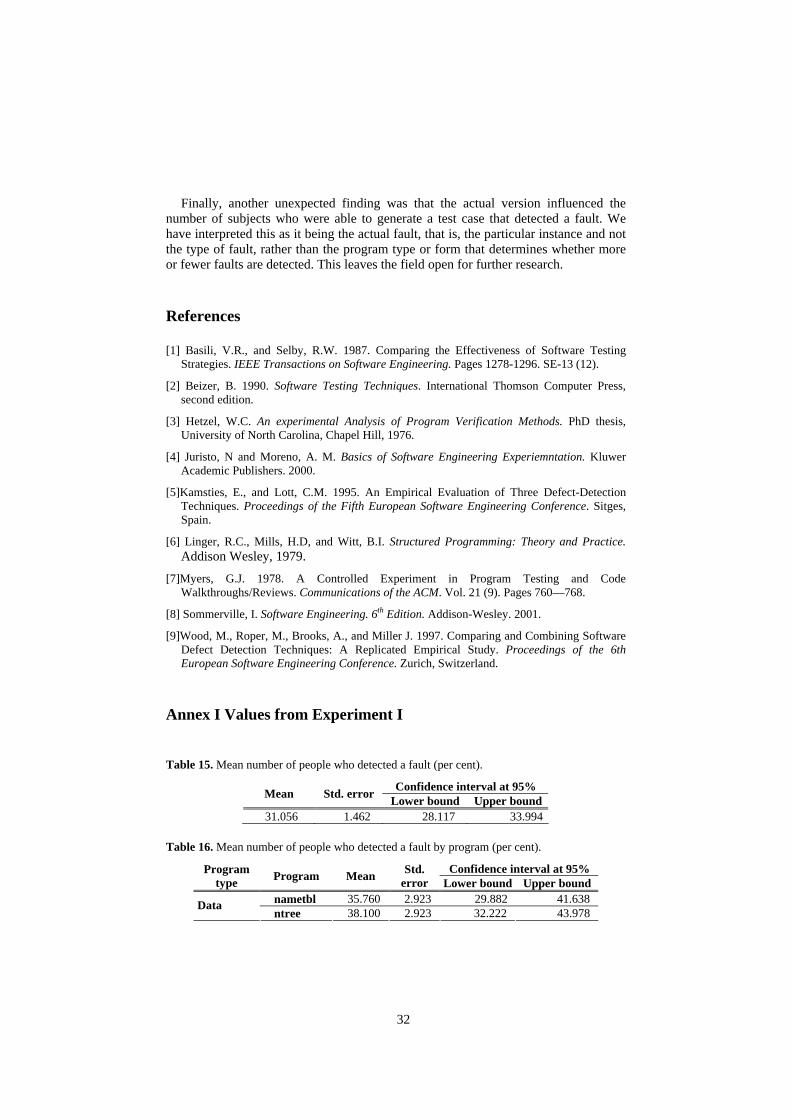
32
Finally, another unexpected finding was that the actual version influenced the number of subjects who were able to generate a test case that detected a fault. We have interpreted this as it being the actual fault, that is, the particular instance and not the type of fault, rather than the program type or form that determines whether more or fewer faults are detected. This leaves the field open for further research.
References
[1] Basili, V.R., and Selby, R.W. 1987. Comparing the Effectiveness of Software Testing Strategies. IEEE Transactions on Software Engineering. Pages 1278-1296. SE-13 (12).
[2] Beizer, B. 1990. Software Testing Techniques. International Thomson Computer Press, second edition.
[3] Hetzel, W.C. An experimental Analysis of Program Verification Methods. PhD thesis, University of North Carolina, Chapel Hill, 1976.
[4] Juristo, N and Moreno, A. M. Basics of Software Engineering Experiemntation. Kluwer Academic Publishers. 2000.
[5]Kamsties, E., and Lott, C.M. 1995. An Empirical Evaluation of Three Defect-Detection Techniques. Proceedings of the Fifth European Software Engineering Conference. Sitges, Spain.
[6] Linger, R.C., Mills, H.D, and Witt, B.I. Structured Programming: Theory and Practice. Addison Wesley, 1979.
[7]Myers, G.J. 1978. A Controlled Experiment in Program Testing and Code Walkthroughs/Reviews. Communications of the ACM. Vol. 21 (9). Pages 760—768.
[8] Sommerville, I. Software Engineering. 6th Edition. Addison-Wesley. 2001.
[9]Wood, M., Roper, M., Brooks, A., and Miller J. 1997. Comparing and Combining Software Defect Detection Techniques: A Replicated Empirical Study. Proceedings of the 6th European Software Engineering Conference. Zurich, Switzerland.
Annex I Values from Experiment I
Table 15. Mean number of people who detected a fault (per cent).
Confidence interval at 95% Mean Std. error Lower bound Upper bound 31.056 1.462 28.117 33.994
Table 16. Mean number of people who detected a fault by program (per cent).
Confidence interval at 95% Program type Program Mean Std.
error Lower bound Upper bound nametbl 35.760 2.923 29.882 41.638 Data ntree 38.100 2.923 32.222 43.978
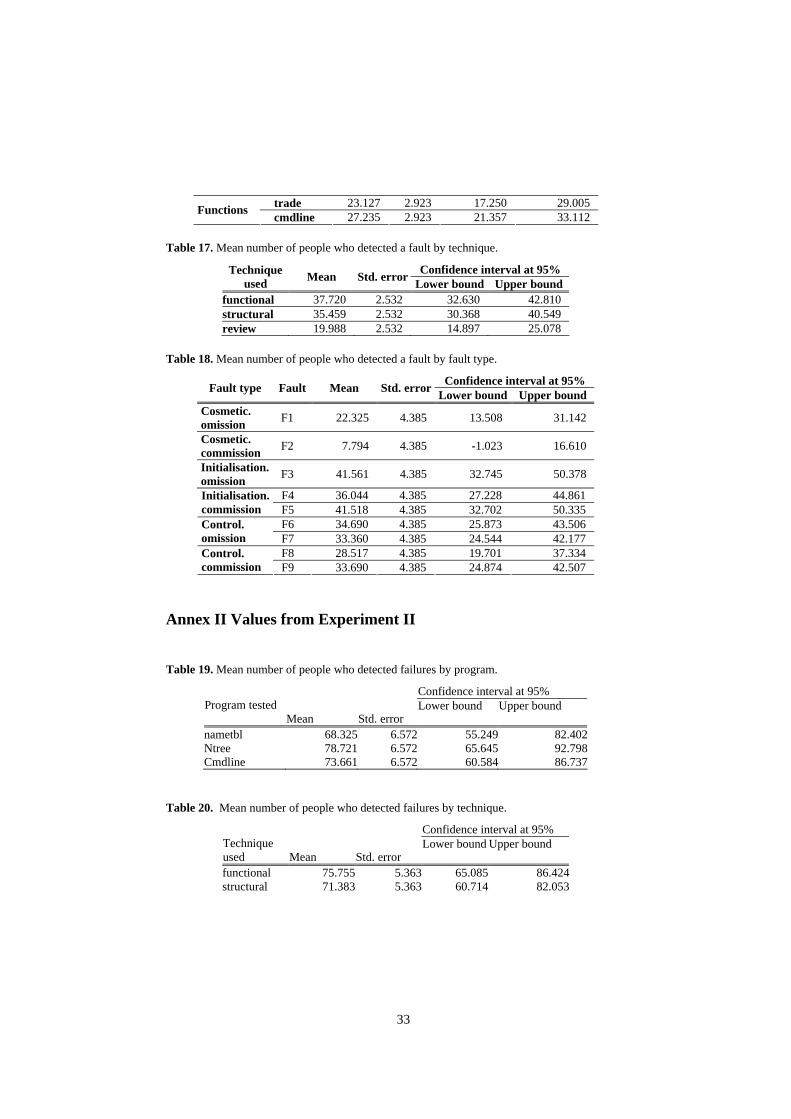
33
trade 23.127 2.923 17.250 29.005 Functions cmdline 27.235 2.923 21.357 33.112
Table 17. Mean number of people who detected a fault by technique.
Confidence interval at 95% Technique used Mean Std. error Lower bound Upper bound
functional 37.720 2.532 32.630 42.810 structural 35.459 2.532 30.368 40.549 review 19.988 2.532 14.897 25.078
Table 18. Mean number of people who detected a fault by fault type.
Confidence interval at 95% Fault type Fault Mean Std. error Lower bound Upper bound Cosmetic. omission F1 22.325 4.385 13.508 31.142
Cosmetic. commission F2 7.794 4.385 -1.023 16.610
Initialisation. omission F3 41.561 4.385 32.745 50.378
F4 36.044 4.385 27.228 44.861 Initialisation. commission F5 41.518 4.385 32.702 50.335
F6 34.690 4.385 25.873 43.506 Control. omission F7 33.360 4.385 24.544 42.177
F8 28.517 4.385 19.701 37.334 Control. commission F9 33.690 4.385 24.874 42.507
Annex II Values from Experiment II
Table 19. Mean number of people who detected failures by program.
Confidence interval at 95% Program tested
Mean
Std. error
Lower bound Upper bound
nametbl 68.325 6.572 55.249 82.402Ntree 78.721 6.572 65.645 92.798Cmdline 73.661 6.572 60.584 86.737
Table 20. Mean number of people who detected failures by technique.
Confidence interval at 95% Technique used
Mean
Std. error
Lower bound Upper bound
functional 75.755 5.363 65.085 86.424structural 71.383 5.363 60.714 82.053
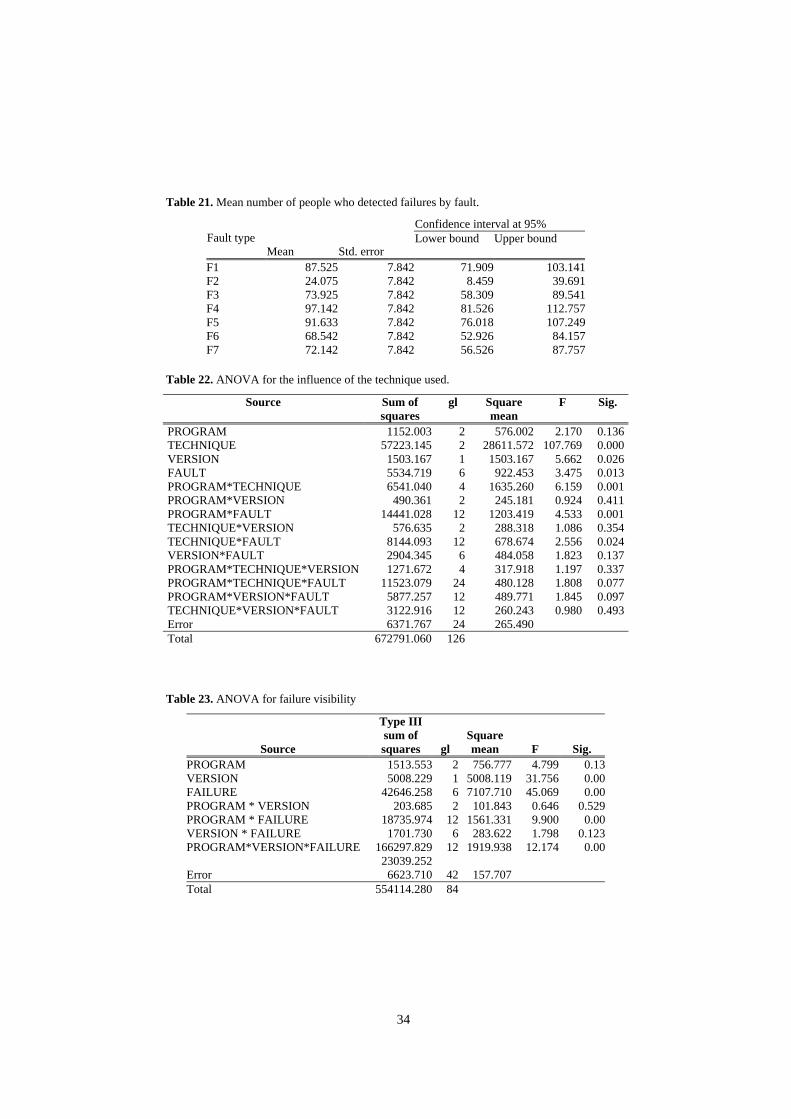
34
Table 21. Mean number of people who detected failures by fault.
Confidence interval at 95% Fault type
Mean
Std. error
Lower bound Upper bound
F1 87.525 7.842 71.909 103.141F2 24.075 7.842 8.459 39.691F3 73.925 7.842 58.309 89.541F4 97.142 7.842 81.526 112.757F5 91.633 7.842 76.018 107.249F6 68.542 7.842 52.926 84.157F7 72.142 7.842 56.526 87.757
Table 22. ANOVA for the influence of the technique used.
Source Sum of squares
gl Square mean
F Sig.
PROGRAM 1152.003 2 576.002 2.170 0.136 TECHNIQUE 57223.145 2 28611.572 107.769 0.000 VERSION 1503.167 1 1503.167 5.662 0.026 FAULT 5534.719 6 922.453 3.475 0.013 PROGRAM*TECHNIQUE 6541.040 4 1635.260 6.159 0.001 PROGRAM*VERSION 490.361 2 245.181 0.924 0.411 PROGRAM*FAULT 14441.028 12 1203.419 4.533 0.001 TECHNIQUE*VERSION 576.635 2 288.318 1.086 0.354 TECHNIQUE*FAULT 8144.093 12 678.674 2.556 0.024 VERSION*FAULT 2904.345 6 484.058 1.823 0.137 PROGRAM*TECHNIQUE*VERSION 1271.672 4 317.918 1.197 0.337 PROGRAM*TECHNIQUE*FAULT 11523.079 24 480.128 1.808 0.077 PROGRAM*VERSION*FAULT 5877.257 12 489.771 1.845 0.097 TECHNIQUE*VERSION*FAULT 3122.916 12 260.243 0.980 0.493 Error 6371.767 24 265.490 Total 672791.060 126
Table 23. ANOVA for failure visibility
Source
Type III sum of squares
gl
Square mean
F
Sig. PROGRAM 1513.553 2 756.777 4.799 0.13 VERSION 5008.229 1 5008.119 31.756 0.00 FAILURE 42646.258 6 7107.710 45.069 0.00 PROGRAM * VERSION 203.685 2 101.843 0.646 0.529 PROGRAM * FAILURE 18735.974 12 1561.331 9.900 0.00 VERSION * FAILURE 1701.730 6 283.622 1.798 0.123 PROGRAM*VERSION*FAILURE 166297.829
23039.25212 1919.938 12.174 0.00
Error 6623.710 42 157.707 Total 554114.280 84
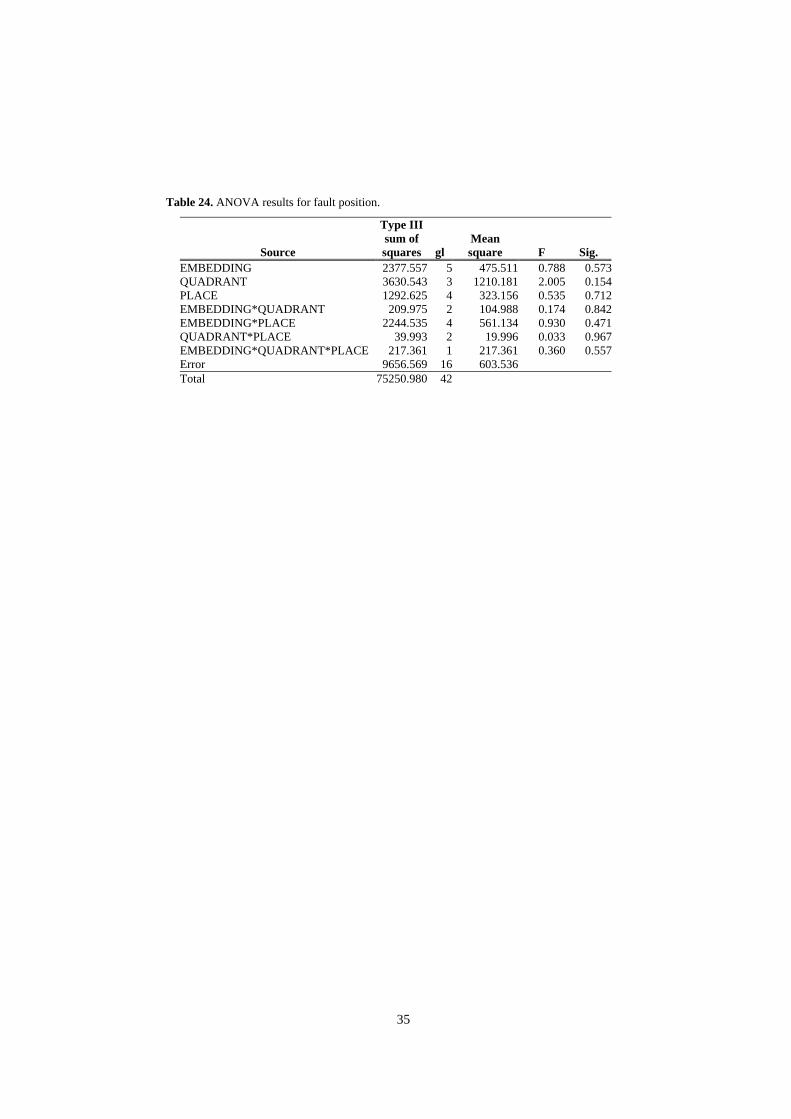
35
Table 24. ANOVA results for fault position.
Source
Type III sum of squares
gl
Mean square
F
Sig. EMBEDDING 2377.557 5 475.511 0.788 0.573QUADRANT 3630.543 3 1210.181 2.005 0.154PLACE 1292.625 4 323.156 0.535 0.712EMBEDDING*QUADRANT 209.975 2 104.988 0.174 0.842EMBEDDING*PLACE 2244.535 4 561.134 0.930 0.471QUADRANT*PLACE 39.993 2 19.996 0.033 0.967EMBEDDING*QUADRANT*PLACE 217.361 1 217.361 0.360 0.557Error 9656.569 16 603.536Total 75250.980 42