Embed Size (px)
Citation preview

Functional specialization of Arabidopsis poly(A) polymerases
in relation to flowering time and stress
Dissertation
zur Erlangung des akademischen Grades
doctor rerum naturalium (Dr. rer. nat.)
eingereicht an der
Mathematisch-Naturwissenschaftlichen Fakultät der Universität Potsdam
Institut für Biochemie und Biologie
von
Hjördis Czesnick
geboren am 22.04.1985 in Berlin

Published online at the Institutional Repository of the University of Potsdam: URN urn:nbn:de:kobv:517-opus4-78015 http://nbn-resolving.de/urn:nbn:de:kobv:517-opus4-78015
Contents 3
Contents
Contents .................................................................................................................................................. 3
Abbreviations .......................................................................................................................................... 7
List of Figures ......................................................................................................................................... 10
List of Tables .......................................................................................................................................... 11
Summary ............................................................................................................................................... 12
Zusammenfassung ................................................................................................................................. 13
1. Introduction ................................................................................................................................... 14
1.1 Poly(A) polymerases: functions and implications in gene expression regulation ................. 14
1.1.1 The 3’ end processing complex regulates transcriptional termination ........................ 14
1.1.2 The regulation of alternative polyadenylation .............................................................. 18
1.1.3 Canonical poly(A) polymerases ..................................................................................... 19
1.1.4 Poly(A) tail length control and its implications for gene expression regulation ........... 23
1.2 Control of flowering time and the role of 3’ end processing ................................................ 24
1.2.1 The flowering time network: Key regulators and pathways in Arabidopsis ................. 24
1.2.2 The autonomous pathway............................................................................................. 27
1.2.3 The regulation of FLC expression by non-coding FLC transcripts .................................. 30
1.3 Plant acclimations to stress ................................................................................................... 33
1.3.1 Plants are stressed constantly ....................................................................................... 33
1.3.2 Molecular acclimations of plant cells to oxidative stress .............................................. 36
1.3.3 CPSF30-mediated alternative polyadenylation regulates the response to oxidative stress.............................................................................................................................. 37
1.4 Aim ........................................................................................................................................ 40
2. Material and Methods ................................................................................................................... 41
2.1 Material ................................................................................................................................. 41
2.1.1 Chemicals ....................................................................................................................... 41
2.1.2 Technical equipment ..................................................................................................... 41
2.1.3 Disposable equipment ................................................................................................... 41
2.1.4 Microorganisms ............................................................................................................. 41
2.1.5 Enzymes and antibodies ................................................................................................ 41
2.1.6 Plant materials ............................................................................................................... 41
2.1.7 Antibiotics and herbicides ............................................................................................. 42
2.2 Plant cultivation ..................................................................................................................... 43
2.2.1 Cultivation on soil .......................................................................................................... 43
2.2.2 Cultivation on plates ...................................................................................................... 44
2.2.3 Seed sterilization with chlorine gas ............................................................................... 44
2.2.4 Seed sterilization with sodium hypochlorite ................................................................. 44
Contents 4
2.3 Cultivation of microorganisms .............................................................................................. 44
2.3.1 Growth media and bacteria cultivation......................................................................... 44
2.3.2 Preparation of E. coli stocks .......................................................................................... 45
2.4 DNA-related methods ........................................................................................................... 45
2.4.1 Oligonucleotides ............................................................................................................ 45
2.4.2 Vectors and cloning strategy ......................................................................................... 45
2.4.3 Isolation of plasmid DNA from E. coli cells by alkaline lysis (Miniprep) ........................ 45
2.4.4 Isolation of plasmid DNA from E. coli cells by alkaline lysis (Midiprep) ........................ 46
2.4.5 Fast plasmid preparation using the QIAprep Spin Miniprep kit .................................... 47
2.4.6 DNA extraction from plant cells in a 96-well format ..................................................... 47
2.4.7 Polymerase chain reaction (PCR) .................................................................................. 47
2.4.8 Colony PCR..................................................................................................................... 48
2.4.9 Fusion of DNA fragments by PCR .................................................................................. 48
2.4.10 Genotyping of Arabidopsis by PCR ................................................................................ 49
2.4.11 Genotyping of Arabidopsis by KASP .............................................................................. 49
2.4.12 Quantitative real-time PCR (qPCR) ................................................................................ 49
2.4.13 Agarose gel electrophoresis .......................................................................................... 51
2.4.14 Purification of DNA fragments ...................................................................................... 51
2.4.15 Gel purification of DNA fragments ................................................................................ 51
2.4.16 Determination of nucleic acid concentrations .............................................................. 51
2.4.17 Restriction digest of plasmid DNA ................................................................................. 52
2.4.18 Restriction digest to identify Arabidopsis by CAPS analysis .......................................... 52
2.4.19 Dephosphorylation of linear plasmid DNA .................................................................... 52
2.4.20 Ligation of DNA fragments ............................................................................................ 52
2.4.21 Sequencing .................................................................................................................... 53
2.5 RNA-related techniques ........................................................................................................ 53
2.5.1 RNA extraction from Arabidopsis by phenol extraction (Mini hot phenol protocol) .... 53
2.5.2 RNA extraction by TRIsure (Quick RNA isolation protocol) ........................................... 54
2.5.3 RNA purification by phenol:chloroform extraction ....................................................... 54
2.5.4 DNase digest of RNA samples........................................................................................ 55
2.5.5 cDNA synthesis by reverse transcription PCR (RT-PCR) ................................................ 55
2.5.6 Poly(A) tail test (PAT) ..................................................................................................... 55
2.5.7 In-vitro transcription ..................................................................................................... 56
2.5.8 Poly(A) tail length-dependent RNA fractionation ......................................................... 56
2.6 Protein techniques ................................................................................................................ 57
2.6.1 Protein extraction from Arabidopsis ............................................................................. 57
2.6.2 SDS polyacrylamide gel electrophoresis (SDS-PAGE) .................................................... 58
2.6.3 Coomassie staining of protein gels ................................................................................ 58

Contents 5
2.6.4 Western blot .................................................................................................................. 59
2.7 Transformation techniques ................................................................................................... 60
2.7.1 Preparation of electro-competent bacteria .................................................................. 60
2.7.2 Transformation of electro-competent E. coli or Agrobacterium cells .......................... 60
2.7.3 Transformation of Arabidopsis by floral dip .................................................................. 61
2.8 Physiological methods ........................................................................................................... 61
2.8.1 Crossing of Arabidopsis ................................................................................................. 61
2.8.2 Flowering time analysis ................................................................................................. 62
2.8.3 Salicylic acid treatment of plants .................................................................................. 62
2.8.4 Leaf initiation rate determination ................................................................................. 62
2.8.5 Vernalization.................................................................................................................. 62
2.8.6 Biotic stress treatment .................................................................................................. 63
2.8.7 Oxygen depletion stress by submergence .................................................................... 63
2.8.8 Long-term oxygen depletion stress by hypoxia............................................................. 63
2.8.9 Oxygen depletion stress by anoxia ................................................................................ 64
2.8.10 Drought stress induction ............................................................................................... 64
2.8.11 Induction of osmotic stress by mannitol ....................................................................... 64
2.8.12 Application of cold stress .............................................................................................. 65
2.8.13 Induction of oxidative stress ......................................................................................... 65
2.9 Plant photography ................................................................................................................. 65
2.10 Microscopy ............................................................................................................................ 66
2.11 Statistical means .................................................................................................................... 66
2.12 Transcriptome analysis .......................................................................................................... 66
2.12.1 Sequencing .................................................................................................................... 66
2.12.2 Data preprocessing ........................................................................................................ 67
2.12.3 Gene expression investigation ...................................................................................... 67
2.13 Software and online tools used for the data analysis ........................................................... 67
3. Results ........................................................................................................................................... 69
3.1 Poly(A) polymerases ensure the timely flowering of Arabidopsis ........................................ 69
3.1.1 Poly(A) polymerase mutants exhibit contrasting flowering time phenotypes ............. 69
3.1.2 Salicylic acid treatment does not change the paps mutant flowering time phenotype 76
3.1.3 The paps mutant phenotype is based on a deregulation of FLC ................................... 77
3.1.4 PAPS1 and PAPS2/PAPS4 act independently from CstF64 and FY ................................ 83
3.1.5 FCA is epistatic to PAPS2/4, but not to PAPS1 .............................................................. 85
3.1.6 The vernalization pathway is functional in paps mutants ............................................. 87
3.1.7 FLC and COOLAIR poly(A) tail lengths are not altered in paps2 paps4 ......................... 93
3.2 Poly(A) polymerases mediate the response to distinct stress conditions in Arabidopsis ..... 95
3.2.1 An AtPAPS expression analysis indicates functions in specific stress response pathways 95
Contents 6
3.2.2 Search for stress-induced phenotypes of paps mutants ............................................... 96
3.2.3 PAPS1 regulates the response to cold stress .............................................................. 101
3.2.4 PAPS1 and PAPS2/4 regulate the response to oxidative stress in different pathways 102
3.2.5 paps1 and paps2/4 react differentially to the loss of a poly(A) ribonuclease ............ 104
3.3 Molecular characterisation of PAPS1 and PAPS2/PAPS4 .................................................... 105
3.3.1 Establishing PAPS1- and PAPS4-specific antibodies .................................................... 105
3.3.2 Localization and Expression of the PAPS1 and PAPS4 proteins .................................. 108
3.4 The search for PAPS2/PAPS4-specific target genes ............................................................ 110
3.4.1 A PCR-based PAT test did not reveal specific target genes ......................................... 110
3.4.2 Fractionation of mRNAs into pools according to their poly(A) tail length .................. 112
3.4.3 A transcriptome analysis underlines an involvement of PAPS2/PAPS4 in stress responses ..................................................................................................................................... 113
4. Discussion .................................................................................................................................... 116
4.1 PAPS1 and PAPS2/4 regulate similar developmental processes in different pathways ..... 116
4.2 An optimized PAT test is required to reveal mRNA specificity of cPAPs ............................. 119
4.3 PAPS1 represses flowering by promoting FLC expression .................................................. 120
4.4 PAPS2 and PAPS4 ensure timely flowering in a common pathway with FCA ..................... 121
4.5 Putative PAPS2/PAPS4 targets that inhibit FLC and MAF expression ................................. 123
4.6 PAPS1 and PAPS2/4 are involved in the regulation of different stress response pathways126
4.7 PAPS1 and PAPS2/4 regulate the response to oxidative stress in different pathways ....... 128
5. Conclusion ................................................................................................................................... 131
Appendix A Technical equipment ................................................................................................... 132
Appendix B Disposable equipment ................................................................................................. 133
Appendix C Oligonucleotide list ...................................................................................................... 134
Appendix D Oligonucleotide combinations .................................................................................... 136
Appendix E Cloning strategy and vector list ................................................................................... 137
References ........................................................................................................................................... 140
Affidavit ............................................................................................................................................... 156
Acknowledgements ............................................................................................................................. 157

Abbreviations 7
Abbreviations
35S promoter of the 35S gene from cauliflower mosaic virus
A’s adenosine monophosphates
Agrobacterium Agrobacterium tumefaciens
ahg2 ABA-hypersensitive germination 2
APA alternative polyadenylation
APS ammonium persulfate
AS antisense
AT 3-amino-1, 2, 4-triazole
At Arabidopsis thaliana
Arabidopsis Arabidopsis thaliana
bp base pairs
BH Benjamini-Hochberg
BSO buthionine-S, R-sulfoximide
CAPS cleaved amplified polymorphic sequences
CTD carboxy-terminal domain
cDNA complementary DNA
CF Cleavage Factor
Co-IP co-immunoprecipitation
Col-0 Columbia-0
cPAP canonical poly(A) polymerase
CPSF Cleavage and Polyadenylation Specificity Factor
CstF Cleavage-stimulating Factor
Ct cycle threshold
Δ delta; difference in
ΔTLN total leaf number difference
D day
DAG days after germination
ddH2O double distilled water; in this work: ultrapure, autoclaved water
DMSO dimethylsulfoxide
DNA deoxyribonucleic acid
DNase deoxyribonuclease
dNTPs deoxynucleoside triphosphates
DTT dithiothreitol
DW dry weight
E. coli Escherichia coli
EDTA ethylendiaminetetraacetic acetate
EMS ethyl-methanesulfonate
esp enhanced silencing phenotype
Fig. figure
Fip1 Factor interacting with Pap1p
FLC FLOWERING LOCUS C
FLD FLOWERING LOCUS D
FLK FLOWERING LOCUS K
FLM FLOWERING LOCUS M
FPI floral pathway integrators
FRI FRIGIDA
FT FLOWERING LOCUS T

Abbreviations 8
FTA flowering time analysis
FW fresh weight
GA gibberellic acid
GUS ß-glucuronidase
GSH glutathione
H2O2 hydrogen peroxide
HCl hydrochloric acid
His histidine
KASP KBiosciences Competitive Allele-Specific PCR
kb kilo base pairs
LC480 Light Cycler 480 I (Roche)
LD long day
LED light-emitting diode
Ler Landsberg erecta
LFY LEAFY
M molar; mol/l
MAF MADS AFFECTING FLOWERING
mRNA messenger RNA
MS Murashige and Skoog basal salt mixture
MV methyl viologen
N night
NTD amino-terminal domain
NaCl sodium chloride
NADP(H) nicotinamide adenine dinucleotide phosphate (reduced form)
NaOH sodium hydroxide
NASC Nottingham Arabidopsis stock centre
NCBI National Center for Biotechnology Information
ncPAP noncanonical poly(A) polymerase
NLS nuclear localisation sequence
NO nitric oxide
nt nucleotide(s)
NTC non-treated control
OE overexpression
O/N overnight
oxt6 oxidative stress resistant 6
PAGE polyacrylamide gel electrophoresis
PAP poly(A) polymerase
PAPS Arabidopsis poly(A) polymerase
PAPS2/4 PAPS2/PAPS4
PAR photosynthetically active radiation
PAS poly(A) site
PAT poly(A) tail
PCR polymerase chain reaction
PolII RNA Polymerase II
PPT phosphinotricin (Basta)
PRC Polycomb repressive complex
pre-mRNA precursor messenger ribonucleic acid
qPCR quantitative real-time PCR
REF6 RELATIVE OF EARLY FLOWERING 6

Abbreviations 9
RIP RNA immunoprecipitation
RNA ribonucleic acid
RNase RNA nuclease
RNA-seq RNA sequencing
ROS reactive oxygen species
RT room temperature (20–23 °C)
RT-PCR reverse transcriptase PCR
SA salicylic acid
SD short day
SDS sodium dodecyl sulfate
SEM standard error of the mean
seq sequencing
Sf-2 San Feliu-2
SOC Super optimal broth with catabolite repression
SOC1 SUPPRESSOR OF OVEREXPRESSION OF CONSTANS1
SOD superoxide dismutase
sof suppressor of overexpressed FCA
SPL SQUAMOSA PROMOTER BINDING PROTEIN-LIKE
SSC standard saline citrate
SVP SHORT VEGETATIVE PHASE
TAIR The Arabidopsis Information Resource
TAE Tris-acetate EDTA
T-DNA transfer-DNA
Taq Thermus aquaticus
TE Tris EDTA
TEMED tetramethylethylenediamine
TLN total leaf number
Tm melting temperature
UTR untranslated region
var variant
v/v volume per volume
v/w weight per volume
vol volume
vYFP venus yellow fluorescent protein
WT wild type
YFP yellow fluorescent protein

List of Figures and Tables 10
List of Figures
Fig. 1 The mammalian 3’ end processing machinery (from Jurado et al. 2014). .................................. 15
Fig. 2 Comparison of 3’ end processing complexes (from Millevoi and Vagner 2010, modified). ........ 16
Fig. 3 Structure and alignment of mammalian cPAPs (from Yang et al. 2014). .................................... 20
Fig. 4 Alignment of cPAPs from plants and animals (from Meeks et al. 2009, modified). .................... 21
Fig. 5 Protein structure and expression pattern of Arabidopsis poly(A) polymerases.......................... 22
Fig. 6 The different pathways regulating flowering time in Arabidopsis (from Quesada et al. 2005). . 26
Fig. 7 Four FCA splice forms are expressed in Arabidopsis (from Macknight et al. 1997). ................... 28
Fig. 8 The negative autoregulation of FCA controls flowering time (from Quesada et al. 2005). ........ 28
Fig. 9 Sense and antisense transcription at the FLC locus (from Rataj and Simpson 2014). ................. 30
Fig. 10 Model for the repression of FLC by the autonomous pathway factor FCA. .............................. 32
Fig. 11 Stress-induced signal transduction cascades in plants. ............................................................. 34
Fig. 12 RNA-processing and post-translational modification involved in plant stress responses. ........ 35
Fig. 13 Alternative polyadenylation at the CPSF30 (At1g30460) locus (from Zhang et al. 2008). ........ 38
Fig. 14 T-DNA insertion sites in the PAPS2 and PAPS4 genes. .............................................................. 69
Fig. 15 Phenotype of paps mutants in Col-0 background. .................................................................... 70
Fig. 16 Flowering time of paps2 and paps4 mutant lines under LD conditions. ................................... 71
Fig. 17 Comparative flowering time analysis of paps single and double mutants. ............................... 72
Fig. 18 Leaf initiation rate of paps mutants. ......................................................................................... 73
Fig. 19 Flowering time of paps mutants under SD conditions. ............................................................. 73
Fig. 20 The double mutant paps1-1 paps4-3 exhibits growth defects. ................................................. 75
Fig. 21 The flowering time of paps1-1 paps4-3 mutants varies between different lines. .................... 75
Fig. 22 Flowering time of paps2-3 paps4-3 and wild type plants sprayed with 0.5 mM or 1 mM SA. . 76
Fig. 23 A trend towards decreased FLC mRNA abundance can be observed in paps1-1. ..................... 78
Fig. 24 Expression levels of FLC and of floral pathway integrators in paps2 paps4. ............................. 78
Fig. 25 Expression levels of SVP, FLM and MAF2 in paps2 paps4. ........................................................ 79
Fig. 26 The late flowering phenotype of paps2-3 paps4-3 is rescued by the flc-5 (Ler) mutation. ...... 81
Fig. 27 Flowering time of paps mutants in an flc-2 (Col-0) background. .............................................. 82
Fig. 28 Regarding flowering time, PAPS2/PAPS4 and CstF64 act in independent pathways. ............... 83
Fig. 29 Regarding flowering time, FY acts independently from PAPS1 and PAPS2/PAPS4. .................. 84
Fig. 30 FCA is epistatic to PAPS2/PAPS4, but not to PAPS1................................................................... 85
Fig. 31 Overexpression of FCA splice form γ in paps mutants. ............................................................. 86
Fig. 32 The vernalization pathway is functional in paps2-3 paps4-3. ................................................... 89
Fig. 33 Regarding the FLC mRNA abundance, paps2 paps4 mutants respond to vernalization. .......... 89
Fig. 34 Transcript abundances of the FLC antisense classes I and II behave oppositely during
vernalization. ......................................................................................................................................... 91
Fig. 35 Upon vernalization, a second splice form of FLC antisense class II appears. ............................ 92
Fig. 36 FLC mRNAs have long poly(A) tails in both wild type and paps2 paps4. ................................... 94
List of Figures and Tables 11
Fig. 37 Poly(A) tail lengths of FLC antisense mRNAs do not differ between wild type and paps2 paps4.
............................................................................................................................................................... 94
Fig. 38 PAPS2 expression is upregulated mainly under biotic stress conditions. ................................. 95
Fig. 39 PAPS4 expression is upregulated under abiotic stress conditions, specifically under hypoxia. 96
Fig. 40 Short-term oxygen depletion does not lead to a differential stress response in paps mutants.
............................................................................................................................................................... 97
Fig. 41 Hypoxia-treated paps mutants and Col-0 exhibit similar weight changes. ............................... 99
Fig. 42 The paps mutant phenotype under drought and osmotic stress. ........................................... 101
Fig. 43 paps1-1 but not paps2-3 paps4-3 shows an impaired response to cold. ................................ 102
Fig. 44 PAPS1 and PAPS2/PAPS4 regulate the response to oxidative stress in different pathways. .. 103
Fig. 45 Phenotype of paps2 paps4 ahg2-1 triple mutants. ................................................................. 105
Fig. 46 Protein coding gene models for PAPS1 (a) and PAPS4 (b). ...................................................... 106
Fig. 47 The PAPS4 splice form 5 is translated, while splice form 8 is non-coding. .............................. 108
Fig. 48 PAPS1 and PAPS4 are localized in the nucleus. ....................................................................... 109
Fig. 49 PAPS1 and PAPS4 proteins are localized in nuclei and show enrichment in certain tissues. .. 110
Fig. 50 Poly(A) tail test with putatively PAPS2/4-specific candidate genes. ....................................... 111
Fig. 51 Control RNAs with longer poly(A) tails are enriched in the long fraction. .............................. 112
Fig. 52 SVP and FLM do not exhibit altered poly(A) tail lengths in paps2 paps4. ............................... 113
Fig. 53 Differentially expressed genes in paps2-3 paps4-3 and paps1-1 do not overlap.................... 115
Fig. 54 PAPS1 and PAPS2/PAPS4 ensure timely flowering in Arabidopsis. ......................................... 123
List of Tables
Table 1 Comparison of core polyadenylation factors from mammals, yeast and plants. .................... 17
Table 2 Arabidopsis mutants used in this thesis. .................................................................................. 42
Table 3 Stock solutions of antibiotics and herbicides. .......................................................................... 43
Table 4 qPCR program. .......................................................................................................................... 50
Table 5 Relative expression values of the FLM splice variants and δ. ............................................... 80
Table 6 Phenotype of paps mutants under hypoxia conditions. ........................................................ 100
Table 7 The ten most significantly deregulated gene categories in paps2-3 paps4-3 compared to Col-0
as determined by MapMan. ................................................................................................................ 114
Table 8 Opposite overlap of significantly deregulated genes in paps2-3 paps4-3 relative to Col-0 with
published microarray experiments as determined by MASTA. .......................................................... 115
Table 9 Oligonucleotide combinations used for cloning. .................................................................... 138
Table 10 Vector list. ............................................................................................................................. 139

Summary 12
Summary
Polyadenylation is a decisive 3’ end processing step during the maturation of pre-mRNAs. The length
of the poly(A) tail has an impact on mRNA stability, localization and translatability. Accordingly, many
eukaryotic organisms encode several copies of canonical poly(A) polymerases (cPAPs). The disruption
of cPAPs in mammals results in lethality. In plants, reduced cPAP activity is non-lethal. Arabidopsis
encodes three nuclear cPAPs, PAPS1, PAPS2 and PAPS4, which are constitutively expressed
throughout the plant. Recently, the detailed analysis of Arabidopsis paps1 mutants revealed a subset
of genes that is preferentially polyadenylated by the cPAP isoform PAPS1 (Vi et al. 2013). Thus, the
specialization of cPAPs might allow the regulation of different sets of genes in order to optimally face
developmental or environmental challenges.
To gain insights into the cPAP-based gene regulation in plants, the phenotypes of Arabidopsis cPAPs
mutants under different conditions are characterized in detail in the following work. An involvement
of all three cPAPs in flowering time regulation and stress response regulation is shown. While paps1
knockdown mutants flower early, paps4 and paps2 paps4 knockout mutants exhibit a moderate late-
flowering phenotype. PAPS1 promotes the expression of the major flowering inhibitor FLC,
supposedly by specific polyadenylation of an FLC activator. PAPS2 and PAPS4 exhibit partially
overlapping functions and ensure timely flowering by repressing FLC and at least one other
unidentified flowering inhibitor. The latter two cPAPs act in a novel regulatory pathway downstream
of the autonomous pathway component FCA and act independently from the polyadenylation factors
and flowering time regulators CstF64 and FY. Moreover, PAPS1 and PAPS2/PAPS4 are implicated in
different stress response pathways in Arabidopsis. Reduced activity of the poly(A) polymerase PAPS1
results in enhanced resistance to osmotic and oxidative stress. Simultaneously, paps1 mutants are
cold-sensitive. In contrast, PAPS2/PAPS4 are not involved in the regulation of osmotic or cold stress,
but paps2 paps4 loss-of-function mutants exhibit enhanced sensitivity to oxidative stress provoked in
the chloroplast. Thus, both PAPS1 and PAPS2/PAPS4 are required to maintain a balanced redox state
in plants. PAPS1 seems to fulfil this function in concert with CPSF30, a polyadenylation factor that
regulates alternative polyadenylation and tolerance to oxidative stress.
The individual paps mutant phenotypes and the cPAP-specific genetic interactions support the model
of cPAP-dependent polyadenylation of selected mRNAs. The high similarity of the polyadenylation
machineries in yeast, mammals and plants suggests that similar regulatory mechanisms might be
present in other organism groups. The cPAP-dependent developmental and physiological pathways
identified in this work allow the design of targeted experiments to better understand the ecological
and molecular context underlying cPAP-specialization.

Zusammenfassung 13
Zusammenfassung
Polyadenylierung ist ein entscheidender Schritt der 3‘-End-Prozessierung und somit der Reifung von
prä-mRNAs. Die Länge des Poly(A)-Schwanzes entscheidet unter anderem über die Stabilität und
Lokalisierung von mRNAs. Viele Eukaryoten besitzen mehrere Kopien der kanonischen Poly(A)-
Polymerasen (PAP). In Säugetieren ist das Ausknocken dieser Enzyme letal. Pflanzen mit reduzierter
PAP-Aktivität sind hingegen überlebensfähig. Arabidopsis exprimiert drei im Zellkern lokalisierte PAPs
namens PAPS1, PAPS2 und PAPS4. Kürzlich ergab die Analyse von Arabidopsis paps1-Mutanten, dass
eine Gen-Untergruppe vorzugsweise von PAPS1 polyadenyliert wird (Vi et al. 2013). Die
Spezialisierung der PAPs könnte der Regulierung verschiedener Gengruppen in Anpassung an die
Pflanzenentwicklung und an bestimmte Umweltbedingungen dienen.
In der vorliegenden Arbeit werden die Phänotypen von Arabidopsis PAP-Mutanten unter
verschiedenen Bedingungen im Detail charakterisiert, um die PAP-basierte Genregulation besser zu
verstehen. Es wird gezeigt, dass alle drei PAPs an der Regulation der Blühzeit und an der Regulation
von Stressantworten beteiligt sind. Während paps1-Mutanten früh blühen, zeigen paps4- und paps2
paps4-Mutanten einen spät blühenden Phänotypen. PAPS1 fördert die Expression des
Blühzeitinhibitors FLC vermutlich über die Polyadenylierung eines FLC-Aktivators. PAPS2 und PAPS4
haben teilweise überlappende Funktionen und unterdrücken die Expression von FLC und mindestens
einem weiteren, bisher unbekannten Blühzeitinhibitor. Die beiden PAPs agieren in einem neu
entdeckten, genetischen Pfad gemeinsam mit dem Blühzeitregulator FCA, jedoch unabhängig von
den Polyadenylierungsfaktoren und Blühzeitregulatoren CstF64 und FY. Des Weiteren regulieren
PAPS1 und PAPS2/PAPS4 verschiedene Stressantworten. Das Reduzieren der PAPS1-Aktivität führt
zu verstärkter Resistenz gegen osmotischen und oxidativen Stress, bei gleichzeitig erhöhter
Kältesensitivität der Pflanzen. PAPS2/PAPS4 sind im Gegensatz dazu nicht an der Regulation von
Kälte- oder osmotischem Stress beteiligt. Die paps2 paps4-Mutanten besitzen jedoch reduzierte
Toleranz gegen oxidativen Stress in Chloroplasten. Das heißt, sowohl PAPS1 als auch PAPS2/PAPS4
sind nötig, um einen ausgeglichenen Redoxstatus der Pflanzenzellen zu gewährleisten. PAPS1
arbeitet bei dieser Regulation scheinbar mit dem Polyadenylierungsfaktor CPSF30 zusammen.
Die individuellen Phänotypen der paps-Mutanten und die spezifischen genetischen Interaktionen der
Poly(A)-Polymerasen in Arabidopsis unterstützen das Modell der PAP-abhängigen Polyadenylierung
von selektierten mRNAs. Da die Polyadenylierungskomplexe in Hefen, Säugetieren und Pflanzen
starke Ähnlichkeiten aufweisen, ist es denkbar, dass dieser Regulierungsmechanismus auch in
anderen Organismengruppen präsent ist. Basierend auf den Ergebnissen dieser Arbeit können gezielt
weitere Experimente entwickelt werden, um die ökologischen und molekularen Grundlagen der PAP-
Spezialisierung zu untersuchen.

Introduction 14
1. Introduction
1.1 Poly(A) polymerases: functions and implications in gene expression regulation
1.1.1 The 3’ end processing complex regulates transcriptional termination
One of the most basic and essential processes to form living cells is gene expression, the process of
transcribing and translating information encoded by DNA into RNAs and proteins. Genes encoding
proteins are first transcribed into messenger RNAs (mRNAs) by RNA polymerase II (Pol II). To
generate mature templates for the subsequent translation by ribosomes, eukaryotic precursor
mRNAs (pre-mRNAs) undergo several processing steps, including 5’ capping, splicing, editing and
polyadenylation. These modifications occur simultaneously with transcription (Proudfoot 2004;
Bentley 2014). Polyadenylation is catalysed by a poly(A) polymerase (PAP in yeast/mammals; PAPS in
plants) which is embedded in a large protein complex that detects poly(A) sites and cleaves the RNA
substrate. Since mRNA 3’ end processing is critical for the final structure and the exonic content of
the mature mRNA, it is elaborately regulated. The processing machinery decides between alternative
polyadenylation (APA) sites which can be found in up to 79% of mammalian genes and in up to 82%
of plant genes (Shen et al. 2011; Hunt 2011; Tian and Manley 2013). Around 60% of the Arabidopsis
thaliana (from here on Arabidopsis) mRNAs were found to be alternatively polyadenylated (Shen et
al. 2011). In addition, splicing and polyadenylation have to be coordinated, since polyadenylation
sites might be located in alternatively spliced regions of the mRNA (Xing and Li 2011).
Polyadenylation sites are defined by regulatory cis-elements in the mRNA. These elements have been
discovered by mutation and sequencing analysis. In contrast to the highly conserved polyadenylation
signals known from animals, such as the AAUAAA element or the downstream element, plants
exhibit several sequence stretches enriched in certain nucleotides upstream of the cleavage site
known as far upstream element and near upstream element (Hunt 1994; Rothnie 1996; Fig. 2). Both
the base composition and the relative distances between the elements seem to be important for
correct 3’ end processing in plants (Rothnie et al. 1994; Loke et al. 2005). The so-called cleavage
element harbours the actual cleavage and polyadenylation site (PAS) which is defined by a conserved
YA dinucleotide surrounded by a U-rich region (Loke et al. 2005). Notably, secondary structure
formation of the 3’ untranslated region (UTR) of mRNAs has been suggested to be required for PAS
recognition by protein complexes (Loke et al. 2005; Ding et al. 2014b). Functional aspects of mRNA
secondary structures have been reviewed recently (Silverman et al. 2013).
The respective trans-acting factors have been studied largely in yeast and mammals. Tremendous
progress in understanding the composition and function of the eukaryotic 3’ end processing
machinery was made during the 1990s (Wahle and Rüegsegger 1999). In animals three major protein
complexes act together and constitute the large processing machinery in which the poly(A)

Introduction 15
polymerase (PAP) is embedded: the Cleavage Factor (CF), the Cleavage-stimulating Factor (CstF) and
the Cleavage and Polyadenylation Specificity Factor (CPSF) (Fig. 1). In yeast, most of these factors
have conserved counterparts, albeit certain factor subunits may take over different functions
(reviewed by Mandel et al. 2008; Millevoi and Vagner 2010; Proudfoot 2011).
Fig. 1 The mammalian 3’ end processing machinery (from Jurado et al. 2014). Several conserved protein complexes consisting of various subunits constitute the polyadenylation and cleavage machinery. The CPSF complex binds the AAUAAA signal surrounding the polyadenylation site (PAS). The CPSF73 subunit performs the cleavage at the CA dinucleotide (red arrowhead). The CstF complex binds the downstream element (DSE), but also the C-terminal domain of RNA polymerase II (Pol II), which is illustrated by yellow circles. The CFI complex binds auxiliary RNA signals.
The CstF complex consists of three subunits, named 50, 64 and 77, after their molecular mass in kilo
Dalton (kDa). CstF binds the downstream polyadenylation element and is involved in both cleavage
and polyadenylation (Takagaki and Manley 1997; Millevoi and Vagner 2010). It recognizes RNA
elements via its 64 kDa subunit and binds the CPSF complex with its 77 kDa subunit, which helps
defining the PAS (Mandel et al. 2008). In mammals, loss of CstF64 function leads to diverse APA
events and cellular deregulations (Millevoi and Vagner 2010).
The Cleavage Factor subunits CFI and CFII aid in positioning the complex (Mandel et al. 2008).
Specifically CFI, a factor unique to mammals, exhibits high positional specificity relative to the PAS
and thus determines proper PAS selection and correct 3’ UTR length (Gruber et al. 2012; Martinson
2011).
A crucial role for cleavage and polyadenylation is fulfilled by the CPSF complex which is composed of
five subunits: CPSF30, CPSF73, CPSF100, CPSF160 and Fip1. The CPSF subunits may be referred to as
CPSF1 to CPSF4 in the literature. In this work, subunits will be named after their weight in kDa. In
Introduction 16
mammals, CPSF160, the largest subunit, strongly binds the AAUAAA signal, associates with CstF77
and recruits the PAP to the mRNA (Murthy and Manley 1995; Zhao et al. 1999). In yeast, Fip1 (Factor
interacting with Pap1p) binds PAP and other polyadenylation factors and seems to serve as a
molecular bridge (Preker et al. 1995; Meinke et al. 2008). The actual cleavage, i.e. the hydrolysis of a
phosphodiester bond in the pre-mRNA, is most likely performed by the CPSF73 subunit, which
possesses metal-dependent endonuclease activity (Ryan et al. 2004; Fig. 1, Fig. 2).
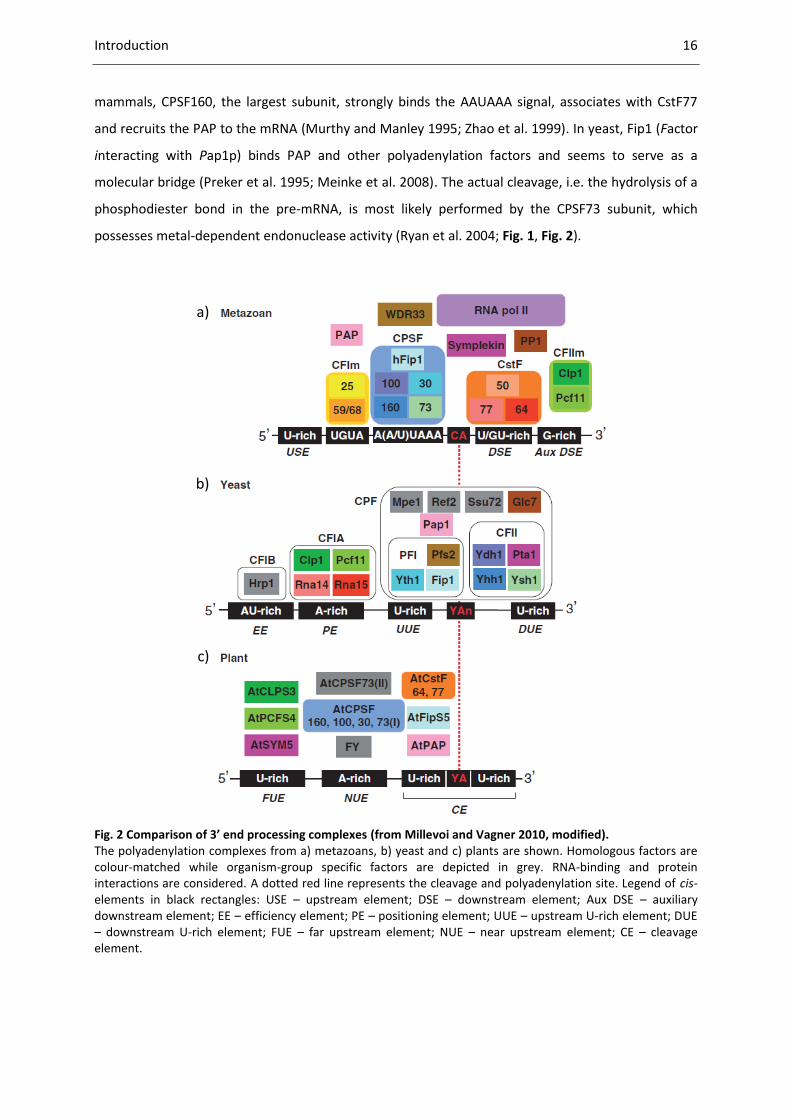
Fig. 2 Comparison of 3’ end processing complexes (from Millevoi and Vagner 2010, modified). The polyadenylation complexes from a) metazoans, b) yeast and c) plants are shown. Homologous factors are colour-matched while organism-group specific factors are depicted in grey. RNA-binding and protein interactions are considered. A dotted red line represents the cleavage and polyadenylation site. Legend of cis-elements in black rectangles: USE – upstream element; DSE – downstream element; Aux DSE – auxiliary downstream element; EE – efficiency element; PE – positioning element; UUE – upstream U-rich element; DUE – downstream U-rich element; FUE – far upstream element; NUE – near upstream element; CE – cleavage element.
a)
b)
c)

Introduction 17
Table 1 Comparison of core polyadenylation factors from mammals, yeast and plants. The table is based on Hunt 2008; Mandel et al. 2008 and Millevoi and Vagner 2010. Listed are gene names in humans and yeast and the respective protein functions in the 3’ end processing complex. Arabidopsis counterparts are designated. Amino acid sequences of the Arabidopsis factors were compared to the human proteins with regard to length (amino acid number) and identity (extent to which two sequences have the same residues at the same positions in an alignment, expressed in percentage). References to protein or mutant studies in Arabidopsis are listed.
Subunit
terminology
(mammal/ yeast)
Protein function
(mammal and/
or yeast)
Arabidopsis
counterpart
Arabidopsis
gene
%
identity
%
length
References to
Arabidopsis
studies
PAP/ PAP1p polyadenylates
mRNAs
PAPS1
PAPS2
PAPS3
PAPS4
At1g17980
At2g25850
At3g06560
At4g32850
44
44
33
45
96
106
68
100
Addepalli et al.
2004; Meeks et
al. 2009; Vi et
al. 2013; Trost
et al. 2014
CPSF160/ Yhh1 binds AAUAAA CPSF160 At5g51660 50 100 Xu et al. 2006
CPSF100/ Ydh1 unknown CPSF100/
ESP5
At5g23880 37 94 Elliott et al.
2003; Tzafrir et
al. 2004; Herr et
al. 2006
CPSF73/ Ysh1 endonuclease CPSF73-I
CPSF73-II
At1g61010
At2g01730
54
36
101
90
Xu et al. 2004,
2006
CPSF30/ Yth1 RNA-binding,
endonuclease
CPSF30/
OXT6
At1g30460 35 213 Reviewed by
Hunt 2014
CstF77/ Rna14 RNA-binding,
itself alternatively
processed
CstF77 At1g17760 37 102 Yao et al. 2002;
Bell and Hunt
2010; Liu et al.
2010
CstF64/ Rna15 RNA-binding,
controls APA
CstF64 At1g71800 47 80 Yao et al. 2002;
Liu et al. 2010
CstF50/ - binds PolII and
splicing factors
CstF50 At5g60940 57 100 Yao et al. 2002
CFIm25/ - cleavage factor,
RNA-binding
CFIm-25 At4g29820
At4g25550
40
59
97
88
-
CFIm68/59/ - cleavage factor - - - - -
Clp1/ Clp RNA kinase CLPS3
CLPS5
At3g04680
At5g39930
42
26
104
100
Xing et al.
2008a
PCF11/ Pcf11 interacts with
CstF
PCFS1
PCFS4
PCFS5
At1g66500
At4g04885
At5g43620
28
36
29
26
52
26
Xing et al.
2008b, 2013
FIP1L1/ Fip1 interacts with
PAP, regulates
CPSF30 activity
Fip1 [V]/
FIPS5
FIPS3
At5g58040
At3g66652
44 213 Forbes et al.
2006; Hunt et
al. 2008
WDR33/ Pfs2 connects 3’ end
complex factors
FY
At5g13480 48 198 Simpson et al.
2003
Symplekin/ Pta1 part of CPSF SYM1
SYM2
SYM5/ESP4
At1g27590
At1g27595
At5g01400
25
29
31
20
75
115
Herr et al. 2006
PAPB/ Pab1p poly(A) extension,
length control
PABN1
At5g51120
64 42 -
Introduction 18
Plants exhibit orthologues to all 3’ end processing factors described above and several factors are
encoded by more than one gene (Table 1; Fig. 2; Hunt 2008; Hunt et al. 2012). Most of these factors
are essential. However, weak and hypomorphic alleles of several complex components have been
identified in Arabidopsis. Interestingly, these mutants display quite specific and sometimes common
phenotypes.
In a screen for mutants showing enhanced silencing of a reporter gene, several polyadenylation
factor mutants were discovered as so called enhanced silencing phenotype (esp) mutants (Herr et al.
2006). The esp1 mutant exhibits a mutation in a protein related to CstF64 that is lacking an RNA
recognition motif. Esp5 mutants are defective in AtCPSF100 function and additionally exhibit an early
flowering phenotype. AtCPSF100 interacts with AtPAPS and is essential for embryonic development
(Elliott et al. 2003; Tzafrir et al. 2004). It was moreover found to physically interact with FY, another
highly conserved polyadenylation factor (Herr et al. 2006). Hypomorphic fy, cstf64 and cstf77
mutants exhibit a late flowering phenotype (Henderson et al. 2005; Liu et al. 2010). Knockout
mutations of FY are lethal and stronger cstf64 and cstf77 mutant alleles exhibit sterility or female
gametophytic lethality, respectively, underlining the significance of proper PAS choice for plant
development (see chapter 1.2.2). CPSF30, another core polyadenylation factor, was identified in a
completely different approach that sought to unravel elements regulating the response to oxidative
stress in Arabidopsis (Zhang et al. 2008; see chapter 1.3.3).
1.1.2 The regulation of alternative polyadenylation
Several findings demonstrate the tight coupling of transcription and 3’ end processing. With its large
carboxy-terminal domain (CTD), RNA PolII binds CstF77 and CstF50, which in turn have been shown
to interact with a splicing factor (Fig. 2; McCracken et al. 1997, 2003). A functional PAS is required to
terminate transcription, and PolII is involved in the cleavage reaction (Proudfoot 1989; Ryan et al.
2002).In yeast, PAP and CF1 have been found to interact with transcription factor IIB (TFIIB). This
interaction supports gene looping and transcription re-initiation (Medler et al. 2011; Al Husini et al.
2013).
A tremendous amount of genes in diverse organisms was found to contain more than one PAS,
raising the question how the processing machinery decides on one specific PAS. In recent years,
several mechanisms contributing to PAS selection have been unravelled (reviewed by Tian and
Manley 2013). PASs can possess different strengths depending on their signal composition, and
polyadenylation core complex factors exhibit preferences for proximal (i.e. upstream) or distal PASs
(Takagaki et al. 1996). Thus, abundance changes of certain factors can have wide effects on PAS
choice and mRNA fate. Additional miRNA-target sites or RNA-binding protein target sites influence
mRNA stability. Accessory factors like RNA-binding proteins can block cis-elements in a tissue-specific
Introduction 19
manner (Wang et al. 2008a). In addition, also chromatin accessibility influences PAS selection,
although it is a matter of debate whether APA is a cause or effect of variations in nucleosome density
(Tian and Manley 2013; Huang et al. 2013). Polyadenylation and splicing are particularly coupled in a
competing relationship when PASs are located in introns (Martinson 2011). In Drosophila
melanogaster (fruit fly) it was discovered that 17% of all genes are arranged in nested patterns and
that intronic poly(A) signals are mostly silenced (Tikhonov et al. 2013). The splicing factor U1 has
been shown to simultaneously bind RNA 3’ ends and PAP, thereby inhibiting the polyadenylation of
mRNAs, including its own pre-mRNA (Gunderson et al. 1994, 1998).
Recently, a unified polyadenylation code has been suggested (Davis and Shi 2014). The model
integrates PAS positions, strength of cis-elements, concentrations of trans-factors as well as
transcription elongation rates and aims to enable predictions of preferential PASs.
Since deregulated APA can cause human diseases and APA manipulations bear therapeutic potential,
a lot of attention has been paid to the mechanism of PAS selection in mammals (Hollerer et al. 2014).
Regulatory aspects of 3’ end processing in animals have been currently reviewed by Tian and Manley
2013; Elkon et al. 2013; Davis and Shi 2014 and Gruber et al. 2013. In recent years, the meaning of
APA in plants has also been unravelled in more detail and several mechanistic principals have been
found to be transferable from mammals to plants (Xing and Li 2011; Wu et al. 2011; Sherstnev et al.
2012; Tsuchiya and Eulgem 2013; Hunt 2014). The plant-specific autonomous pathway that
influences flowering time is an example for a regulatory network in which deregulations in PAS usage
can result in strong phenotypes (see chapter 1.2.2).
1.1.3 Canonical poly(A) polymerases
Eukaryotic cells express several kinds of nuclear and cytoplasmic poly(A) polymerases with diverse
functions (Schmidt and Norbury 2010; Laishram 2014). Canonical PAPs (cPAPs) are defined as
proteins that share a high amino acid sequence identity with the human PAP or the yeast PAP1p
(Lingner et al. 1991; Thuresson et al. 1994). These enzymes polyadenylate mRNAs and are mostly
localized in the nucleus, but can also be found in the cytoplasm (Lee et al. 2000; Meeks et al. 2009).
Remarkably, the number of cPAPs encoded by different eukaryotic organisms can vary. Drosophila
melanogaster, Saccharomyces cerevisiae (budding yeast) or the green unicellular algae
Chlamydomonas reinhardtii encode only one cPAP, but in the genomes of a large variety of
organisms several cPAPs can be identified.
In humans, three cPAPs named PAPα (also PAPOLA), PAPβ (also PAPOLB, testis-PAP or TPAP), and
PAPγ (also PAPOLG or neo-PAP) are expressed (Thuresson et al. 1994; Martin and Keller 2007; Fig. 3).
PAPα and PAPγ perform the bulk mRNA polyadenylation in animal cells, and while PAPα can be
detected in nucleus and cytosol, PAPγ is located exclusively in the nucleus (reviewed by Martin and

Introduction 20
Keller 2007). Different splice forms have been detected for both enzymes, but only the larger
proteins with molecular masses of around 80 kDa are catalytically active (Wahle and Rüegsegger
1999). The actual polyadenylation is performed by a catalytical centre in the highly conserved N-
terminal domain (NTD), which resembles other nucleotidyl transferases (Martin and Keller 1996).
Fig. 3 Structure and alignment of mammalian cPAPs (from Yang et al. 2014). a) Schematic image of the protein structures of human cPAPs. The N-terminal domain (NTD) comprises a catalytic domain (CAT), a central domain and an RNA recognition motif (RRM), followed by a nuclear
localization sequence (NLS). HsPAPα, hsPAP and hsPAP exhibit similar modular protein structures. However,
the cytosolic hsPAP does not contain the C-terminal domain, comprising cyclin-dependent kinase phosphorylation sites (cdk-p) and a U1A interaction motif (U1A). The domain sizes are not proportional to the length of the amino acid sequences. b) Phylogenetic tree of vertebrate cPAPs. Animal cPAPs group into the
three clades , , and named after the human cPAPs. For the alignment, cPAP sequences from rat (Rattus norvegicus), mouse (Mus musculus), human (Homo sapiens), chicken (Gallus gallus), cattle (Bos taurus), frog (Xenopus tropicalis), goldfish (Carassius auratus), zebrafish (Danio rerio) and pufferfish (Fugu rubripes and Tetraodon nigroviridis) were used.
Via an RNA-binding domain, the mammal PAP-NTD is connected with a less conserved regulatory
carboxy-terminal domain (CTD) (Raabe et al. 1994; Fig. 3). The CTD contains two nuclear localization
signals followed by a serine/threonine-rich region, which has been shown to undergo
a)
b)

Introduction 21
phosphorylation, sumoylation or acetylation (Colgan et al. 1996, 1998; Shimazu et al. 2007;
Vethantham et al. 2008). These modifications can alter the catalytic activity of cPAPs during a cell
cycle, the localization or protein interactions of the cPAP. In contrast, the third mammalian PAP,
PAPβ, lacks the CTD and functional nuclear localization domains and is found exclusively in the
cytoplasm of testis cells (Kashiwabara et al. 2000; Lee et al. 2000), where it polyadenylates mRNAs
required for spermatogenesis (Kashiwabara et al. 2002). Accordingly, the lack of PAP leads to male
sterility in mice.
While animals have been shown to express one (chicken), two (zebrafish) or three cPAPs (e.g. cow,
mouse, human), plants encode between two (moss fern Selagenilla, moss Physcomitrella) and up to
six PAPSs (Oryza sativa) (Meeks et al. 2009; Fig. 4).
Fig. 4 Alignment of cPAPs from plants and animals (from Meeks et al. 2009, modified). Plant cPAPs group in clusters around the Arabidopsis cPAPs PAPS1, PAPS2/4 and PAPS3, indicated by gray areas. The PAPs from mouse and human group in a separate mammalian clade. Indicated by colors are PAPs from Chlamydomonas reinhardtii (green), Selaginella moellendorfii (yellow), Physcomitrella patens (blue) and two putative pseudogenes from monocots (black). Other plant PAP sequences were taken from Arabidopsis, rice (Oryza sativa), sorghum (Sorghum bicolor), poplar (Populus trichocarpa) and grapevine (Vitis vinifera).
AtPAPS3
AtPAPS1
AtPAPS2/4
mammalian PAP

Introduction 22
Fig. 5 Protein structure and expression pattern of Arabidopsis poly(A) polymerases. a) Schematic presentation of the four AtPAPS proteins (after Addepalli et al. 2004, graphics modified). The conserved core that performs the catalysis, deletions and intron positions are indicated. The nuclear PAPSs contain a regulatory C-terminal domain, while the cytoplasmic PAPS3 consists entirely of the catalytic core domain. b) Expression level of the four AtPAPS genes in different plant tissues. While the nuclear PAPSs are expressed throughout the plant at high levels (with PAPS4 showing the strongest expression), the cytoplasmic PAPS3 is mainly expressed in floral organs. The strong peak reflects the expression of PAPS3 in pollen samples. The image was generated using the AtGenExpress Visualization Tool AVT (Schmid et al. 2005).
Arabidopsis encodes four cPAPs, named PAPS1 to PAPS4. The gene names correspond to the
chromosome localization of the four AtPAPS loci (Addepalli et al. 2004). So far, no crystal structure is
available for plant PAPs. However, with regard to the protein sequences, the domain arrangement of
the three nuclear enzymes PAPS1, PAPS2 and PAPS4 is similar to that of the mammalian nuclear
cPAPs. A highly conserved NTD performs the catalytic reaction, while the CTD sequences are less
conserved. With regard to their protein sequences, PAPS2 and PAPS4 exhibit a high overall similarity,
suggesting functional redundancy (Fig. 5). In contrast to PAPS1 and PAPS2/PAPS4, the PAPS3 protein
lacks the CTD and is located solely in the cytoplasm (Meeks et al. 2009). In an alignment with other
plant and animal cPAP sequences, the four AtPAPSs group in three clusters along with the other plant
PAPS 1
PAPS 2
PAPS 3 (cytoplasmic)
PAPS 4
Conserved Core
Deletion within coding sequence
Intron position
Catalytic domain
C-terminal domain
At1g17980
At2g25850
At3g06560
At4g32850
1000
100
10
1
inte
nsi
ty
PAPS 4
PAPS 1
PAPS 2
PAPS 3
nuclear
cytoplasmic
a)
b)

Introduction 23
PAPs, while the animal cPAPs form a fourth clade (Fig. 4). Moreover, PAPS3 is mainly expressed in
the pollen, while the three nuclear PAPSs are expressed throughout the plant (Fig. 5 b). These
structural and localization features resemble the characteristics of the three human PAPs described
before (Hunt 2008).
All AtPAPS proteins have been shown to exhibit unspecific polyadenylation activity in vitro (Hunt et
al. 2000; Meeks et al. 2009). Meeks et al. (2009) could not detect homozygous paps transfer-DNA (T-
DNA) insertion mutants among plant populations segregating for seven different mutant alleles of
the four different AtPAPSs. The group suggested that mutations in either AtPAPS gene are
gametophytic lethal and thus all cPAPs are essential for plant development. Later, Vi et al. (2013)
showed that homozygous T-DNA insertion and point mutants can be obtained for all four AtPAPSs.
The function of the three nuclear PAPSs was analysed more in detail. It was shown that homozygous
paps2 and paps4 knockout mutants as well as paps2 paps4 double mutants are viable and show a
wild-type like phenotype. However, knockout mutations of PAPS1 are indeed gametophytic lethal
and homozygous mutants could be obtained for hypomorphic alleles only. The loss-of-function
paps1-1 mutant, which was identified in an ethyl-methanesulfonate (EMS) mutagenesis screen,
carries a point mutation in the essential N-terminal domain between the catalytic core and the RNA-
binding domain. paps1-1 mutants exhibit smaller serrated leaves and larger floral organs than the
Arabidopsis wild type, a surprisingly specific phenotype for a ubiquitously expressed enzyme (Vi et al.
2013; Vi 2013, PhD thesis). The leaf phenotype is at least partly caused by the deregulated
polyadenylation of SMALL AUXIN UP RNA (SAUR) mRNAs. This was the first example of an mRNA sub-
group being polyadenylated specifically by one canonical PAP. Substrate specificity had so far only
been shown for noncanonical PAPs (ncPAPs) like the Star-PAP or GLD2 in animals (Mellman et al.
2008; Wang et al. 2002).
1.1.4 Poly(A) tail length control and its implications for gene expression regulation
Polyadenylation is an integral part of pre-mRNA maturation of almost all eukaryotic mRNAs. The only
exceptions are certain metazoan histone mRNAs which form a stem loop at their 3’ end instead of
being polyadenylated (Dávila López and Samuelsson 2008). Subsequent to the cleavage in the 3’ UTR,
a PAP adds adenosine monophosphates (A’s) to the released 3’ OH group. The poly(A) tail (PAT) is
elongated to an organism-specific length reaching from around 80 nucleotides (nt) in yeast up to 250
A’s in mammals (Wahle 1995; Amrani et al. 1997). In Arabidopsis, the tail was found to start with an
average length of around 150 nt (Vi 2013, PhD thesis).
The PAT serves several functions in the cell. It was shown to be required for mRNAs to pass the
nuclear envelope and to enter the cytoplasm (Dower et al. 2004; Fuke and Ohno 2008). In the
cytoplasm, the PAT is progressively degraded at a transcript-specific deadenylation rate and the
Introduction 24
remaining short tails ultimately trigger decapping and exosomal decay of the mRNA (Decker and
Parker 1993; Beelman and Parker 1995). A higher stability of mRNAs is supported by cytoplasmic
poly(A) binding proteins which prevent deadenylation (Bernstein et al. 1989; Ford et al. 1997).
Interestingly, with more advanced techniques determining the 3’ terminome (the entity of mRNA 3’
ends), a high proportion of stable oligo(A)-containing transcripts has been discovered in recent years
(e.g. Choi and Hagedorn 2003; Meijer et al. 2007; Chang et al. 2014).
Longer PATs have been found to correlate with higher protein expression levels by stimulating mRNA
translation (e.g. Preiss et al. 1998; Novoa et al. 2010). In mammals and yeast, the cytoplasmic poly(A)
binding protein PABP interacts with the cap-binding translation initiation factor subunit eIF4, which
results in pseudo-circularization of the mRNA and an enhancement of translation efficiency (Tarun
and Sachs 1996; Weill et al. 2012).
1.2 Control of flowering time and the role of 3’ end processing
1.2.1 The flowering time network: Key regulators and pathways in Arabidopsis
During the plant life cycle, the transition to flowering is a decisive step. To ensure reproductive
success, the change of the developmental program has to occur under favourable environmental
conditions. Optimal climate or nutrient requirements for flowering might differ from species to
species and a tight regulatory network is a prerequisite for the plant to survive seasonal fluctuations.
Some plants flower annually or even have several reproductive cycles per year; others flower in a
perennial mode. The life cycle of biennial plants lasts for two years. Biennials often need a prolonged
period of cold in winter as a trigger to leave the vegetative growth phase and to enter the
reproductive cycle. This process is known as vernalization and has been studied intensely in the last
two decades. Arabidopsis serves as a good model plant since both vernalization-dependent and
-independent accessions are available.
Before the competence to flower is gained, plants undergo a change from the juvenile to the adult
phase, which is often accompanied by morphological changes regarding leaf size and shape or plant
architecture (Poethig 2003). Mainly internal factors, like the sugar status, hormonal changes and
epigenetic mechanisms are involved in the process of plant maturation (reviewed e.g. by Poethig
2013 and Thomas 2013). Two antagonistic miRNA families named miR156 and miR172 play a major
role in age-dependent flowering time control (extensively reviewed by Yamaguchi and Abe 2012;
Wang 2014; Spanudakis and Jackson 2014).
While the promotive role of the plant hormone gibberellic acid (GA) for flowering has been observed
long ago, its molecular mode of action has only been revealed in recent years (Langridge 1957;
Wilson and Somerville 1995). GA acts through so-called DELLAs, nuclear proteins that contain a

Introduction 25
DELLA domain and are degraded by the proteasome upon GA perception (Sun and Gubler 2004; Gao
et al. 2011).
Plants react to environmental factors, like the amount of available light or the external temperature,
with intricate and interconnected molecular networks. Environmental signals are perceived and
integrated, leading to specific growth responses adapted to the surrounding conditions. Day length is
measured by the photoperiod pathway which is tightly connected with the plant internal circadian
clock (reviewed by Srikanth and Schmid 2011; Kinmonth-Schultz et al. 2013). The complex internal
clock system is daily entrained by light and aids to adjust the photosynthetic metabolism in advance
to the rhythmic environmental changes. Furthermore, blue and red light receptors located in the leaf
sense light quality and quantity.
In addition to light, elevated ambient temperatures promote flowering. Plants react very sensitively
to thermal changes. Under low temperatures, the flowering inhibitor FLOWERING LOCUS M (FLM)
represses gene expression of floral pathway integrators (FPIs) in concert with the flowering time
regulator SHORT VEGETATIVE PHASE (SVP). In response to increased temperatures, FLM mRNA is
spliced alternatively. The FLM-SVP protein complex induced by warm temperatures has a reduced
DNA binding activity. Consequently, FPI promoters are released (Lee et al. 2013; Posé et al. 2013).
Moreover, the nucleosome composition and DNA accessibility of flowering key regulators, like
FLOWERING LOCUS T (FT), are modified in response to ambient temperature (Kumar and Wigge
2010; Kumar et al. 2012).
A major inhibitor of flowering is the MADS box-type transcription factor FLOWERING LOCUS C (FLC)
(Michaels and Amasino 2001). FLC typically binds genes containing a CarG-box in their promoter
region and can act as transcriptional activator or repressor in diverse developmental processes (Deng
et al. 2011; Willmann and Poethig 2011). It represses flowering by inhibiting the expression of FPIs
like FT, LEAFY (LFY) or SUPPRESSOR OF OVEREXPRESSION OF CONSTANS1 (SOC1/ AGL20) (Michaels
and Amasino 2001; Simpson and Dean 2002; Helliwell et al. 2006; Fig. 6). Several chromatin
modifiers and RNA-processing factors are required for the upregulation of FLC (summarized by
Quesada et al. 2005). High expression levels of FLC cause the late flowering phenotype of
vernalization-dependent Arabidopsis accessions (Michaels and Amasino 1999). The FLC-promoting
component in these ecotypes is FRIGIDA (FRI) (Koornneef et al. 1994; Johanson et al. 2000). FRI is a
scaffold protein acting in a complex that recruits chromatin modifiers to the FLC promoter (Choi et al.
2011). Long periods of cold cause epigenetic changes at the FLC locus, resulting in a stringent and
persistent downregulation (see chapter 1.2.3).
Introduction 26
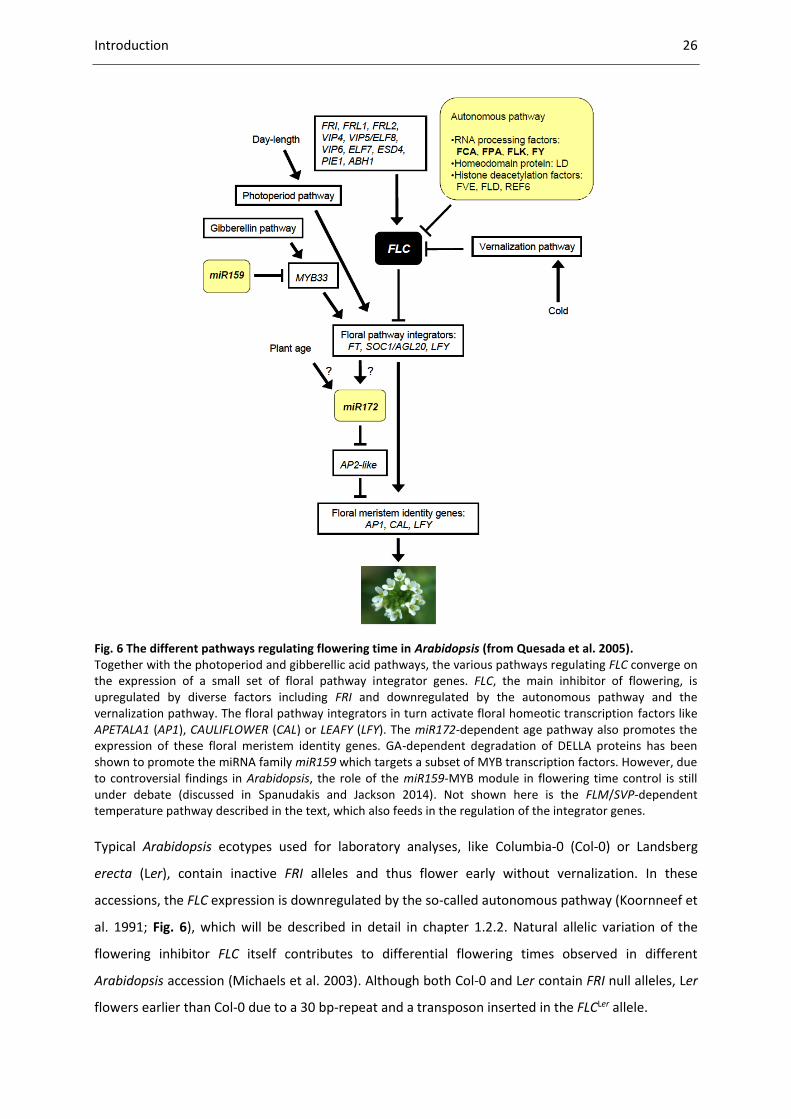
Fig. 6 The different pathways regulating flowering time in Arabidopsis (from Quesada et al. 2005). Together with the photoperiod and gibberellic acid pathways, the various pathways regulating FLC converge on the expression of a small set of floral pathway integrator genes. FLC, the main inhibitor of flowering, is upregulated by diverse factors including FRI and downregulated by the autonomous pathway and the vernalization pathway. The floral pathway integrators in turn activate floral homeotic transcription factors like APETALA1 (AP1), CAULIFLOWER (CAL) or LEAFY (LFY). The miR172-dependent age pathway also promotes the expression of these floral meristem identity genes. GA-dependent degradation of DELLA proteins has been shown to promote the miRNA family miR159 which targets a subset of MYB transcription factors. However, due to controversial findings in Arabidopsis, the role of the miR159-MYB module in flowering time control is still under debate (discussed in Spanudakis and Jackson 2014). Not shown here is the FLM/SVP-dependent temperature pathway described in the text, which also feeds in the regulation of the integrator genes.
Typical Arabidopsis ecotypes used for laboratory analyses, like Columbia-0 (Col-0) or Landsberg
erecta (Ler), contain inactive FRI alleles and thus flower early without vernalization. In these
accessions, the FLC expression is downregulated by the so-called autonomous pathway (Koornneef et
al. 1991; Fig. 6), which will be described in detail in chapter 1.2.2. Natural allelic variation of the
flowering inhibitor FLC itself contributes to differential flowering times observed in different
Arabidopsis accession (Michaels et al. 2003). Although both Col-0 and Ler contain FRI null alleles, Ler
flowers earlier than Col-0 due to a 30 bp-repeat and a transposon inserted in the FLCLer allele.
Introduction 27
The described internal and external cues are integrated by the plant and ultimately lead to flowering
under favourable conditions. Rather than acting strictly in parallel, the different pathways seem to be
interconnected. Several miRNAs are involved in the crosstalk of the hormone, age and photoperiod
pathways controlling flowering time (Wang 2014). Lastly, the various signals converge on one
regulatory checkpoint: they regulate the expression of the few above mentioned floral pathway
integrators (Simpson and Dean 2002). The FPIs then activate floral homeotic genes, also known as
floral meristem identity genes, or are involved in flower development themselves (Fig. 6). The
processes of signal integration and gene expression coordination leading to flower formation have
been excellently reviewed by Posé et al. (2012) and Andrés and Coupland (2012).
1.2.2 The autonomous pathway In the early 1990s, a set of proteins with variable functions has been demonstrated to influence the
flowering of Arabidopsis independently from environmental factors. The combined action of these
factors has been termed the constitutive or autonomous pathway (Amasino 1996). The first
groundbreaking work that suggested the discrimination of different, partly independent pathways in
the regulation of flowering was performed by Koornneef et al. (1991). Marten Koornneef and his
colleagues identified 11 loci which they separated in three groups based on their behaviour under
long-day (LD) and short-day (SD) conditions in combination with vernalization treatments. Four of the
genes detected by Koornneef et al. (1991) grouped together and are part of the autonomous
pathway: FCA, FY, FPA and FVE (these names are no abbreviations). Later four more members,
termed FLOWERING LOCUS K (FLK), FLOWERING LOCUS D (FLD), LUMINIDEPENDENS and RELATIVE
OF EARLY FLOWERING 6 (REF6), were classified (Quesada et al. 2005; Fig. 6). Most of the pathway
members are RNA-processing or chromatin-modifying factors. Mutants of these factors flower late
due to increased FLC expression but are responsive to vernalization (Michaels and Amasino 2001).
The best described factors of the autonomous pathway are the RNA-processing factors FCA and FPA.
FCA encodes a plant-specific protein containing both RNA- and protein-binding domains (Macknight
et al. 1997). Interestingly, in addition to controlling FLC transcription, FCA regulates its own splicing
and polyadenylation. Four FCA splice forms have been described, called FCA to FCA (Macknight et
al. 1997; Fig. 7). While FCA is predominantly expressed early in development, only the splice form
FCAγ encodes the functional FCA protein. The active protein promotes the selection of a proximal
(i.e. more upstream) PAS in intron 3, which leads to the production of a truncated, inactive protein
(Quesada et al. 2003; Fig. 8).
Introduction 28
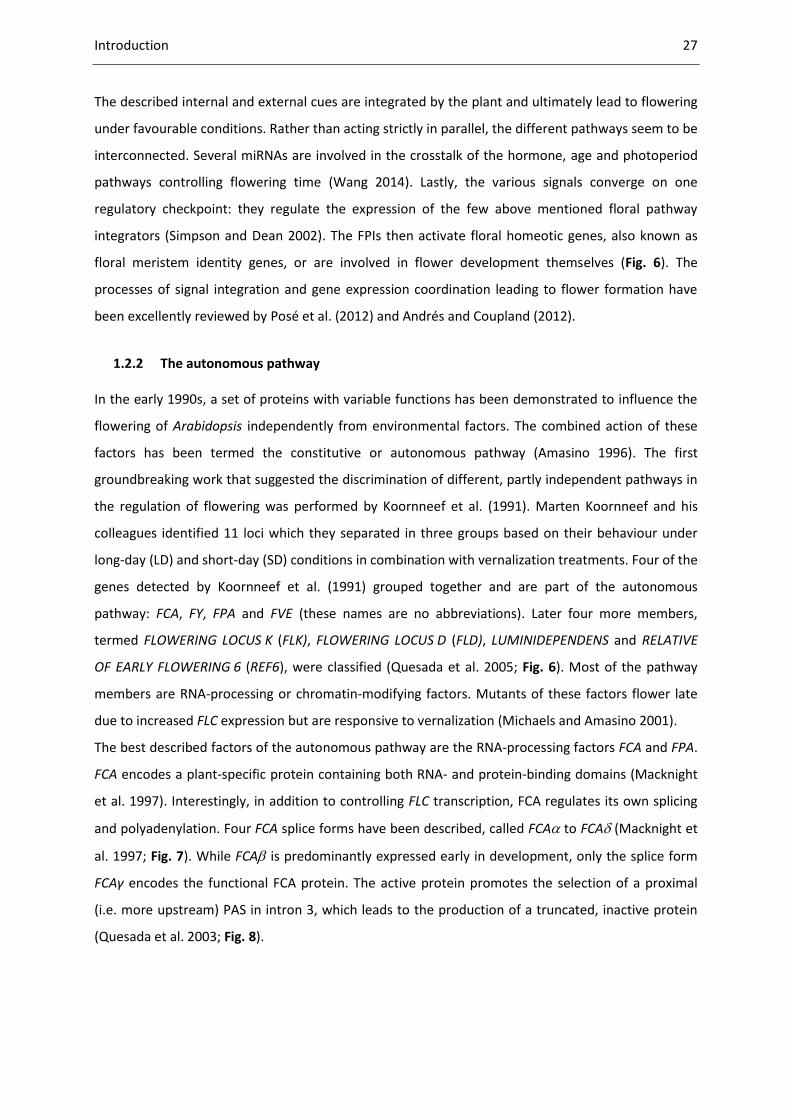
Fig. 7 Four FCA splice forms are expressed in Arabidopsis (from Macknight et al. 1997). Exons are depicted as white boxes; retained introns are shown as black horizontal lines between the exons. Horizontal black lines underneath the illustrated mRNA represent possible open reading frames. FCA mRNA abundances were checked by RNAse protection assay and reverse transcription PCR with total RNA from plants
grown under short day (SD) and long day (LD) conditions until they had reached the 23 leaf stage.
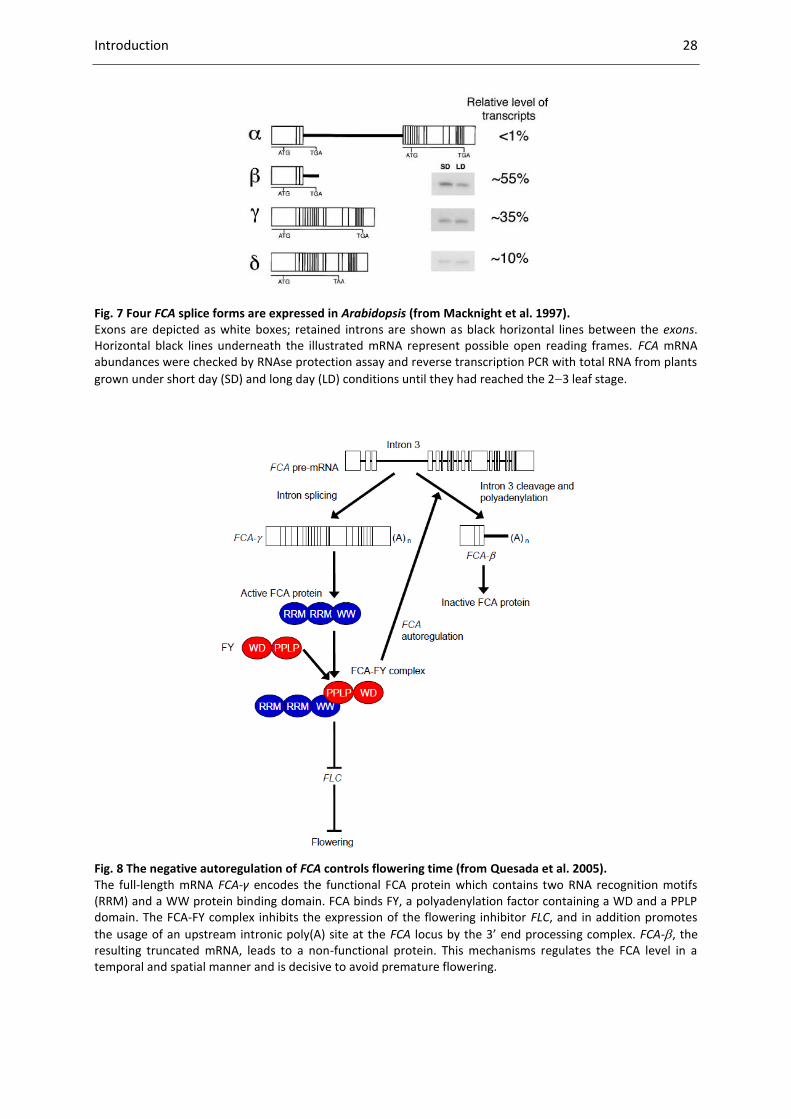
Fig. 8 The negative autoregulation of FCA controls flowering time (from Quesada et al. 2005). The full-length mRNA FCA-γ encodes the functional FCA protein which contains two RNA recognition motifs (RRM) and a WW protein binding domain. FCA binds FY, a polyadenylation factor containing a WD and a PPLP domain. The FCA-FY complex inhibits the expression of the flowering inhibitor FLC, and in addition promotes
the usage of an upstream intronic poly(A) site at the FCA locus by the 3’ end processing complex. FCA-, the resulting truncated mRNA, leads to a non-functional protein. This mechanisms regulates the FCA level in a temporal and spatial manner and is decisive to avoid premature flowering.

Introduction 29
The upstream regulators that lead to the initial shift in PAS and splice site selection are still unknown
(Rataj and Simpson 2014). However, the balance of the FCA splice forms in vegetative tissue is critical
for the suppression of premature flowering (Macknight et al. 2002). In order to repress FLC activity
and for the negative FCA autoregulation, FCA has to interact physically with the polyadenylation
factor FY (Simpson et al. 2003). Both factors form an epistasis group (Koornneef et al. 1998).
The plant FY protein contains an essential WD repeat structure that is highly conserved in eukaryotic
FY homologues. In addition, it contains a C-terminal extension to interact with FCA (Simpson et al.
2003; Henderson et al. 2005). While null mutations in AtFY are lethal, mutants with hypomorphic
alleles are viable and show variability in the late-flowering phenotype. Like fca mutants, the fy
mutants flower early in combination with a loss-of-function FLC allele (Henderson et al. 2005). An
epistasis analysis with the hypomorphic allele fy-5, performed by Feng et al. (2011), raised the
possibility of FY being involved in both repression and FCA-independent activation of FLC.
The 3’ end processing factor FPA regulates its own splicing besides the downregulation of FLC, a
situation reminiscent to the autoregulation of FCA (Hornyik et al. 2010). However, FPA and FCA act in
independent pathways (Hornyik et al. 2010; Bäurle and Dean 2008). The repressive mode of action
by FCA and FPA will be discussed in chapter 1.2.3.
The chromatin remodelling factors FLD, FVE and REF6 ensure the timely flowering of Arabidopsis by
controlling the deposition of repressive marks on chromatin at the FLC locus (Quesada et al. 2005).
Very little is known about the RNA-binding protein FLK which regulates FLC constitutively and
independently from the photoperiod or vernalization pathway (Lim et al. 2004; Mockler et al. 2004).
LUMINIDEPENDENS is a homeodomain-containing protein which is expressed in meristematic regions
and putatively acts as a transcription factor (Lee et al. 1994; Aukerman et al. 1999).
The restriction of FLC transcription by the autonomous pathway represents an example of gene
regulation that links the coordination of mRNA 3’ end processing and chromatin modification. Since
the effects of FLC expression alterations are directly visible at the phenotypic level, Arabidopsis
flowering time has developed to a subject of intensive investigation. Over the years it was revealed
that many pathway members, especially the general 3’ end processing regulators, have multiple
functions at both the cellular and the whole-plant level. FCA is for example also required for root
development (Macknight et al. 2002). Veley and Michaels (2008) analysed a large set of autonomous
pathway double mutants and found several factors to be involved in the regulation of plant growth
and fertility.
Other factors involved in RNA metabolism and splicing have been implicated in the regulation of FLC
but have not been characterized enough to be classified as autonomous pathway members (Rataj
and Simpson 2014).
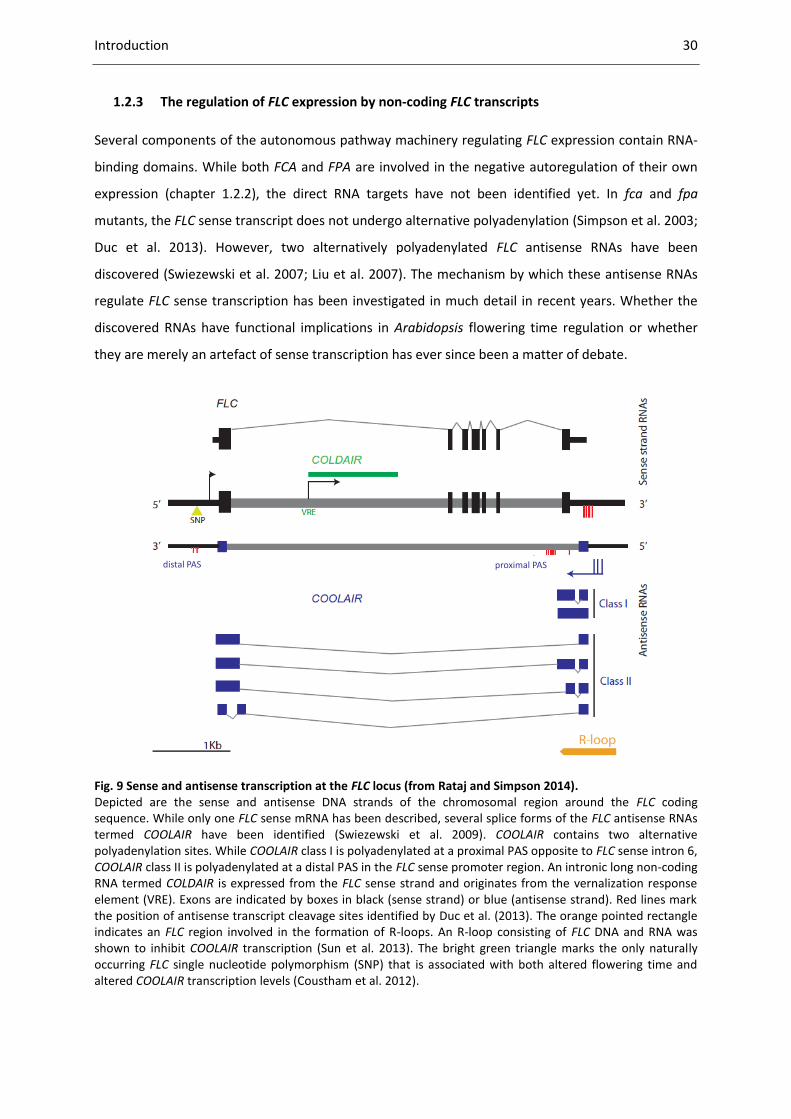
Introduction 30
1.2.3 The regulation of FLC expression by non-coding FLC transcripts
Several components of the autonomous pathway machinery regulating FLC expression contain RNA-
binding domains. While both FCA and FPA are involved in the negative autoregulation of their own
expression (chapter 1.2.2), the direct RNA targets have not been identified yet. In fca and fpa
mutants, the FLC sense transcript does not undergo alternative polyadenylation (Simpson et al. 2003;
Duc et al. 2013). However, two alternatively polyadenylated FLC antisense RNAs have been
discovered (Swiezewski et al. 2007; Liu et al. 2007). The mechanism by which these antisense RNAs
regulate FLC sense transcription has been investigated in much detail in recent years. Whether the
discovered RNAs have functional implications in Arabidopsis flowering time regulation or whether
they are merely an artefact of sense transcription has ever since been a matter of debate.
Fig. 9 Sense and antisense transcription at the FLC locus (from Rataj and Simpson 2014). Depicted are the sense and antisense DNA strands of the chromosomal region around the FLC coding sequence. While only one FLC sense mRNA has been described, several splice forms of the FLC antisense RNAs termed COOLAIR have been identified (Swiezewski et al. 2009). COOLAIR contains two alternative polyadenylation sites. While COOLAIR class I is polyadenylated at a proximal PAS opposite to FLC sense intron 6, COOLAIR class II is polyadenylated at a distal PAS in the FLC sense promoter region. An intronic long non-coding RNA termed COLDAIR is expressed from the FLC sense strand and originates from the vernalization response element (VRE). Exons are indicated by boxes in black (sense strand) or blue (antisense strand). Red lines mark the position of antisense transcript cleavage sites identified by Duc et al. (2013). The orange pointed rectangle indicates an FLC region involved in the formation of R-loops. An R-loop consisting of FLC DNA and RNA was shown to inhibit COOLAIR transcription (Sun et al. 2013). The bright green triangle marks the only naturally occurring FLC single nucleotide polymorphism (SNP) that is associated with both altered flowering time and altered COOLAIR transcription levels (Coustham et al. 2012).
distal PAS proximal PAS
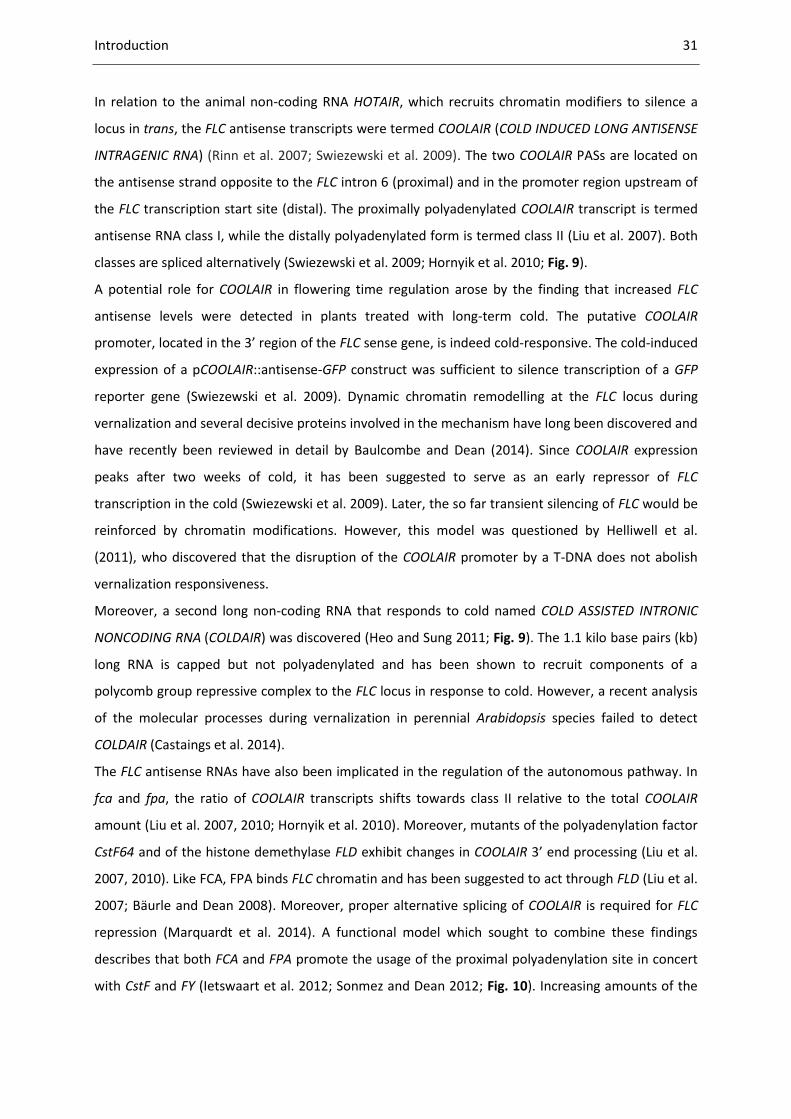
Introduction 31
In relation to the animal non-coding RNA HOTAIR, which recruits chromatin modifiers to silence a
locus in trans, the FLC antisense transcripts were termed COOLAIR (COLD INDUCED LONG ANTISENSE
INTRAGENIC RNA) (Rinn et al. 2007; Swiezewski et al. 2009). The two COOLAIR PASs are located on
the antisense strand opposite to the FLC intron 6 (proximal) and in the promoter region upstream of
the FLC transcription start site (distal). The proximally polyadenylated COOLAIR transcript is termed
antisense RNA class I, while the distally polyadenylated form is termed class II (Liu et al. 2007). Both
classes are spliced alternatively (Swiezewski et al. 2009; Hornyik et al. 2010; Fig. 9).
A potential role for COOLAIR in flowering time regulation arose by the finding that increased FLC
antisense levels were detected in plants treated with long-term cold. The putative COOLAIR
promoter, located in the 3’ region of the FLC sense gene, is indeed cold-responsive. The cold-induced
expression of a pCOOLAIR::antisense-GFP construct was sufficient to silence transcription of a GFP
reporter gene (Swiezewski et al. 2009). Dynamic chromatin remodelling at the FLC locus during
vernalization and several decisive proteins involved in the mechanism have long been discovered and
have recently been reviewed in detail by Baulcombe and Dean (2014). Since COOLAIR expression
peaks after two weeks of cold, it has been suggested to serve as an early repressor of FLC
transcription in the cold (Swiezewski et al. 2009). Later, the so far transient silencing of FLC would be
reinforced by chromatin modifications. However, this model was questioned by Helliwell et al.
(2011), who discovered that the disruption of the COOLAIR promoter by a T-DNA does not abolish
vernalization responsiveness.
Moreover, a second long non-coding RNA that responds to cold named COLD ASSISTED INTRONIC
NONCODING RNA (COLDAIR) was discovered (Heo and Sung 2011; Fig. 9). The 1.1 kilo base pairs (kb)
long RNA is capped but not polyadenylated and has been shown to recruit components of a
polycomb group repressive complex to the FLC locus in response to cold. However, a recent analysis
of the molecular processes during vernalization in perennial Arabidopsis species failed to detect
COLDAIR (Castaings et al. 2014).
The FLC antisense RNAs have also been implicated in the regulation of the autonomous pathway. In
fca and fpa, the ratio of COOLAIR transcripts shifts towards class II relative to the total COOLAIR
amount (Liu et al. 2007, 2010; Hornyik et al. 2010). Moreover, mutants of the polyadenylation factor
CstF64 and of the histone demethylase FLD exhibit changes in COOLAIR 3’ end processing (Liu et al.
2007, 2010). Like FCA, FPA binds FLC chromatin and has been suggested to act through FLD (Liu et al.
2007; Bäurle and Dean 2008). Moreover, proper alternative splicing of COOLAIR is required for FLC
repression (Marquardt et al. 2014). A functional model which sought to combine these findings
describes that both FCA and FPA promote the usage of the proximal polyadenylation site in concert
with CstF and FY (Ietswaart et al. 2012; Sonmez and Dean 2012; Fig. 10). Increasing amounts of the
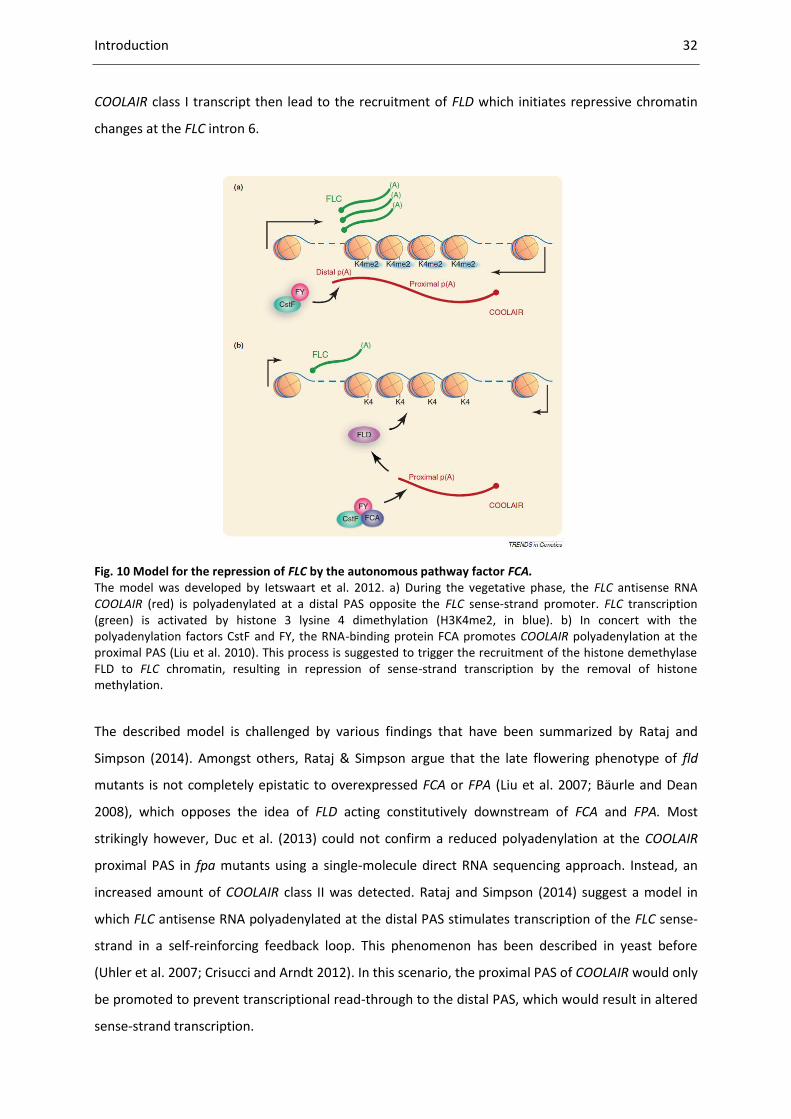
Introduction 32
COOLAIR class I transcript then lead to the recruitment of FLD which initiates repressive chromatin
changes at the FLC intron 6.
Fig. 10 Model for the repression of FLC by the autonomous pathway factor FCA. The model was developed by Ietswaart et al. 2012. a) During the vegetative phase, the FLC antisense RNA COOLAIR (red) is polyadenylated at a distal PAS opposite the FLC sense-strand promoter. FLC transcription (green) is activated by histone 3 lysine 4 dimethylation (H3K4me2, in blue). b) In concert with the polyadenylation factors CstF and FY, the RNA-binding protein FCA promotes COOLAIR polyadenylation at the proximal PAS (Liu et al. 2010). This process is suggested to trigger the recruitment of the histone demethylase FLD to FLC chromatin, resulting in repression of sense-strand transcription by the removal of histone methylation.
The described model is challenged by various findings that have been summarized by Rataj and
Simpson (2014). Amongst others, Rataj & Simpson argue that the late flowering phenotype of fld
mutants is not completely epistatic to overexpressed FCA or FPA (Liu et al. 2007; Bäurle and Dean
2008), which opposes the idea of FLD acting constitutively downstream of FCA and FPA. Most
strikingly however, Duc et al. (2013) could not confirm a reduced polyadenylation at the COOLAIR
proximal PAS in fpa mutants using a single-molecule direct RNA sequencing approach. Instead, an
increased amount of COOLAIR class II was detected. Rataj and Simpson (2014) suggest a model in
which FLC antisense RNA polyadenylated at the distal PAS stimulates transcription of the FLC sense-
strand in a self-reinforcing feedback loop. This phenomenon has been described in yeast before
(Uhler et al. 2007; Crisucci and Arndt 2012). In this scenario, the proximal PAS of COOLAIR would only
be promoted to prevent transcriptional read-through to the distal PAS, which would result in altered
sense-strand transcription.

Introduction 33
The various and seemingly heterogeneous results regarding the FLC antisense RNAs reflect technical
difficulties that arise when several overlapping RNAs are transcribed from one locus. Furthermore, in
contrast to the sense transcript, the FLC antisense RNAs are expressed at very low levels and undergo
extensive alternative splicing and polyadenylation. Future work has to clarify whether both
polyadenylation forms and the diverse splice forms indeed have functional implications. COOLAIR has
been associated with the recruitment of chromatin remodeling factors in both the autonomous and
the vernalization pathway. Contradictory results regarding the role of COOLAIR in both pathways are
puzzling. So far, the exact mechanistic link between the antisense RNAs and the observed changes at
the chromatin level remains to be elucidated.
1.3 Plant acclimations to stress
1.3.1 Plants are stressed constantly
When a young plant develops during germination or from a vegetative stolon, roots will usually be
formed immediately to anchor the plant in the ground. From that point on, the plant is confronted
with constantly changing environmental conditions. To what extent plants have to cope with
fluctuations of temperature, light and humidity depends on the duration of the species’ life cycle and
on its location. The composition of the ground, which may be fertilized soil or stone covered only by
a thin humus layer, determines the amount of accessible nutrients and trace elements and also
osmolarity or the pH which plants have to adjust to. Lastly, plants are constantly subjected to
predators, like feeding animals, fungi or bacterial pathogens. Every outer influence that compromises
plant growth is termed stress. Stressful conditions might prevent an increase in biomass, optimal
assimilation or even plant reproduction and survival. Acclimations designate short-term adjustments
to changing conditions and are to be distinguished from genetic adaptations. To optimally use
natural resources, plants evolved a variety of adaptation strategies regarding different aspects of
plant growth or cell responses. These strategies are species- and habitat-specific. To increase yield,
enhanced stress tolerance has ever since been selected by plant breeders and is still being improved
(e.g. Araus and Cairns 2014; Kissoudis et al. 2014).
Plants constantly encounter multiple stress factors, which have to be recognized, integrated and
transformed into signals that ultimately induce stress resistance or tolerance (Fig. 11).

Introduction 34
Fig. 11 Stress-induced signal transduction cascades in plants. Plant resistance and tolerance responses to stress are regulated by intricate signalling cascades, involving e.g. receptors, second messengers and transcription factors as well as post-transcriptional and post-translational modifications (from Atkinson and Urwin 2012, modified).
Environmental signals can be perceived by the plasma membrane, for example by sensor proteins or
by membrane fluidity, and can induce intracellular changes (Huang et al. 2012). The formation or
release of second messengers like calcium ions (Ca2+) or reactive oxygen species (ROS) results in the
alteration of the cytosolic Ca2+ level, which induces calcium dependent signalling cascades (reviewed
by Huang et al. 2012; Gilroy et al. 2014). Mitogen-activated protein kinases have been implicated in
the crosstalk of calcium and ROS and serve as convergence points for different stress response
pathways (Kissoudis et al. 2014). Moreover, phytohormones may be involved in stress signalling
(reviewed e.g. by Atkinson and Urwin 2012). The signalling cascades ultimately lead to the activation
of transcription factors and stress responsive genes. Extensive cross-talk between the diverse
signalling cascades has been suggested, since many components have been shown to be shared by
different stress pathways (reviewed e.g. by Atkinson and Urwin 2012; Kissoudis et al. 2014). Shared
Post-transcriptional regulatione.g. by small RNAs
Post-transcriptional regulationof transcription factors
Combination of environmental stresses
Abiotic stress
Bioticstress
Perception of stresse.g. by osmoreceptors,
pathogen recognition receptors
Signal transduction
MAP kinase cascades
ROS accumulation
Hormone signalling
Induction of multiple and individual stress-induced transcription factors
e.g. HSF, AP2/ERF, WRKY, NAC, MYB, AREB/ABF, DREB/CBF
Expression of functional downstream response genese.g. LEA proteins, heat shock proteins, ion channels,
ROS detoxification, stomatal closure, growth regulation, cell death
Stress tolerance/resistance

Introduction 35
signalling cascades might result from stresses that cannot be distinguished by the plant, or different
stress types might require similar protective reactions (Knight and Knight 2001).
Post-transcriptional and post-translational processes add another layer of regulation to stress
response pathways (reviewed by Mazzucotelli et al. 2008; Fig. 12). RNA secondary structure
formation and alternative splicing of mRNAs encoding regulatory proteins in response to stress
stimuli have been reported (Owttrim 2006; Staiger and Brown 2013). To reveal the impact of
alternative splicing on stress resistance, global splicing patterns in stressed plants have been
analysed (e.g. Ding et al. 2014a). Much less is known about alternative polyadenylation during stress
adaptation. The polyadenylation factor CPSF30 determines PAS choice in response to oxidative stress
(Zhang et al. 2008; Thomas et al. 2012). Mechanistic details about the CPSF30-dependent response
pathway will be described in chapter 1.3.3.
Fig. 12 RNA-processing and post-translational modification involved in plant stress responses. Different RNA-processing steps and post-translational modifications are interconnected and contribute to the generation of responses to abiotic stress in plants (from Mazzucotelli et al. 2008, modified). Both post-transcriptional modification of stress-related mRNAs by alternative splicing or miRNA silencing add an additional regulatory layer to stress signalling pathways. Protein modifications like phosphorylation, sumoylation or ubiquitination regulate protein activities or mark proteins for degradation. Not mentioned here is the S-nitrosylation of proteins by nitric oxide, which has recently been characterized more in detail (reviewed by Trapet et al. 2014). Proteins involved in the regulation or modified themselves are marked in blue. Connections marked by dotted arrows have not been reported in plants.
In recent years, the potential of epigenetic mechanisms in the induction and maintenance of stress
responses is being explored in more detail (reviewed by Baulcombe and Dean 2014; Kissoudis et al.
2014; Stief et al. 2014).
mR
NA
leve
lP
rote
in le
vel
Splicing regulators RNA-binding proteins
Phosphorylation
Other steps of RNA metabolism
Alternative Splicing miRNA silencing
mRNAs available for translation
Stress-related transcription factors INACTIVE FORM
Stress-related transcription factors ACTIVE FORM
Phosphorylation
Sumoylation Ubiquitination
Stress inducible components of
post-translational modification mechanisms(i.e. E3 ubiquitin ligases,
kinases)
Ph
osp
ho
rylation
Major stress responsive genes
Introduction 36
A vast amount of stress-induced signalling pathways and physiological plant stress responses has
already been unravelled. It will be interesting to see whether further connections between the
“classical” signalling cascades, 3’ end processing factors and epigenetic modifications will be revealed
in the future and which regulatory steps might serve as integration nodes in the regulatory networks.
1.3.2 Molecular acclimations of plant cells to oxidative stress
Since plants are photosynthetic organisms, large quantities of oxygen are constitutively being
produced. As by-products, ROS, such as hydroxyl radicals, superoxide (O2−), singlet oxygen (1O2), or
hydrogen peroxide (H2O2) are generated. Metabolic pathways like respiration impinge on the
intracellular ROS pool. Peroxisomes produce large amounts of H2O2 during photorespiration as well,
but simultaneously limit the ROS content (Mhamdi et al. 2012; Sandalio et al. 2013). Additionally,
both biotic and abiotic stress stimuli affect the cellular redox status (reviewed e.g. by Foyer and
Noctor 2005). Critical amounts of ROS result in oxidative damage due to radical cascade reactions
that destroy cell components like membranes, proteins or DNA (Noctor and Foyer 1998). To prevent
cell death, ROS-scavenging components and enzymes are being produced constantly. Plant cells
contain a large set of antioxidant components: ascorbic acid, glutathione (GSH) or NADP(H), but also
small proteins like thioredoxin or glutaredoxin, or metabolites likes sugars, phenolics, amino acids,
carotenoids and tocopherols (Couée et al. 2006; Kissoudis et al. 2014). Several enzymes disarm ROS
via a conversion to harmless components, like oxygen and water. Superoxide dismutases (SODs) and
peroxidases act throughout the cell. SODs transform O2− into H2O2, whereas peroxidases detoxify
H2O2 to water by using a reductant (Bowler et al. 1992; Noctor and Foyer 1998). The ascorbate
peroxidase for example uses ascorbate as a substrate which is subsequently recovered in the
ascorbic acid-GSH-cycle (Rausch and Wachter 2005). Catalases detoxify H2O2 with a higher catalytic
activity but with a lower substrate specificity than peroxidases (Willekens et al. 1997). Characteristics
of ROS-scavenging components and enzymes in plants have been summarized e.g. by Noctor and
Foyer 1998; Rausch and Wachter 2005 and Meyer et al. 2009. Antioxidants are of particular
importance in plastids due to thiol-regulated enzymes in photosynthesis-related processes. H2O2
oxidises thiol groups very rapidly. Thus, high amounts of peroxidases and catalases are present in
chloroplasts (Kaiser 1979; Meyer et al. 2009).
Remarkably, ROS are not only potentially harmful but are also important signalling components. They
are required for proper plant development or during acclimation and defence reactions. Foyer and
Shigeoka (2011) reviewed the regulatory role of ROS in the improvement of photosynthesis and
discussed the possibility of ROS-scavenging mechanisms having evolved to be “leaky” to allow ROS to
act as signalling molecules. Among the huge amount of genes responsive to ROS in Arabidopsis, there
are many transcription factors and protein kinases (Shigeoka and Maruta 2014). Diverse factors

Introduction 37
encoded by these genes do not show an obvious connection to oxidative response pathways.
Surprisingly, the exact mechanism by which ROS are perceived in plant cells has yet to be uncovered.
ROS are unlikely to be bound by proteins, but rather act indirectly by oxidizing cysteine containing
proteins (reviewed by Shigeoka and Maruta 2014; Wrzaczek et al. 2013). In a very rapid reaction with
the O2− anion, the gas nitric oxide (NO) can be converted to peroxynitrite which has been suggested
to act as a signalling component in plants (Foyer and Shigeoka 2011). As a signalling molecule and via
post-translational S-nitrosylation of proteins, NO is involved in the crosstalk between Ca2+ and ROS
(summarized by Trapet et al. 2014).
The redox state, which is defined as the balance of ROS and ROS-detoxifying components, ultimately
determines cell fate. Deleterious ROS concentrations may results in cell death, while moderate
concentrations elicit certain cellular responses. Apparently, subsets of plant genes are induced
specifically by certain kinds of ROS that are produced at particular cell compartments, while others
are generally ROS-responsive (Shigeoka and Maruta 2014).
ROS-induced gene expression may be caused by signalling cascades and involve second messengers
like calcium (Rentel and Knight 2004). Moreover, since H2O2 easily permeates membranes, it has
been suggested to directly modulate activities of redox-responsive transcription factors or protein
kinases in the nucleus (Shigeoka and Maruta 2014). One of these proteins may be the
polyadenylation factor CPSF30 which connects redox-sensitivity with alternative polyadenylation and
plant resistance to oxidative stress.
1.3.3 CPSF30-mediated alternative polyadenylation regulates the response to oxidative stress
The dual role of ROS described above entails the tight regulation of ROS-responsive gene expression
at several levels. Since a polyadenylation factor mutant has been identified in a screen for ROS-
resistant Arabidopsis plants, the functional relation between 3’ end processing and oxidative stress is
being investigated in more detail.
To identify factors required for plant responses to increased amounts of oxidative molecules in both
the chloroplast and the cytoplasm, a T-DNA insertion mutant library was tested for an enhanced
resistance phenotype (Zhang et al. 2008). The root formation of plants growing on media containing
methyl viologen or catalase and GSH synthesis inhibitors (described in chapter 3.2.4) was used as an
indicator for resistance. Although the mutant oxt6 was generally smaller, it exhibited longer roots
than the wild type Col-0 on both media. Moreover, oxt6 exhibited a higher dry weight after two
weeks of oxidative stress. The oxt6 mutant contains a T-DNA insertion in the first exon of At1g30460,
which disrupts the formation of the polyadenylation factor subunit CPSF30 (described in chapter
1.1.1). The OXT6 locus encodes two transcripts that are spliced and polyadenylated alternatively
(Delaney et al. 2006; Fig. 13). The proximal polyadenylation site is located in intron 2. The short

Introduction 38
transcript encodes CPSF30, a protein with a molecular weight of 30 kDa. The splicing of intron 2
enables the transcription of the full-length mRNA and the resulting protein has a size of 68 kDa
(Delaney et al. 2006). The larger protein version has been termed CPSF-YT521-B, due to the sequence
similarities of the C-terminal extension with the yeast splicing factor YT521-B (Delaney et al. 2006).
Fig. 13 Alternative polyadenylation at the CPSF30 (At1g30460) locus (from Zhang et al. 2008). The CPSF30 gene contains 7 exons (boxes) and 6 introns (horizontal lines), encoding two alternatively polyadenylated mRNAs. Usage of the proximal polyadenylation site in intron 2 leads to the mRNA form “1” which encodes the active CPSF30 protein. CPSF30 has a molecular weight of ~30 kDa, and has Calmodulin/calcium-dependent RNA-binding activity. If intron 2 is spliced out, the full-length mRNA “2” is transcribed. The full-length protein, which is ~68 kDa large, lacks the last 13 C-terminal amino acids of CPSF30 (white box) and is termed CPSF30-YT521-B due to a large C-terminal domain (bright grey box) that shows sequence similarities to the human splicing factor YT521-B (Stoilov et al. 2002; Delaney et al. 2006). The T-DNA insertion site in oxt6, which is located 147 nt upstream of the start codon, is marked by a triangle.
CPSF30 is conserved among eukaryotes and its human and yeast counterparts are essential (Barabino
et al. 1997). In Arabidopsis, the disruption of CPSF30 affects genome-wide 3’ end processing. The
bulk mRNA polyadenylation is not altered in the oxt6 T-DNA mutant, but a large subset of genes is
alternatively polyadenylated, reflecting the function of CPSF in PAS selection (Zhang et al. 2008;
Thomas et al. 2012). The expression of several thioredoxin- and glutaredoxin-related genes is
upregulated in oxt6, which probably contributes to the observed stress-resistant phenotype (Zhang
et al. 2008). While the CPSF30 transcript is promoted by oxidative stress in the wild type, with a peak
at ten hours after the induction, the expression of the full-length CPSF-YT521-B transcript remains
unchanged. Accordingly, the introduction of the short CPSF30 transcript into the oxt6 mutant was
sufficient to restore the wild type phenotype under oxidative stress (Zhang et al. 2008). However,
with regard to both alternative polyadenylation and mRNA abundance, the large subset of genes
deregulated in oxt6 is not fully rescued in the absence of the full-length gene product (Zhang et al.
2008; Bruggeman et al. 2014). These findings indicate a functional significance of the large protein
CPSF-YT521-B in gene expression regulation.
Certain structural features potentially indicate that the RNA-binding protein CPSF30 might be directly
responsive to environmental cues (Hunt 2014). The C-terminal domain of the small protein exhibits
unspecific endonucleolytic activity in vitro (Addepalli and Hunt 2007). Due to a disulfide bridge in this

Introduction 39
region, the endonuclease function is inhibited by the sulfhydryl reagent dithiothreitol (DTT), but is
not disturbed by the presence of reduced or oxidised glutathione (Addepalli and Hunt 2008). The
functional significance of this protein feature in vivo remains to be elucidated.
Intriguingly, CPSF30 can also bind calmodulin. In the presence of calmodulin and calcium, the RNA-
binding capacity of CPSF30 is abolished (Delaney et al. 2006). Calmodulin is a conserved calcium-
sensor that is for example involved in the plant immune response (e.g. Perochon et al. 2011; Cheval
et al. 2013). Thus, CPSF30 provides a link between environmental influences, intracellular ROS and
calcium levels and alternative polyadenylation (Xing and Li 2011). Indeed, similar to calmodulin,
CPSF30 is required for the salicylic-acid mediated plant immune response (Cheval et al. 2013;
Bruggeman et al. 2014). Consequently, the oxt6 mutant is more susceptible to Pseudomonas
syringae infections than Col-0 (Bruggeman et al. 2014). Interestingly, CPSF30 was not found to
control the redox state of the intracellular glutathione pool.
In mammals it was shown that regulatory proteins can inhibit the complete polyadenylation complex
by binding CPSF30. When the viral protein NS1 targets CPSF30 in influenza-virus infected cells, host
mRNAs are not polyadenylated anymore and remain in the nucleus (Nemeroff et al. 1998). As a
consequence, host gene expression is disrupted, while viral RNAs can still leave the nucleus. A
different CPSF subunit, the human protein CPSF73, moves to the cytoplasm upon interaction with the
ROS-responsive protein CSR1 (cellular stress response 1), which results in cell death (Han et al. 1998;
Zhu et al. 2009). While CSR1 is an essential protein in Arabidopsis, the stress-induced translocation
mechanism of CPSF73 has not been analysed in plants yet (Manabe et al. 2007). However,
overexpressed CPSF30 has been detected in the cytoplasm of Arabidopsis cell cultures, indicating
that CPSF subunits may not exclusively be located in the nucleus (Rao et al. 2009).
Clearly, similar regulatory mechanisms are likely to affect the activity and location of the remaining
polyadenylation factor components as well. The example of CPSF30 provides a mechanistic link
between oxidative stress and gene expression regulation. Likewise, 3’ end processing might play
essential roles in the regulation of other stress responses.
Introduction 40
1.4 Aim
To further investigate the regulatory potential of polyadenylation-controlled gene expression in
Arabidopsis, the distinct functions of AtPAPS1 and the two cPAPs AtPAPS2 and AtPAPS4 were
characterized in detail in this thesis. Both PAPS2 and PAPS4 (in the following also termed PAPS2/4)
share considerable amino acid sequence similarities, suggesting functional redundancy. Conclusions
on the functional specificities of PAPS1 and PAPS2/4 were drawn from contrasting flowering time
defects observed in different paps mutants. To identify the pathway disrupted in paps mutants,
flowering times were determined under diverse growth conditions. Additionally, expression levels of
key factors regulating flowering in paps mutants were analysed. In a different approach, paps
mutations were combined with mutant alleles of flowering time factors, namely autonomous
pathway components. The analysis aimed to reveal epistatic relationships and to further characterize
the putative role of cPAPs in flowering time control.
To uncover additional PAPS2/4 functions, a comparative analysis of PAPS expression was performed.
Since PAPS1 has been shown to be required for the mediation of biotic stress responses before (Trost
et al. 2014), the paps mutant behaviour during a set of various short- and long-term stress exposures
was analysed. An involvement of the polyadenylation factor CPSF30 in the regulation of oxidative
stress has been described (Zhang et al. 2008). The relation of AtPAPSs and CPSF30 was tested by
combining paps mutant alleles with the oxt6 mutation. The response of paps single mutants and of
the resulting paps oxt6 mutants to oxidative stress was examined.
The transcriptome of paps2 paps4 double mutant seedling was analysed and compared with the
paps1 transcriptome to uncover putative PAPS-specific target genes and to confirm the regulatory
role of PAPS2/4 in the response to various stresses.
Lastly, the PAPS1 and PAPS4 proteins were fused to yellow fluorescent protein (YFP) to confirm the
nuclear localisation of PAPS proteins by microscopy and to gain the opportunity of validating
alterations in PAPS abundances during certain growth conditions.

Material and methods 41
2. Material and Methods
2.1 Material
2.1.1 Chemicals
Chemicals were purchased from AppliChem (Darmstadt), Biozym Scientific GmbH (Hessisch
Oldendorf), Difco (Detroit, USA), Duchefa Biochemie (Haarlem, The Netherlands), Frontier Scientific
(Logan, USA), Lehle Seeds (Round Rock, USA), Merck (Darmstadt), Roche Diagnostics (Grenzach),
Roth (Karlsruhe), Serva (Heidelberg), Sigma-Aldrich (St. Louis, USA), Thermo Fisher Scientific
(Waltham, MA, USA) and VWR chemicals (Radnor, USA). Companies are based in Germany, if not
indicated otherwise.
2.1.2 Technical equipment The technical equipment is listed in Appendix A.
2.1.3 Disposable equipment The disposable equipment is listed in Appendix B.
2.1.4 Microorganisms The bacterial Escherichia coli (E. coli) strain XL-1 (Agilent Technologies/Stratagene, Santa Clara, USA)
was used for vector amplification. The strain XL-1 can be selected by tetracyclin. The Agrobacterium
tumefaciens strain GV3101 (Van Larebeke et al. 1974), which served to stably transform Arabidopsis,
is resistant to gentamycin and rifampicin.
2.1.5 Enzymes and antibodies Enzymes, like restriction endonucleases, polymerases etc. were purchased from Abchem (Cambridge,
UK), Affymetrix (Santa Clara, CA, USA), Ambion/Life Technologies (Warrington, UK), Bioline Reagents
(London, UK), Fermentas (St. Leon-Rot), Life Technologies (Carlsbad, CA, USA), New England Biolabs
(NEB; Frankfurt am Main), Promega (Fitchburg, WI, USA), Qiagen (Surrey, UK) and Stratagene (Santa
Clara, MO, USA) as indicated in the respective method chapter.
2.1.6 Plant materials
The Arabidopsis thaliana (L.) Heynh. ecotypes Landsberg erecta (Ler) or Columbia-0 (Col-0) were used
in all experiments. Plant mutants used in this work are summarized in Table 2.
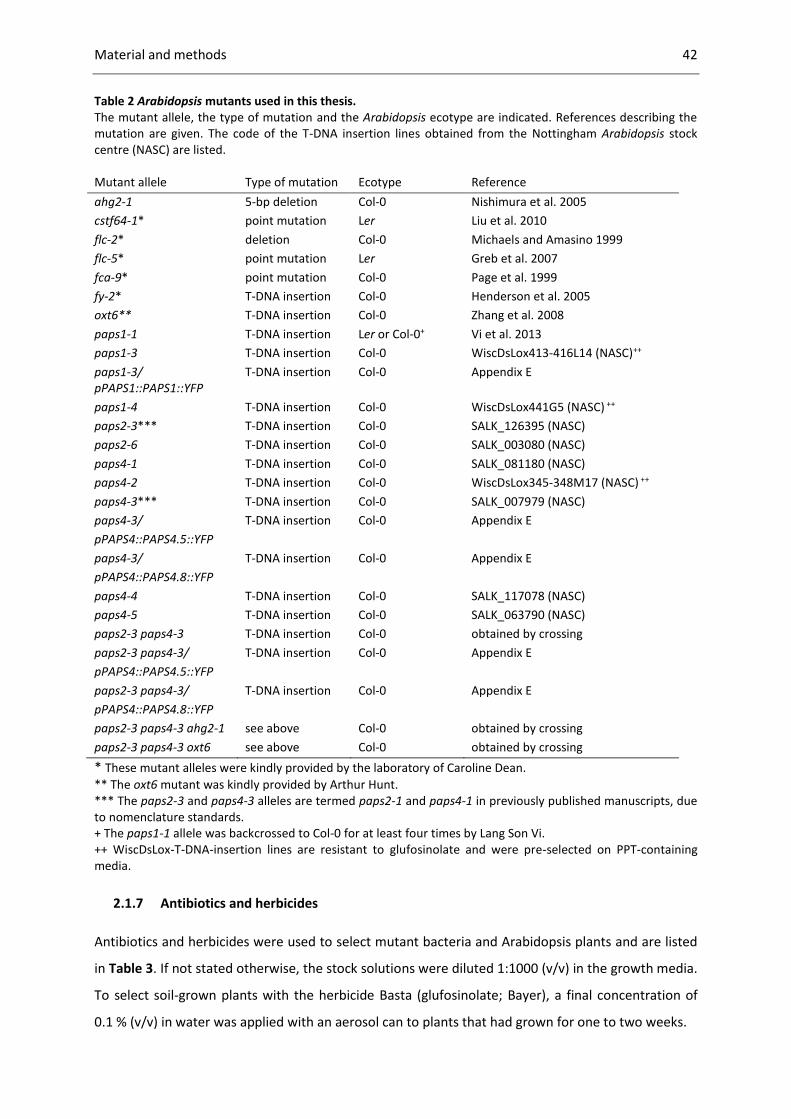
Material and methods 42
Table 2 Arabidopsis mutants used in this thesis. The mutant allele, the type of mutation and the Arabidopsis ecotype are indicated. References describing the mutation are given. The code of the T-DNA insertion lines obtained from the Nottingham Arabidopsis stock centre (NASC) are listed. Mutant allele Type of mutation Ecotype Reference
ahg2-1 5-bp deletion Col-0 Nishimura et al. 2005
cstf64-1* point mutation Ler Liu et al. 2010
flc-2* deletion Col-0 Michaels and Amasino 1999
flc-5* point mutation Ler Greb et al. 2007
fca-9* point mutation Col-0 Page et al. 1999
fy-2* T-DNA insertion Col-0 Henderson et al. 2005
oxt6** T-DNA insertion Col-0 Zhang et al. 2008
paps1-1 T-DNA insertion Ler or Col-0+ Vi et al. 2013
paps1-3 T-DNA insertion Col-0 WiscDsLox413-416L14 (NASC)++
paps1-3/ pPAPS1::PAPS1::YFP
T-DNA insertion Col-0 Appendix E
paps1-4 T-DNA insertion Col-0 WiscDsLox441G5 (NASC) ++
paps2-3*** T-DNA insertion Col-0 SALK_126395 (NASC)
paps2-6 T-DNA insertion Col-0 SALK_003080 (NASC)
paps4-1 T-DNA insertion Col-0 SALK_081180 (NASC)
paps4-2 T-DNA insertion Col-0 WiscDsLox345-348M17 (NASC) ++
paps4-3*** T-DNA insertion Col-0 SALK_007979 (NASC)
paps4-3/
pPAPS4::PAPS4.5::YFP
T-DNA insertion Col-0 Appendix E
paps4-3/
pPAPS4::PAPS4.8::YFP
T-DNA insertion Col-0 Appendix E
paps4-4 T-DNA insertion Col-0 SALK_117078 (NASC)
paps4-5 T-DNA insertion Col-0 SALK_063790 (NASC)
paps2-3 paps4-3 T-DNA insertion Col-0 obtained by crossing
paps2-3 paps4-3/
pPAPS4::PAPS4.5::YFP
T-DNA insertion Col-0 Appendix E
paps2-3 paps4-3/
pPAPS4::PAPS4.8::YFP
T-DNA insertion Col-0 Appendix E
paps2-3 paps4-3 ahg2-1 see above Col-0 obtained by crossing
paps2-3 paps4-3 oxt6 see above Col-0 obtained by crossing
* These mutant alleles were kindly provided by the laboratory of Caroline Dean.
** The oxt6 mutant was kindly provided by Arthur Hunt. *** The paps2-3 and paps4-3 alleles are termed paps2-1 and paps4-1 in previously published manuscripts, due to nomenclature standards. + The paps1-1 allele was backcrossed to Col-0 for at least four times by Lang Son Vi. ++ WiscDsLox-T-DNA-insertion lines are resistant to glufosinolate and were pre-selected on PPT-containing media.
2.1.7 Antibiotics and herbicides
Antibiotics and herbicides were used to select mutant bacteria and Arabidopsis plants and are listed
in Table 3. If not stated otherwise, the stock solutions were diluted 1:1000 (v/v) in the growth media.
To select soil-grown plants with the herbicide Basta (glufosinolate; Bayer), a final concentration of
0.1 % (v/v) in water was applied with an aerosol can to plants that had grown for one to two weeks.
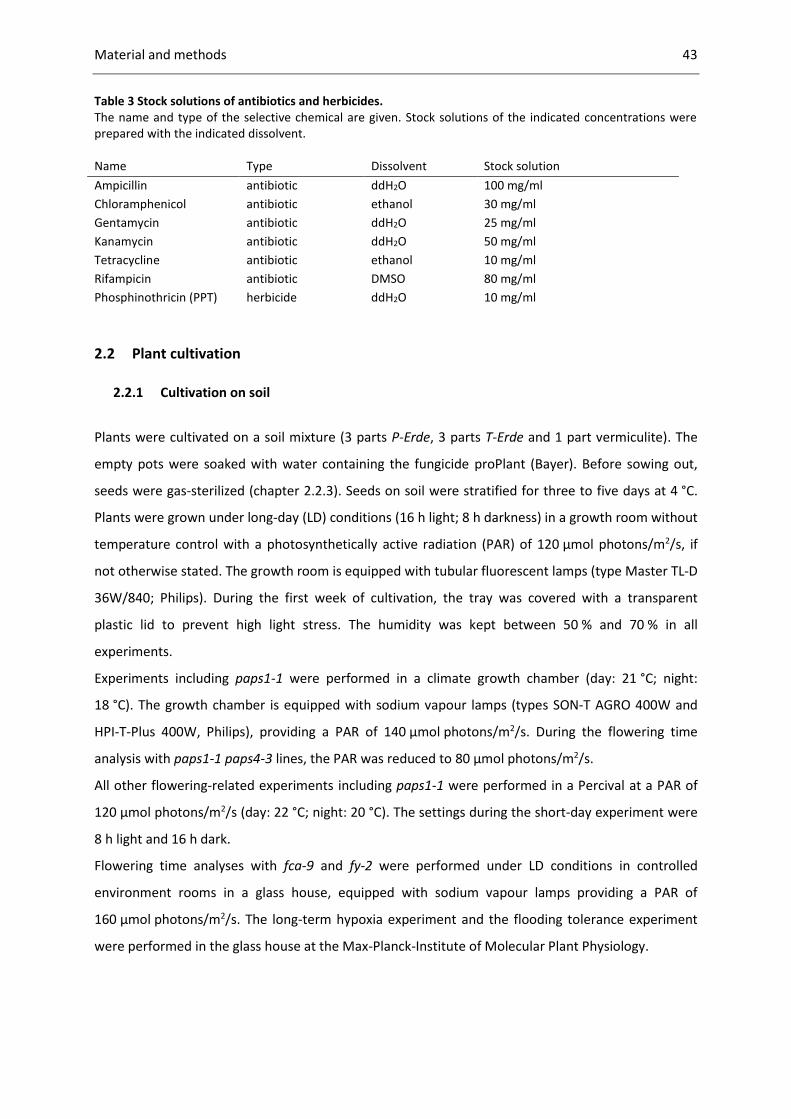
Material and methods 43
Table 3 Stock solutions of antibiotics and herbicides. The name and type of the selective chemical are given. Stock solutions of the indicated concentrations were prepared with the indicated dissolvent. Name Type Dissolvent Stock solution
Ampicillin antibiotic ddH2O 100 mg/ml
Chloramphenicol antibiotic ethanol 30 mg/ml
Gentamycin antibiotic ddH2O 25 mg/ml
Kanamycin antibiotic ddH2O 50 mg/ml
Tetracycline antibiotic ethanol 10 mg/ml
Rifampicin antibiotic DMSO 80 mg/ml
Phosphinothricin (PPT) herbicide ddH2O 10 mg/ml
2.2 Plant cultivation
2.2.1 Cultivation on soil
Plants were cultivated on a soil mixture (3 parts P-Erde, 3 parts T-Erde and 1 part vermiculite). The
empty pots were soaked with water containing the fungicide proPlant (Bayer). Before sowing out,
seeds were gas-sterilized (chapter 2.2.3). Seeds on soil were stratified for three to five days at 4 °C.
Plants were grown under long-day (LD) conditions (16 h light; 8 h darkness) in a growth room without
temperature control with a photosynthetically active radiation (PAR) of 120 µmol photons/m2/s, if
not otherwise stated. The growth room is equipped with tubular fluorescent lamps (type Master TL-D
36W/840; Philips). During the first week of cultivation, the tray was covered with a transparent
plastic lid to prevent high light stress. The humidity was kept between 50 % and 70 % in all
experiments.
Experiments including paps1-1 were performed in a climate growth chamber (day: 21 °C; night:
18 °C). The growth chamber is equipped with sodium vapour lamps (types SON-T AGRO 400W and
HPI-T-Plus 400W, Philips), providing a PAR of 140 µmol photons/m2/s. During the flowering time
analysis with paps1-1 paps4-3 lines, the PAR was reduced to 80 µmol photons/m2/s.
All other flowering-related experiments including paps1-1 were performed in a Percival at a PAR of
120 µmol photons/m2/s (day: 22 °C; night: 20 °C). The settings during the short-day experiment were
8 h light and 16 h dark.
Flowering time analyses with fca-9 and fy-2 were performed under LD conditions in controlled
environment rooms in a glass house, equipped with sodium vapour lamps providing a PAR of
160 µmol photons/m2/s. The long-term hypoxia experiment and the flooding tolerance experiment
were performed in the glass house at the Max-Planck-Institute of Molecular Plant Physiology.

Material and methods 44
2.2.2 Cultivation on plates
To cultivate seedlings under sterile conditions, seeds were wet-sterilized using the protocol
described in chapter 2.2.4. Sterile seeds were sown out on 0.5× MS medium (Murashige and Skoog,
Duchefa Biochemie; pH 5.8 with KOH, 7 g/l agar) in 100 × 100 mm plates or in plates with 100 mm Ø.
Sugar (1 % w/v sucrose) was added to the solid media as indicated in the respective method chapter.
Plates were sealed with breathable tape.
The plates were stratified and cultivated as described in chapter 2.2.1 or as indicated. In the growth
room without temperature control, plates were irradiated by light-emitting diodes (LED) with a PAR
of 120 µmol photons/m2/s. In the climate growth chamber (day: 21 °C; night: 18 °C), plates were
irradiated by sodium vapour lamps with a PAR of 120 µmol photons/m2/s (lamp type see chapter
2.2.1). The oxidative stress experiment was performed in a Percival (day: 22 °C, night: 20 °C;
120 µmol photons/m2/s).
2.2.3 Seed sterilization with chlorine gas
A small amount of seeds was transferred to a 1.5-ml tube and placed into a vacuum exsiccator. Next,
50 ml of sodium hypochlorite (12 %) was mixed with 1.5 ml concentrated hydrochloric acid (37 %) in
a glass beaker. The beaker was transferred to the exsiccator immediately which was sealed with
Parafilm for four hours. After that, the seeds were aerated overnight (O/N) to allow gas to evaporate.
2.2.4 Seed sterilization with sodium hypochlorite
Seeds were transferred to reaction tubes and the sterilization was performed in a clean bench. Seeds
were soaked once in 1 ml 70 % (v/v) ethanol. Next, the seeds were incubated in 6 % (v/v) sodium
hypochlorite (12 % solution mixed 1:2 with sterile ddH2O). Subsequently, seeds were washed three
times with 100 % ethanol and were transferred to a sterile filter paper with a sterile cut off tip to let
the ethanol evaporate. The dry seeds were transferred back to the tube.
2.3 Cultivation of microorganisms
2.3.1 Growth media and bacteria cultivation
E. coli and A. tumefaciens were cultivated on solid LB medium in cell culture dishes (100 mm Ø).
Liquid cultures were grown in sterile test tubes filled with 4 ml LB medium or flasks filled with 1/5
volume (vol) medium. Antibiotics were added to media in dependence of the used strains and
vectors at the concentrations indicated in chapter 2.1.7. To amplify bacteria, both cell culture dishes
and liquid cultures were incubated at 37 °C O/N.
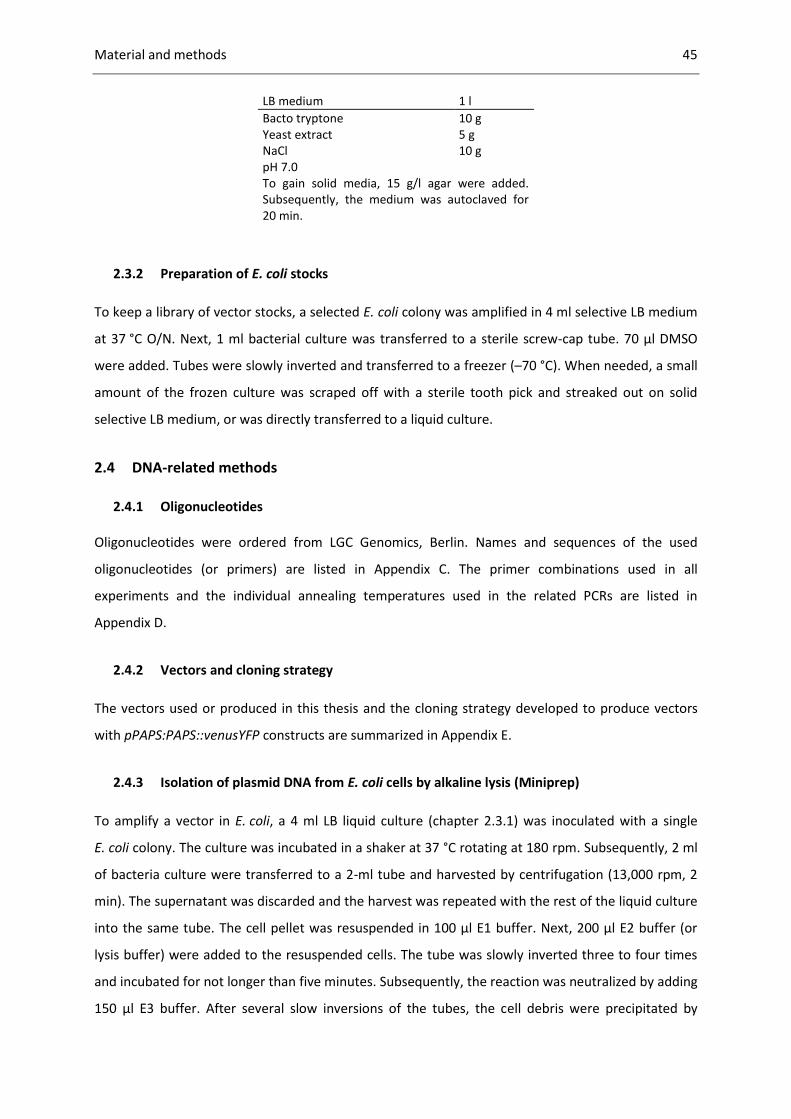
Material and methods 45
LB medium 1 l
Bacto tryptone 10 g Yeast extract 5 g NaCl 10 g pH 7.0 To gain solid media, 15 g/l agar were added. Subsequently, the medium was autoclaved for 20 min.
2.3.2 Preparation of E. coli stocks
To keep a library of vector stocks, a selected E. coli colony was amplified in 4 ml selective LB medium
at 37 °C O/N. Next, 1 ml bacterial culture was transferred to a sterile screw-cap tube. 70 µl DMSO
were added. Tubes were slowly inverted and transferred to a freezer (–70 °C). When needed, a small
amount of the frozen culture was scraped off with a sterile tooth pick and streaked out on solid
selective LB medium, or was directly transferred to a liquid culture.
2.4 DNA-related methods
2.4.1 Oligonucleotides Oligonucleotides were ordered from LGC Genomics, Berlin. Names and sequences of the used
oligonucleotides (or primers) are listed in Appendix C. The primer combinations used in all
experiments and the individual annealing temperatures used in the related PCRs are listed in
Appendix D.
2.4.2 Vectors and cloning strategy
The vectors used or produced in this thesis and the cloning strategy developed to produce vectors
with pPAPS:PAPS::venusYFP constructs are summarized in Appendix E.
2.4.3 Isolation of plasmid DNA from E. coli cells by alkaline lysis (Miniprep)
To amplify a vector in E. coli, a 4 ml LB liquid culture (chapter 2.3.1) was inoculated with a single
E. coli colony. The culture was incubated in a shaker at 37 °C rotating at 180 rpm. Subsequently, 2 ml
of bacteria culture were transferred to a 2-ml tube and harvested by centrifugation (13,000 rpm, 2
min). The supernatant was discarded and the harvest was repeated with the rest of the liquid culture
into the same tube. The cell pellet was resuspended in 100 µl E1 buffer. Next, 200 µl E2 buffer (or
lysis buffer) were added to the resuspended cells. The tube was slowly inverted three to four times
and incubated for not longer than five minutes. Subsequently, the reaction was neutralized by adding
150 µl E3 buffer. After several slow inversions of the tubes, the cell debris were precipitated by

Material and methods 46
centrifugation (13,000 rpm; 10 min; 4 °C). The supernatant was carefully transferred to a new 1.5-ml
tube and 0.7 vol isopropanol were added. The tube was inverted to mix plasmid solution and alcohol,
and the plasmid was harvested by centrifugation (13,000 rpm; 10 min; 4 °C). The pellet was washed
with 70 % (v/v) ethanol and after harvesting the plasmid again by centrifugation (13,000 rpm; 5 min;
4 °C). The pellet was air-dried and subsequently dissolved in 50 µl ddH2O.
E1 buffer E2 buffer
50 mM Tris-HCl (pH 8.0) 0.2 M NaOH
10 mM EDTA 1 % (w/v) SDS
0.1 mg/ml RNase A (NEB)
E3 buffer
3.1 M sodium acetate (pH 5.5)
2.4.4 Isolation of plasmid DNA from E. coli cells by alkaline lysis (Midiprep)
To amplify low-copy vectors like pBarMAP, a large scale plasmid preparation, known as midiprep,
was performed. The buffer compositions are given in chapter 2.4.3.
A 50 ml selective LB liquid culture was inoculated with a single E. coli colony and incubated O/N at
37 °C in a shaker (200 rpm). The culture was centrifuged in a sterile 50 ml tube to harvest the cells
(7,500 rpm; 3 min; Beckman centrifuge, rotor type JLA 16.250). Having carefully discarded the
supernatant, the pellet was resuspended in 5 ml E1 buffer. To lyse the cells, 5 ml E2 buffer were
added and the tube was inverted carefully several times. Next, 7 ml E3 buffer were added, the tube
was inverted and the solution was centrifuged (10,000 rpm; 10 min). The supernatant was carefully
transferred to a new 50 ml tube and 1 vol isopropanol (about 17 ml) were added. The plasmid was
precipitated by centrifugation (10,000 rpm; 15 min), washed with 5 ml 70 % (v/v) ethanol and
harvested again (10,000 rpm; 5 min). Finally, the pellet was dissolved in TE buffer (including
0.1 mg/ml RNase A).
Prior to the experiment, an RNase A stock solution was prepared by dissolving 10 mg RNase A (NEB)
in 1 ml 0.01 M sodium acetate. The solution was incubated for 20 min at 99 °C in a 1.5-ml safe-lock
tube and let slowly cool down to room temperature (RT). After that, 0.1 vol (i.e. 100 µl) 1 M Tris-HCl
(pH 7.2) was added to the solution. 100 µl of this RNase A stock solution were added to 100 ml of 1 ×
TE.
1× TE
10 mM Tris
1 mM EDTA
adjust pH to 8.0 with HCl
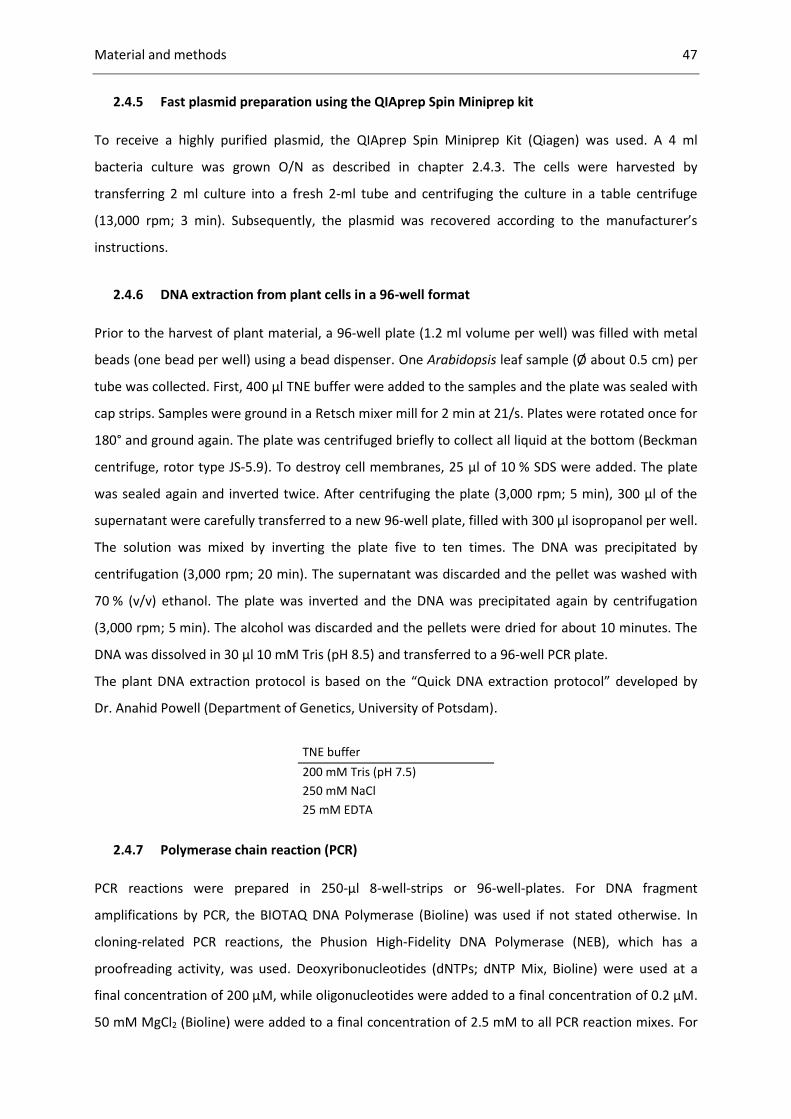
Material and methods 47
2.4.5 Fast plasmid preparation using the QIAprep Spin Miniprep kit
To receive a highly purified plasmid, the QIAprep Spin Miniprep Kit (Qiagen) was used. A 4 ml
bacteria culture was grown O/N as described in chapter 2.4.3. The cells were harvested by
transferring 2 ml culture into a fresh 2-ml tube and centrifuging the culture in a table centrifuge
(13,000 rpm; 3 min). Subsequently, the plasmid was recovered according to the manufacturer’s
instructions.
2.4.6 DNA extraction from plant cells in a 96-well format
Prior to the harvest of plant material, a 96-well plate (1.2 ml volume per well) was filled with metal
beads (one bead per well) using a bead dispenser. One Arabidopsis leaf sample (Ø about 0.5 cm) per
tube was collected. First, 400 µl TNE buffer were added to the samples and the plate was sealed with
cap strips. Samples were ground in a Retsch mixer mill for 2 min at 21/s. Plates were rotated once for
180° and ground again. The plate was centrifuged briefly to collect all liquid at the bottom (Beckman
centrifuge, rotor type JS-5.9). To destroy cell membranes, 25 µl of 10 % SDS were added. The plate
was sealed again and inverted twice. After centrifuging the plate (3,000 rpm; 5 min), 300 µl of the
supernatant were carefully transferred to a new 96-well plate, filled with 300 µl isopropanol per well.
The solution was mixed by inverting the plate five to ten times. The DNA was precipitated by
centrifugation (3,000 rpm; 20 min). The supernatant was discarded and the pellet was washed with
70 % (v/v) ethanol. The plate was inverted and the DNA was precipitated again by centrifugation
(3,000 rpm; 5 min). The alcohol was discarded and the pellets were dried for about 10 minutes. The
DNA was dissolved in 30 µl 10 mM Tris (pH 8.5) and transferred to a 96-well PCR plate.
The plant DNA extraction protocol is based on the “Quick DNA extraction protocol” developed by
Dr. Anahid Powell (Department of Genetics, University of Potsdam).
TNE buffer
200 mM Tris (pH 7.5)
250 mM NaCl
25 mM EDTA
2.4.7 Polymerase chain reaction (PCR)
PCR reactions were prepared in 250-µl 8-well-strips or 96-well-plates. For DNA fragment
amplifications by PCR, the BIOTAQ DNA Polymerase (Bioline) was used if not stated otherwise. In
cloning-related PCR reactions, the Phusion High-Fidelity DNA Polymerase (NEB), which has a
proofreading activity, was used. Deoxyribonucleotides (dNTPs; dNTP Mix, Bioline) were used at a
final concentration of 200 µM, while oligonucleotides were added to a final concentration of 0.2 µM.
50 mM MgCl2 (Bioline) were added to a final concentration of 2.5 mM to all PCR reaction mixes. For

Material and methods 48
standard reactions, PCR reactions of a 20 µl volume were set up. If the PCR product had to be
purified by gel extraction, e.g. for cloning purposes, a 50-µl PCR reaction was set up.
DNA denaturation temperatures were adjusted to the polymerase according to manufacturer’s
instructions. Annealing temperatures are listed in Appendix D. The elongation temperature was 72 °C
Elongation times were adjusted to the length of the PCR product, based on an amplification rate of
1000 kb/min. Cycle numbers were adjusted to the purpose of the experiment and the efficiency of
the individual PCR reactions achieved with specific primer combinations.
A positive control and a negative control (ddH2O) were added in every PCR reaction.
2.4.8 Colony PCR
Prior to a plasmid preparation or a plant transformation, bacteria colonies were tested for the
presence of a vector by colony PCR.
A small amount of an E. coli colony was picked and dissolved in 50 µl of ddH2O. As template in a
standard PCR reaction, 1 µl of the bacteria solution was used.
Agrobacterium tumefaciens cells have to be destroyed more stringently. Small amounts of individual
colonies were dissolved in 10 µl of 20 mM NaOH. The bacteria solution was incubated at 37 °C for 5
min to disrupt the cell walls. The sample was briefly centrifuged and 1 µl of the supernatant was used
as template in a standard PCR reaction (chapter 2.4.7).
As a positive control, 1 µl of a 1:1000 dilution of the respective vector was used as a PCR template.
PCR products were analysed by agarose gel electrophoresis (chapter 2.4.13). Subsequently, the
remaining E. coli solution of positively tested clones could be used to inoculate an LB liquid culture in
preparation for a plasmid preparation (chapter 2.4.3).
2.4.9 Fusion of DNA fragments by PCR
The fusion of two PCR products served to synthesize a large fragment with novel features that should
be cloned into a certain vector later. The two templates to be fused had been amplified by PCR
before. The 3’ end of PCR product 1 and the 5’ end of PCR product 2 were overlapping. 20 ng of each
PCR product served as templates in a 50-µl fusion PCR reaction using the Phusion High-Fidelity DNA
Polymerase (NEB). Oligonucleotides binding the ends of the resulting full-length fusion PCR product
were added. During the first PCR cycles the single strands of template 1 and 2 assembled via their
complementary ends. The 3’ ends of the overlapping single strands were extended. The resulting full-
length fusion transcript served as template in the following amplification rounds. A high cycle
number was chosen since the efficiency of the PCR is low in the beginning. The resulting PCR product
was purified via an agarose gel (chapter 2.4.14).
Material and methods 49
2.4.10 Genotyping of Arabidopsis by PCR
Arabidopsis mutant alleles containing T-DNA insertions or insertion/deletion mutations were
discriminated from the wild type alleles based on the different product sizes obtained by PCR. Alleles
including single nucleotide polymorphisms were analysed by PCR combined with a subsequent
restriction endonuclease digest (chapter 2.4.18).
Standard PCR reactions were performed (chapter 2.4.7) using 1 µl of Arabidopsis DNA (chapter 2.4.6)
as template. The oligonucleotide combinations are listed in Appendix D. DNA samples of wild type
and mutant control DNAs served as positive controls.
A modification of the standard protocol was applied when segregating T-DNA insertion lines were
genotyped. To amplify the mutant and the wild type (WT) alleles simultaneously, three primers were
added to the mix. Both the T-DNA-specific and the WT-allele-specific right-border primer were added
to a final concentration of 0.1 µM. The final concentration of the gene-specific left-border primer,
that serves to amplify both the mutant and the WT allele, was 0.2 µM.
PCR products were directly analysed by agarose gel electrophoresis (chapter 2.4.13). Alternatively, a
restriction endonuclease digest was performed following the PCR reaction (chapter 2.4.18).
2.4.11 Genotyping of Arabidopsis by KASP
The KBiosciences Competitive Allele-Specific PCR (KASP) assay was applied to discriminate paps1-1
and ahg2-1 mutant alleles from WT alleles in segregating populations. Both nucleotide
polymorphisms could not reliably be discriminated by standard PCR-based assays. With the KASP
technique, two alleles are simultaneously amplified using specific fluorescent primers. The
fluorescent PCR-products can then be quantified and conclusions can be drawn to the plant
genotypes. A prerequisite for the assay is a sufficient amount of control samples.
The gene-specific oligonucleotide mixes were ordered from KBiosciences (Hoddesdon, Herts, UK).
The KASP reaction mix was ordered from LGC Genomics (Berlin). To genotype segregating plant
populations, 1 µl Arabidopsis DNA (chapter 2.4.6) was mixed with 5 µl 2× KASP reaction mix and
0.06 µl gene-specific KASP primer mix in a total volume of 10 µl. For the setup, 384-well qPCR plates
were used. The PCR reaction was run in a LightCycler 480 II (LC480; Roche) according to the
manufacturer’s instructions. Results were analysed with the LC480 software (version SW 1.5.0, 2011;
tool Endpoint genotyping).
2.4.12 Quantitative real-time PCR (qPCR)
To compare relative transcript abundances in Arabidopsis plant material, the quantitative real-time
polymerase chain reaction (qPCR or qRT-PCR) was performed. The qPCR method also served to
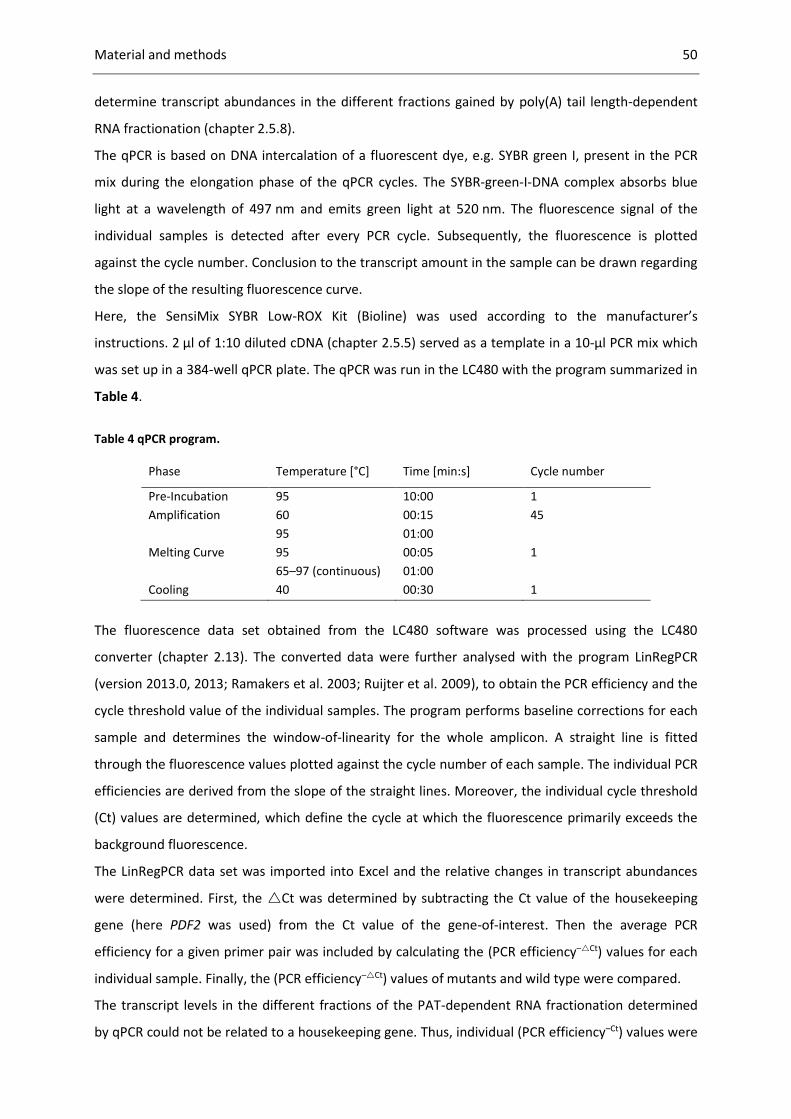
Material and methods 50
determine transcript abundances in the different fractions gained by poly(A) tail length-dependent
RNA fractionation (chapter 2.5.8).
The qPCR is based on DNA intercalation of a fluorescent dye, e.g. SYBR green I, present in the PCR
mix during the elongation phase of the qPCR cycles. The SYBR-green-I-DNA complex absorbs blue
light at a wavelength of 497 nm and emits green light at 520 nm. The fluorescence signal of the
individual samples is detected after every PCR cycle. Subsequently, the fluorescence is plotted
against the cycle number. Conclusion to the transcript amount in the sample can be drawn regarding
the slope of the resulting fluorescence curve.
Here, the SensiMix SYBR Low-ROX Kit (Bioline) was used according to the manufacturer’s
instructions. 2 µl of 1:10 diluted cDNA (chapter 2.5.5) served as a template in a 10-µl PCR mix which
was set up in a 384-well qPCR plate. The qPCR was run in the LC480 with the program summarized in
Table 4.
Table 4 qPCR program.
Phase Temperature [°C] Time [min:s] Cycle number
Pre-Incubation 95 10:00 1
Amplification 60 00:15 45
95 01:00
Melting Curve 95
65–97 (continuous)
00:05
01:00
1
Cooling 40 00:30 1
The fluorescence data set obtained from the LC480 software was processed using the LC480
converter (chapter 2.13). The converted data were further analysed with the program LinRegPCR
(version 2013.0, 2013; Ramakers et al. 2003; Ruijter et al. 2009), to obtain the PCR efficiency and the
cycle threshold value of the individual samples. The program performs baseline corrections for each
sample and determines the window-of-linearity for the whole amplicon. A straight line is fitted
through the fluorescence values plotted against the cycle number of each sample. The individual PCR
efficiencies are derived from the slope of the straight lines. Moreover, the individual cycle threshold
(Ct) values are determined, which define the cycle at which the fluorescence primarily exceeds the
background fluorescence.
The LinRegPCR data set was imported into Excel and the relative changes in transcript abundances
were determined. First, the Ct was determined by subtracting the Ct value of the housekeeping
gene (here PDF2 was used) from the Ct value of the gene-of-interest. Then the average PCR
efficiency for a given primer pair was included by calculating the (PCR efficiency–Ct) values for each
individual sample. Finally, the (PCR efficiency–Ct) values of mutants and wild type were compared.
The transcript levels in the different fractions of the PAT-dependent RNA fractionation determined
by qPCR could not be related to a housekeeping gene. Thus, individual (PCR efficiency–Ct) values were
Material and methods 51
determined for the gene-of-interest in both WT and mutant and these values were compared to the
abundances of the in-vitro transcribed control RNAs.
2.4.13 Agarose gel electrophoresis
The agarose gel electrophoresis was used to check the outcome of a PCR analysis, to separate DNA
fragments of different sizes or to purify DNA fragments.
Horizontal gels containing 0.8–4 % (w/v) agarose were prepared by dissolving the appropriate
amount of agarose in 50 ml, 100 ml or 400 ml 1× TAE buffer. The gel volume depended on the used
agarose chamber which in turn dependent on the number of samples to be analysed. The agarose
was completely dissolved in the buffer by heating in a microwave oven. When the liquid had cooled
down to about 50 °C, ethidium bromide (3 µl/100 ml) was added. The liquid gel was mixed well and
poured into the respective tray. DNA loading dye was added to the sample to visualize a dye front.
An appropriate DNA marker was selected according to the expected fragment size (HyperLadder,
Bioline). Gels were run in 1× TAE buffer at a voltage of 10 V/cm. Subsequently, DNA fragments were
visualized and documented using a UV-transilluminator.
50× TAE DNA loading dye
40 mM Tris base 30 % (w/v) sucrose
40 mM acetic acid 0.2 % (w/v) cresol red
1 mM EDTA 0.3 % (w/v) tartrazine
The solution was autoclaved for 20 min.
2.4.14 Purification of DNA fragments
PCR fragments and vectors to be sent to sequencing analyses were purified using the QIAquick PCR
Purification Kit (Qiagen) according to the manufacturer’s instructions.
2.4.15 Gel purification of DNA fragments
To purify DNA fragments from a fragment mix, an agarose gel electrophoresis was performed using
low melting agarose (Biozym) (chapter 2.4.13). Next, the DNA fragment of the expected size was
purified from the gel using the QIAquick Gel Extraction Kit (Qiagen) according to the manufacturer’s
instructions. Before the purified fragments were used for further experiments, an aliquot of the
sample was tested for purity in a further agarose gel electrophoresis.
2.4.16 Determination of nucleic acid concentrations
Concentrations of DNA and RNA samples were determined using the Pico100 µl Spectrophotometer
system.

Material and methods 52
2.4.17 Restriction digest of plasmid DNA
Vectors were digested with restriction endonucleases to analyse the result of a ligation reaction
(chapter 2.4.20) or for cloning purposes (Appendix E). Restriction endonucleases were ordered from
Bioline and were used according to the manufacturer’s instructions. In an analytical setup, 1–2 µg
plasmid DNA were digested in a 20-µl reaction mix for 2 h or O/N. Up to 8 µg plasmid DNA were
digested O/N in a preparative restriction digest. The reaction volume was increased accordingly.
Subsequently, the fragments were analysed by agarose gel electrophoresis (chapter 2.4.13). If the
fragments had to be purified via the agarose gel, the whole restriction digest mix was loaded onto
the gel (chapter 2.4.15).
2.4.18 Restriction digest to identify Arabidopsis by CAPS analysis
To identify specific point mutant alleles in segregating plant populations, the Cleaved Amplified
Polymorphic Sequences (CAPS) method was applied. Single-nucleotide polymorphisms or insertion/
deletion mutations may create or abolish recognition sites of restriction endonucleases. First, the
sequence surrounding the polymorphism is amplified by PCR. Subsequently, WT and mutant alleles
can be discriminated by restriction fragment length polymorphism analysis. Alternatively, derived
CAPS markers can be gained using mismatch primers to create a restriction site.
Genes identified by CAPS analysis can be found in Appendix D. Arabidopsis DNA was used as
template in a gene specific PCR using a 20-µl reaction volume (chapter 2.4.10). The complete PCR
reaction mix was subsequently digested by adding a 10 µl restriction enzyme mix to the sample. The
restriction enzymes were ordered from Bioline and both mix and incubation conditions were
adjusted according to the manufacturer’s instructions. The resulting fragments were analysed by
agarose gel electrophoresis (chapter 2.4.13). In dependence of the expected fragment sizes and the
PCR efficiency of the used primer pair, the gel concentration and the sample volume loaded onto the
gel were adjusted.
2.4.19 Dephosphorylation of linear plasmid DNA
Linearised vectors were dephosphorylated prior to a ligation reaction to avoid re-ligation of the
vector. The antarctic phosphatase (NEB) was used to dephosphorylate an aliquot of linearised vector
DNA according to the manufacturer’s instructions.
2.4.20 Ligation of DNA fragments
DNA fragments were usually purified by agarose gel electrophoresis prior to a ligation (chapter
2.4.15). The ligation was performed using the T4 DNA ligase (NEB). In a standard setup, 50 ng vector
Material and methods 53
DNA and 150–200 ng insert were ligated in a 10 µl reaction mix using 0.5 µl T4 ligase and 1 µl 10× T4
buffer. The reaction was incubated O/N at RT or at 10°C for up to three days. Subsequently, a 1–2 µl
aliquot of the ligation reaction was used to transform E. coli (chapter 2.7.2) and the rest was stored
at –20 °C.
To ligate DNA fragments into pGEM-T (Promega) a 3’ A-overhang at the insert is required. The
Phusion DNA Polymerase (NEB) produces blunt ends. Thus, A-tails were added to the PCR product to
be subcloned by adding 0.5 µl/10 µl of a housemade Taq polymerase producing 3’ overhangs. The
mix was incubated at 72 °C for 45 min followed by an agarose gel purification of the insert and a
standard ligation reaction as described above.
2.4.21 Sequencing
The sequencing of plasmids or PCR products was performed by LGC Genomics (Berlin). The resulting
sequences were analysed using the program Vector NTI (2.13).
2.5 RNA-related techniques
2.5.1 RNA extraction from Arabidopsis by phenol extraction (Mini hot phenol protocol)
Approximately 100–150 mg plant tissue (in 1.5-ml safe-lock tube) was frozen in liquid nitrogen.
Subsequently, a small amount of glass sand was added and the tissue was ground to a fine powder
using a homogenizer (Heidolph) or using mortar and pistil.
In preparation of the RNA extraction, fresh homogenisation buffer was prepared in a 50-ml tube and
heated to 60 °C. The complete RNA extraction was performed using RNase-free, autoclaved material
and filter-tips. Pipettes and the working space were cleaned with 6 % (v/v) bleach and ethanol.
First, 755 µl hot phenol mix were added to the ground plant tissue. The sample was mixed using a
vortex and incubated for 15 min at RT under continuous shaking. 250 µl chloroform were added and
the sample was shaken for further 15 min. A phase separation was induced by centrifugation (10
min; 13,000 rpm). The upper aqueous phase (about 550 µl) was transferred to a new 1.5-ml tube.
550 µl phenol:chloroform:isoamylalcohol (25:24:1) were added and the sample was shaken for 10
min at RT. The following steps were performed on ice. After centrifugation (10 min; 13,000 rpm), the
aqueous phase was transferred to a new tube. Consecutively, 50 µl of 3 M sodium acetate and 400 µl
isopropanol were added to the samples. After an incubation phase at –80 °C for 15 to 30 min and a
centrifugation (14,000 rpm; 30 min; 4 °C) the supernatant was completely removed. The remaining
pellet was air dried and subsequently resuspended carefully in 500 µl ddH2O. After adding 500 µl 4 M
LiCl, the sample was mixed and incubated on ice at 4 °C O/N to precipitate the RNA.

Material and methods 54
The following day, the RNA was precipitated by centrifugation (14,000 rpm; 30 min; 4 °C). After
removal of the supernatant, the pellet was washed with 1 ml 80 % (v/v) ethanol. After centrifugation
(14,000 rpm; 5 min; 4 °C), the supernatant was removed using a pipette and the pellet was air dried.
When the pellet became glassy, the RNA was dissolved carefully in 30 µl DEPC-treated water. The
RNA was stored at –80 °C.
Homogenisation buffer Hot phenol mix
100 mM Tris (pH 8.5) 250 µl phenol
5 mM EDTA (pH 8.0) 500 µl homogenisation buffer
100 mM NaCl 5 µl -mercaptoethanol
0.5 % (w/v) SDS
DEPC-treated water
0.1 % diethylpyrocarbonat
Incubate on a magnetic stirrer O/N; autoclave twice.
2.5.2 RNA extraction by TRIsure (Quick RNA isolation protocol)
Approximately 100–150 mg plant tissue (in 1.5-ml safe-lock tube) were frozen in liquid nitrogen.
Subsequently, a small amount of glass sand was added and the tissue was ground to a fine powder
using a homogenizer (Heidolph) or using mortar and pistil. First, 800 µl TRIsure reagent (Bioline) were
added and the sample was mixed thoroughly with a vortex. The tube was incubated 5 min at RT and
5 min on ice. 200 µl chloroform were added. The sample was mixed well and incubated on ice for
further 5 min. After centrifugation (13,000 rpm; 10 min; 4 °C) the upper soluble phase was
transferred to a new tube containing 700 µl isopropanol. The sample was inverted several times and
incubated for 20 min at RT. The RNA was precipitated by centrifugation (13,000 rpm; 30 min; 4 °C)
and the supernatant was removed. The RNA pellet was washed with 1 ml 80 % (v/v) ethanol. After
centrifugation (13,000 rpm; 5 min; 4 °C) the supernatant was removed completely and the pellet was
air dried. The glassy pellet was dissolved in 30 µl DEPC treated water. The RNA was stored at –80 °C.
2.5.3 RNA purification by phenol:chloroform extraction
The RNA sample was filled up to a volume of 180 µl with DEPC-treated water. 20 µl 3 M sodium
acetate (pH 5.2; 1/10 vol) were added and the sample was mixed thoroughly. Next, 1 vol of 1:1
phenol:chloroform mix (Roth) was added and the sample was mixed using a vortex. After
centrifugation in a table centrifuge (13,000 rpm; 10 min), the aqueous phase was transferred to a
new tube containing 1 vol chloroform. The extraction was repeated. The RNA was precipitated by
adding 2 vol 100 % ethanol and an incubation phase at –20 °C for at least 30 min. After centrifugation

Material and methods 55
(13,000 rpm; 30 min), the supernatant was removed and the pellet was washed with 1 ml 70 % (v/v)
ethanol. After brief centrifugation the ethanol was removed completely and the pellet was air dried.
The RNA was dissolved in 30–50 µl DEPC-treated water or 0.1 mM EDTA and stored at –80 °C.
2.5.4 DNase digest of RNA samples
To digest remaining DNA in RNA samples, the TURBO DNA-free Kit (Ambion/Life Technologies) was
used. In the standard procedure, 10 µg total RNA were used in a 50-µl setup. First, the RNA was filled
up to a volume of 22.5 µl with RNase-free water provided in the kit. 2.5 µl TURBO DNase buffer were
added. Simultaneously, a mix of 21.5 µl water, 2.5 µl TURBO DNase buffer and 2.5 µl TURBO DNase
(10 u/µl) was prepared and added to the RNA sample. After an incubation at 37 °C for 30 min, 5 µl of
DNase inactivation reaction were added. The sample was incubated at RT for 2 min. After
centrifugation in a table centrifuge (13,000 rpm; 1 min), the supernatant was carefully transferred to
a new tube. The result of the DNase digest was tested by PCR (chapter 2.4.7), adding Col-0 DNA as a
positive control.
2.5.5 cDNA synthesis by reverse transcription PCR (RT-PCR)
SuperScript III Reverse Transcriptase (Invitrogen) was used to synthesize cDNA from RNA. 2–3 µg
total RNA were filled up to a volume of 12.2 µl with water. For standard cDNA synthesis, 0.8 µl
100 µM oligo (dT)17 primer (LGC Genomics) were added. For the cDNA synthesis after the mRNA
fractionation (chapter 2.5.8), 1.5 µl RNA were filled up to a volume of 12 µl with water and 0.5 µl
Random Hexamer Primer (Qiagen) were added. Next, 1 µl 10 mM dNTPs (Bioline) was added and the
sample was incubated for 5 min at 65 °C. After incubation on ice for 5 min, 4 µl 5× First strand buffer,
1 µl 0.1 M DTT (provided with the enzyme) and 1 µl SuperScript III were added. The cDNA synthesis
was carried out at 50 °C for 60 min in a thermocycler followed by the enzyme inactivation at 75 °C for
15 min. The cDNA was stored at –20 °C. For a subsequent qPCR, the samples were tested for an equal
cDNA concentration by PCR (chapter 2.4.7). A 1:10 cDNA dilution was used as a qPCR template.
2.5.6 Poly(A) tail test (PAT)
For measurements of the poly(A) tail length by PCR (PAT test), the Affymetrix Poly(A) Tail-Length
Assay Kit was used according to the instructions. RNA was extracted by the hot phenol method
(chapter 2.5.1). For the PCR, HotStart-IT Taq DNA Polymerase (Affymetrix) was used according to the
instructions. Primers used for the detection of specific genes (At1g19180, At1g72450, At2g18700)
are listed in Appendix C. PCR products were visualized by agarose gel electrophoresis (chapter 2.4.13)
using 3 % agarose gels. For PAT-test samples, Ficoll DNA loading dye based on Orange G-dye was
used to avoid concealing any DNA bands in the UV transillumination analysis.
Material and methods 56
10× Ficoll DNA loading dye 10 ml
Ficoll-400 2.5 g 1 M Tris-HCl (pH 7.4) 1 ml 0.5 M EDTA 2 ml Dissolve in a water bath at 65 °C. Orange G 25–50 mg
2.5.7 In-vitro transcription
Control RNA with defined poly(A) tail sizes was transcribed in vitro with the T7 RNA Polymerase
(NEB). First, 2 µg vector DNA (pGT2d, pGT3b or pGT5; see Table 10) were filled up to a volume of
13.6 µl with RNase-free water. Subsequently, 4 µl 5 mM NTP solution (Bioline), 4 µl 10x T7
transcription buffer (NEB) and 2 µl BSA (2 mg/ml BSA) were added. The sample was mixed gently and
2 µl RNase Inhibitor (Promega) and 0.4 µl T7 Polymerase (NEB) were added. The sample was
incubated at 37 °C for 2 h. The reaction was stopped by adding 1.5 µl TURBO DNase (Ambion) and a
further incubation at 37 °C for 30 min. Subsequently, the RNA was purified by phenol:chloroform
extraction (chapter 2.5.3) and dissolved in 50 µl 0.1 mM EDTA.
2.5.8 Poly(A) tail length-dependent RNA fractionation
The poly(A)-tail-dependent mRNA fractionation protocol based on the method, developed by Meijer
and de Moor (2011), was modified and adjusted to an RNA amount of 20 µg. The PolyATtract®
System 1000 (Promega) was used.
RNA was extracted by the hot phenol method (chapter 2.5.1). Three control RNAs with a defined
poly(A) tail length of 29, 75 or 124 A’s, respectively, were prepared by in-vitro transcription (chapter
2.5.7). An RNA control mix with a final concentration of 1 ng/µl for each control RNA was prepared.
All chemicals and buffers were allowed to reach RT prior to the experiment. In preparation for the
fractionation, 41 µl BME were added to 1 ml GTC, and 20.5 µl BME were added to 1 ml DIL. The
DIL/BME-mix was preheated to 70 °C. A 0.085× SSC dilution was prepared from the 0.5× SSC buffer
stock.
First, 1 µl in-vitro RNA control mix was added to 20 µg total RNA in a 2 ml tube (in a maximum
volume of 20 µl). The RNA was mixed with 200 µl GTC/BME. Then 7.5 µl biotinylated oligo (dT)
(Promega) and 408 µl preheated DIL/BME were added. The mix was incubated at 70 °C for 5 min,
followed by centrifugation in a table centrifuge (13,000 rpm; 10 min; RT).
Simultaneously, the paramagnetic beads (Streptavidin MagneSphere® Paramagnetic Particles,
Promega) were carefully resuspended and a 300 µl aliquot was transferred to a fresh 2-ml tube.
Tubes containing beads were placed into a magnetic stand, which was slowly tilted to a horizontal
position to collect the beads at the magnetic tube side. The storage buffer was removed carefully (by

Material and methods 57
pouring, or better, by removal with a pipette) and the beads were resuspended in 300 µl the 0.5× SSC
buffer. The washing procedure was repeated twice.
The SSC buffer was removed from the beads and after spinning the RNA sample the supernatant was
added to the beads. To allow the biotinylated oligo (dT) to bind the beads, the tubes were incubated
on a rotator at RT for 15 min. Subsequently, the beads were captured by placing the tube in the
magnetic stand and the supernatant, i.e. the unbound mRNA fraction, was transferred to a fresh
tube which was kept on ice in the following. The beads were washed three times with 0.5× SSC buffer
as described above and rotated for at least 5 min between each wash step. To obtain the short-tailed
mRNA fraction, the beads were resuspended in 200 µl 0.085× SSC buffer, which induces the release
of mRNAs with tails shorter than 50 A’s from the oligo (dT)-bound beads. After a 5 min rotation, the
beads were captured and the supernatant, i.e. the “short fraction”, was collected in a new tube. The
beads were washed three times in 0.5× SSC buffer with a 5 min rotation between each wash step. To
release the remaining mRNAs, the beads were resuspended in 200 µl nuclease-free water. The tubes
were rotated for 5 min and after capturing the beads the supernatant containing the mRNAs with tail
longer than 50 A’s was collected. This step was repeated twice and the three eluates were merged,
resulting in the “long fraction”.
To remove any transferred beads, all samples were centrifuged (14,000 rpm; 10 min; 4 °C). For RNA
precipitation, 0.1 vol Co-precipitant Pink buffer (BioLine) was added to each sample and after
thorough mixing, 15 µg (or 3 µl) Co-precipitant pink (BioLine) were added. Samples were mixed with
a vortex and 1 vol 100 % ethanol was added. After incubation (30 min or O/N, –20 °C) the RNA was
precipitated by centrifugation (14,000 rpm; 10 min; 4 °C). The supernatant was removed. The RNA
pellet was washed with 500 µl 80 % (v/v) ethanol, air dried and dissolved in 10 µl DEPC-treated
water.
Subsequently, 1.5 µl RNA were used for cDNA synthesis (chapter 2.5.5) and the abundances of target
and control genes in the different fractions were determined by qPCR (chapter 2.4.12).
2.6 Protein techniques
2.6.1 Protein extraction from Arabidopsis
For protein extraction, exactly 100 mg Arabidopsis seedlings were harvested in 1.5-ml tubes, which
were immediately frozen in liquid nitrogen. The sample weight was determined with a high-accuracy
scale, since the protein measurement was performed on the basis of equal sample fresh weight. A
small amount of glass sand was added and the seedlings were ground to a fine powder with a
homogenizer (Heidolph). After adding 2 vol of preheated SDS sample buffer and thorough mixing, the
samples were boiled at 95 °C for 5 min and cooled on ice for 5 min. Cell debris was removed by

Material and methods 58
centrifugation in a table centrifuge (13,000 rpm; 10 min; 4 °C). Equal volumes of supernatant (20 µl)
were separated by SDS-PAGE (chapter 2.6.2).
SDS sample buffer 10 ml Stacking buffer
Stacking buffer 1.4 ml 0.5 M Tris Glycerol 1.0 ml 0.4 % (w/v) SDS
ddH2O 5.1 ml adjust pH to 6.8 with HCl 10 % (w/v) SDS 2.0 ml
-mercaptoethanol 0.5 ml
Bromphenol blue 0.001 %
2.6.2 SDS polyacrylamide gel electrophoresis (SDS-PAGE)
Prior to a Western blot, protein extracts were separated by SDS polyacrylamide gel electrophoresis
(SDS-PAGE). The SDS-PAGE was performed according to the Tris-glycin buffer system (Laemmli 1970)
using the Mini-Protean® 3 Cell-System (Biorad). Since the expected size of PAPS-YFP proteins was
114–116 kDa, an 8 % (w/v) polyacrylamide gel was prepared as separating gel. The stacking gel
contained 5 % (w/v) polyacrylamide. A 10-slot comb was used and 20 µl Arabidopsis protein extract
(chapter 2.6.1) per slot were loaded. The Prestained Protein Molecular Weight Marker (5 µl;
Fermentas) served as protein size control. The electrophoresis was run in 1× electrophoresis buffer at
120 V for 1–2 h until the dye front had reached the end of the gel. Subsequently, the gel was stained
with Coomassie protein dye (chapter 2.6.3) or a Western blot was performed (chapter 2.6.4).
8 % (w/v) separating gel 10 ml 5 % (w/v) stacking gel 5 ml
1.5 M Tris-HCl (pH 8.8) 2.5 ml 0.5 M Tris-HCl (pH 6.8) 0.63 ml 30 % (w/v) acrylamide/ bis-acrylamide
2.7 ml 30 % (w/v) acrylamide/ bis-acrylamide
0.83 ml
ddH2O 4.6 ml ddH2O 3.40 ml 10 % (w/v) SDS 100 µl 10 % (w/v) SDS 50 µl 10 % (w/v) APS 100 µl 10 % (w/v) APS 50 μl TEMED 60 µl TEMED 5 μl 10× electrophoresis buffer 1 l 1× electrophoresis buffer 1 l
Tris 30 g 10× electrophoresis buffer 100 ml Glycin 144 g 10 % (w/v) SDS 10 ml
2.6.3 Coomassie staining of protein gels
A polyacrylamide gel was incubated in Coomassie staining solution for 1 h or O/N on a rotator.
Proteins in the gel were detected by shaking the gel several times in destaining solution.
Coomassie staining solution 500 ml Destaining solution 1 l
Coomassie blue R-250 120 mg Methanol 450 ml Methanol 250 ml Acetic acid 100 ml Acetic acid 4 ml

Material and methods 59
2.6.4 Western blot
Proteins were transferred from a polyacrylamide gel to a nitrocellulose membrane (0.2 µm pore size;
0.15 ± 0.05 mm membrane strength) using a wet-blot system (Mini Trans-Blot Cell; Bio-Rad). Both
membrane and blotting paper were cut to the size of the gel and were wet in 1× transfer buffer. The
blotting holder cassette was assembled stacking a wet pad, three layers of wet blotting paper, the
wet membrane, the gel, again three layers of wet blotting paper and a wet pad. The blotting module
was put in the blotting tank with the nitrocellulose membrane oriented towards the anode to allow
proteins to move towards the positive pol. An ice-filled container was added, the chamber was filled
with 1× transfer buffer and the blot was run at 100 V for 90 min.
Empty binding sites were blocked by incubating the membrane in 5 % (w/v) milk powder (in 1× TBST)
on a rotator (4 °C; 1 h). The milk powder solution was removed by washing the membrane twice in
1× TBST buffer for 10 min. Next, the membrane was incubated with the primary antibody on a
rotator (4 °C; O/N). A polyclonal anti-GFP antibody from rabbit (ab290, Abchem) was diluted 1:2000
in 1× TBST buffer. The membrane was washed three times in 1× TBST for 20 min and incubated with
the second antibody, a horseradish peroxidise-coupled anti-rabbit antibody (A6154-1ML, Sigma)
diluted 1:5000 in 1× TBST (4 °C; 2 h). The membrane was washed two times in 1× TBST for 20 min
and once in 1× TBS for 10 min.
For chemiluminescence detection, the membrane was covered completely with luminol reagent and
the luminol signal was detected with a CCD camera (NightOWL LB 983 NC100; Berthold
Technologies).
10× transfer buffer 1 l 1× transfer buffer 1 l
Tris 30 g 10× transfer buffer 100 ml Glycin 144 g Methanol 200 ml 10 % (w/v) SDS 10 µl 10× TBS buffer 1 l 1× TBS buffer 1 l
Tris 15 g 10× TBS buffer 100 ml NaCl 72 g pH 7.4 with HCl 1× TBST buffer 1 l Luminol reagent
10× TBS buffer 100 ml Solution A 2 ml Tween 20 1 ml Solution B 200 µl 35 % (v/v) H2O2 0.6 µl Solution A 200 ml Solution B 100 ml
Luminol 50 mg p-hydroxycoumaric acid 11 mg 0.1 M Tris-HCl (pH 8.6) 200 ml DMSO 10 ml

Material and methods 60
2.7 Transformation techniques
2.7.1 Preparation of electro-competent bacteria
To prepare a pre-culture, 50 ml selective LB liquid medium was inoculated with a single bacteria
colony (strains see chapter 2.1.4, antibiotics see Table 3). The culture was incubated O/N on a shaker
(200 rpm; 37 °C for E. coli; 28 °C for Agrobacterium). 400 ml pre-warmed, selective LB medium was
inoculated with 4 ml pre-culture, resulting in an optical density (at 600 nm) of about 0.1. The culture
was shaken at the respective temperature until an optical density of 0.3–0.4 was reached (about 2 h
for E. coli, about 4 h for Agrobacterium). The culture was cooled on ice for 15 min. The following
steps were performed on ice in a cold room (at 8 °C). The cells were harvested by centrifugation in
two pre-cooled centrifuge tubes (4,000 rpm; 10 min; 4 °C; Beckman centrifuge, rotor type JLA
16.250). The supernatant was discarded and the cells of the remaining culture were harvested
likewise in the same tubes. The cell pellet was carefully resuspended in 10 ml cold, autoclaved water.
The volume was filled up to 100 ml with water and the cells were harvested by centrifugation (4,000
rpm; 10 min; 4 °C). The washing was repeated. The bacteria were resuspended in 10 ml 10 % (v/v)
glycerol (cold, autoclaved) and transferred to two 50-ml tubes. After centrifugation (4,000 rpm; 10
min; 4 °C) the supernatant was discarded and the cells were resuspended in 3 ml 10 % (v/v) glycerol
(cold, autoclaved) per tube. Aliquots of 50 µl were directly frozen in liquid nitrogen and stored at
–80 °C.
2.7.2 Transformation of electro-competent E. coli or Agrobacterium cells
In preparation for a transformation, electroporation cuvettes were chilled on ice (1 mm gap for
E. coli; 2 mm gap for Agrobacterium). The bacteria were slowly thawed on ice and 1 µl of a plasmid
DNA (1:100 diluted, about 5 µg) or 1–2 µl of a ligation mix were added. The cell/DNA mix was
transferred to the cuvette. The cuvette was wiped with a tissue and quickly placed in the
electroporator. The pulse was immediately triggered (1.8 kV for E. coli; 2.5 kV for Agrobacterium;
200 Ω resistance and 25 μF capacitance) and the bacteria were quickly resuspended in 1 ml pre-
warmed SOC medium. The bacteria were transferred to a fresh tube and incubated for 30 min to 1.5
h dependent on the antibiotics used (37 °C for E. coli; 28 °C for Agrobacterium). After centrifugation,
the cell pellet was dissolved in 100 µl of the remaining medium. The culture was plated on selective
solid LB medium. The agar plates were incubated O/N at 37 °C (E. coli) or for two to three days at
28 °C (Agrobacterium) to allow colony formation.

Material and methods 61
SOC-Medium 1 l
Bacto trypton 20 g Yeast extract 5 g NaCl 0.5 g 1 M KCl 2.5 ml pH 7.0
After autoclaving for 20 min, the following substances were added:
2 M MgCl2 10 ml 2 M glucose 10 ml
Aliquots of 1 ml were stored at –20 °C.
2.7.3 Transformation of Arabidopsis by floral dip
Plants were grown until they had reached the reproductive phase, producing at least three
inflorescences. To prepare a pre-culture, 4 ml liquid LB medium containing gentamycin to select the
Agrobacterium strain GV3101 and antibiotics selecting for the binary vector (Table 10) were
inoculated with a single bacteria colony and incubated in a shaker (200 rpm; 28 °C; O/N). 400 ml
selective LB medium were inoculated with 1 ml pre-culture and were shaken to allow bacteria
growth (200 rpm; 28 °C; O/N). The culture was transferred to centrifuge tubes and harvested by
centrifugation in a Beckman centrifuge (4,000 rpm; 15 min; 18 °C; rotor type JLA 16.250). The
supernatant was discarded and the cell pellet was resuspended in 10 ml transformation medium. The
cell culture was transferred to a beaker (2 litre volume) and filled up to one litre with the remaining
transformation medium. After adding Silwet L-77, an adjuvant that lowers surface tension, the
Arabidopsis inflorescences were dipped into the bacterial suspension for 20 s. The plants were placed
horizontally in a tray and the tray was put into a plastic bag in order to keep up humidity. The bagged
plants were incubated in the dark O/N. The following day, the plants were removed from the bag and
were subsequently grown under standard conditions until the T1 seeds developed.
Transformation medium 1 l
Sucrose 50 g MS salts 2.15 g Silwet L-77 (to be added after resuspension of the bacterial pellet)
500 µl
2.8 Physiological methods
2.8.1 Crossing of Arabidopsis
Two to four larger floral buds of a mother plant inflorescence were selected. Other open flowers and
siliques were removed from the shoot. Using a microscope, smaller buds were removed from the

Material and methods 62
inflorescence. The remaining buds were carefully opened using forceps and all stamens were
removed. Two days later, pollen of the father plant was placed on the receptive stigmas.
2.8.2 Flowering time analysis Flowering times were assessed according to the instructions by Möller-Steinbach et al. (2010). Plants
were cultivated on soil under standard conditions (chapter 2.2.1) or as indicated. If segregating plant
lines were used in the flowering time analysis, plants were genotyped when four primary leaves had
developed (chapters 2.4.10; 2.4.11; 2.4.18). If a whole leaf had been used for the DNA extraction, the
plant was marked. Plants were observed regularly until bolting. As soon as the shoot had reached a
height of 1 cm, primary and cauline leaves were counted to determine the total leaf number. Leaves
used for DNA extraction were considered. The flowering date was noted to calculate the plant age.
The age was measured from the date plants were transferred to the growth chamber after
stratification. A high correlation between total leaf number and flowering time in days to bolting can
be observed if plants exhibit wild-type like leaf initiation rates (Koornneef et al. 1991).
2.8.3 Salicylic acid treatment of plants Plants were grown on soil under standard conditions (chapter 2.2.1). Starting at ten days after
germination (DAG), the plants were sprayed with salicylic acid solutions every other day until all
leaves were completely bedewed. The solutions contained 0.5 mM or 1 mM salicylic acid in
0.1 % (v/v) Tween 20. As a control, plants were sprayed with a mock solution containing 0.1 % (v/v)
Tween 20.
2.8.4 Leaf initiation rate determination
Plants were grown on soil in single pots in a Percival (chapter 2.2.1). The temperature was kept
stable (22 °C day/ 20 °C night). The plants were observed daily and the initiation of a newly
developed leaf was noted when the leaf primordia were 1 mm long.
2.8.5 Vernalization
The vernalization treatment was performed as described before (De Lucia et al. 2008). Sterile seeds
were sown out on 0.5× MS media plates (without sugar), stratified and cultivated under standard LD
conditions (chapter 2.2.2). To obtain non-vernalized control plants for the flowering time analysis,
seeds from the same sterilized seed batch were directly sown out on soil and grown under standard
conditions (chapter 2.2.1). Late-flowering plants were grown in pots with a diameter of 10 cm. At six
DAG, the plates were transferred to 4 °C for vernalization. In the cold room, plates were irradiated by
LEDs with a PAR of 120 µmol photons/m2/s under short-day (SD) conditions (8 h light, 16 h darkness).
Material and methods 63
After six weeks, the plates were returned to standard LD conditions. To analyse the flowering time,
plants were transferred to soil after five days of recovery at warm ambient temperatures.
To extract RNA for a qPCR analysis, both control plants and vernalized plants were sown out on
0.5× MS media plates. After stratification, the plates were transferred to standard LD conditions
(chapter 2.2.2) as described above. Unvernalized control plants were harvested at ten DAG. Cold-
treated plants were vernalized as described above. Seedlings were harvested after two, four or six
weeks directly in the cold room. Alternatively, the plates were transferred to standard conditions and
the plants were harvested after five days of recovery.
2.8.6 Biotic stress treatment
Pathogen infection assays were performed by the lab of Cyril Zipfel (John Innes Center, Norwich, UK).
The Arabidopsis treatment with the fungus Hyaloperonospora arabidopsidis was carried out as
described before (Tör et al. 2002). Treatments with the bacterial elicitor flg22 were performed by
Lena Stransfeld as described before (Zipfel et al. 2004).
2.8.7 Oxygen depletion stress by submergence
To test flooding tolerance of the paps mutants, a submergence experiment was performed. Plants
cultivated under standard LD conditions for four weeks in a glass house (Max-Planck-Institute of
Molecular Plant Physiology; chapter 2.2.1) were transferred to plastic boxes. The boxes were filled
with water until all plants were completely submerged and were closed with lids. Control plants were
kept in boxes that had not been filled with water. To ensure complete darkness, the boxes were
covered with aluminium foil. After 72 h, the boxes were opened and plants were returned to
standard growth conditions. After three days of recovery, the plant phenotype was documented by
photography.
2.8.8 Long-term oxygen depletion stress by hypoxia
The long-term hypoxia experiment was performed under supervision from Joost van Dongen at the
Max-Planck-Institute of Molecular Plant Physiology. The experiment was performed in a glass house
under standard LD conditions. Three-week-old plants were transferred to plexiglass boxes. In the
boxes, the pots were placed on trays containing a layer of felt cloth that served to store water. The
plexiglass boxes were sealed with tape. A gas mixture containing 400 ppm CO2, 10 % O2, and N2 (Air
Liquide, Berlin) was blown into the boxes. Control boxes were streamed with ambient air (later
termed 21 % O2 boxes). The flow rate was kept between 0.25 and 1 l/min/box and was monitored
daily. A hole in the boxes sealed with putty served to irrigate the plants and to monitor temperature
and gas conditions inside the boxes. Water was poured into the boxes with a syringe until the felt

Material and methods 64
cloth was completely soaked. The temperature and the gas concentration inside of the boxes was
monitored regularly using an electrode (LI-800 Gas Hound Analyzer, LI-COR; Microx TX2, PreSens;
software TX2 Oxyview V4.16). Simultaneously, control plants were grown under standard conditions
outside of the boxes.
The plants were observed regularly. The flowering time of all plants was noted during the
experiment. After 32 days of hypoxia, all plants had bolted and the plexiglass boxes were opened.
The individual leaf diameter and the plant shoot fresh weight were measured immediately. To
determine the plant dry weight, plant shoots were transferred to paper bags and dried using a
vacuum drying oven (Binder).
2.8.9 Oxygen depletion stress by anoxia
To test the plant response to complete anoxia, plants were grown on 0.5× MS media plates (chapter
2.2.2). After stratification for four days, plates were transferred to a Percival and cultivated under
standard LD conditions. At nine DAG, the anoxic treatment was carried out. The plates were
transferred to boxes that were streamed with pure N2 in complete darkness (Air Liquide, Berlin).
Control plates were kept in dark under normoxic conditions during the treatment. After 5–8 h plates
were returned to standard conditions. After six days of recovery, the plant development was
documented by photography.
2.8.10 Drought stress induction
Plants were cultivated on soil under standard LD conditions in a growth chamber (chapter 2.2.1).
Each pot was kept in a weighing boat and was daily irrigated with a defined amount of water. At 14
DAG, the irrigation was interrupted and plants were kept under complete drought. Control plants
were continuously watered. After 14 days, the plant phenotype was documented by photography
and the dry plants were irrigated again, to monitor the plant phenotype during the recovery phase.
2.8.11 Induction of osmotic stress by mannitol
The sugar alcohol mannitol was used to induce osmotic stress in plants as described before
(Nishimura et al. 2004). Sterile seeds were sown out on 0.5× MS media plates containing 200–
400 mM mannitol or on control plates without mannitol (chapter 2.2.2). Five plates per condition
were poured. The plates were divided into four squares and 25 seeds of Col-0, paps1-4 and paps2-3
paps4-3 were sown out on every plate. The last square was filled with paps2-3 or paps4-3 seeds.
After stratification, plates were cultivated under standard LD conditions. To avoid water evaporation
from the media, which would have resulted in an increase of the mannitol concentration, the plates

Material and methods 65
were illuminated by LEDs. At eleven DAG the seedling fresh weight was determined using a high-
accuracy scale. For the measurement, all 25 seedlings per genotype were pooled in a weighing boat.
2.8.12 Application of cold stress
Seeds were sown out on 0.5× MS media plates, stratified and cultivated under LD conditions in a
climate growth chamber (chapter 2.2.2). Since the paps1-1 mutant germinates late the paps1-1
containing plates were transferred to the growth chamber two days before the other plates. At five
DAG, the plates were transferred to 4 °C for four weeks. In the cold room, plates were irradiated by
LEDs with a PAR of 120 µmol photons/m2/s under SD conditions. Eight days before the cold-
treatment ended, the control plates were sown out, stratified and cultivated under LD conditions.
Five days after returning the cold-treated plates back to 21 °C, the phenotype of the cold-treated and
the ten-day-old control plants was documented by photography. Immediately after photographing
the plates, the seedling fresh weight was determined using a high-accuracy scale. For the
measurement, ten seedlings per genotype were pooled on a weighing boat.
2.8.13 Induction of oxidative stress
Oxidative stress was induced using methyl viologen or 3-amino-1, 2, 4-triazole (AT) and buthionine-S,
R-sulfoximide (BSO) as described before (Zhang et al. 2008). Seeds were sown out on 0.5× MS media
plates, stratified and pre-grown for seven days in a Percival (chapter 2.2.2). At seven DAG, seedlings
were transferred to 0.5× MS media plates supplemented with 1 % (w/v) glucose and the stress-
inducing chemicals (40 mM MV; 1 µM AT + 200 µM BSO; 2 µM AT + 400 µM BSO; control without
supplements). A slice of medium (2 cm width) had been removed from the plate. The seedlings were
placed on the upper side of the cut medium and plates were placed horizontally in the Percival to
allow horizontal root growth. After 14 days, all plates were photographed for the root length
analysis. The fresh weight of every individual seedling was immediately determined using a high-
accuracy scale. The individual root length was determined using the software ImageJ (Abràmoff et al.
2004).
2.9 Plant photography
Plants and plates were photographed on a black cloth using a Canon SX220 HS Powershot camera.
The sensitivity (ISO) was kept at 100, the exposure time was kept at 1/60 s, and the relative aperture
(f-stop) was adjusted.

Material and methods 66
2.10 Microscopy
Arabidopsis seedlings expressing pPAPS:PAPS::YFP constructs were monitored using a fluorescence
microscope (Axiovert200M; Carl Zeiss) or a laser-scanning microscope (LSM510 Axioplan2; Carl
Zeiss). Scale bars were included using the program ImageJ (Abràmoff et al. 2004).
2.11 Statistical means
Replicate numbers are indicated for every experiment. At least three replicates were used for all
measurements. To analyse the data, mean and standard deviation were determined as a measure for
data variation. The standard error of the mean (SEM) respects the sample size. Significant differences
between treatments or genotype-specific phenotypes were assessed using the two-sided Student’s
t-test and applying Bonferroni-correction.
Mean: �̅� =
1
𝑛 ∑ 𝑥𝑖
𝑛
𝑖=1
Standard deviation:
𝑠 = ± √1
𝑛 − 1∑(𝑥𝑖 − �̅�)2
𝑛
𝑖=1
Standard error of the mean 𝑆𝐸𝑥 ̅ = 𝑠
√𝑛
n = Number of values (sample size)
xi = The i’s of values
i = Running index from 1 to n
2.12 Transcriptome analysis
2.12.1 Sequencing
For the transcriptome analysis, ten-day-old seedlings and flowers of paps2-3 paps4-3 and Col-0 were
harvested. Four replicates per genotype and per tissue were collected. RNA was extracted using the
hot phenol protocol (chapter 2.5.1). DNA was digested using RQ1 RNase-free DNase (Promega)
according to the manufacturer’s instructions. Subsequently, samples were purified by
phenol:chloroform extraction (chapter 2.5.3). The RNA was sequenced using the EXPRSS method
(Rallapalli et al. 2014). Four flower and four leaf samples for both paps2-3 paps4-3 double mutants
and Col-0 wild type were barcoded and sequenced on two Illumina Genome Analyzer II (GAII) lanes.
Four flower samples for both paps1-1 and Ler wild type were barcoded and sequenced on half a GAII
lane (Trost 2014, PhD thesis).

Material and methods 67
2.12.2 Data preprocessing Data were demultiplexed using fastq-multx. rRNA reads were removed using RiboPicker (Schmieder
et al. 2012). Sequencing reads were mapped against the TAIR10 reference genome using TopHat2
(Kim et al. 2013) with a reference annotation from TAIR10. Output files were further processed using
samtools (Li et al. 2009) before counting reads per gene using htseq-count (Anders et al. 2014).
2.12.3 Gene expression investigation Expression analyses were done using R (chapter 2.13). Count data were further processed using
DESeq2 (Love et al. 2014). Data were transformed to stabilize variance, clustered using euclidean
distance and then visualized as a heat map to test for proper grouping of biological replicates.
Differential gene expressions were assessed using DESeq2. Genes with log2 fold changes above 1 and
BH-adjusted (Benjamini and Hochberg 1995) p-values below 0.05 were considered significant when
doing binary comparisons. Overlap of differentially expressed genes were visualized using the limma
vennDiagram function (Smyth 2005). Functional category analyses were done using the MapMan
ontology (Thimm et al. 2004). Affected categories were identified using Wilcoxon rank-sum test and
Kolmogorov-Smirnov test, p-values were BH corrected. Differentially expressed genes were
overlapped with the top 200 up- and top 200 down-regulated genes within microarray experiments
re-analyzed for MASTA (Reina-Pinto et al. 2010). Overlaps in the same and opposite sense were
addressed.
2.13 Software and online tools used for the data analysis
The database PubMed from the National Center for Biotechnology Information (NCBI) served for
literature research:
http://www.ncbi.nlm.nih.gov/pubmed/
The LC480 converter (version 2.0, 2012) was used to convert qPCR data obtained with the LC480
(Roche):
http://www.hartfaalcentrum.nl/index.php?main=files&sub=0
The software Image J (version 1.44p, 2011) was used to analyse plant phenotypes and to analyse
images gained by microscopy:
http://rsbweb.nih.gov/ij/

Material and methods 68
Arabidopsis genome information published at The Arabidopsis Information Resource (TAIR) website
was used to obtain Arabidopsis gene sequences, coding sequences, cDNA data and enhanced
sequence tag data
http://arabidopsis.org/
The comparison of DNA and protein sequences with published genome and protein data was
performed with the Basic Local Alignment Search Tool of the data base NCBI:
http://blast.ncbi.nlm.nih.gov/Blast.cgi
DNA sequences were translated into amino acid sequences using the Translate tool of the ExPASy
Proteomics Server of the Swiss Institute of Bioinformatics:
http://web.expasy.org/translate/
The Vector NTI Advance software (version 11.0, 2008; Invitrogen Corp.) was used to analyse gene
sequence data:
http://www.lifetechnologies.com/de/de/home/life-science/cloning/vector-nti-software.html
The software R (version 3.1.2, 2014) was used to analyse large data sets:
http://www.r-project.org/
The basic plant biology version of Genevestigator was used to analyse plant gene expression patterns
and to compare RNA-seq data with published transcriptome data (tools indicated below):
https://www.genevestigator.com/gv/doc/plant/featured_tools.jsp
The reference manager Mendeley desktop (version 1.12.1, 2008-2014) was used to insert citations:
http://www.mendeley.com/
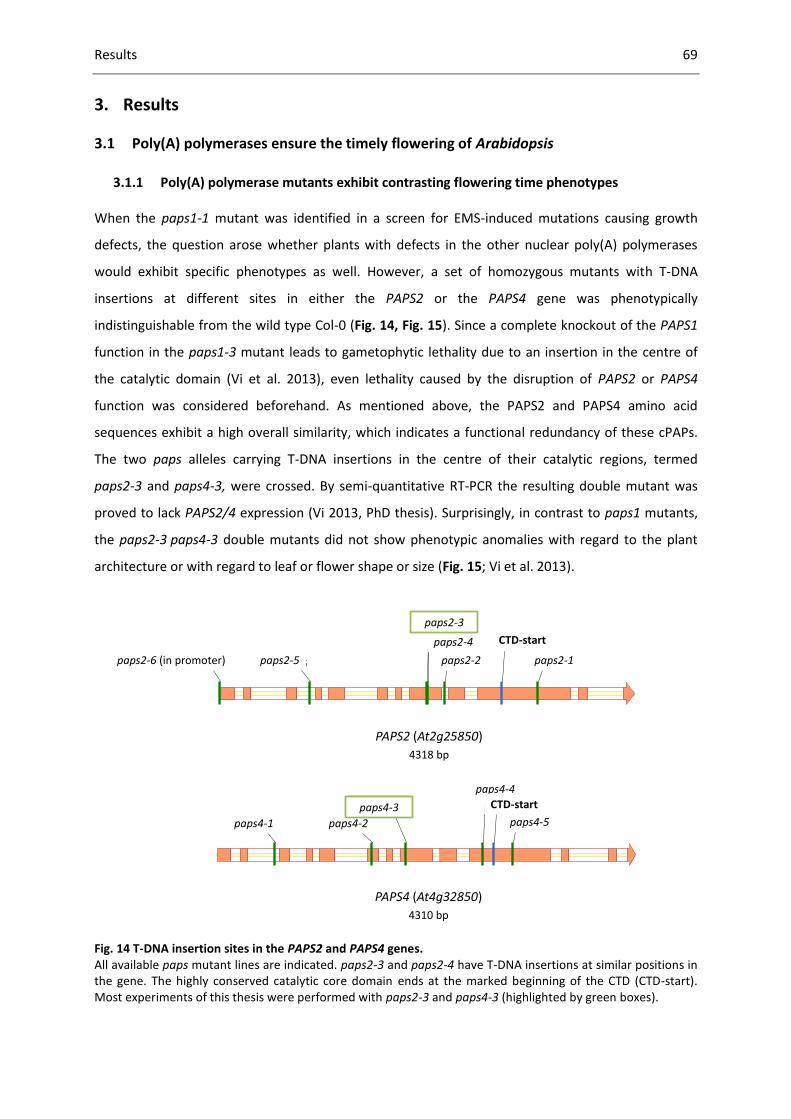
Results 69
3. Results
3.1 Poly(A) polymerases ensure the timely flowering of Arabidopsis
3.1.1 Poly(A) polymerase mutants exhibit contrasting flowering time phenotypes When the paps1-1 mutant was identified in a screen for EMS-induced mutations causing growth
defects, the question arose whether plants with defects in the other nuclear poly(A) polymerases
would exhibit specific phenotypes as well. However, a set of homozygous mutants with T-DNA
insertions at different sites in either the PAPS2 or the PAPS4 gene was phenotypically
indistinguishable from the wild type Col-0 (Fig. 14, Fig. 15). Since a complete knockout of the PAPS1
function in the paps1-3 mutant leads to gametophytic lethality due to an insertion in the centre of
the catalytic domain (Vi et al. 2013), even lethality caused by the disruption of PAPS2 or PAPS4
function was considered beforehand. As mentioned above, the PAPS2 and PAPS4 amino acid
sequences exhibit a high overall similarity, which indicates a functional redundancy of these cPAPs.
The two paps alleles carrying T-DNA insertions in the centre of their catalytic regions, termed
paps2-3 and paps4-3, were crossed. By semi-quantitative RT-PCR the resulting double mutant was
proved to lack PAPS2/4 expression (Vi 2013, PhD thesis). Surprisingly, in contrast to paps1 mutants,
the paps2-3 paps4-3 double mutants did not show phenotypic anomalies with regard to the plant
architecture or with regard to leaf or flower shape or size (Fig. 15; Vi et al. 2013).
Fig. 14 T-DNA insertion sites in the PAPS2 and PAPS4 genes. All available paps mutant lines are indicated. paps2-3 and paps2-4 have T-DNA insertions at similar positions in the gene. The highly conserved catalytic core domain ends at the marked beginning of the CTD (CTD-start). Most experiments of this thesis were performed with paps2-3 and paps4-3 (highlighted by green boxes).
PAPS2 (At2g25850)
4318 bp
paps2-5
paps2-4
paps2-3
paps2-2 paps2-1paps2-6 (in promoter)
start CTD
PAPS4 (At4g32850)
4310 bp
paps4-1 paps4-2
paps4-3
paps4-4
paps4-5
start CTD
paps2-6 (in promoter) paps2-5 paps2-2 paps2-1
paps2-4
paps4-1 paps4-2
paps4-3
paps2-3
paps4-4
paps4-5
PAPS2 (At2g25850)
4318 bp
PAPS4 (At4g32850)
4310 bp
CTD-start
CTD-start

Results 70
Fig. 15 Phenotype of paps mutants in Col-0 background. a) paps1-1 and paps1-4 mutants have smaller leaves than the wild type, while paps2-3, paps4-3 and the double mutant paps2-3 paps4-3 do not show a specific phenotype. Shown are 21-day-old plants grown under LD conditions (22 °C day; 20 °C night). b) 35-day-old paps mutants grown under LD conditions. paps4-3 and paps2-3 paps4-3 flower later than Col-0, while paps1-4 flowers early.
The only striking observation was a moderately delayed flowering of paps2 paps4 compared to the
wild type (Fig. 15). The same effect was seen for the paps4-3 single mutant, albeit to a lesser degree.
To quantify the observed effects, a flowering time analysis (FTA) was performed under standard LD
conditions (Fig. 16). All five accessible paps4 lines were tested in comparison to the wild type and to
paps2-3 paps4-3. Since paps2 mutants had no visible defect, only two lines with T-DNA insertions in
the promoter region and in the catalytic centre were examined in the FTA. The total leaf number
(TLN), consisting of visible rosette and cauline leaves, was noted when the plants were bolting with a
shoot of approximately 1 cm length. Box plots were chosen to present the flowering time data. Box
plots display the interquartile range, i.e. the central 50 % of the data. The median, dividing the lower
and upper half of the samples, separates the box into the second and third quartile. The box’s
whiskers range from the minimum to the maximum value. Both paps2 lines flowered similar to the
wild type with an average TLN of 12 (Fig. 16). All paps4 mutant lines flowered significantly late with
14 to 15 leaves. Strikingly, with an average TLN of 17 the paps2-3 paps4-3 double mutant flowered
later than all individual paps2 or paps4 single mutants.
a)
b)
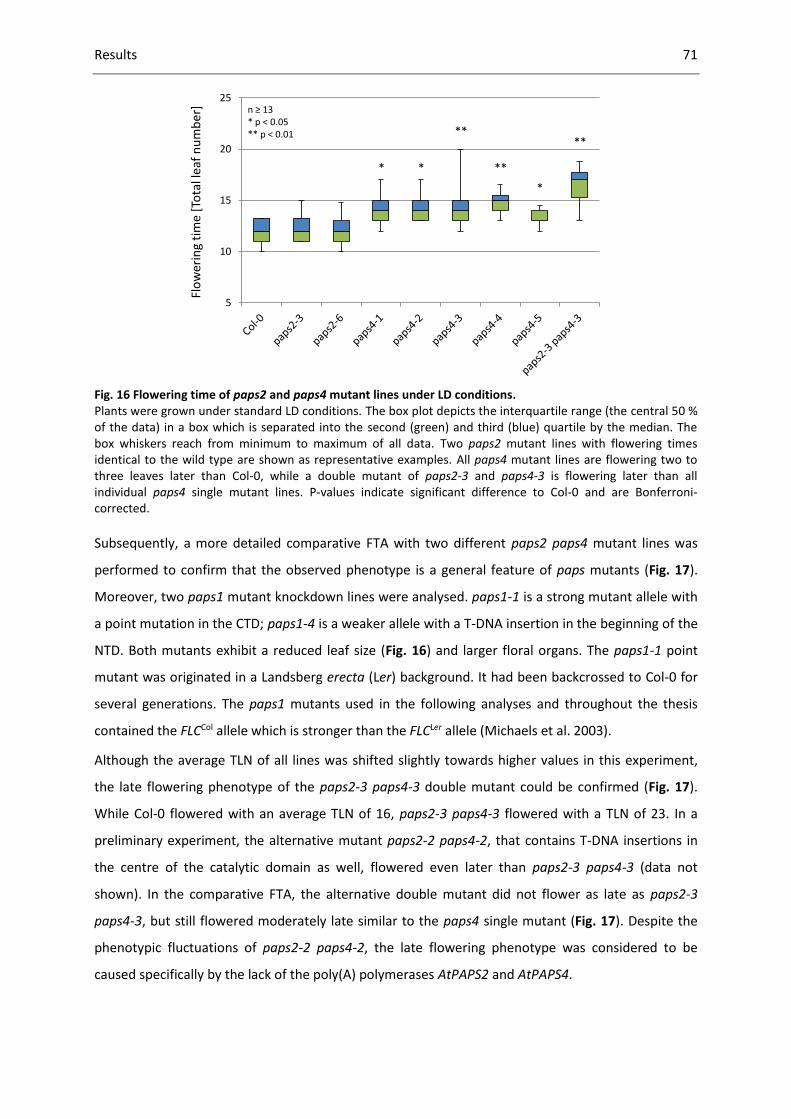
Results 71
Fig. 16 Flowering time of paps2 and paps4 mutant lines under LD conditions. Plants were grown under standard LD conditions. The box plot depicts the interquartile range (the central 50 % of the data) in a box which is separated into the second (green) and third (blue) quartile by the median. The box whiskers reach from minimum to maximum of all data. Two paps2 mutant lines with flowering times identical to the wild type are shown as representative examples. All paps4 mutant lines are flowering two to three leaves later than Col-0, while a double mutant of paps2-3 and paps4-3 is flowering later than all individual paps4 single mutant lines. P-values indicate significant difference to Col-0 and are Bonferroni-corrected.
Subsequently, a more detailed comparative FTA with two different paps2 paps4 mutant lines was
performed to confirm that the observed phenotype is a general feature of paps mutants (Fig. 17).
Moreover, two paps1 mutant knockdown lines were analysed. paps1-1 is a strong mutant allele with
a point mutation in the CTD; paps1-4 is a weaker allele with a T-DNA insertion in the beginning of the
NTD. Both mutants exhibit a reduced leaf size (Fig. 16) and larger floral organs. The paps1-1 point
mutant was originated in a Landsberg erecta (Ler) background. It had been backcrossed to Col-0 for
several generations. The paps1 mutants used in the following analyses and throughout the thesis
contained the FLCCol allele which is stronger than the FLCLer allele (Michaels et al. 2003).
Although the average TLN of all lines was shifted slightly towards higher values in this experiment,
the late flowering phenotype of the paps2-3 paps4-3 double mutant could be confirmed (Fig. 17).
While Col-0 flowered with an average TLN of 16, paps2-3 paps4-3 flowered with a TLN of 23. In a
preliminary experiment, the alternative mutant paps2-2 paps4-2, that contains T-DNA insertions in
the centre of the catalytic domain as well, flowered even later than paps2-3 paps4-3 (data not
shown). In the comparative FTA, the alternative double mutant did not flower as late as paps2-3
paps4-3, but still flowered moderately late similar to the paps4 single mutant (Fig. 17). Despite the
phenotypic fluctuations of paps2-2 paps4-2, the late flowering phenotype was considered to be
caused specifically by the lack of the poly(A) polymerases AtPAPS2 and AtPAPS4.
5
10
15
20
25
Flo
wer
ing
tim
e [T
ota
l lea
f n
um
ber
]
**
**
**
* *
*
n ≥ 13* p ˂ 0.05** p ˂ 0.01

Results 72
Fig. 17 Comparative flowering time analysis of paps single and double mutants. A comparative flowering time analysis with representative paps mutant lines was performed under LD conditions. In this experiment, the temperature was kept stable (22 °C day/ 20 °C night). The total leaf number (a) and the plant age in days (b) were determined when the plants were bolting. P-values indicate significant difference to Col-0 and are Bonferroni-corrected.
Interestingly, with a TLN of 11 and 13, respectively, both paps1 mutants flowered significantly earlier
than the wild type. While a strong correlation between the TLN and age of the bolting plants was
observed for most of the analysed plant lines, a discrepancy was noticed for the two paps1 mutant
lines (Fig. 17). Both paps1 lines flowered exactly four weeks after germination (Fig. 17 b). However,
with regard to the TLN paps1-1 is flowering two leaves earlier than paps1-4 (Fig. 17 a). To examine
this divergence in more detail, the leaf initiation rates of the analysed lines were determined. Since
the leaf initiation rate of the wild type and of two paps2 paps4 (in the following paps2/4) double
mutant lines were found to be almost identical, the late flowering phenotype cannot be caused by a
delayed leaf emergence (Fig. 18 b). Similarly, paps2-3 and paps4-3 single mutants (data not shown)
and paps1-4 (Fig. 18 a) exhibit leaf initiation rates identical to the wild type. In contrast, paps1-1
shows delayed initiation of the first three leaves. Later, the dynamics are similar to the wild type
again (Fig. 18 a). This finding indicates pleiotropic phenotypes caused by the strong paps1-1 mutant
allele and explains the discrepancy between plant age and TLN observed for bolting paps1 mutants.
Subsequently, it was checked whether the paps mutant phenotypes could be enhanced by plant
growth under SD conditions (8 h light/16 h darkness). Both photoperiod pathway and circadian clock
regulate the amount of the diurnally expressed CONSTANS (Yanovsky and Kay 2002). High CONSTANS
protein levels, which are achieved under LD conditions in summers, can upregulate the transcription
of FT, an important activator of flowering also described as “florigen” (e.g. Corbesier et al. 2007). The
plant circadian clock consists of several interdependent transcriptional and translational feedback
loops, involving dawn- and evening-activated genes and rhythmic changes in chromatin structure
(described in detail in Farré 2012; Barneche et al. 2014). The lack of AtPAPS might cause a
0
5
10
15
20
25
30
n ≥ 15** p ≤ 0.01
**
**
**
** **
Flo
wer
ing
tim
e [T
ota
l lea
fn
um
ber
]a)
0
5
10
15
20
25
30
35
40
Flo
wer
ing
tim
e [D
ays
tob
olt
ing]
n ≥ 15** p ≤ 0.01
**** **
** **
b)

Results 73
deregulation of day length perception or of the entrainment of the circadian clock, leading to a
moderate phenotype under LD conditions and an enhanced late flowering phenotype under SD
conditions.
Fig. 18 Leaf initiation rate of paps mutants. The rosette leaf emergence of different paps1 and paps2 paps4 double mutants was observed on plants grown under LD conditions. The temperature was kept stable (22 °C day/ 20 °C night). Leaf initiation was noted when the leaf primordia were 1 mm long. SEM error bars are very short and thus hardly visible. a) paps1-4 shows the same leaf initiation rate like the wild type Col-0. In contrast, paps1-1 shows a delayed emergence of the first two to three leaves. Leaves 4 to 13 are emerging at similar rates in wild type and mutant. b) Two different paps2 paps4 lines exhibit a leaf initiation rate that is highly similar to that of the wild type.
Fig. 19 Flowering time of paps mutants under SD conditions. The total leaf number (a) and plant age in days to bolting (b) were determined when plants started to flower under SD conditions (8 h light, 22 °C/ 16 h darkness, 20 °C). While the paps2, paps4 and paps2 paps4 mutants behave similarly in LD and SD conditions, the early flowering phenotype of paps1 is enhanced compared to the phenotype under LD conditions (Fig. 17). P-values are Bonferroni-corrected and indicate significant differences to Col-0.
0
2
4
6
8
10
12
14
6 8 10 12 14 16 18 20 22
Col-0 paps2-3 paps4-3 paps2-2 paps4-2
0
2
4
6
8
10
12
14
6 8 10 12 14 16 18 20 22
Col-0 paps1-1 paps1-4
Nu
mb
er o
f vi
sib
le le
aves
(±
SEM
)
Nu
mb
er o
f vi
sib
le le
aves
(±
SEM
)
a) b)
Days after germination Days after germination
n = 15 n = 15
0
10
20
30
40
50
60
70
80
90
100
Flo
we
rin
gti
me
[To
tal l
eaf
nu
mb
er]
n ≥ 8
* p ˂ 0.05** p ˂ 0.01
**
0
10
20
30
40
50
60
70
80
90
100
110
120
*
Flo
we
rin
g ti
me
[Day
s to
bo
ltin
g]
a) b)
n ≥ 8
* p ˂ 0.05

Results 74
A standard FTA was performed under SD conditions and both TLN and age of the bolting plants were
noted (Fig. 19). Under SD conditions, the wild type Col-0 flowered with an average leaf number of 64
(and a median of 66). Both the paps2 and paps4 single and double mutants did not flower
significantly different to Col-0 (Fig. 19). However, a trend towards late flowering of paps2 paps4 is
notable. Under SD, the paps2/4 average TLN was increased by nine leaves compared to Col-0. The
median TLN difference (ΔTLN) of both lines was five leaves, which is similar to the value measured
under LD conditions (Fig. 17, Fig. 19). The paps1 mutant is responsive to the shorter light period, but
flowers again significantly earlier than Col-0, a phenotype reminiscent of that seen for the flc-3
mutant under SD conditions (Michaels & Amasino 2001). Moreover, an enhanced leaf initiation rate
defect might explain that the paps1-1 TLN is reduced more strongly than the age at bolting.
To determine whether the paps1 or the paps4 allele would dominate the flowering phenotype, a
double mutant was generated. If the mutations cause defects in different pathways, the resulting
flowering time could have been intermediate. However, when first analysed under standard growth
conditions, the paps1-1 paps4-3 double mutants were severely impaired in growth (Fig. 20 a).
Neither the rosette nor the inflorescences developed properly. The experiment was thus repeated
with plants grown under lower temperatures and at low light conditions. The mutant PAPS1 protein
in the paps1-1 line was previously proved to show strongly reduced activity at temperatures above
24 °C. Thus, the protein activity should be stabilized at a lower ambient temperature (18 °C at night,
21 °C during the day). Using low light conditions, oxidative stress in the leaves caused by excess light
should be reduced. Indeed, paps1-1 and the double mutant lines developed much better (Fig. 20 b).
Resembling the control, the paps1 paps4 double mutants exhibited slightly serrated leaves. However,
the offspring of two homozygous F3 lines behaved differentially (Fig. 20 b). Some individuals looked
similar to paps1-1, while others showed pleiotropic growth defects. These plants did not develop
proper shoots and inflorescences and were dwarf-like with bushy rosettes.
To note putative flowering defects, the flowering time of the two F3 lines was determined (Fig. 21).
With regard to the TLN, one line flowered with an average TLN intermediate between paps1 and
paps4, while the second line flowered similar to the paps1-1 control. This discrepancy arose from the
pleiotropic growth phenotypes observed in some individuals. The TLN could not be determined
reliably. Regarding the plant age, both lines flowered similarly to paps4-3. However, since the shoots
and inflorescences were partially stunted, it was not always possible to measure the plant age when
the stem was 1 cm long. In this cases flowering was defined as the day when shoot growth arrested.
The phenotyping difficulties are reflected by the high variation of both TLN and plant age at bolting.

Results 75
Fig. 20 The double mutant paps1-1 paps4-3 exhibits growth defects. Growth phenotype and flowering time of homozygous paps1-1 paps4-3 lines were tested under different growth conditions. a) Under standard conditions (LD; PAR 120 µmol photons/m2/s; temperature up to 24 °C), the paps1-1 paps4-3 rosette leaves could not develop properly. b) The double mutants were germinated on ½ MS medium and transferred to soil after seven days. Under low light and lower temperatures (LD; PAR 80 µmol photons/m2/s; 21 °C D/ 18 °C N), the double mutants grow larger, but partly still show stunted growth and leaf deformations.
Fig. 21 The flowering time of paps1-1 paps4-3 mutants varies between different lines. A flowering time analysis under low light and low temperature conditions was performed with two independent paps1-1 paps4-3 F3 lines (LD; PAR 80 µmol photons/m2/s; 21 °C D/ 18 °C N). a) TLN and b) days to bolting were determined when the plants started to flower. While double mutant line 1 flowers with an intermediate leaf number between the paps1 and paps4 control lines, double mutant line 2 flowers with a TLN similar to paps1-1. However, with regard to the plant age, both lines flower as late as paps4-3. P-values are Bonferroni-corrected.
a) b)
0
5
10
15
20
25
30
35
40
Flo
we
rin
g ti
me
[To
tal l
eaf
nu
mb
er]
n≥ 11* p ˂ 0.005** p ˂ 0.01
**
a)
0
10
20
30
40
50
60
70
80
n≥ 11
** p ˂ 0.01
Flo
we
rin
g ti
me
[Day
s to
bo
ltin
g] **
**b)
*

Results 76
In addition to the homozygous double mutant lines, the offspring of four F2 paps1-1/paps1-1
paps4-3/+ lines were tested. In an FTA, these lines also behaved very differently with regard to TLN
and days to bolting (data not shown). The proportion and degree of growth defects varied in the four
lines, increasing the difficulties to interpret the data.
3.1.2 Salicylic acid treatment does not change the paps mutant flowering time phenotype Plants flower early under diverse stress conditions. Martínez et al. (2004) found that early flowering
induced by excess UV-C light is mediated by the plant hormone salicylic acid (SA). Since
overexpression of the SA-degrading enzyme NahG, a salicylate hydroxylase, led to a moderate delay
in flowering under LD conditions (with Col-0 flowering with 11–12 leaves, and 35S::NahG mutants
flowering with 15–16 leaves), SA also seems to regulate flowering time in non-stressed plants
(Martínez et al. 2004; Lawton et al. 1995). The early flowering phenotype was found to be
independent from FLC. Consistently, late flowering autonomous pathway mutants were not
responsive to spraying with SA. Since the moderately late flowering phenotype of 35S::NahG plants is
reminiscent of the paps2/4 phenotype, it was tested whether paps mutants are responsive to SA.
Fig. 22 Flowering time of paps2-3 paps4-3 and wild type plants sprayed with 0.5 mM or 1 mM SA. Plants were grown under standard LD conditions and, starting at 10 DAG, sprayed with SA every other day. The SA treatment did not rescue the paps mutant phenotype. Instead, there was a trend towards a slight delay of flowering in SA-treated plants, which is significant in the wild type Col-0, but not in the mutant. P-values indicate significant difference to the mock-treated plants and are Bonferroni-corrected.
In a rescue experiment, plants were sprayed with low SA concentrations of 50 and 100 µM every
other day, a method used by Martínez et al. (2004). However, neither paps-1 nor paps2-3, paps4-3 or
paps2-3 paps4-3 exhibited altered flowering times compared to the non-treated control (data not
shown). Subsequently, the SA concentrations were increased to 0.5 and 1 mM. The paps2/4 double
mutant did still not exhibit a change in flowering time upon spraying with SA (Fig. 22).
0
5
10
15
20
25
30
mo
ck
0.5
mM
SA
1 m
M S
A
mo
ck
0.5
mM
SA
1 m
M S
A
Col-0 paps2-3 paps4-3
n ≥ 8* p ˂ 0.05
*
Flo
we
rin
g ti
me
[To
tal l
eaf
nu
mb
er]
Results 77
Instead, the flowering of Col-0 was slightly delayed by the treatment with 0.5 mM SA, but not with
1 mM SA. In contrast, Martínez et al. (2004) observed a very slight shift towards early flowering in
Col-0 sprayed with low concentrations of 50 and 100 µM SA. In either direction, the observed
phenotype is too subtle to explain the late flowering of the paps2 paps4 double mutant.
Interestingly, the SA content of paps1-1 was indistinguishable from that of the wild type (Trost 2014,
PhD thesis). Moreover, the phenotype of paps1-1 remained unchanged when the plant SA level was
reduced by the overexpression of NahG. These findings indicate that both the late flowering and the
early flowering phenotypes observed in different paps mutants are not caused by alterations in the
level of or the responsiveness to SA.
3.1.3 The paps mutant phenotype is based on a deregulation of FLC
Next it was asked, which flowering-regulating pathway could be deregulated in paps1 and in paps2
paps4. The focus was first set on the paps2/4 late flowering phenotype. Based on the mutant growth
phenotype and based on the performed FTAs (chapter 3.1.1), certain pathways could be ruled out.
Since the paps2/4 morphology is indistinguishable from that of the wild type, a defect in GA synthesis
or signalling is unlikely. The result of the SD-FTA indicates that the photoperiod pathway is not
involved. The leaf size and the leaf-initiation rate of the paps2/4 mutants are identical to the wild
type (Vi et al. 2013; chapter 3.1.1). Since misexpressions of miR156 and of SPL genes are often
associated with changes in leaf size or leaf initiation rate (Wang et al. 2008b; Wu et al. 2009), the
age-dependent pathway was left out of consideration. The reduction of PAPS1 activity results in a
reduced leaf size (Vi et al. 2013; Vi 2013, PhD thesis). A slight retardation of the primary leaf
development could only be observed for the paps1-1 mutant, but not for paps1-4 (Fig. 18), indicating
that the age-pathway is not causing the early flowering phenotype either. During experiments
performed during summers, paps2/4 plants grown under non-controlled temperature conditions
showed a reduced late flowering phenotype. It was concluded that temperature perception is not
impaired. In conclusion, a defect in the autonomous pathway seemed very likely.
First, the expression level of FLC, the main inhibitor of flowering, was tested. In a microarray
performed with paps1-1 and Ler RNA extracted from 10-day-old seedlings, the FLC mRNA level was
found to be reduced in paps1 (not shown). Reduced FLC expression or instability of the FLC transcript
in paps1-1 could indeed explain the observed early flowering phenotype. In nine-day-old seedlings, a
trend towards a lower FLC mRNA steady state level in paps1-1 could be confirmed by qPCR, but the
difference to the wild type Ler is not significant (Fig. 23). Since the FLCLer allele is weak and the
Landsberg accession flowers naturally early (Michaels et al. 2003), the experiment was repeated with
paps1-1 that had been backcrossed to Col-0. Indeed, the FLC mRNA level was strongly decreased in
paps1-1 expressing FLCCol compared to Col-0, but again the difference remained a trend.

Results 78
Fig. 23 A trend towards decreased FLC mRNA abundance can be observed in paps1-1. Seedlings used for the RNA extraction were grown at 21 °C under LD conditions for nine days. By qPCR, the FLC mRNA levels in paps1-1 in Ler (a) or Col-0 (b) background and in the respective wild type were determined. While the FLC abundance is decreased in paps1-1, in Col-0 even stronger than in Ler, the decrease remains an insignificant trend.
The FLC transcript level could be altered in paps2/4 as well. Indeed, nine-day-old paps2-3 paps4-3
seedlings exhibit a two-fold upregulated FLC mRNA level compared to Col-0, which could explain the
flowering inhibition observed (Fig. 24 a). In accordance, several floral pathway integrators were
found to be lowly expressed in the double mutant at nine DAG (Fig. 24 b). The transcript abundances
of the FPIs SOC1 and FT were significantly reduced in paps2/4. A trend towards lower expression of
AP1 and LFY could also be observed.
Fig. 24 Expression levels of FLC and of floral pathway integrators in paps2 paps4. The FLC mRNA abundance is increased in the paps2-3 paps4-3 double mutant. Floral pathway integrators show reduced expression levels. a) Col-0 and mutant seedlings were grown under LD conditions and were collected simultaneously for the measurement at three, six and nine DAG. b) Seedlings were grown under LD conditions and harvested at nine DAG. FT and SOC mRNA abundances are significantly reduced in paps2-3 paps4-3. AP1 and LFY are not reduced significantly, but a trend towards lower expression levels can be observed.
0.0
0.5
1.0
1.5
2.0
FLC
Ler paps1-1
n = 3* p ˂ 0.05
0.0
0.5
1.0
1.5
2.0
FLC
Col-0 paps1-1
Tran
scri
pt
abu
nd
ance
rel
ativ
e to
PD
F2(±
SEM
)
no
rmal
ized
to w
ild t
ype
n = 3* p ˂ 0.05
Tran
scri
pt
abu
nd
ance
rel
ativ
e to
PD
F2(±
SEM
)
no
rmal
ized
to w
ild t
ype
a) b)
0.0
0.5
1.0
1.5
2.0
AP1 LFY FT SOC1
Col-0 paps2-3 paps4-3
0.0
0.5
1.0
1.5
2.0
2.5
3.0
3 6 9
Age of seedling [days]
Col-0 paps2-3 paps4-3
FLC
tran
scri
pt
abu
nd
ance
rel
ativ
e to
PD
F2(±
SEM
)
no
rmal
ized
to w
ild t
ype
n = 3* p ˂ 0.05
a) b)
Tran
scri
pt
abu
nd
ance
rel
ativ
e to
PD
F2(±
SEM
)n
orm
aliz
ed t
o w
ild t
ype
n = 3* p ˂ 0.05** p ˂ 0.01
*
***

Results 79
To find out whether other flowering inhibitors might be involved in causing the paps2/4 phenotype,
transcript levels of SVP, FLM and MAF2 were inspected. The MADS box factor SVP represses the
expression of floral pathway integrators and directly interacts with FLC and FLM (Hartmann et al.
2000; Scortecci et al. 2003; Li et al. 2008). In Arabidopsis, five MAF (MADS AFFECTING FLOWERING)
transcription factors have been described. FLM, also termed MAF1, controls flowering in response to
ambient temperatures. Temperature-dependent alternative splicing of FLM leads to the splice
variants FLM and FLM. At lower temperatures the dominant form FLM interacts with SVP (Lee et
al. 2013; Posé et al. 2013). The repressive FLM-SVP complex binds promoters of FPI genes, like FT or
SOC1. As temperatures increase, the FLM splice variant is predominantly produced. The FLM-SVP
complex has a lower DNA-binding capacity, which antagonizes the flowering-inhibiting effect of SVP.
Fig. 25 Expression levels of SVP, FLM and MAF2 in paps2 paps4.
The SVP and FLM mRNA abundances are reduced in paps2-3 paps4-3. FLMδ and MAF2 do not show altered expression levels. Seedlings were grown under LD conditions and harvested at nine DAG. The SVP mRNA
abundance is significantly reduced in paps2 paps4. While the FLM splice variant is produced to a significantly lesser extent in paps2 paps4, the FLMδ splice variant and the MAF2 splice variant 2 (MAF2 var2) levels are unchanged. MAF2 splice variant 1 was not detected in the studied genotypes. P-values indicate significant difference
Surprisingly, the transcript levels of SVP and the FLM splice form were found to be halved in
paps2/4 (Fig. 25). svp mutants have been described to flower early due to increased FPI gene
expression (Li et al. 2008). The abundance of the FLM splice form is reduced while the level of FLMδ
is unchanged (Fig. 25). Interestingly, also in the wild type the ratio of FLM to FLMδ is less than one
(Table 5). Increased FLMδ values indicate high ambient temperatures (Posé et al. 2013). The samples
for the experiment were collected in June 2013 in a growth chamber without temperature control,
which exhibited slightly elevated ambient temperatures. Indeed, in a simultaneously performed
flowering time analysis the average ΔTLN between Col-0 and paps2-3 paps4-3 was only three to four
leaves (Fig. 32 a), while in earlier experiments a ΔTLN of eight had been determined (Fig. 17).
0.0
0.5
1.0
1.5
2.0
SVP FLM b FLM d MAF2 var2
Col-0 paps2-3 paps4-3
*
Tran
scri
pt
abu
nd
ance
rel
ativ
e to
PD
F2(±
SEM
)n
orm
aliz
edto
wild
typ
e
FLM FLM
n = 3* p ˂ 0.05
*
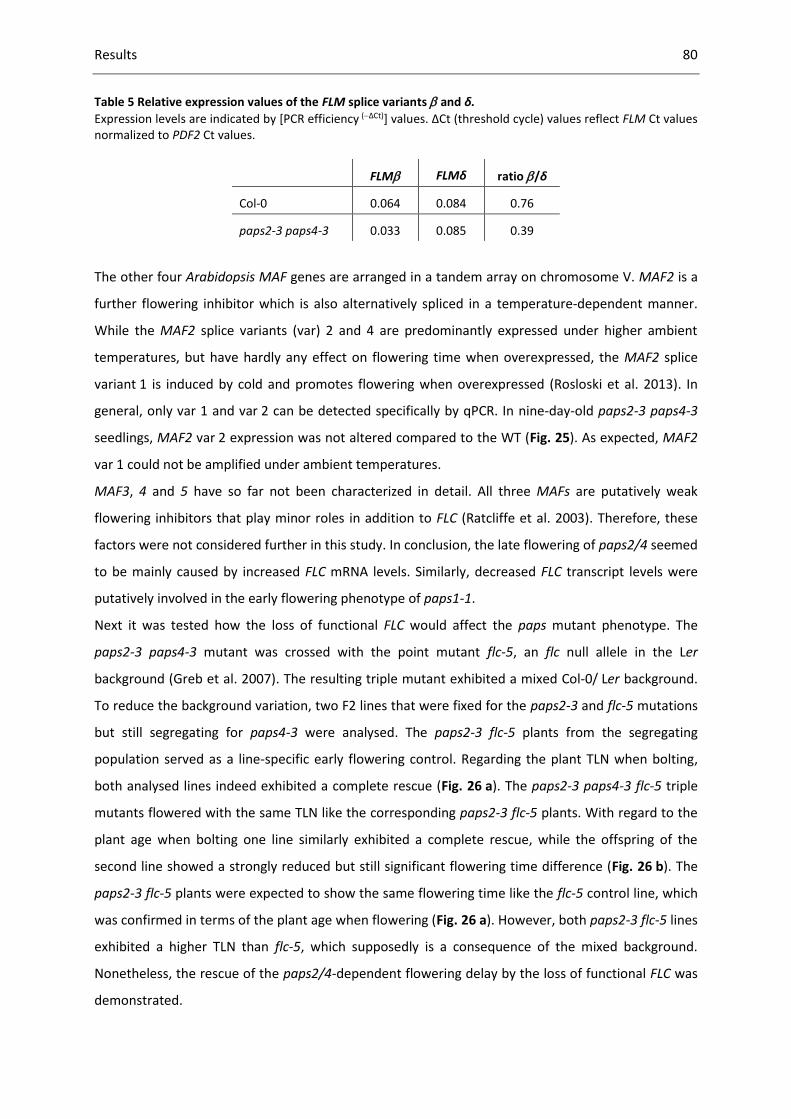
Results 80
Table 5 Relative expression values of the FLM splice variants and δ.
Expression levels are indicated by [PCR efficiency (ΔCt)] values. ΔCt (threshold cycle) values reflect FLM Ct values normalized to PDF2 Ct values.
FLM FLMδ ratio /δ
Col-0 0.064 0.084 0.76
paps2-3 paps4-3 0.033 0.085 0.39
The other four Arabidopsis MAF genes are arranged in a tandem array on chromosome V. MAF2 is a
further flowering inhibitor which is also alternatively spliced in a temperature-dependent manner.
While the MAF2 splice variants (var) 2 and 4 are predominantly expressed under higher ambient
temperatures, but have hardly any effect on flowering time when overexpressed, the MAF2 splice
variant 1 is induced by cold and promotes flowering when overexpressed (Rosloski et al. 2013). In
general, only var 1 and var 2 can be detected specifically by qPCR. In nine-day-old paps2-3 paps4-3
seedlings, MAF2 var 2 expression was not altered compared to the WT (Fig. 25). As expected, MAF2
var 1 could not be amplified under ambient temperatures.
MAF3, 4 and 5 have so far not been characterized in detail. All three MAFs are putatively weak
flowering inhibitors that play minor roles in addition to FLC (Ratcliffe et al. 2003). Therefore, these
factors were not considered further in this study. In conclusion, the late flowering of paps2/4 seemed
to be mainly caused by increased FLC mRNA levels. Similarly, decreased FLC transcript levels were
putatively involved in the early flowering phenotype of paps1-1.
Next it was tested how the loss of functional FLC would affect the paps mutant phenotype. The
paps2-3 paps4-3 mutant was crossed with the point mutant flc-5, an flc null allele in the Ler
background (Greb et al. 2007). The resulting triple mutant exhibited a mixed Col-0/ Ler background.
To reduce the background variation, two F2 lines that were fixed for the paps2-3 and flc-5 mutations
but still segregating for paps4-3 were analysed. The paps2-3 flc-5 plants from the segregating
population served as a line-specific early flowering control. Regarding the plant TLN when bolting,
both analysed lines indeed exhibited a complete rescue (Fig. 26 a). The paps2-3 paps4-3 flc-5 triple
mutants flowered with the same TLN like the corresponding paps2-3 flc-5 plants. With regard to the
plant age when bolting one line similarly exhibited a complete rescue, while the offspring of the
second line showed a strongly reduced but still significant flowering time difference (Fig. 26 b). The
paps2-3 flc-5 plants were expected to show the same flowering time like the flc-5 control line, which
was confirmed in terms of the plant age when flowering (Fig. 26 a). However, both paps2-3 flc-5 lines
exhibited a higher TLN than flc-5, which supposedly is a consequence of the mixed background.
Nonetheless, the rescue of the paps2/4-dependent flowering delay by the loss of functional FLC was
demonstrated.

Results 81
Fig. 26 The late flowering phenotype of paps2-3 paps4-3 is rescued by the flc-5 (Ler) mutation. The paps2-3 and paps4-3 alleles are in Col-0. flc-5 is a point mutant null allele in the Ler background. To reduce background variation, an FTA was performed comparing the homozygous offspring of two paps2-3 paps4-3/+ flc-5 lines. a) Regarding the TLN at bolting, the late flowering phenotype of paps2-3 paps4-3 was completely abolished by the loss of FLC activity. b) With regard to the age when bolting, line 1 exhibited a complete rescue, while the paps2-3 paps4-3 flc-5 triple mutant derived from line 2 shows a strongly reduced phenotype.
To confirm the rescue without background variation and to gain insights into the genetic interaction
of PAPS1 and FLC, the paps1-1 and paps2-3 paps4-3 mutants were crossed with the Col-0 allele flc-2.
Due to a 30 kb deletion, the FLC activity is completely eliminated in the fast-neutron flc-2 mutant
(Michaels and Amasino 1999; Michaels et al. 2003). A comparative FTA under LD conditions revealed
that the loss of FLC did not enhance the early flowering phenotype of paps1-1 (Fig. 27 a, c). The
double mutant paps1-1 flc-2 and the respective single mutants flowered early with an identical TLN.
This finding underlines that reduced FLC expression levels cause the early flowering phenotype
observed in paps1 mutants.
0
5
10
15
20
25
30
**
n ≥16** p ˂ 0.01
Flo
we
rin
g Ti
me
[To
tall
eaf
nu
mb
er]
0
5
10
15
20
25
30
35
40
Flo
we
rin
g ti
me
[Day
sto
bo
ltin
g]
n≥16
* p ˂ 0.05** p ˂ 0.01
**
*
a)
b)

Results 82
Next, the offspring of two paps2-3 paps4-3/+ flc-2 lines was analysed. As expected, in a Col-0
background the paps2-3 flc-2 plants flowered as early as flc-2 with regard to both TLN and age when
bolting (Fig. 27 b, d). However, surprisingly the reduction of the flowering time difference between
paps2-3 flc-2 and paps2-3 paps4-3 flc-2 was less pronounced compared to the results gained with the
flc-5 allele. While the average ΔTLN between paps2-3 and paps2-3 paps4-3 was seven, in the flc-2
background the ΔTLN was reduced to three to four leaves (Fig. 27 b). Regarding the plant age, the
flowering difference of seven days in the FLCCol background was reduced to four days in line 1, but
still comprised six days in line 2 (Fig. 27 d).
Fig. 27 Flowering time of paps mutants in an flc-2 (Col-0) background. A comparative flowering time analysis with representative paps and flc-2 mutant lines was performed under LD conditions and stable temperatures (22 °C day/ 20 °C night). a, c) The loss of functional FLC does not enhance the early flowering phenotype of paps1-1. b, d) The offspring of two paps2-3 paps4-3/+ flc-2 lines was analysed. Comparing paps2-3 flc-2 and paps2-3 paps4-3 flc-2, the deletion of the FLC gene partially rescues the late flowering phenotype of paps2 paps4. The total leaf number (a, c) and the plant age in days (b, d) were determined when the plants were bolting. P-values indicate significant difference and are Bonferroni-corrected.
0
5
10
15
20
25
30
Flo
we
rin
gti
me
[To
tal l
eaf
nu
mb
er]
0
5
10
15
20
25
30
Flo
we
rin
gti
me
[To
tal l
eaf
nu
mb
er]
0
10
20
30
40
50
Flo
we
rin
gti
me
[Age
to
bo
ltin
g]
0
10
20
30
40
50
Flo
we
rin
gti
me
[Age
to
bo
ltin
g]
a) b)
c) d)
n≥20** p ˂ 0.01
**
****
**
**
**
n≥20** p ˂ 0.01
n≥20** p ˂ 0.01
n≥20** p ˂ 0.01

Results 83
These results indicate that the increased FLC transcript level detected in paps2/4 is not the only
component responsible for the late flowering phenotype. Other yet unidentified factors seem to
contribute to the phenotype. In contrast, the early flowering phenotype of paps1 was not additive
with the loss of FLC activity. Supposedly, PAPS1 is required to maintain FLC expression or FLC
transcript stability.
3.1.4 PAPS1 and PAPS2/PAPS4 act independently from CstF64 and FY Since knocking down the function of essential polyadenylation factors like CstF64 and FY results in a
delay of flowering (Henderson et al. 2005; Liu et al. 2010), it was checked whether these components
act in the same pathway like PAPS1 and PAPS2/4. The mutant cstf64-1 was identified as a sof
(suppressor of overexpressed FCA) mutant in the Ler background. With a ΔTLN of 10 when bolting
compared to Ler, cstf64-1 exhibits a moderate delay in flowering (Liu et al. 2010). An alternative
mutant allele cstf64-2, a T-DNA insertion line in Col-0, shows pleiotropic defects including reduced
fertility (Liu et al. 2010). Thus, the cstf64-1 allele was used for the genetic analysis. While paps1-1
cstf64-1 double mutants are embryo lethal (Vi et al. 2013), paps2 paps4 cstf64-1 triple mutants are
viable. Importantly, only F2 plants containing the FLCCol allele were selected for the flowering time
analysis in the following experiments. First, the phenotypic effects caused by cstf64-1 in a mixed
Col-0/Ler background were determined examining two cstf64-1/+ F2 lines (Fig. 28 a).
Fig. 28 Regarding flowering time, PAPS2/PAPS4 and CstF64 act in independent pathways. a) In a mixed background of Col-0 and Ler, the cstf64-1 mutation delays flowering for two to three days. Two independent cstf64-1/+ lines homozygous for FLCCol were tested under LD conditions. b) The effect of the loss of Cstf64 on paps2 paps4 mutants was tested with a paps2-3 paps4-3/+ cstf64-1 line homozygous for FLCCol. While paps2-3 cstf64-1 flowers like cstf64-1, the triple mutant paps2-3 paps4-3 cstf64-1 flowers significantly later than the individual control lines. P-values are Bonferroni-corrected.
0
5
10
15
20
25n≥20** p ˂ 0.01
0
5
10
15
20
25n≥20** p ˂ 0.01
Flo
we
rin
g ti
me
[To
tall
eaf
nu
mb
er]
Flo
we
rin
g ti
me
[To
tall
eaf
nu
mb
er]
** **
**
a) b)

Results 84
With a ΔTLN of two to three leaves, the flowering time delay caused by the loss of CstF64 activity was
less pronounced in the mixed background than in the Ler background, but is still significant. Next, a
comparative FTA was performed with an F2 line homozygous for the FLCCol, cstf64-1 and paps2-3
alleles and heterozygous for paps4-3 (Fig. 28 b). The flowering times of the homozygous paps4-
3/paps4-3 and PAPS4/PAPS4 F3 plants were compared. While paps2-3 cstf64-1 flowers like the
cstf64-1 single mutant, paps2-3 paps4-3 cstf64-1 triple mutants flower later than all individual single
mutants. This result indicates that CstF64 and PAPS2/4 act independently from each other.
Next, the effect of reduced FY activity in the paps mutant background was tested. Complete null
mutations in AtFY result in embryo lethality. Therefore, paps1 and paps2/4 were crossed to the
knockdown mutant fy-2 (Col-0), a T-DNA insertion mutant that flowers with approximately 55 leaves
(Henderson et al. 2005). Homozygous paps1-1 fy-2 and paps2-3 paps4-3 fy-2 lines were used for a
comparative FTA (Fig. 29). The large-scale experiment was performed in spring in a glass house under
LD conditions. The fy-2 control line flowered with a TLN of 33, earlier than documented (Henderson
et al. 2005). The flowering behaviour of all paps mutant control lines corresponded to previous
experiments (e.g Fig. 17). Interestingly, the combination of mutant paps1 and fy knockdown alleles is
not lethal, although FY is an important and multifunctional polyadenylation factor. While the paps1-1
fy-2 double mutant shows a flowering phenotype intermediate to the two controls, the effects of
paps2-3 paps4-3 and fy-2 are additive. Both double and triple mutant phenotypes can be interpreted
as additive in a multiplicative manner, which indicates that all three PAPSs act independently from
FY. Thus, both CstF64 and FY are functional in paps mutant backgrounds and do not seem to cause
the mutant flowering phenotypes.
Fig. 29 Regarding flowering time, FY acts independently from PAPS1 and PAPS2/PAPS4. The experiment was performed under LD conditions in a glass house. While the paps1-1 fy-2 mutant shows an intermediate phenotype between paps1-1 and fy-2, the paps2-3 paps4-3 fy-2 triple mutant flowers later than paps2-3 paps4-3 or fy-2. P-values are Bonferroni-corrected.
0
10
20
30
40
50
60
70
Flo
wer
ing
tim
e [T
ota
llea
fn
um
ber
]
**
**
n ≥20** p ˂ 0.01
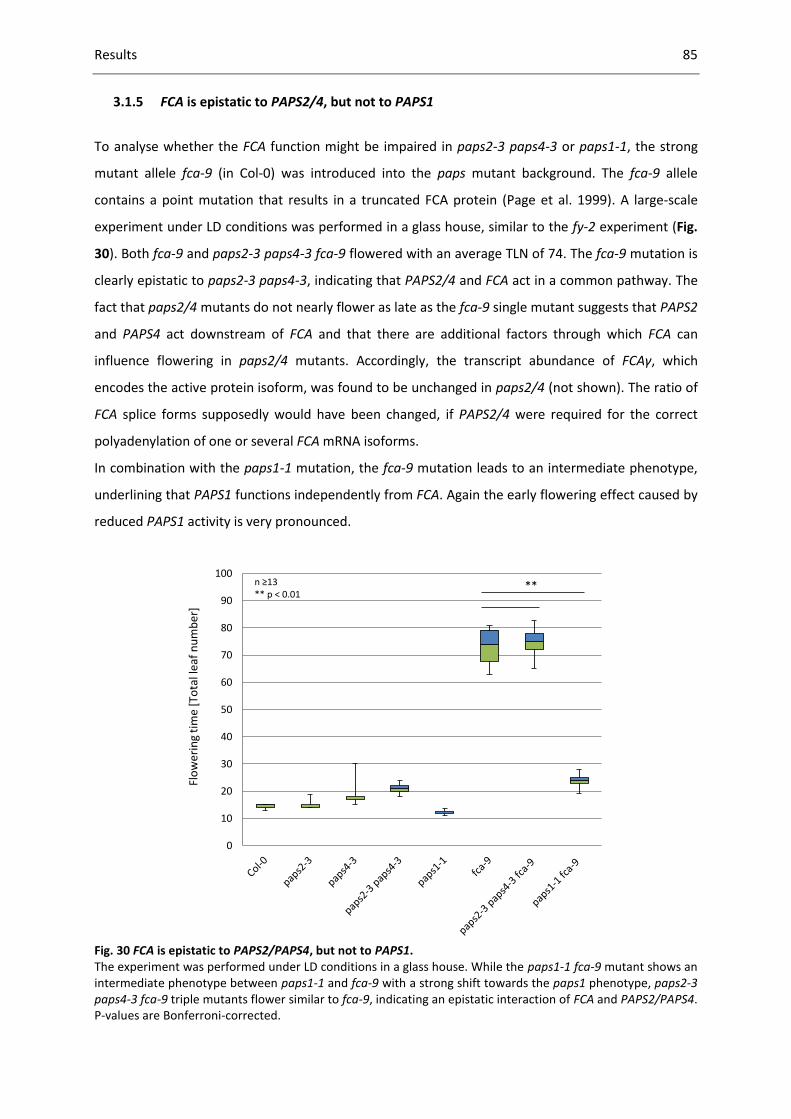
Results 85
3.1.5 FCA is epistatic to PAPS2/4, but not to PAPS1
To analyse whether the FCA function might be impaired in paps2-3 paps4-3 or paps1-1, the strong
mutant allele fca-9 (in Col-0) was introduced into the paps mutant background. The fca-9 allele
contains a point mutation that results in a truncated FCA protein (Page et al. 1999). A large-scale
experiment under LD conditions was performed in a glass house, similar to the fy-2 experiment (Fig.
30). Both fca-9 and paps2-3 paps4-3 fca-9 flowered with an average TLN of 74. The fca-9 mutation is
clearly epistatic to paps2-3 paps4-3, indicating that PAPS2/4 and FCA act in a common pathway. The
fact that paps2/4 mutants do not nearly flower as late as the fca-9 single mutant suggests that PAPS2
and PAPS4 act downstream of FCA and that there are additional factors through which FCA can
influence flowering in paps2/4 mutants. Accordingly, the transcript abundance of FCAγ, which
encodes the active protein isoform, was found to be unchanged in paps2/4 (not shown). The ratio of
FCA splice forms supposedly would have been changed, if PAPS2/4 were required for the correct
polyadenylation of one or several FCA mRNA isoforms.
In combination with the paps1-1 mutation, the fca-9 mutation leads to an intermediate phenotype,
underlining that PAPS1 functions independently from FCA. Again the early flowering effect caused by
reduced PAPS1 activity is very pronounced.
Fig. 30 FCA is epistatic to PAPS2/PAPS4, but not to PAPS1. The experiment was performed under LD conditions in a glass house. While the paps1-1 fca-9 mutant shows an intermediate phenotype between paps1-1 and fca-9 with a strong shift towards the paps1 phenotype, paps2-3 paps4-3 fca-9 triple mutants flower similar to fca-9, indicating an epistatic interaction of FCA and PAPS2/PAPS4. P-values are Bonferroni-corrected.
0
10
20
30
40
50
60
70
80
90
100
Flo
wer
ing
tim
e [
Tota
llea
fn
um
ber
]
n ≥13** p ˂ 0.01
**

Results 86
The flowering time of the paps1-1 fca-9 double mutant is strongly shifted towards the early flowering
phenotype of paps1-1, which most likely reflects the defective FLC expression in paps1 that has been
shown before (Fig. 23, Fig. 27). Next, the effect of the loss of PAPS1 or PAPS2/PAPS4 was tested in an
FCAy-overexpressing (OE) background, in which the FLC steady state abundance is strongly
decreased, resulting in early flowering (Macknight et al. 2002). Indeed, the 35S::FCAγ-OE line flowers
on average three leaves and five days earlier than the wild type Col-0 (Fig. 31).
Fig. 31 Overexpression of FCA splice form γ in paps mutants. The overexpression of FCA does not rescue the paps2-3 paps4-3 late flowering phenotype and does not increase the early flowering phenotype of paps1-1. In the early flowering 35S::FCAγ-OE line, the splice form FCAγ encoding the functional FCA protein is overexpressed. To analyse the overexpression effect in a paps mutant background, the offspring of paps2-3 paps4-3/+ 35S::FCAγ and paps1-1 35S::FCAγ were analysed. a) Regarding the TLN when flowering, the paps1-1 FCAγ-OE line flowers as early as paps1-1. While the paps2-3 35S::FCAγ-OE flowers early, the paps2-3 paps4-3 35S::FCAγ-OE plants derived from the same parental line are only partially rescued. b) With regard to the plant age when flowering, the control lines paps1-1 and 35S::FCAγ flower at the same time like the paps1-1 35S::FCAγ-OE mutant. The experiment was performed under LD conditions with controlled temperature (22 °C D/20 °C N). P-values are Bonferroni-corrected.
0
10
20
30
40
50
60
Flo
we
rin
g ti
me
[Day
sto
bo
ltin
g]
n ≥16** p ˂ 0.01
**
b)**
0
5
10
15
20
25
30
35
Flo
we
rin
g ti
me
[To
tall
eaf
nu
mb
er] n ≥16
** p ˂ 0.01
**
**
a)**
Results 87
An identical acceleration of flowering was observed upon loss of FLC activity (Fig. 27). If residual FLC
activity was still present in paps1-1, the paps1-1 FCAγ-OE double mutant would be expected to
exhibit an additive phenotype. With an average ΔTLN of two leaves, the paps1-1 FCAγ-OE flowered
indeed significantly earlier than the 35S::FCAγ-OE control, but with regard to the plant age when
bolting, both lines flowered at the same time (Fig. 31). This discrepancy reflects the leaf initiation
rate defect conferred by the paps1-1 mutation (Fig. 18). The identical age of paps1-1 and paps1-1
FCAγ-OE when flowering underlines the virtual lack of functional FLC in paps1.
In contrast, the late flowering phenotype of paps2-3 paps4-3 is only partially rescued by the OE of
FCAγ (Fig. 31). The flowering time difference between Col-0 and the FCAγ-OE line comprises on
average three leaves, the median ΔTLN are four leaves (Fig. 31). Both median and average ΔTLN
between paps2 paps4 and paps2 paps4 FCAγ-OE triple mutant are significantly different but
comprise only two leaves, meaning that both phenotypes are not simply additive. Since the FCAγ
transcript that is expressed from the 35S-promoter does not contain the FCA-specific 3’ UTR, it
cannot be directly affected by altered polyadenylation due to the loss of PAPS2/4. Apparently, the
FCAγ protein is functional but due to the lack of PAPS2/4 activity it cannot exhibit its function
completely. If the defective polyadenylation of FCA in paps2/4 had caused the late flowering
phenotype, the 35S::FCAγ should have rescued the mutant phenotype completely.
It is more likely that PAPS2/4 indeed act downstream of FCA. It has been suggested before that FCAγ
downregulates FLC by regulating the alternative 3’ end processing of the two COOLAIR antisense
RNAs that are required for the downregulation of the FLC sense expression (e.g.Liu et al. 2010;
chapter 1.2.3). PAPS2/4 might for example aid this regulatory mechanism by polyadenylating
COOLAIR. The low FLC sense transcript abundance observed in paps1 could reflect a function of
PAPS1 in polyadenylating FLC sense mRNA. In concert with FCA, PAPS2/4 might in turn be required
for the timely repression of FLC expression.
3.1.6 The vernalization pathway is functional in paps mutants
Independent of the autonomous pathway, the vernalization pathway regulates the expression of FLC
in response to cold. In autonomous pathway mutants, the vernalization response is not impaired
since the two pathways do not share major components. Instead, prolonged cold leads to chromatin
modifications at the FLC locus by a polycomb group complex (Andrés and Coupland 2012). Moreover,
two FLC antisense RNAs termed COOLAIR and an intronic lncRNA termed COLDAIR are involved in the
regulation of the vernalization response (Swiezewski et al. 2009; Heo and Sung 2011). The antisense
mRNAs are implicated in both the autonomous and the vernalization pathway. To analyse whether
the vernalization response is impaired in the paps mutant background, an active FRI allele from the
accession San Feliu-2 (Sf-2) was crossed into paps2-3 paps4-3 to strongly increase the FLC expression.

Results 88
The experiment could not be performed with paps1-1 mutants, because paps1 plants are cold-
sensitive (Kappel et al., submitted; chapter 3.2.2).
As reflected by the strong increase in flowering time, the FRISf-2 allele entailed a massive upregulation
of the FLC expression in paps2/4 (Fig. 32 a). Interestingly, despite a high degree of flowering time
variation, paps2-3 paps4-3 FRISf-2 did flower significantly later than Col-0 FRISf-2. After a six-week
period of growth at 4 °C, the flowering time of paps2-3 paps4-3 FRISf-2 was strongly reduced (Fig.
32 b). However, both in the presence and absence of the FRISf-2 allele, the late flowering phenotype
of paps2-3 paps4-3 was only partially reduced by prolonged cold (Fig. 32 b).
An explanation for the incomplete rescue could be a defective vernalization response and thus an
incomplete downregulation of FLC. Alternatively, the unknown components delaying flowering of
paps2/4 might not be responsive to vernalization. Therefore, it was checked whether the observed
flowering time changes were reflected by altered FLC steady state abundances. Indeed, the
prolonged cold leads to a strong reduction in the FLC transcript amount (Fig. 33). However, several
discrepancies between the measured FLC level and the FTA were revealed. Compared to the FRICol-0
containing control lines, even after six weeks of vernalization and five days of recovery under
elevated ambient temperatures, the FLC mRNA level was not fully downregulated in the FRISf-2 lines.
This was an unexpected result, considering that previously published analyses documented a
complete downregulation of FLC expression during this time period (e.g. Sung and Amasino 2004;
Angel et al. 2011). In a repetition of the experiment, even after eight weeks of vernalization and five
days of recovery the FLC level was still significantly upregulated in the FRISf-2 lines compared to the
FRICol-0 lines (data not shown).
Regarding the control lines Col-0 and paps2-3 paps4-3 after six weeks of vernalization, there is still a
significant difference in the FLC transcript abundance, which is reflected by a ΔTLN of two leaves (Fig.
32 b). With an introduced FRISf-2 allele the ΔTLN between both lines is increased to four leaves.
However, this flowering time difference is not reflected by significantly different FLC levels (Fig. 33).
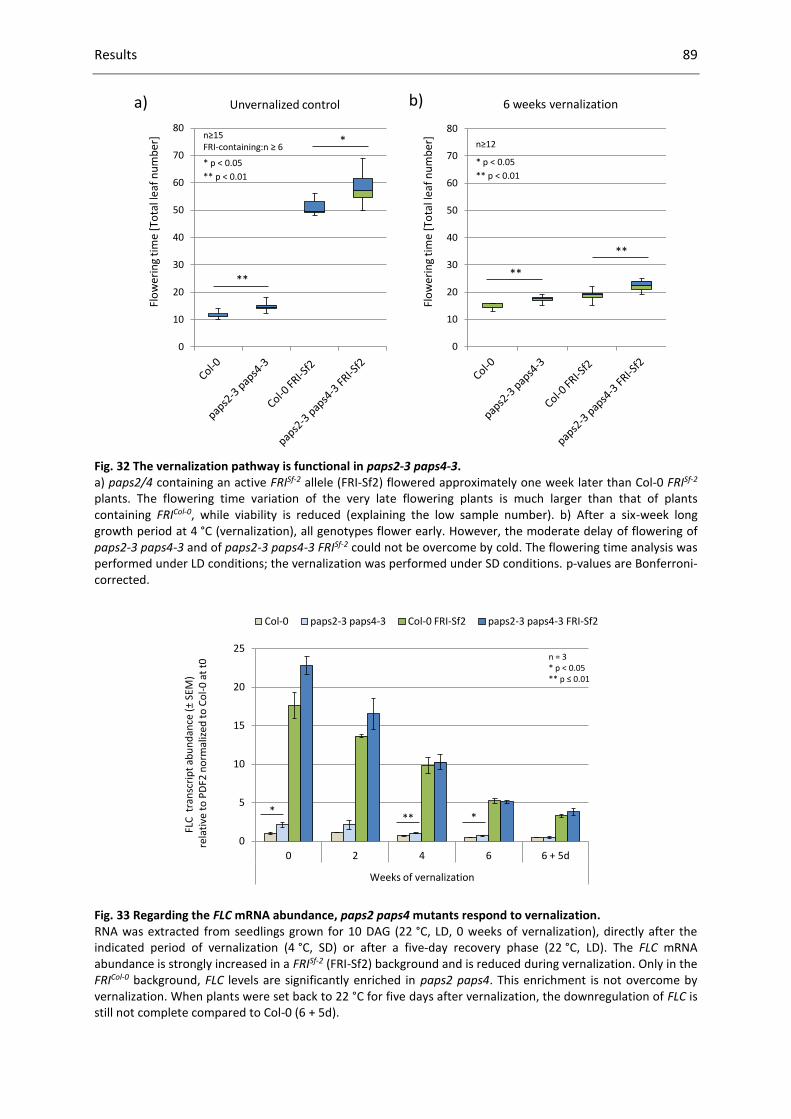
Results 89
Fig. 32 The vernalization pathway is functional in paps2-3 paps4-3. a) paps2/4 containing an active FRISf-2 allele (FRI-Sf2) flowered approximately one week later than Col-0 FRISf-2 plants. The flowering time variation of the very late flowering plants is much larger than that of plants containing FRICol-0, while viability is reduced (explaining the low sample number). b) After a six-week long growth period at 4 °C (vernalization), all genotypes flower early. However, the moderate delay of flowering of paps2-3 paps4-3 and of paps2-3 paps4-3 FRISf-2 could not be overcome by cold. The flowering time analysis was performed under LD conditions; the vernalization was performed under SD conditions. p-values are Bonferroni-corrected.
Fig. 33 Regarding the FLC mRNA abundance, paps2 paps4 mutants respond to vernalization. RNA was extracted from seedlings grown for 10 DAG (22 °C, LD, 0 weeks of vernalization), directly after the indicated period of vernalization (4 °C, SD) or after a five-day recovery phase (22 °C, LD). The FLC mRNA abundance is strongly increased in a FRISf-2 (FRI-Sf2) background and is reduced during vernalization. Only in the FRICol-0 background, FLC levels are significantly enriched in paps2 paps4. This enrichment is not overcome by vernalization. When plants were set back to 22 °C for five days after vernalization, the downregulation of FLC is still not complete compared to Col-0 (6 + 5d).
0
10
20
30
40
50
60
70
80
0
10
20
30
40
50
60
70
80n≥15FRI-containing:n ≥ 6
* p ˂ 0.05
** p ˂ 0.01
n≥12
* p ˂ 0.05
** p ˂ 0.01
Flo
we
rin
g ti
me
[To
tal l
eaf
nu
mb
er]
Flo
we
rin
g ti
me
[To
tal l
eaf
nu
mb
er]
a) b)Unvernalized control 6 weeks vernalization
**
**
**
*
0
5
10
15
20
25
0 2 4 6 6 + 5d
Weeks of vernalization
Col-0 paps2-3 paps4-3 Col-0 FRI-Sf2 paps2-3 paps4-3 FRI-Sf2
FLC
tra
nsc
rip
t ab
un
dan
ce(±
SEM
)re
lati
ve t
o P
DF2
no
rmal
ized
to
Co
l-0
at t
0 n = 3* p ˂ 0.05** p ≤ 0.01
*** *
Results 90
This result implies that flowering time inhibitors other than FLC exhibit a defective regulation in
paps2-3 paps4-3. This view becomes even more likely considering that the six-fold increased FLC
transcript amount in Col-0 FRISf-2 compared to Col-0 is transduced into a similar ΔTLN of four leaves
when bolting. Apparently, at such low levels even significant variations in the total amount of FLC
transcript do not influence flowering times to a high extent anymore.
As observed before, unusual FLC levels can result from defective processing of the abovementioned
FLC antisense RNAs (Liu et al. 2010). Thus, in parallel to the FLC measurements, the FLC antisense
(AS) RNA amounts were determined (Fig. 34). Before vernalization, the COOLAIR RNA abundance was
very low in all genotypes. Regarding the normalized Ct-values obtained by qPCR, the expression of
both AS RNAs was two orders of magnitude lower than the expression of the FLC sense transcript.
These values are consistent with previously published data (Duc et al. 2013; Rataj and Simpson
2014). Interestingly, the expression of FLC AS class II was significantly increased in both FRISf-2
containing lines compared to the FRICol lines (Fig. 34 b, not marked in the figure).
As described before, the expression of FLC AS class I was strongly induced in all backgrounds upon
cold exposure (Swiezewski et al. 2009). However, in contrast to the previous findings, the COOLAIR
expression did not decrease after two weeks in the FRISf-2 lines, but remained at high levels during
the entire cold period. After six weeks of cold, the abundance of FLC AS class I was significantly
higher in paps2-3 paps4-3 compared to Col-0 (Fig. 34 a). This observation could be explained by a
decelerated decrease of FLC AS class I expression over time. When returned to 22 °C after six weeks
of cold, the FLC AS class I was downregulated in all genotypes.
In contrast, the COOLAIR class II abundance was downregulated over time in the cold in all
backgrounds. Analysing the FLC AS class II in paps2/4 compared to Col-0, there were only very minor
and sometimes contradictory changes in the expression behaviour. These subtle differences are
probably due to the generally low COOLAIR transcript abundance. Strikingly, when the plants were
returned to warm ambient temperatures, the FLC AS class II abundance reversed in paps2/4
compared to Col-0. Regardless of the FRI allele, the transcript level was significantly increased in
paps2/4.
To test whether the oligonucleotides from Hornyik et al. (2010) that were used for this experiment
indeed only amplified the desired fragments, the melting curves determined by the LC480 were
analysed. While there was only one PCR product amplified in the COOLAIR class I samples, two peaks
appeared in FLC AS class II PCR samples that were harvested in the cold. These qPCR products were
analysed on an agarose gel (Fig. 35).

Results 91
Fig. 34 Transcript abundances of the FLC antisense classes I and II behave oppositely during vernalization. RNA was extracted from seedlings grown for 10 DAG (22 °C, LD, 0 weeks of vernalization), directly after the indicated period of vernalization (4 °C, SD) or after a five-day recovery phase (22 °C, LD). a) The FLC antisense class I mRNA abundance is increased during vernalization. Only after six weeks of vernalization a significant increase in expression can be observed in paps2 paps4 FRICol-0 seedlings compared to Col-0. b) In a FRISf-2 background, the FLC antisense class II mRNA content is increased. The expression level decreases over time during the period of cold. After returning seedlings to 22 °C, the abundance is significantly increased in paps2 paps4 mutant lines.
0.0
10.0
20.0
30.0
40.0
0 2 4 6 6 + 5d
Weeks of vernalization
Col-0 paps2-3 paps4-3 Col-0 FRI-Sf2 paps2-3 paps4-3 FRI-Sf2
FLC
An
tise
nse
Cla
ss I
tran
scri
pt
abu
nd
ance
(±SE
M)
rela
tive
to
PD
F2 n
orm
aliz
ed t
o C
ol-
0at
t0
**
n = 3** p ≤ 0.01
a)
0.0
1.0
2.0
3.0
4.0
5.0
0 2 4 6 6 + 5d
Weeks of vernalization
Col-0 paps2-3 paps4-3 Col-0 FRI-Sf2 paps2-3 paps4-3 FRI-Sf2
FLC
An
tise
nse
Cla
ss II
tra
nsc
rip
t ab
un
dac
e(±
SEM
)re
lati
ve t
o P
DF2
no
rmal
ized
to
Co
l-0
at t
0 n = 3* p ˂ 0.05
*
*
*
*
b)

Results 92
Fig. 35 Upon vernalization, a second splice form of FLC antisense class II appears. A quantitative real time-PCR was performed for 40 cycles and PCR products were separated on an agarose gel. RNA was extracted from seedlings grown on ½ MS medium at ten DAG (22 °C, LD) or after the indicated period of vernalization (4 °C, SD).
Indeed, upon cold exposure, a larger PCR product appears. Alternative splicing of FLC AS class II had
been observed by Hornyik et al. (2010) and the documented product sizes that were gained with the
primer pair used are consistent with the PCR products obtained in this experiment. Samples that had
been returned to 22 °C for five days predominantly expressed the shorter splice form (data not
shown). To get a higher resolution and to see possible differences in abundance between paps2/4
and the wild type more in detail, COOLAIR class II was amplified with a reduced cycle number by
semi-qPCR. However, due to the very low expression levels of COOLAIR class II, the attempt failed.
There was hardly any amplification and the bands in the agarose gels were too thin to discriminate
between wild type and mutant (data not shown).
Thus, it can be concluded that the overall COOLAIR class II transcript abundance is increased in the
paps2/4 mutant samples compared to Col-0 upon return to warm ambient temperatures, but no
conclusion can be drawn with regard to alternative splicing patterns. However, no significant
difference in COOLAIR transcript abundance between mutant and wild type could be observed at
time point zero, which corresponds to ten day-old-seedlings grown under standard LD conditions
(Fig. 34). This might imply that COOLAIR expression is not defective in paps2/4. Similarly, the very low
COOLAIR expression levels complicate the detection of genotype-specific abundance differences,
especially regarding the alternative splicing patterns. It can furthermore be stated that the
vernalization pathway is functional in paps2/4 double mutants. Both the upregulation of FLC
expression by active FRI and the drastic drop of FLC transcript levels upon prolonged cold exposure
can be observed despite the lack of PAPS2 and PAPS4 function.
Control (10 DAG)
Col-0paps2-3paps4-3
paps2-3paps4-3FRI-Sf2
Col-0FRI-Sf2bp
500
300
200
100
2 weeks of vernalization
4 weeks of vernalization
bp500
300
200
100
6 weeks of vernalization
Col-0paps2-3paps4-3
paps2-3paps4-3FRI-Sf2
Col-0FRI-Sf2
Col-0paps2-3paps4-3
paps2-3paps4-3FRI-Sf2
Col-0FRI-Sf2 Col-0
paps2-3paps4-3
paps2-3paps4-3FRI-Sf2
Col-0FRI-Sf2

Results 93
3.1.7 FLC and COOLAIR poly(A) tail lengths are not altered in paps2 paps4
An obvious effect to be expected in a poly(A) polymerase mutant are changes in poly(A) tail (PAT)
lengths of mRNAs, which would be most certainly shortenings. As described in the introductory
chapter 1.1.4, altered tail lengths might cause defects in mRNA stability, translatability or nuclear
export. To address the question whether altered transcript abundance levels in paps mutants might
be due to defective polyadenylation, a fractionation of RNA isolated from Col-0 and paps2-3 paps4-3
according to PAT lengths was performed in a small-scale approach. The mRNA fractionation method
used is explained in detail in chapter 3.4.2. It had previously been applied in a large-scale procedure
to detect global PAT changes in paps1-1 and was validated in detail by a bioinformatics analysis
(fractionation performed by Gerda Trost; Kappel et al. submitted). Since the strongest increase in FLC
abundance in paps2/4 had been observed at nine DAG (Fig. 24 a), mutant and wild type plants were
grown for nine days in LD before the harvesting samples for RNA extraction. Total RNA of three
biological replicates per genotype was subsequently separated into pools of mRNAs with long tails (>
50 A; termed “long fraction”) and with short tails (> oligo A but < 50 A; termed “short fraction”).
Transcript abundances of FLC and COOLAIR contained in both fractions were tested in a subsequent
qPCR analysis. Since this method does not allow normalization of a given transcript amount to a
housekeeping gene, already small technical errors are reflected directly at the transcript abundance
level. Thus, a high standard error was anticipated. However, PAT changes caused by the loss of PAPS
activity should still be detectable (see chapter 3.4.2).
Regarding the FLC sense transcript, both mutant and wild type contained a similarly high amount of
long-tailed FLC mRNA (Fig. 36). This was unexpected since previous sequencing and RACE-PCR
analyses had revealed rather short A-tails in Col-0 (communication with Szymon Swiezewski,
unpublished). Moreover, paps2/4 had been expected to exhibit a higher proportion of long-tailed FLC
than the wild type. The finding suggests that the higher FLC transcript level detected in paps2/4
compared to Col-0 originates from increased FLC expression rather than from altered transcript
stability. In contrast, paps1-1 was expected to predominantly contain short-tailed FLC mRNAs
compared to the respective wild type. However, looking at the global fractionation data set, the
mutant did not exhibit significant changes in the FLC PAT length compared to the wild type Ler at ten
DAG (data not shown).

Results 94
Fig. 36 FLC mRNAs have long poly(A) tails in both wild type and paps2 paps4. Total RNA of Col-0 and paps2-3 paps4-3 (paps2/4) of 9-day-old seedlings was separated into pools of mRNAs with long tails (> 50 A; long) and with short tails (> oligo A but < 50 A; short).
Next, the PAT length of both COOLAIR classes was analysed. As expected, the COOLAIR transcript
abundance was very low. The FLC AS class I mRNA was mainly found in the long fraction (Fig. 37 a).
Regarding the FLC AS class II, the PAT was balanced between short and long tails in Col-0, while there
seemed to be a trend towards longer PATs in paps2/4 (Fig. 37 b). This would be in consistence with a
slight but insignificant trend towards a higher COOLAIR class II level in the mutant at ten DAG (Fig.
34). However, the finding from the fractionation analysis has to be treated with caution since the
analysis of spike-in control RNAs revealed that the total amount of input RNA must have been higher
in the paps2/4 samples (chapter 3.4.2). Moreover, the very low transcript abundance and the
presence of more than one splice form might additionally obscure subtle changes in PAT length.
Fig. 37 Poly(A) tail lengths of FLC antisense mRNAs do not differ between wild type and paps2 paps4. Total RNA of Col-0 and paps2-3 paps4-3 (paps2/4) of 9-day-old seedlings was separated into pools of mRNAs with long tails (> 50 A; long) and with short tails (> oligo A but < 50 A; short).
0E+00
1E-07
2E-07
3E-07
4E-07
5E-07
6E-07
Col- 0 long Col-0 short paps2/4-long
paps2/4-short
n = 3
FLC
mR
NA
ab
un
dan
ce[(
ind
ivid
ual
PC
R e
ffic
ien
cy)
-Ct
±SD
]
0.E+00
5.E-10
1.E-09
2.E-09
2.E-09
3.E-09
3.E-09
Col- 0 long Col-0 short paps2/4-long
paps2/4-short
0.E+00
5.E-10
1.E-09
2.E-09
2.E-09
3.E-09
3.E-09
Col- 0 long Col-0 short paps2/4-long
paps2/4-short
n = 3
FLC
an
tise
nse
cla
ss I
mR
NA
ab
un
dan
ce[(
ind
ivid
ual
PC
R e
ffic
ien
cy)
-Ct
±SD
]
n = 3
FLC
an
tise
nse
cla
ss I
I mR
NA
ab
un
dan
ce[(
ind
ivid
ual
PC
R e
ffic
ien
cy)
-Ct
±SD
] a) b)
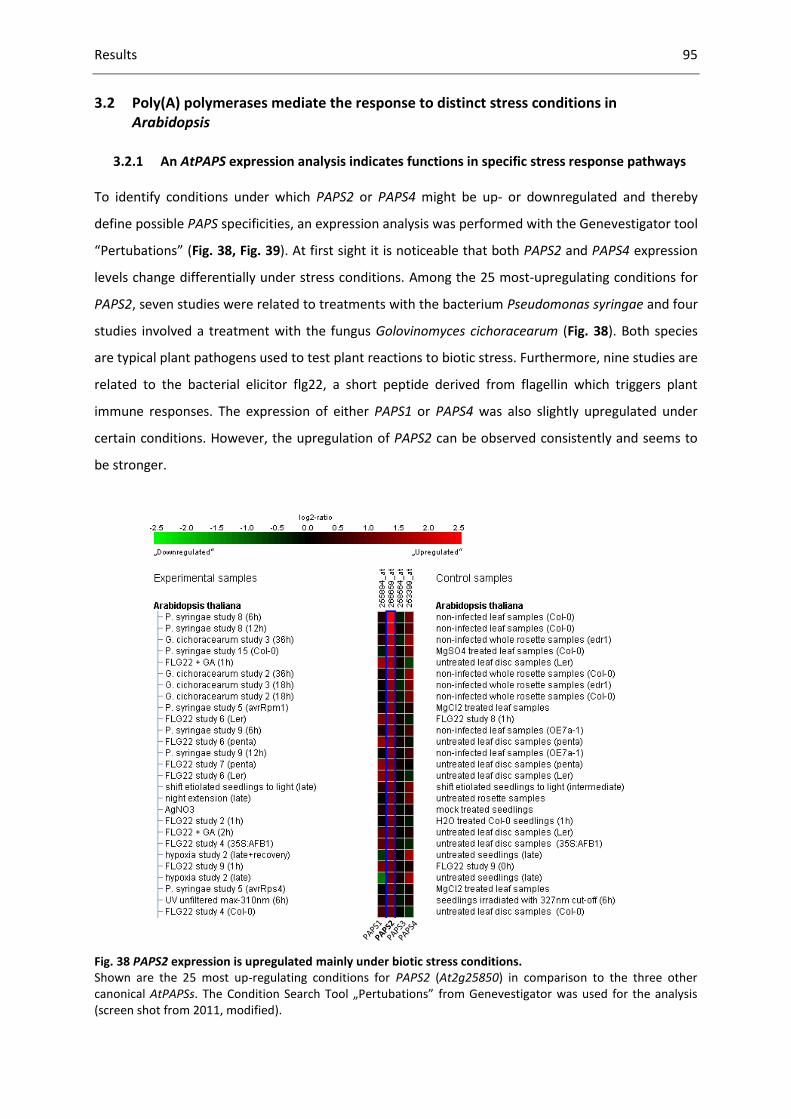
Results 95
3.2 Poly(A) polymerases mediate the response to distinct stress conditions in Arabidopsis
3.2.1 An AtPAPS expression analysis indicates functions in specific stress response pathways To identify conditions under which PAPS2 or PAPS4 might be up- or downregulated and thereby
define possible PAPS specificities, an expression analysis was performed with the Genevestigator tool
“Pertubations” (Fig. 38, Fig. 39). At first sight it is noticeable that both PAPS2 and PAPS4 expression
levels change differentially under stress conditions. Among the 25 most-upregulating conditions for
PAPS2, seven studies were related to treatments with the bacterium Pseudomonas syringae and four
studies involved a treatment with the fungus Golovinomyces cichoracearum (Fig. 38). Both species
are typical plant pathogens used to test plant reactions to biotic stress. Furthermore, nine studies are
related to the bacterial elicitor flg22, a short peptide derived from flagellin which triggers plant
immune responses. The expression of either PAPS1 or PAPS4 was also slightly upregulated under
certain conditions. However, the upregulation of PAPS2 can be observed consistently and seems to
be stronger.
Fig. 38 PAPS2 expression is upregulated mainly under biotic stress conditions. Shown are the 25 most up-regulating conditions for PAPS2 (At2g25850) in comparison to the three other canonical AtPAPSs. The Condition Search Tool „Pertubations” from Genevestigator was used for the analysis (screen shot from 2011, modified).
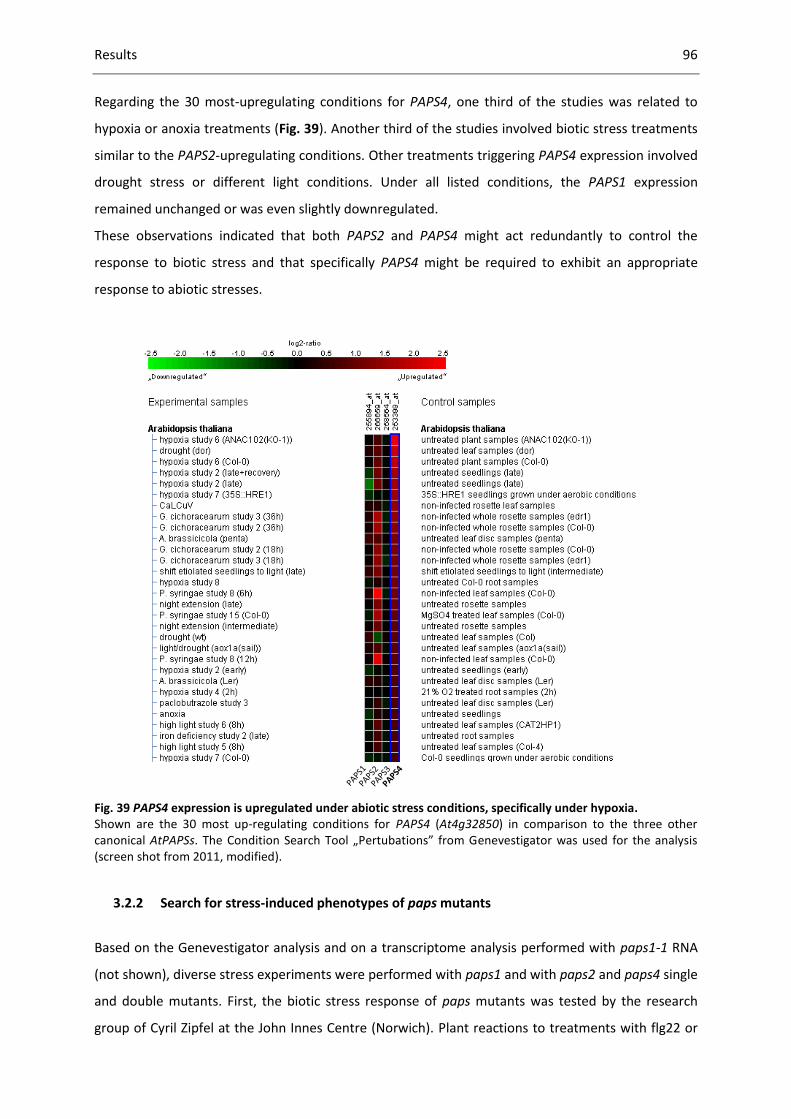
Results 96
Regarding the 30 most-upregulating conditions for PAPS4, one third of the studies was related to
hypoxia or anoxia treatments (Fig. 39). Another third of the studies involved biotic stress treatments
similar to the PAPS2-upregulating conditions. Other treatments triggering PAPS4 expression involved
drought stress or different light conditions. Under all listed conditions, the PAPS1 expression
remained unchanged or was even slightly downregulated.
These observations indicated that both PAPS2 and PAPS4 might act redundantly to control the
response to biotic stress and that specifically PAPS4 might be required to exhibit an appropriate
response to abiotic stresses.
Fig. 39 PAPS4 expression is upregulated under abiotic stress conditions, specifically under hypoxia. Shown are the 30 most up-regulating conditions for PAPS4 (At4g32850) in comparison to the three other canonical AtPAPSs. The Condition Search Tool „Pertubations” from Genevestigator was used for the analysis (screen shot from 2011, modified).
3.2.2 Search for stress-induced phenotypes of paps mutants
Based on the Genevestigator analysis and on a transcriptome analysis performed with paps1-1 RNA
(not shown), diverse stress experiments were performed with paps1 and with paps2 and paps4 single
and double mutants. First, the biotic stress response of paps mutants was tested by the research
group of Cyril Zipfel at the John Innes Centre (Norwich). Plant reactions to treatments with flg22 or

Results 97
with the biotrophic oomycete Hyaloperonospora arabidopsidis were examined. An impaired
resistance of the paps2/4 mutant was expected. Instead, while paps1-1 proved to be hyper-resistant
to the fungus, paps2-3 paps4-3 showed no differential response to the wild type (Trost et al. 2014).
While the experimental outcome of repeated flg22 treatments was not homogeneous (data not
shown), it was obvious that paps2/4 mutants were not significantly more susceptible to biotic stress
than Col-0.
Since oxygen-stress related studies were predominantly found to upregulate PAPS4 expression,
oxygen-depletion stress was tested in various set ups in collaboration with the research group of
Joost van Dongen (Max Planck Institute for Molecular Plant Physiology, Potsdam Golm). Plants were
submerged for up to 72 h, treated with complete anoxia for up to 8 h and grown at low oxygen
conditions for six weeks in a long-term experiment.
Fig. 40 Short-term oxygen depletion does not lead to a differential stress response in paps mutants. a) 28-day-old plants were kept in the dark (control) or were submerged in the dark for 72 h. Darkness prevented oxygen production by photosynthesis. Photos were taken after three days of recovery under standard conditions in the glass house. b) Seven-day-old seedlings grown on ½ MS medium under standard conditions were transferred to complete anoxia (gas treatment with nitrogen) in the dark for the indicated period of time. Photos were taken after five days of recovery under standard growth conditions.
a)
b)
Control (dark)
72 h submergence+ 3d recovery
7 h anoxia
6 h anoxia
Control (dark)

Results 98
First, four-week-old plants were submerged for several days in the dark to avoid plant oxygen
production. Interestingly, when the submergence was terminated after 60 h, the plants recovered
almost completely (data not shown). When the plants had been submerged for three days, plants
were more affected. However, among all genotypes, there were plants that recovered quickly and
plants that showed bleaching or turgor loss (Fig. 40 a). To detect more subtle defects, the fresh
weight and dry weight could have been determined after a short recovery phase.
Next, seven-day-old seedlings grown on MS plates were stressed with complete anoxia which was
generated by a gas treatment with nitrogen for several hours. Subsequently, the plates were
transferred back to standard growth conditions for five days of recovery. Plants that sustained 5 h of
anoxia were relatively mildly affected (not shown). Longer anoxia treatments of 6–7 h successively
provoked stronger lesions that resulted in growth retardation, bleaching and death of seedlings (Fig.
40 b). While paps2 paps4 looked slightly better than Col-0 after five days of recovery, this
observation was not homogeneous throughout the four replicate plates. Moreover, as seen on the
control plates, the germination rate of the four genotypes was not homogeneous. A fresh weight
determination could have helped to interpret the findings. The anoxia treatment of 8 h duration was
too strong for all genotypes and led to a complete growth arrest and bleaching (not shown).
After that, a long-term hypoxia treatment was set up with 21-day-old plants in the glass house. To
create a low-oxygen atmosphere, the pots were kept in plexiglass boxes that were sealed and
aerated with 400 ppm of CO2 and 21 % or 8 % of oxygen in N2 for four weeks (Fig. 41 e, f).
Since Col-0 does not show a phenotype down to an oxygen concentration of 10 % (communication
with Joost van Dongen), a concentration below that threshold was chosen to provoke a phenotype in
the wild type and to be able to see both a putative hyper-sensitivity or a hyper-resistance of paps
mutants. Next to the control plants in the boxes, additional control plants were grown under
standard conditions outside the boxes. The plants and boxes were observed regularly. If the gas
pressure was set too low, the humidity in the boxes became very high (Fig. 41 f). Moreover, fungi and
fungus gnats began to develop in all boxes after three weeks of treatment. After four weeks of
hypoxia, the boxes were opened and the leaf diameter, the fresh weight and the dry weight (FW and
DW) of all plants were determined.
The leaf diameter of the hypoxia-treated plants was normalized to either the non-treated control
(NTC) or the plants grown at 21 % O2 in the boxes. Both normalized leaf diameters did not reveal
significant growth differences between mutants and Col-0 (Table 6). Except for paps1-1, the plants
grown in the boxes generally showed a larger diameter than the NTC plants, which was probably
caused by light depletion. Probably due to the increased temperatures and the high humidity,
paps1-1 plants exhibited a strong diameter decrease in the boxes compared to the control plants
grown outside.

Results 99
Fig. 41 Hypoxia-treated paps mutants and Col-0 exhibit similar weight changes. 21-day old plants were transferred to plexiglass boxes treated with 21 % O2 or 8 % O2 for 4 weeks or were kept under standard conditions as non-treated control (NTC) plants. a, b) Fresh and dry weight of hypoxia-treated plants normalized to weight of plants grown in 21 %-control boxes. c, d) Fresh and dry weight of hypoxia-treated plants normalized to weight of NTC plants. e, f) Setup of control plants and plexiglass boxes. P-values indicate significant difference to Col-0, but do not withstand Bonferroni-correction.
Usually, temperatures between 22 °C and 23 °C were measured inside of the boxes, but the
temperature increased up to 26 °C during sunny days. The flowering time was determined during the
regular examination of all pots. It was similar inside and outside of the boxes (data not shown).
The paps mutant phenotypes were still visible in the boxes. Both FW and DW were generally reduced
under oxygen stress (Table 6, Fig. 41). Regarding the normalized weight data, paps2-3 grown at 8 %
O2 showed a significantly increased FW compared to Col-0. This indicates an increased resistance to
hypoxia. However, the difference is subtle and the significance does not withstand Bonferroni-
correction. Normalized to the plants grown in boxes at 21 % O2, the paps4-3 mutant exhibits a
0
50
100
150
200
250
300
Col-0 paps2-3 paps4-3 paps2-3 paps4-3
paps1-1
n = 15* p ˂ 0.05 *
Fres
h w
eigh
t at
8%
O2
no
rmal
ized
to
21
% O
2-c
on
tro
l [%
]
0
100
200
300
400
500
600
Col-0 paps2-3 paps4-3 paps2-3 paps4-3
paps1-1
n = 15* p ˂ 0.05
*
Dry
wei
ght
at8
% O
2
no
rmal
ized
to
21
% O
2-c
on
tro
l [%
]
a) b)
0
50
100
150
200
Col-0 paps2-3 paps4-3 paps2-3 paps4-3
paps1-1
d)
Dry
wei
ght
at 8
% O
2
no
rmal
ized
to
NTC
[%
]
n = 15* p ˂ 0.05
0
50
100
150
200
Col-0 paps2-3 paps4-3 paps2-3 paps4-3
paps1-1
Fres
h w
eigh
t at
8%
O2
no
rmal
ized
to
NTC
[%
]
n = 15* p ˂ 0.05
c)
*
f)e)
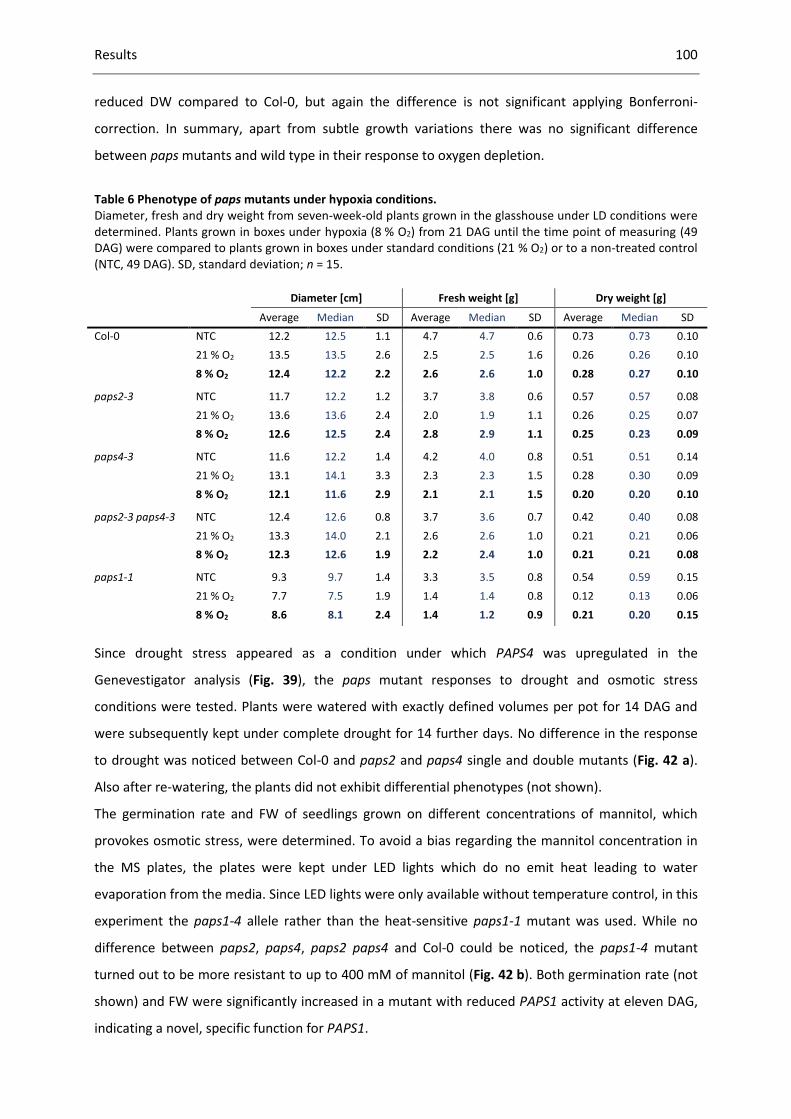
Results 100
reduced DW compared to Col-0, but again the difference is not significant applying Bonferroni-
correction. In summary, apart from subtle growth variations there was no significant difference
between paps mutants and wild type in their response to oxygen depletion.
Table 6 Phenotype of paps mutants under hypoxia conditions. Diameter, fresh and dry weight from seven-week-old plants grown in the glasshouse under LD conditions were determined. Plants grown in boxes under hypoxia (8 % O2) from 21 DAG until the time point of measuring (49 DAG) were compared to plants grown in boxes under standard conditions (21 % O2) or to a non-treated control (NTC, 49 DAG). SD, standard deviation; n = 15. Diameter [cm] Fresh weight [g] Dry weight [g]
Average Median SD Average Median SD Average Median SD
Col-0 NTC 12.2 12.5 1.1 4.7 4.7 0.6 0.73 0.73 0.10
21 % O2 13.5 13.5 2.6 2.5 2.5 1.6 0.26 0.26 0.10
8 % O2 12.4 12.2 2.2 2.6 2.6 1.0 0.28 0.27 0.10
paps2-3 NTC 11.7 12.2 1.2 3.7 3.8 0.6 0.57 0.57 0.08
21 % O2 13.6 13.6 2.4 2.0 1.9 1.1 0.26 0.25 0.07
8 % O2 12.6 12.5 2.4 2.8 2.9 1.1 0.25 0.23 0.09
paps4-3 NTC 11.6 12.2 1.4 4.2 4.0 0.8 0.51 0.51 0.14
21 % O2 13.1 14.1 3.3 2.3 2.3 1.5 0.28 0.30 0.09
8 % O2 12.1 11.6 2.9 2.1 2.1 1.5 0.20 0.20 0.10
paps2-3 paps4-3 NTC 12.4 12.6 0.8 3.7 3.6 0.7 0.42 0.40 0.08
21 % O2 13.3 14.0 2.1 2.6 2.6 1.0 0.21 0.21 0.06
8 % O2 12.3 12.6 1.9 2.2 2.4 1.0 0.21 0.21 0.08
paps1-1 NTC 9.3 9.7 1.4 3.3 3.5 0.8 0.54 0.59 0.15
21 % O2 7.7 7.5 1.9 1.4 1.4 0.8 0.12 0.13 0.06
8 % O2 8.6 8.1 2.4 1.4 1.2 0.9 0.21 0.20 0.15
Since drought stress appeared as a condition under which PAPS4 was upregulated in the
Genevestigator analysis (Fig. 39), the paps mutant responses to drought and osmotic stress
conditions were tested. Plants were watered with exactly defined volumes per pot for 14 DAG and
were subsequently kept under complete drought for 14 further days. No difference in the response
to drought was noticed between Col-0 and paps2 and paps4 single and double mutants (Fig. 42 a).
Also after re-watering, the plants did not exhibit differential phenotypes (not shown).
The germination rate and FW of seedlings grown on different concentrations of mannitol, which
provokes osmotic stress, were determined. To avoid a bias regarding the mannitol concentration in
the MS plates, the plates were kept under LED lights which do no emit heat leading to water
evaporation from the media. Since LED lights were only available without temperature control, in this
experiment the paps1-4 allele rather than the heat-sensitive paps1-1 mutant was used. While no
difference between paps2, paps4, paps2 paps4 and Col-0 could be noticed, the paps1-4 mutant
turned out to be more resistant to up to 400 mM of mannitol (Fig. 42 b). Both germination rate (not
shown) and FW were significantly increased in a mutant with reduced PAPS1 activity at eleven DAG,
indicating a novel, specific function for PAPS1.
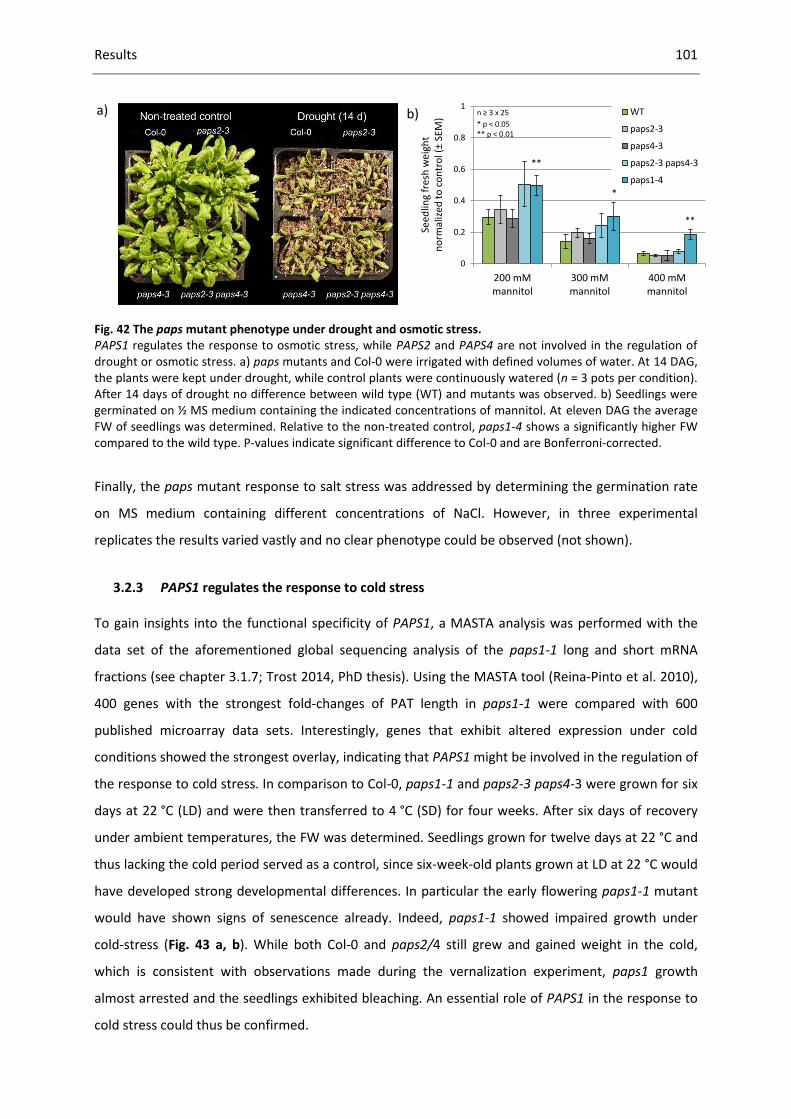
Results 101
Fig. 42 The paps mutant phenotype under drought and osmotic stress. PAPS1 regulates the response to osmotic stress, while PAPS2 and PAPS4 are not involved in the regulation of drought or osmotic stress. a) paps mutants and Col-0 were irrigated with defined volumes of water. At 14 DAG, the plants were kept under drought, while control plants were continuously watered (n = 3 pots per condition). After 14 days of drought no difference between wild type (WT) and mutants was observed. b) Seedlings were germinated on ½ MS medium containing the indicated concentrations of mannitol. At eleven DAG the average FW of seedlings was determined. Relative to the non-treated control, paps1-4 shows a significantly higher FW compared to the wild type. P-values indicate significant difference to Col-0 and are Bonferroni-corrected.
Finally, the paps mutant response to salt stress was addressed by determining the germination rate
on MS medium containing different concentrations of NaCl. However, in three experimental
replicates the results varied vastly and no clear phenotype could be observed (not shown).
3.2.3 PAPS1 regulates the response to cold stress To gain insights into the functional specificity of PAPS1, a MASTA analysis was performed with the
data set of the aforementioned global sequencing analysis of the paps1-1 long and short mRNA
fractions (see chapter 3.1.7; Trost 2014, PhD thesis). Using the MASTA tool (Reina-Pinto et al. 2010),
400 genes with the strongest fold-changes of PAT length in paps1-1 were compared with 600
published microarray data sets. Interestingly, genes that exhibit altered expression under cold
conditions showed the strongest overlay, indicating that PAPS1 might be involved in the regulation of
the response to cold stress. In comparison to Col-0, paps1-1 and paps2-3 paps4-3 were grown for six
days at 22 °C (LD) and were then transferred to 4 °C (SD) for four weeks. After six days of recovery
under ambient temperatures, the FW was determined. Seedlings grown for twelve days at 22 °C and
thus lacking the cold period served as a control, since six-week-old plants grown at LD at 22 °C would
have developed strong developmental differences. In particular the early flowering paps1-1 mutant
would have shown signs of senescence already. Indeed, paps1-1 showed impaired growth under
cold-stress (Fig. 43 a, b). While both Col-0 and paps2/4 still grew and gained weight in the cold,
which is consistent with observations made during the vernalization experiment, paps1 growth
almost arrested and the seedlings exhibited bleaching. An essential role of PAPS1 in the response to
cold stress could thus be confirmed.
0
0.2
0.4
0.6
0.8
1
200 mM mannitol
300 mM mannitol
400 mM mannitol
WT
paps2-3
paps4-3
paps2-3 paps4-3
paps1-4
*
**
**
Seed
ling
fres
hw
eigh
tn
orm
aliz
edto
con
tro
l(±
SEM
)
n ≥ 3 x 25
* p ˂ 0.05** p ˂ 0.01
a) b)

Results 102
Fig. 43 paps1-1 but not paps2-3 paps4-3 shows an impaired response to cold. Seedlings were grown for six days (LD, 22 °C), then transferred to cold conditions for four weeks (4 °C, SD) and returned to 22 °C for six days of recovery. Control seedlings (LD, 22 °C) were sown out during the ongoing cold treatment and were harvested at twelve DAG simultaneously with the cold-treated plants, when images were taken (a) and the fresh weight was determined (b). While paps1-1 development arrested during the cold-treatment and the seedlings exhibited bleaching, paps2-3 paps4-3 grew like Col-0. P-values indicate significant difference to Col-0 and are Bonferroni-corrected.
3.2.4 PAPS1 and PAPS2/4 regulate the response to oxidative stress in different pathways
Another MASTA comparison with the paps1 mRNA fractionation data set was performed using 400
genes that exhibited the most significant changes in paps1-1 (i.e. the lowest p-values in a comparison
of the short-tail and long-tail fractions of mutant and wild type) (see chapter 3.2.3; Trost 2014, PhD
thesis). The analysis revealed a high overlap with several experiments, in which the cellular redox
state was modulated. Genes showing differential PAT lengths in paps1-1 overlapped significantly
with plants overexpressing a thylakoid-localized ascorbate peroxidase (tAPX), an enzymes that
detoxifies H2O2. As a 35S::tAPX line had previously been shown to be resistant to oxidative stress
provoked by a treatment with paraquat (Murgia et al. 2004), a similar ROS-resistance phenotype
could be expected for paps1 mutants. Moreover, a set of genes with altered PAT length in paps1-1
overlapped with genes that were deregulated in the CPSF30 mutant oxt6 which is resistant to both
oxidative stress in the cytoplasm and the chloroplast (Zhang et al. 2008; Kappel et al. submitted).
In a preliminary test starting at seven DAG, plants were sprayed with 100 mM H2O2 every other day.
A similar degree of leaf necrosis formation was observed in Col-0, paps1-1 and paps2-3 paps4-3 (not
shown). However, with regard to the irregular shape and size of paps1-1 leaves, the necrosis
formation was difficult to quantify.
Zhang et al. (2008) provoked cytoplasmic ROS stress by a combination of the chemicals 3-amino-1, 2,
4-triazole (AT) and buthionine-S, R-sulfoximide (BSO). AT inhibits catalases and thus indirectly
increases intracellular H2O2 levels, which entails increased glutathione levels (May and Leaver 1993).
BSO in turn inhibits the glutathione synthesis, which in combination with AT, provokes strong
cytoplasmic ROS stress (Griffith and Meister 1979). Moreover, the group tested the plant response to
oxidative stress in the chloroplast using methyl viologen (MV) which is also known as the herbicide
a)
0.0
2.0
4.0
6.0
8.0
Col-0 paps2-3 paps4-3
paps1-1
Seed
ling
fres
h w
eig
ht
rela
tive
to
co
ntr
ol (
±SE
M)
n = 3 × 5-10** p ˂ 0.01
**
b)

Results 103
paraquat. MV accepts electrons from the photosystem I. The resulting paraquat radical reduces O2
molecules to ROS and the free paraquat cation can accept new electrons. This circuit continues until
chloroplasts are completely damaged. In the sun, paraquat-treated plants will bleach and dry out.
First, the development of paps mutants was tested on MS media containing BSO and AT
concentrations as used by Zhang et al. (2008). In addition, lower concentrations were tested. The
oxt6 mutant served as a positive control. At standard growth conditions (on soil, 22 °C, LD) the
reduced size of oxt6 that had been described before was confirmed (Fig. 44 a). At seven DAG the
seedlings were transferred from standard MS plates to stress media. After 14 days of treatment, root
length and FW were determined and indeed Col-0 was more affected by the treatment than oxt6
(Fig. 44 b, c). Moreover, as expected, paps1-1 clearly exhibited an enhanced resistance to
cytoplasmic ROS stress. At lower chemical concentrations, the phenotype is more pronounced. In
contrast, the weight of paps2-3 paps4-3 is as impaired as that of the wild type.
Fig. 44 PAPS1 and PAPS2/PAPS4 regulate the response to oxidative stress in different pathways.
a) Phenotype of 20-day-old plants grown under standard growth conditions (LD, 22 °C). b)e) Seven-day-old seedlings were transferred to ½ MS containing sucrose and BSO/AT (b, c) or MV (d, e). Fresh weight (b, d) and root lengths (c, e) were determined after 14 days of treatment. paps1-1 is more resistant to cytoplasmic and chloroplast stress, similar to oxt6. paps2-3 paps4-3 is less resistant to chloroplast ROS stress than Col-0. Two paps2-3 paps4-3 oxt6 triple mutant lines have an intermediate phenotype between paps2 paps4 and oxt6 on chloroplast ROS stress. P-values are Bonferroni-corrected.
0.0
0.2
0.4
0.6
0.8
1.0
1.2
1.4
Col-0 paps2-3 paps4-3
paps1-1 oxt6 paps2-3 paps4-3 oxt6 #1
paps2-3 paps4-3 oxt6 #2
0.0
0.2
0.4
0.6
0.8
1.0
1.2
Col-0 paps2-3 paps4-3
paps1-1 oxt6 paps2-3 paps4-3 oxt6 #1
paps2-3 paps4-3 oxt6 #2
0.0
0.2
0.4
0.6
0.8
200 µM BSO + 1 µM AT
400 µM BSO + 4 µM AT
Col-0 paps2-3paps4-3
paps1-1 oxt6
0.0
0.2
0.4
0.6
0.8
1.0
1.2
200 µM BSO + 1 µM AT
400 µM BSO + 4 µM AT
Col-0 paps2-3paps4-3
paps1-1 oxt6
n ≥ 14
** p ˂ 0.01
**
**
**
**
Seed
ling
fres
h w
eig
ht
(±SE
M)
no
rmal
ized
to
co
ntr
ol
200 µM BSO+ 1 µM AT
400 µM BSO+ 2 µM AT
**
n ≥ 14
** p ˂ 0.01
Seed
ling
roo
t le
ngt
h (
±SE
M)
no
rmal
ized
to
co
ntr
ol
200 µM BSO+ 1 µM AT
400 µM BSO+ 2 µM AT
**
**
**
a) b)
d)
c)Se
edlin
gro
ot
len
gth
on
40
nM
MV
n
orm
aliz
edto
con
tro
l(±
SEM
) n ≥ 20** p ≥ 0.01
**
**
**
Seed
ling
fres
hw
eig
ht
on
40
nM
MV
n
orm
lized
toco
ntr
ol(
±SE
M) n ≥ 20
* p ≥ 0.05** p ≥ 0.01
**
**
***
e)
Results 104
The paps2/4 double mutant exhibits slightly longer roots than the wild type, but this phenotype is
very subtle and is abolished at high BSO and AT concentrations (Fig. 44 c).
Next, a comparative growth analysis was performed on 40 nM MV. Preliminary studies revealed that
both 80 and 100 nM of MV impaired plant growth too severely to see differential stress responses.
As observed for the cytosolic ROS stress, paps1-1 and oxt6 were more resistant than Col-0, with
paps1-1 being even stronger than oxt6 (Fig. 44 d, e). In contrast, with regard to both FW and root
length, the paps2-3 paps4-3 growth was impaired significantly more strongly than the wild type
development. These results indicate that PAPS1 and PAPS2/4 are required for a proper response to
oxidative stress.
Both paps1-1 and oxt6 exhibit a reduced size under standard growth conditions and are more
resistant to oxidative stress in several cellular compartments. To reveal the genetic interactions of
PAPS1, PAPS2/4 and CPSF30, the paps mutants were crossed to oxt6. Since PAPS1 and CPSF30 are
both located on chromosome 1, several recombinant F2 lines were used to search for double
mutants. However, among the analysed individuals (238 F3 plants derived from paps1-1/paps1-1
oxt6/+ lines and among 333 F3 plants derived from paps1-1/+ oxt6/oxt6 lines), no homozygous
double mutant could be detected. This finding indicates that the combination of the loss of CPSF30
function with reduced PAPS1 activity results in embryo or gametophytic lethality.
In contrast, two paps2-3 paps4-3 oxt6 triple mutants could be isolated in the F2 generation. The
stress response of the F3 generations on MV were tested, to address the question, whether one
mutant allele would be epistatic in the stress test or whether the resulting phenotype was
intermediate. Interestingly, the FW of one triple mutant line was indeed intermediate between oxt6
and paps2-3 paps4-3, while the other mutant line showed an enhanced resistance like oxt6 (Fig. 44
d). In contrast, both lines exhibited a root length that was intermediate between the single mutants
(Fig. 44 e).
The results imply that PAPS1 and CPSF30 may act together in a common pathway to downregulate
the response to oxidative stress in both chloroplast and cytoplasm, while PAPS2/4 act in a different
pathway to enhance the resistance to ROS stress mainly in the chloroplast.
3.2.5 paps1 and paps2/4 react differentially to the loss of a poly(A) ribonuclease
A different stress mutant phenotype caused by deregulated poly(A) tail processing is exhibited by the
mutant ABA-hypersensitive germination 2-1 (ahg2-1). This ahg2 mutant contains a point mutation in
a gene encoding a mitochondria-localized poly(A) ribonuclease named PARN and exhibits increased
sensitivity to salinity and osmotic stress (Nishimura et al. 2005). Interestingly, the combination of
mutant paps1-1 and ahg2-1 alleles is lethal (Trost 2014, PhD thesis). The triple mutant paps2-3
paps4-3 ahg2-1 is viable but very weak (Fig. 45).

Results 105
While ahg2-1 germinates late and exhibits a stunted growth phenotype, the additional loss of
PAPS2/4 function caused even stronger growth impairments. Since the triple mutant hardly
produced seeds, no stress assays could be performed. Apparently, the defect of the mitochondrial
PARN and the double knockout of PAPS2 and PAPS4 results in too much cellular mis-regulation to
keep up a growth rate that is at least similar to the ahg2-1 mutant. However, the fact that reduced
PAPS1 activity has an even stronger impact on the agh2-1 mutant again underlines that PAPS1 and
PAPS2/4 most certainly act on differential subsets of mRNAs.
Fig. 45 Phenotype of paps2 paps4 ahg2-1 triple mutants. Plants were grown under standard LD conditions. The knockdown of a mitochondrial poly(A) ribonuclease in a paps2 paps4 mutant background results in strong developmental defects. a) ABA-hypersensitive germination 2-1 (ahg2-1) mutants with reduced poly(A) ribonuclease activity in mitochondria germinate late and exhibit reduced growth compared to the paps2-3 paps4-3 mutant that shows no growth difference compared to Col-0. b, c) In a paps2 paps4 mutant background the ahg2-1 mutant phenotype is enhanced. Triple mutants are even smaller and less developed than ahg2-1 single mutants.
3.3 Molecular characterisation of PAPS1 and PAPS2/PAPS4
3.3.1 Establishing PAPS1- and PAPS4-specific antibodies
As outlined above, under certain conditions the phenotype of all paps mutant is different from that
of the wild type. Changing expression levels, as predicted by the Genevestigator analysis (Fig. 38, Fig.
39), might be reflected by altered PAPS protein levels. Since PAPS proteins are essential enzymes in
every nucleus and thus are assumed to be rather abundant, changes in the protein level might be
detectable in a Western blot. The paps1 mutants exhibited diverse strong phenotypes, and the paps4
phenotype was more pronounced than that of paps2. Therefore, these two AtPAPSs were chosen to
prove the putatively altered or opposing PAPS protein contents.
a) b)
c)

Results 106
In a first attempt to attain specific antibodies, the C-terminal domains of PAPS1 and PAPS4 were
tagged with hexa-histidine and overexpressed in Escherichia coli. However, the His-tagged proteins
could not be purified using nickel agarose. Proteins bound to nickel agarose columns were washed
stringently using buffer containing high imidazole concentrations (The QiaExpressionist handbook,
2003, Qiagen). However, even after diverse protocol optimizations, the obtained protein solution
was still contaminated with E. coli proteins.
In an alternative approach, specific synthetic-peptide antibodies were ordered. The antibodies were
directed against two 15 amino-acid long PAPS-specific peptides which were synthesized by
Genescript (Piscataway, NJ, USA). A Western blot with crude protein extracts from E. coli
overexpressing the PAPS-CTDs confirmed that the peptide antibodies were highly specific for PAPS1
and PAPS4, respectively. However, in a Western blot with Arabidopsis protein extracts from seedlings
both antibodies bound a high amount of other proteins unspecifically. Even when concentrated in
purified nuclei, the PAPS protein levels were still too low to visualize them against the background
noise. The possibility that the proteins were not denaturated properly was ruled out by using
strongly reducing protein extraction buffer which contained 4 M urea. After all, the PAPS protein
content seemed to be lower than expected for enzymes exhibiting a very basic cellular function.
Fig. 46 Protein coding gene models for PAPS1 (a) and PAPS4 (b). While only two PAPS1 (At1g17980) splice forms that differ in the 5’ end are known (a), PAPS4 (At4g32850) expresses at least ten different splice forms (b). The splice forms differ in their 3’ end and exhibit alternative polyadenylation sites and stop codons. When annotated expressed sequence tags (ESTs) for PAPS4 were analysed to look for predominant splice forms, At4g32580.5 and At4g32850.8 were identified as the main forms that are being expressed at similar levels (arrows). The stop codon of splice form 5 is located in an intron of splice form 8 (green boxes).
a)
b)

Results 107
Since these attempts to raise PAPS-specific antibodies failed, the PAPS-CTDs were tagged with venus-
YFP (vYFP), an optimized version of yellow fluorescent protein. Only two PAPS1 splice forms that
differ in the 5’ UTR are known. In contrast, ten PAPS4 transcripts have been documented. All forms
are alternatively spliced and polyadenylated at their 3’ end (Fig. 46).
To identify possible coding sequences and sites at which the YFP could be inserted without being
spliced out, expressed sequence tags annotated at The Arabidopsis Information Resource (TAIR,
www.arabidopsis.org) were analysed by sequence comparison. Two transcripts were found to be
predominantly expressed. Splice form At4g32850.5 shows an alternative 3’ acceptor site of the last
intron, which results in a shorter coding sequence. The splice form At4g32850.8 has an extended last
intron and a longer coding sequence. Since the stop codon of splice form 5 is located in the partially
retained intron that is spliced out of sequence 8, two pPAPS4:PAPS4::YFP sequences with alternative
3’ ends were constructed by site-directed mutagenesis.
Since paps1-1 still exhibits reduced PAPS1 activity, the paps1-3 mutant was transformed with
pPAPS1:PAPS1::YFP. paps1-3 is a knockout allele that results in male gametophytic lethality. The
complementation of PAPS1 function by the construct was shown by successful pollination of Col-0
plants with pollen from paps1-3/ pPAPS1:PAPS1::YFP lines (Ramming 2014, MSc thesis). The paps1-3
mutant pollen had regained its functionality.
The pPAPS4:PAPS4::YFP constructs were transformed into paps4-3 and paps2-3 paps4-3. A rescue of
PAPS4 function should result in flowering times similar to the wild type (see Fig. 17). As a first assay
for pPAPS:PAPS::YFP expression, seedlings from four T2 lines per transformed mutant line were
tested for YFP signals using confocal laser scanning microscopy.
Only lines transformed with PAPS4 splice form 5 (PAPS4.5) emitted YFP signals which were weak
compared to the YFP emission from the simultaneously analysed paps1-3/ PAPS1::YFP lines (data not
shown). In parallel, a Western blot with protein crude extracts from seedlings was performed with a
polyclonal anti-GFP antibody (Fig. 47).
In pPAPS4:PAPS4.5::YFP-expressing samples, a specific thin protein band ran at 130 kDa (Fig. 47 b).
This band appeared directly below an unspecific band and was not observed in the Col-0 control. In
accordance with the microscopy results, this band was not visible in samples transformed with
PAPS4.8. The predicted protein sizes of PAPS4.5::YFP and PAPS4.8::YFP are 114 and 116 kDa,
respectively. Similarly, the predicted PAPS1-YFP size was 113 kDa, but the recombinant protein ran at
130 kDa in a Western blot (Ramming 2014, MSc thesis). The proteins supposedly exhibit a different
size due to post-translational modifications or the amino acid composition results in an anomalous
electrophoretic behaviour.

Results 108
Fig. 47 The PAPS4 splice form 5 is translated, while splice form 8 is non-coding. A Western blot was performed with protein crude extracts of eleven-day-old seedlings. Col-0 and paps4-3 or paps2-3 paps4-3 expressing two different PAPS4-YFP constructs (At4g32850.5 or At4g32850.8 with C-terminal venusYFP) from the PAPS4-promoter were analysed. Two T2 lines per combination were tested. a) Coomassie staining was performed as a loading control. b) A Western blot was performed using a polyclonal anti-GFP antibody. A band that does not appear in Col-0 can be seen in samples transformed with PAPS4 splice form 5 (arrow), but not with splice form 8. The predicted protein size is 114 kDa, the observed band runs at 130 kDa. The lines were tested for YFP signals with a confocal laser scanning microscope (CLSM signal; N - no signal; Y - signal; (Y) - weak signal). The observed signal strength is in accordance with the strength of the putative PAPS4-YFP protein band.
In future experiments, the flowering time of homozygous PAPS4.5-YFP expressing T3 lines should be
analysed to test for a complete complementation. Moreover, PAPS protein abundances under
oxidative stress conditions should be tested.
3.3.2 Localization and Expression of the PAPS1 and PAPS4 proteins
The cellular localization of the PAPS proteins was addressed using pPAPS:PAPS::YFP-expressing T2
lines. So far, the nuclear localization of PAPS1 and PAPS2/4 had only been shown by transient
overexpression of PAPS-GFP in onion cells (Meeks et al. 2009). This finding should be confirmed with
PAPS1 and PAPS4 expressed from the gene-specific promoters. Since T2 lines are still segregating for
the transgene, the PAPS4::YFP-expressing plants were pre-selected based on their resistance to the
herbicide BASTA (Table 10). The PAPS1::YFP-expressing lines had been tested for homozygosity
before. First, roots from eleven-day-old seedlings were analysed by fluorescence microscopy. Indeed,
the nuclear localization of both PAPS1 and PAPS4 could be confirmed (Fig. 48). In accordance with
the Western blot (Fig. 47), PAPS4 splice form 5, but not splice form 8, was found to be expressed in
vivo. The PAPS1-YFP signal was generally stronger than the PAPS4-YFP signal. With regard to the
AtGenExpress-analysis (Fig. 5 b), PAPS4 was expected to be expressed more strongly. However, since
the PAPS4-expressing lines might contain only one copy of the transgene, this might not necessarily
M Col-0 #4 #8 #2 #8 #2 #3 #2 #4
splice formAt4g32850.5
splice formAt4g32850.8
splice formAt4g32850.5
splice formAt4g32850.8
paps2-3 paps4-3/pPAPS4::PAPS4-YFP
paps4-3/pPAPS4::PAPS4-YFP
kDa
170
130
100
70
55
40
35
M Col-0 #4 #8 #2 #8 #2 #3 #2 #4
splice formAt4g32850.5
splice formAt4g32850.8
splice formAt4g32850.5
splice formAt4g32850.8
paps2-3 paps4-3/pPAPS4::PAPS4-YFP
paps4-3/pPAPS4::PAPS4-YFP
kDa
170
130
100
70
55
40
35
CLSM signal: N Y (Y) N N Y Y N N
a) b)
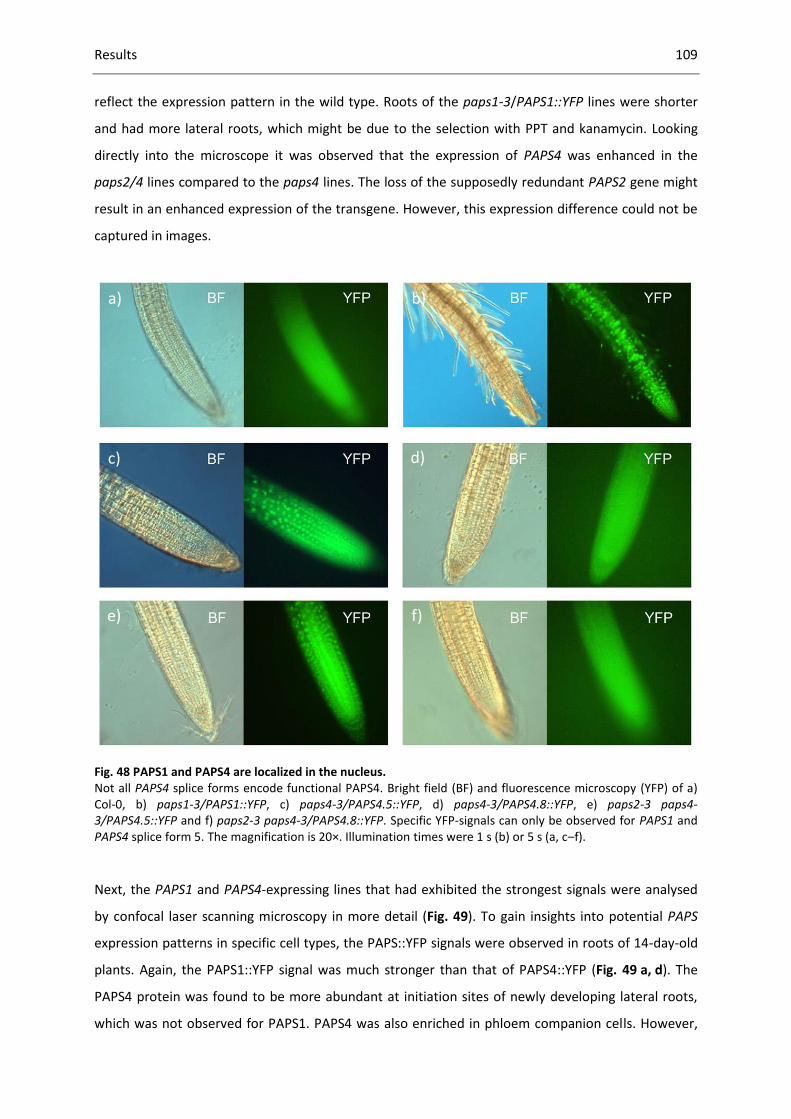
Results 109
reflect the expression pattern in the wild type. Roots of the paps1-3/PAPS1::YFP lines were shorter
and had more lateral roots, which might be due to the selection with PPT and kanamycin. Looking
directly into the microscope it was observed that the expression of PAPS4 was enhanced in the
paps2/4 lines compared to the paps4 lines. The loss of the supposedly redundant PAPS2 gene might
result in an enhanced expression of the transgene. However, this expression difference could not be
captured in images.
Fig. 48 PAPS1 and PAPS4 are localized in the nucleus. Not all PAPS4 splice forms encode functional PAPS4. Bright field (BF) and fluorescence microscopy (YFP) of a) Col-0, b) paps1-3/PAPS1::YFP, c) paps4-3/PAPS4.5::YFP, d) paps4-3/PAPS4.8::YFP, e) paps2-3 paps4-3/PAPS4.5::YFP and f) paps2-3 paps4-3/PAPS4.8::YFP. Specific YFP-signals can only be observed for PAPS1 and PAPS4 splice form 5. The magnification is 20×. Illumination times were 1 s (b) or 5 s (a, c–f).
Next, the PAPS1 and PAPS4-expressing lines that had exhibited the strongest signals were analysed
by confocal laser scanning microscopy in more detail (Fig. 49). To gain insights into potential PAPS
expression patterns in specific cell types, the PAPS::YFP signals were observed in roots of 14-day-old
plants. Again, the PAPS1::YFP signal was much stronger than that of PAPS4::YFP (Fig. 49 a, d). The
PAPS4 protein was found to be more abundant at initiation sites of newly developing lateral roots,
which was not observed for PAPS1. PAPS4 was also enriched in phloem companion cells. However,
a) b)
c) d)
e) f)

Results 110
the complemented paps1-3 lines showed a very compact and branched root phenotype on the
selective media (Fig. 48). To provide equal root development, the analysis has to be repeated with
homozygous lines grown on standard MS media without selective supplements. Moreover, only one
PAPS4 splice form is expressed in the analysed lines. Other alternative splice and polyadenylation
forms might be expressed specifically in different tissues or cell types. Differential cPAP transcripts
have for example been documented in specific mouse tissues (Zhao and Manley 1996).
Fig. 49 PAPS1 and PAPS4 proteins are localized in nuclei and show enrichment in certain tissues. Confocal laser scanning microscopy of a–c) paps1-3/PAPS1::YFP; d–e) paps4-3/PAPS4.5::YFP and f) paps2-3 paps4-3/PAPS4.5::YFP. The PAPS1 protein is more abundant than PAPS4 (a, d). PAPS4 is enriched at the initiation site of lateral roots (e) and in phloem companion cells (f). Membranes were stained with the dye FM-64. The scale bar marks 20 µm.
3.4 The search for PAPS2/PAPS4-specific target genes
3.4.1 A PCR-based PAT test did not reveal specific target genes In order to detect putative PAPS-specific mRNA subsets, a microarray was performed with RNA
extracted from paps1-1 seedlings (Vi et al. 2013). Later, a transcriptome analysis with paps2-3 paps4-
3 RNA was carried out additionally. The two data sets were compared, assuming that altered PAT
lengths might be reflected by altered expression levels. Genes with deregulated expression levels in
paps2/4 that exhibited no or opposite expression changes in paps1-1 were determined. Based on
strong and significant changes in gene expression levels, a set of 20 genes was selected for a PCR-
based PAT length test.
a) b) c)
d) e) f)

Results 111
For the PAT test, RNA is extended with a G/I adaptor at the 3’ end by a mutant yeast PAP. After RT
with an adaptor-specific oligonucleotide, RNA tail lengths can be determined by PCR using a gene-
specific and an adaptor-specific primer. To receive a tail-free PCR product as a baseline, a control
pool of RNA is treated with RNase H in the presence of an oligo (dT) primer prior to the adaptor
ligation. Gene-specific primers were derived from cDNAs annotated at TAIR (www.arabidopsis.org).
The PAT test had been validated before in the context of SAUR mRNA characterization in paps1-1 (Vi
et al. 2013). Unfortunately, in several cases no or unspecific products were amplified by PCR,
probably due to unfavourable features of the gene-specific primer. In other cases the baseline PCR
product did not show the expected size (Fig. 50 a).
Fig. 50 Poly(A) tail test with putatively PAPS2/4-specific candidate genes. To find mRNAs with deregulated poly(A) tails in paps2-3 paps4-3 (paps2/4) but not paps1-1 (paps1), a PCR-based poly(A) tail test was performed. Based on microarray and transcriptome data of paps mutants, candidate genes were determined. No differential PAT size could be observed for 20 genes. Shown here are three candidate genes with reduced expression in paps2-3 paps4-3 and unchanged (a, b) or increased (c) expression in paps1-1.
Since the primer binding site must be located within 150 bp 5’ to the PAS, correct annotation of the
3’ UTR is essential for the PAT test. For some of the selected genes specific PCR products could be
amplified. However, no differences in PAT lengths were observed between the paps mutants (Fig.
50 b, c). In summary, based on the transcriptome analysis, the PAT-test did not reveal specific targets
for PAPS2/4.
300
200
100
At1g19180: jasmonate-zim-domain protein 1
- poly(A) tail (RNase H)
Col-0 paps2/4 paps1 Col-0 paps2/4 paps1 H2O
+ poly(A) tail
expected product size 282 bp; primer binding site in UTR; two annotated splice forms should be detected
500
400
300
At2g18700: trehalose phosphatase/synthase 11
expected product size 233 bp
- poly(A) tail (RNase H)
Col-0 paps2/4 paps1 Col-0 paps2/4 paps1 H2O
+ poly(A) tail
- poly(A) tail (RNase H)
Col-0 paps2/4 paps1 Col-0 paps2/4 paps1 H2O
+ poly(A) tail
400
300
200
At1g72450: jasmonate-zim-domain protein 6
expected product size 257 bp;primer binding site in UTR
a)
b)
c)

Results 112
3.4.2 Fractionation of mRNAs into pools according to their poly(A) tail length
An alternative approach was tested in order to detect mRNAs with differential poly(A) tails in the
paps2/4 mutants. As addressed in chapter 3.1.7, total RNA extracted from Col-0 and paps2-3 paps4-3
was fractionated into pools according to their PAT length. This method was developed by Meijer and
de Moor (2011) and is usually applied in a large scale to perform RNA blots. Much less RNA is
required for a reverse transcription and a subsequent test on transcript abundance by qPCR.
Therefore, the fractionation was performed in a small scale with 20 µg of total RNA as input.
Prior to the fractionation, biotinylated oligo (dT) probes were bound to paramagnetic streptavidin
particles. Next, the RNA samples were incubated with the pre-treated magnetic beads. The poly(A)
tail-containing mRNAs were bound by the oligo (dT) probes. After capturing the beads by a magnet,
the unbound fraction was washed off. This fraction contains all kinds of non-polyadenylated RNAs.
There should only be little DNA left, since the RNA was extracted by the so-called hot phenol method
and was precipitated specifically with lithium chloride. Subsequently the mRNAs were eluted with
differentially concentrated buffers. First, a “short” fraction containing mRNAs with oligo(A)-tails and
tails with up to 50 A’s is collected. Then the “long” fraction is obtained with a more stringent wash
buffer, removing all mRNAs containing longer tails.
Fig. 51 Control RNAs with longer poly(A) tails are enriched in the long fraction. Total RNA of Col-0 and paps2-3 paps4-3 (paps2/4) of 9-day-old seedlings was separated into pools of mRNAs with long tails (> 50 A; long) and with short tails (> oligo A and < 50 A; short). The abundances of in vitro-transcribed control RNAs were tested by qPCR.
As a control, in vitro-transcribed RNAs with defined 3’ PAT lengths had been added to all RNA
samples prior to the fractionation. To validate the method, the control RNA abundances were tested
by qPCR (Fig. 51). While the short-tailed control RNA was partly still found in the long fraction, RNAs
with longer poly(A) tails were not detected in the short fraction anymore. Thus, in principle the
separation of mRNAs according to their PAT length is possible. Trends in changes of PAT lengths of
putative PAPS-specific target RNAs should be visible. However, it can also be seen that the paps2/4
0E+0
1E-6
2E-6
3E-6
4E-6
5E-6
6E-6
7E-6
Col- 0 long
Col-0 short
paps2/4-long
paps2/4-short
n = 3
RN
A a
bu
nd
ance
[(in
div
idu
al P
CR
eff
icie
ncy
) -C
t ±
SD]
T7::YFP::29A
0.0E+0
5.0E-6
1.0E-5
1.5E-5
2.0E-5
Col- 0 long
Col-0 short
paps2/4-long
paps2/4-short
RN
A a
bu
nd
ance
[(in
div
idu
al P
CR
eff
icie
ncy
) -C
t ±
SD] n = 3
T7::35S::75A
RN
A a
bu
nd
ance
[(in
div
idu
al P
CR
eff
icie
ncy
) -C
t ±
SD]
0E+0
2E-5
4E-5
6E-5
8E-5
1E-4
Col- 0 long
Col-0 short
paps2/4-long
paps2/4-short
n = 3
T7::AlcA::124A
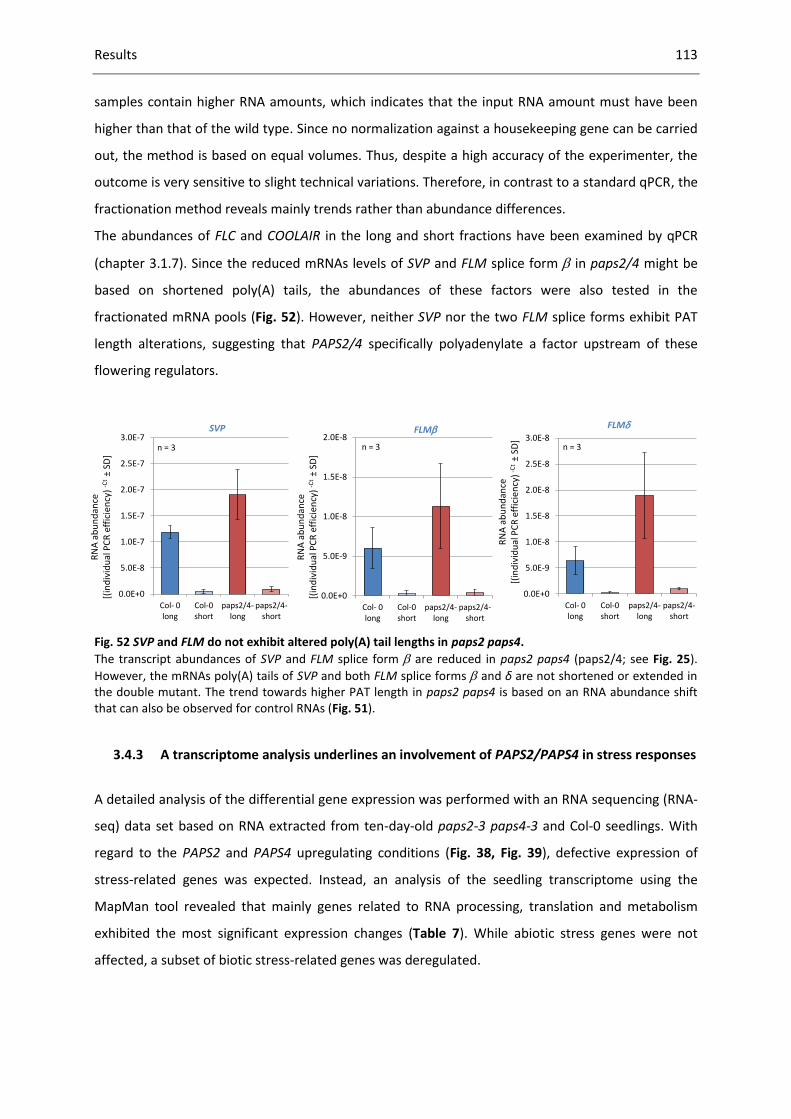
Results 113
samples contain higher RNA amounts, which indicates that the input RNA amount must have been
higher than that of the wild type. Since no normalization against a housekeeping gene can be carried
out, the method is based on equal volumes. Thus, despite a high accuracy of the experimenter, the
outcome is very sensitive to slight technical variations. Therefore, in contrast to a standard qPCR, the
fractionation method reveals mainly trends rather than abundance differences.
The abundances of FLC and COOLAIR in the long and short fractions have been examined by qPCR
(chapter 3.1.7). Since the reduced mRNAs levels of SVP and FLM splice form in paps2/4 might be
based on shortened poly(A) tails, the abundances of these factors were also tested in the
fractionated mRNA pools (Fig. 52). However, neither SVP nor the two FLM splice forms exhibit PAT
length alterations, suggesting that PAPS2/4 specifically polyadenylate a factor upstream of these
flowering regulators.
Fig. 52 SVP and FLM do not exhibit altered poly(A) tail lengths in paps2 paps4.
The transcript abundances of SVP and FLM splice form are reduced in paps2 paps4 (paps2/4; see Fig. 25).
However, the mRNAs poly(A) tails of SVP and both FLM splice forms and δ are not shortened or extended in the double mutant. The trend towards higher PAT length in paps2 paps4 is based on an RNA abundance shift that can also be observed for control RNAs (Fig. 51).
3.4.3 A transcriptome analysis underlines an involvement of PAPS2/PAPS4 in stress responses
A detailed analysis of the differential gene expression was performed with an RNA sequencing (RNA-
seq) data set based on RNA extracted from ten-day-old paps2-3 paps4-3 and Col-0 seedlings. With
regard to the PAPS2 and PAPS4 upregulating conditions (Fig. 38, Fig. 39), defective expression of
stress-related genes was expected. Instead, an analysis of the seedling transcriptome using the
MapMan tool revealed that mainly genes related to RNA processing, translation and metabolism
exhibited the most significant expression changes (Table 7). While abiotic stress genes were not
affected, a subset of biotic stress-related genes was deregulated.
0.0E+0
5.0E-8
1.0E-7
1.5E-7
2.0E-7
2.5E-7
3.0E-7
Col- 0 long
Col-0 short
paps2/4-long
paps2/4-short
SVP
RN
A a
bu
nd
ance
[(in
div
idu
al P
CR
eff
icie
ncy
) -C
t ±
SD]
0.0E+0
5.0E-9
1.0E-8
1.5E-8
2.0E-8
Col- 0 long
Col-0 short
paps2/4-long
paps2/4-short
FLM
RN
A a
bu
nd
ance
[(in
div
idu
al P
CR
eff
icie
ncy
) -C
t ±
SD]
FLM
0.0E+0
5.0E-9
1.0E-8
1.5E-8
2.0E-8
2.5E-8
3.0E-8
Col- 0 long
Col-0 short
paps2/4-long
paps2/4-short
RN
A a
bu
nd
ance
[(in
div
idu
al P
CR
eff
icie
ncy
) -C
t ±
SD]
n = 3 n = 3 n = 3

Results 114
Table 7 The ten most significantly deregulated gene categories in paps2-3 paps4-3 compared to Col-0 as determined by MapMan. First, the significantly deregulated genes in paps2 paps4 were filtered using the Kolmogorov-Smirnov test (KS-test) or using the Wilcoxon rank-sum test (Wilcoxon-test). Significantly deregulated gene categories were determined using the MapMan tool. The significance is indicated by the p-values detected by the two statistical methods. No stress-related gene categories can be found within the most significantly affected gene classes. Description p-value (KS-test) p-value (Wilcoxon-test)
protein synthesis; ribosomal protein; eukaryotic; 60S subunit 5.7-8 3.7-06
DNA synthesis/chromatin structure; retrotransposon/transposase 4.1-7 0.3
micro RNA, natural antisense etc 3.9-6 1.2-4
hormone metabolism 7.3-6 0.2
RNA regulation of transcription 2.5-5 3.7-7
protein degradation; ubiquitin E3 RING 1.2-3 4.9-4
mitochondrial electron transport / ATP synthesis 2.8-3 0.1
development 4.7-3 2.5-3
RNA processing 7.4-3 4.9-4
photosynthesis 9.3-3 0.2
Next, significantly deregulated genes uncovered by the RNA-seq analysis were compared with the
200 most up- and downregulated genes of all experiments collected in the MASTA database.
Interestingly, the analysis revealed strong opposite overlaps of the paps2/4 transcriptome with
stress-treated plants and stress-related mutants (Table 8). This means that genes upregulated during
the stress treatments were downregulated in paps2/4 and vice versa. Moreover, many of the
experiments revealed by the comparison were related to short-term stress in the range of several
hours, indicating that PAPS2/4 might be required for immediate stress-responses.
In an alternative approach, the 200 most significantly deregulated genes and the 200 genes with the
strongest fold-changes in paps2/4 were analysed with the Genevestigator “Signature Tool”. This
program searches for similarities with published Arabidopsis transcriptome data sets. As mentioned
before, the transcriptomes of diverse stress-treated plants and stress-related mutants were
overlapping with paps2/4, independently from the selections of input genes mentioned above (data
not shown). As seen in the previous analyses, no specific stress condition could be determined.
Previously, gene expression changes in paps1-1 were analysed based on a microarray with ten-day-
old paps1-1 and Ler seedlings (Vi et al. 2013). In order to determine the degree of overlap between
the two transcriptomes, the differentially expressed genes in paps2/4 and paps1 were compared.
The analysis revealed that the transcriptomes almost did not overlap at all (Fig. 53).
The surprisingly low number of similarly deregulated genes in the mutants suggests that PAPS1 and
PAPS2/4 polyadenylate different target genes. However, the number of significantly deregulated
genes determined by RNA-seq was much lower than the number of differentially expressed genes

Results 115
detected by the microarray. Moreover, these results have to be treated with caution since not the
same Arabidopsis accessions were used in the two experiments.
Table 8 Opposite overlap of significantly deregulated genes in paps2-3 paps4-3 relative to Col-0 with published microarray experiments as determined by MASTA. The MASTA terms of 16 experiments with the highest opposite overlap to paps2 paps4 are given. Types and times of the treatments are in bolt. Genes upregulated in paps2 paps4 are downregulated under the indicated experimental conditions and vice versa. The type of the experiments as annotated by MASTA (encoded to ensure the possibility of tracking the exact experiment), and the number of oppositely overlapping genes are indicated.
Experiment as annotated by MASTA Type of experiment Number of oppositely
overlapping elements
S851&cold_wt-wt_3h stress 23
S8411&cold_soil_1h stress 18
S852&cold_wt-wt_6h stress 15
S411&wounding_sh_15m stress 15
S121&drought_Col-Col stress 13
S854&cold_ice1-ice1_3h stress 13
S113&drought_sh_1h stress 13
S831&heat_rt_15m stress 13
S8414&cold_plate_1h stress 13
M133&BTHwrky18_8h-BTHwt_8h mutants 13
M172&35SMBF1-wt mutants 13
S412&wounding_sh_30m stress 12
E163&elf26_wt-wt_30m elicitors 12
S855&cold_ice1-ice1_6h stress 11
M125&antisenseFBP1-wt mutants 11
S312&osmotic_sh_1h stress 11
Fig. 53 Differentially expressed genes in paps2-3 paps4-3 and paps1-1 do not overlap. Significantly up- and downregulated genes in paps2-3 paps4-3 (paps2/4; in Col-0 background) and paps1-1 (paps1; in Ler background) are depicted in a Venn diagram. Only five genes are similarly deregulated in both
paps mutants, suggesting that PAPS1 and PAPS2/4 polyadenylate different target genes. MA microarray
Mutant vs wild type
paps2/4 (RNA-seq)
paps1(MA)
9851
50
684327
updown
Discussion 116
4. Discussion
4.1 PAPS1 and PAPS2/4 regulate similar developmental processes in different pathways
Based on the Arabidopsis poly(A) polymerase mutant paps1, which exhibits smaller leaves but larger
petals than the wild type, the question arose how reducing the activity of a constitutively expressed
enzyme with a basic cellular function could result in this very specific growth phenotype. Molecular
analyses revealed that the bulk mRNA 3’ end processing is unaffected in paps1-1. Instead, the
phenotype is caused by a small subset of mRNAs which exhibited defective polyadenylation (Vi et al.
2013). For the first time it was demonstrated that cPAPs can have an influence on the expression of
specific genes. Consequently, the modulation of PAPS gene expression or of PAPS protein activity
bears an obvious regulatory potential. The results gained in this thesis confirmed the essential role of
AtPAPS1 and revealed novel and specific functions for the plant cPAPs AtPAPS2 and AtPAPS4.
A complete knockout of PAPS1 function results in male gametophytic lethality in Arabidopsis (Vi et al.
2013), which reveals the essential character of PAPS1. In contrast, the loss of PAPS2 and PAPS4
function results in viable plants with a moderate delay of flowering (Fig. 17). The differential paps
mutant phenotypes observed under standard growth conditions indicate that cPAPs regulate various
developmental processes. Different paps2 single mutants do not exhibit a phenotype (Fig. 15, Fig.
16). Consistently, the PAPS2 promoter was found to be inactive in a GUS reporter analysis (Meeks et
al. 2009; Son Vi, data unpublished). Moreover, paps1-1 paps2-3 double mutants are indistinguishable
from paps1-1 (data not shown). paps1-1 paps4-3 plants exhibit severe pleiotropic defects and only
grow under very mild light and temperature conditions, which indicates that the PAPS1 rest activity
provided from the paps1-1 allele is required for survival (Fig. 20). However, the loss of PAPS2
function enhances the phenotype of paps4 mutants (Fig. 17). Thus, PAPS2 exhibits polyadenylation
activity under certain conditions.
The cPAPs might be guided to specific mRNA substrates by polyadenylation complex components or
other yet unidentified regulatory proteins. These might simultaneously bind the divergent PAPS-CTDs
and detect certain mRNA signals. While a pPAPS1::PAPS4 construct did not rescue the paps1-1
phenotype, the domain swap construct pPAPS1::PAPS4NTD::PAPS1CTD complemented paps1-1 (Vi
2013, PhD thesis). This experiment revealed the functional significance of the PAPS-specific CTDs.
As outlined in the introduction (chapter 1.1.1), both animal and plant cPAPs are bound by diverse
proteins involved in gene regulation. The combination of mutant CPSF30 or CstF64 alleles with
paps1-1 results in lethality. So far, no direct interaction of these factors with PAPS1 has been shown.
However, paps2/4 cstf64 and paps2/4 oxt6 mutants are viable, which supports the idea that PAPS1
and PAPS2/4 act in different genetic pathways. Plants encode more than one functional isoform of

Discussion 117
several polyadenylation factor subunits, e.g. CPSF73 I and II (Xu et al. 2006; see Table 1). This opens
up the possibility that plants possess various differentially assembled 3’ end processing complexes.
In order to reveal unique and novel interaction partners, a yeast-two-hybrid screen has been
performed (Bartholomäus 2012, MSc thesis). The PAPS1- and PAPS4-CTDs were used as bait proteins
in a library-scale mating approach. However, none of the detected putative interaction partners
could be confirmed in vivo using bimolecular fluorescence complementation (Ramm 2013, MSc
thesis). Although NTD and CTD of the bovine cPAP appear to form separate globular structures
(Martin et al. 2004), a repetition of the screen using full length AtPAPS proteins might be required.
Alternatively, a co-immunoprecipitation (Co-IP) with the PAPS::YFP expressing plant lines could be
performed. The fusion proteins could be detected in a Western blot using anti-GFP antibodies (Fig.
47). However, since the polyadenylation complex is very large and some factors might act as bridges
between the cPAPs and other regulatory proteins, certain genetic relations might be missed by Co-IP.
An immunoaffinity isolation of the whole supramolecular protein complex in combination with a
subsequent mass spectrometric analysis could be considered. This method has been used
successfully to identify novel components in Xenopus protein complexes (Conlon et al. 2012; Greco
et al. 2012) and an adapted protocol for plant material is available (Núria Sánchez-Coll, oral
communication).
Since the nuclear AtPAPSs are constitutively expressed (Fig. 5 b) and cPAPs take over essential and
basic cellular functions, both PAPS1 and PAPS4 might be considered as housekeeping genes (Tsukaya
et al. 2013). A Western blot with protein extracts from PAPS::YFP expressing seedlings revealed that
PAPS proteins are present at surprisingly low abundances (Fig. 47). To compare the exact protein
levels of PAPS1 and PAPS4, the Western blot has to be repeated with homozygous T3 lines.
Moreover, the flowering time of the PAPS4.5::YFP-expressing paps4 and paps2/4 lines has to be
tested. If the transgene does not completely rescue the mutant phenotype, other alternatively
polyadenylated PAPS4 splice forms might also be translated and exhibit regulatory functions. While
only one PAPS1 splice form exists, PAPS4 exhibits at least ten transcript isoforms that are
alternatively spliced and polyadenylated in the 3’ region of the gene. Interestingly, only one of the
two most abundant transcript forms is translated into a protein (Fig. 47, Fig. 48). Alternative splicing
and polyadenylation of cPAP genes has been observed in other eukaryotes before. However, in both
zebrafish and mouse the use of an alternative intronic PAS leads to substantial shortening of the
resulting transcript. The short isoform of the mouse cPAP can only be detected in some tissues and is
not translated into a protein (Zhao and Manley 1996). The short supposedly non-coding PAPOLB
isoform detected in some zebrafish tissues has been suggested to be produced in favour of exclusive
mRNA polyadenylation by PAPOLG (Ulitsky et al. 2012). This scenario could be transferred to
Arabidopsis. The production of non-coding transcripts for regulatory purposes has been observed

Discussion 118
before. Prominent examples are the alternative processing events of FCA and FPA which have been
described in detail in the introduction (chapter 1.2.2). To analyse FCA transcript abundances, an
RNase protection assay was proved to reveal all splice forms efficiently (e.g. Macknight et al. 1997).
Since the AtPAPS4 transcript isoforms have very similar sequences and sizes, the exact transcript
amounts cannot easily be detected by PCR or Northern blot. Whether all PAPS4 splice forms
annotated at TAIR are present in Col-0 under standard conditions could be tested by single molecule
direct sequencing, an approach that has been used successfully to precisely describe alternative 3’
end processing in fpa mutants (Duc et al. 2013). In zebrafish, the 3’ terminome was determined by
poly(A)-position profiling by sequencing (Ulitsky et al. 2012). These methods might be sensitive
enough to capture the exact PAPS4 polyadenylation forms present in Col-0.
Interestingly, in a Western blot analysis both the PAPS1::YFP and PAPS4::YFP proteins were around
15 kDa larger than predicted (chapter 3.3.1, Fig. 47). Mobility shifts in SDS-PAGEs can be caused by
certain amino-acid side chains, like prolins and tyrosines, which are indeed abundant in both cPAPs
(Garfin 2003). Shifts in migration behaviour could also indicate post-translational protein
modifications. Phosphorylation of the animal PAPα has been reported (Martin and Keller 2007).
However, protein phosphorylations are easily being lost during sample preparation if no phosphatase
inhibitor is used. Moreover, it changes the molecular mass only by around 80 Da (mass changes listed
on www.sigma-aldrich.com). Additionally, PAPα was shown to be sumoylated (Vethantham et al.
2008). Sumoylation of proteins can be tested in vitro. One SUMO does indeed result in a size increase
of 15 to 17 kDa in SDS-PAGEs (Park-Sarge and Sarge 2009). In plants, sumoylation has for example
been shown to be implicated in stress resistance and flowering time (Miura et al. 2007; Jin and
Hasegawa 2008). However, since the mobility shift was observed for both PAPS1 and PAPS4,
potential protein modifications do not seem to determine PAPS-specificity. It would be interesting to
see whether the PAPS protein migration behaviour in an SDS-PAGE changes under certain plant
growth conditions.
The nuclear localization of PAPS1 and PAPS4 was confirmed by microscopy (Fig. 48, Fig. 49).
Seedlings expressing PAPS1::YFP generally exhibited a stronger YFP signal than seedlings expressing
PAPS4::YFP, although the offspring of the earliest flowering paps4 and paps2/4 T1 lines was used in
the analysis. The expression levels of both cPAPs were found to be similar (Fig. 5 b). Thus, at least
equal signal strengths had been expected. The low PAPS4 signal strength observed could be based on
the insertion site of the transgene in the tested mutant lines. An expression analysis has to be
repeated with homozygous lines that show the best complementation.

Discussion 119
4.2 An optimized PAT test is required to reveal mRNA specificity of cPAPs
The identification of the PAPS1-specific polyadenylation of SAUR mRNAs was the first direct proof of
cPAP isoform-dependent gene regulation in plants. Indirect support for the concept is provided by
the finding that FLC transcript abundances are decreased in paps1-1 but are increased in paps2/4
(Fig. 23, Fig. 24). Thus, Arabidopsis cPAPs are not completely interchangeable.
In the paps1 mRNA fractionation, FLC was not found to exhibit an altered PAT length (not shown).
Since the fractionation was performed with RNA from ten-day-old Ler and paps1-1 seedlings, the FLC
expression level might have been too low to observe significant differences between the transcript
amounts in the long and short fractions. An RNA immunoprecipitation (RIP) with the PAPS::YFP-
expressing lines could be considered in order to identify further specific targets. A real-time PCR-
based method to detect low abundance RNAs subsequently to an Arabidopsis RIP has been described
(Rowley et al. 2013). It remains possible that PAPS1 represses flowering by specifically
polyadenylating components that are required for the upregulation of FLC. A parallel RIP-seq with
PAPS1::YFP- and PAPS4::YFP-expressing lines might be suitable to identify PAPS-specific target RNAs
at a global scale, but might miss low abundance and antisense RNAs.
The significant increase of the FLC transcript level in paps2/4 led to the idea that either FLC or
COOLAIR might exhibit an altered PAT length in the mutant. However, so far no altered PAT lengths
were detected by the fractionation of paps2/4 mRNAs into pools of short-tailed and long-tailed
mRNAs (Fig. 36, Fig. 37). A paps2/4 transcriptome analysis revealed strong global gene expression
changes (chapter 3.4.3). This could mean that the wrong transcripts were looked at in the
fractionation analysis. Alternatively, significant PAT alterations of lowly expressed transcripts like
COOLAIR in paps2/4 or FLC in paps1 might in general not be captured by the RNA fractionation. Since
housekeeping genes cannot be used for normalization, the output for a given sample is its primer
efficiency to the power of the negative cycle threshold value determined by qPCR. Subtle PAT
changes become easily blurred by small technical variations which are unavoidable regarding the
fractionation protocol. Since all samples were treated equally and equal amounts of the in vitro-
transcribed RNAs were pipetted to all samples, it is difficult to recapitulate why the paps2/4 samples
contained higher RNA amounts than the Col-0 samples (Fig. 36, Fig. 37, Fig. 51).
The attempt to reveal tail changes of mRNAs in paps2/4 using a PCR-based PAT test described in
chapter 3.4.1 failed, although the test was successfully used with regard to the SAUR mRNAs in paps1
(Vi et al. 2013). An amplification bias towards shorter PCR products, i.e. transcripts with shorter tails,
is inherent to PCR-driven PAT tests. Since SAUR mRNAs almost completely lack A-tails, the PAT test
was suitable in this case. Subtle differences especially with regard to tail elongations are difficult to
catch. Similarly to the RNA fractionation, only strong trends can be substantiated by this method.

Discussion 120
As discussed in Jalkanen et al. (2014), all methods that aim to determine PAT sizes exhibit a higher
accuracy with regard to more strongly expressed genes. The classic RNase H/ Northern blot method
is very time-consuming, requires large amounts of RNA and is still not reliable for transcripts with a
low abundance. An anchor-based alternative to the G/I-tail based PAT test used here is the so called
extension PAT test (ePAT; Jänicke et al. 2012). Prior to the cDNA synthesis, an oligo (dT) anchor with
a 3’-overhang is hybridized to the poly(A) tails of mRNAs. The mRNA 3’ end is extended
complementary to the anchor sequence using a Klenow polymerase, followed by an RT-PCR that
starts at the anchor. Subsequently, specific PAT lengths can be determined using a gene-specific and
an anchor-specific primer. In combination with a nested PCR, the ePAT has recently successfully been
used to show PAT length changes of three more PAPS1-specific target genes in the paps1 mutant
(Kolbe 2014, BSc thesis). Thus, more putative PAPS2/4-target genes should be examined with the
optimized ePAT to confirm the mRNA specificity of these cPAPs.
4.3 PAPS1 represses flowering by promoting FLC expression The early flowering phenotype of paps1-1 was found to be associated with reduced FLC transcript
levels (Fig. 23), which indicates that PAPS1 is involved in the regulation of FLC expression. Supporting
this idea, the loss of FLC or the overexpression of FCAγ do not enhance the early flowering of paps1
(Fig. 27, Fig. 31). As mentioned above, the FLC PAT size was unchanged in paps1, which indicates that
PAPS1 might not directly polyadenylate FLC.
A simple explanation for the reduced FLC level could be elevated levels of FCAγ in paps1. PAPS1
activity might be required for the functional autoregulation of FCA expression. There is no flowering
time difference between 35S::FCAγ paps1-1 and 35::FCAγ plants (Fig. 31). Additional support for this
scenario is provided by the recent finding that, like paps1, 35S::FCAγ plants are resistant to oxidative
stress induced by paraquat (Lee et al. 2014; Fig. 44). However, the paps1-1 mutant is not epistatic to
fca-9 or fy-2, which indicates that an independent pathway is deregulated in paps1.
Alternatively, PAPS1 might specifically polyadenylate an FLC-promoting factor (reviewed e.g. by
Henderson and Dean 2004; Rataj and Simpson 2014). Some FLC activators can be excluded because
the early flowering mutants exhibit pleiotropic defects that were not observed in paps1. The loss of
ESD4 for example results in elevated SA levels (Villajuana-Bonequi et al. 2014), but SA-levels are
unchanged in paps1 (Trost et al. 2014). Several chromatin remodelling factors are required for the
initial expression of FLC (reviewed e.g. by Rataj and Simpson 2014). The expression level of these and
other less-known FLC activators in paps1 could be tested. Mutants of two cap-binding complex
factors and of the cap-associated protein SERRATE flower early and exhibit serrated leaves, which is
reminiscent of the paps1 phenotype (reviewed by Rataj and Simpson 2014). However, these factors
mediate the FRI-dependent FLC upregulation, a pathway not active in Col-0. It would still be

Discussion 121
interesting to examine the effect of FRI in paps1. An F2 generation segregating for paps1-1 and FRISf-2
was vernalized prior to genotyping before the paps1-1 cold-sensitivity had been revealed.
Accordingly, no homozygous paps1 FRISf-2 plants survived a cold treatment of four weeks. To see
whether the FRI-mediated FLC-upregulation is defective in paps1, the experiment should be repeated
without vernalization treatment.
4.4 PAPS2 and PAPS4 ensure timely flowering in a common pathway with FCA In contrast to paps1 mutants, single and double mutants of the cPAPs PAPS2 and PAPS4 are
indistinguishable from the wild type under standard growth conditions (Fig. 15). However, all
analysed paps4 and paps2 paps4 lines flowered moderately late (Fig. 16, Fig. 17). Apparently, the
two redundant cPAPs PAPS2 and PAPS4 promote flowering in Arabidopsis. Growth under short
photoperiods did not increase or rescue the paps2/4 mutant phenotype (Fig. 19). As described in
detail in chapter 3.1.3, the mutant phenotype does not seem to be caused by altered GA or SA levels
or by deregulation of the temperature and age pathways. Therefore, deregulation of the
autonomous pathway was considered.
While the FLC transcript level was indeed found to be twofold upregulated in paps2/4, neither the
loss of FLC nor the overexpression of FCAγ could completely rescue the late flowering phenotype
(Fig. 27, Fig. 31). Surprisingly, the point mutant flc-5 (in Ler background) suppressed the late
flowering phenotype almost completely, but the deletion mutant flc-2 rescued only partially. An
explanation for this discrepancy could be that the effect of the loss of PAPS2/4 is less pronounced in
the mixed background of Col-0 and Ler. The flowering time difference between cstf64-1 and wild
type was slightly reduced in mixed background in comparison to the pure Landsberg background (Fig.
28). The flowering time of the homozygous offspring of a paps2-3/+ paps4-3/+ (Col/Ler) should have
been determined. However, the elevated FLC levels and the decreased floral pathway integrator
levels detected in paps2/4 motivated a further search for deregulation of the autonomous pathway.
Apparently, other flowering inhibitors are involved in the late flowering of paps2/4. While MAF2 and
the FLMδ were not affected, the transcript levels of SVP and FLM were significantly reduced (Fig.
25). Reduced SVP and FLM levels are typically associated with early flowering under higher ambient
temperatures due to enhanced FT and SOC1 expression (Posé et al. 2013). Moreover, the loss of SVP
function is accompanied by an early flowering time, even in the presence of high FLC levels (e.g. Li et
al. 2008). Consistent with the late flowering of paps2/4 even under higher ambient temperatures,
the expression levels of several floral pathway integrators were significantly decreased (Fig. 24). It
appears that the inhibitory effect of FLC and other yet unidentified MAFs on the FPIs exceeds the
flowering promoting effect based on the loss of the SVP-FLMβ protein complex in paps2/4. It has
been documented before that different FPI-regulating factors can outweigh each other. Mutants of
Discussion 122
the E3 ubiquitin ligase CUL4 for instance exhibit high FT mRNA levels and thus flower early despite
simultaneously increased FLC expression (Pazhouhandeh et al. 2011). The finding that SVP and FLM
PAT lengths are not altered in paps2/4 (Fig. 52) suggests that one or more yet unidentified upstream
factors are direct PAPS2/4 target genes.
While paps2/4 responded to vernalization and the FLC-level was indistinguishable between wild type
and mutant after an extended cold period, the flowering delay was still not completely rescued (Fig.
32, Fig. 33). Other vernalization-independent flowering inhibitors might be upregulated in paps2/4.
MAF3 is downregulated and MAF5 is upregulated by cold, but MAF4 expression is indeed not
affected by vernalization (Ratcliffe et al. 2003). Although both overexpression and knockout of MAF4
have only little physiological consequences in Col-0, a maf4 mutant could rescue the late flowering
phenotype of the PRC1 RING-finger protein mutant Atring1a due to altered FPI gene expression
(Ratcliffe et al. 2003; Shen et al. 2014). Moreover, the MAF4 and MAF5 chromatin structures differ
from the other MAFs, and the two factors respond differentially to activity changes of certain
chromatin remodelling factors (Jiang et al. 2008; Xu et al. 2013; Shen et al. 2014). In combination
with other deregulated factors in paps2/4, MAF4 could indeed cause a moderate delay of flowering.
Next, the genetic interactions of PAPS2/4 with FCA and FY were analysed. Interestingly, PAPS2/4
were found to act in the same pathway like FCA, but independently from FY (Fig. 29, Fig. 30).
Accordingly, the FY expression level was not altered in paps2/4 (not shown). Similarly, the transcript
abundance of FCAγ, encoding the active FCA protein isoform, was unchanged in paps2/4 (not
shown). The fact that paps2/4 mutants do not flower as late as fca mutants suggests that PAPS2/4
act downstream of FCA. To confirm this result, the FCA protein abundance in paps2/4 could be
checked in a Western blot (Quesada et al. 2003).
In unvernalized seedlings, FCA promotes the polyadenylation of COOLAIR class I in concert with FY
and CstF64 (Ietswaart et al. 2012). Since cstf64-1 and fy-2 are not epistatic to paps2/4 and the
COOLAIR class I expression is not deregulated (Fig. 28, Fig. 29, Fig. 34 a), this pathway is not affected
by the loss of PAPS2/4. Instead, FCA and PAPS2/4 seem to regulate the expression of flowering
inhibitors in a novel, so far unidentified pathway that has a minor, but still significant impact on
timely flowering. The overexpression of FCAγ repressed the paps2/4-mediated flowering delay only
partially (Fig. 31). An explanation for this puzzling observation might be that the FLC expression is
completely suppressed in paps2/4 35S::FCAγ, but the PAPS2/4-dependent deregulation of the yet
unidentified flowering inhibitor is not rescued. FLC and for example MAF4 expression levels in
paps2/4 35S::FCAγ could be checked by qPCR.
As paps2/4 fca-9 is completely epistatic to fca-9 (Fig. 30), FCA should control the expression level of
all flowering inhibitors downstream of PAPS2/4. Indeed, the MAF4 expression level might be slightly
increased in fca-9 (Ratcliffe et al. 2003). Double mutants of fca and flc do not flower later than flc

Discussion 123
single mutants (Michaels and Amasino 2001), indicating that the deregulation of other MAFs is not
reflected at the level of flowering time in fca. However, the only comparative flowering time analysis
of fca flc and flc was performed in a mixed background of Col-0 (flc-3) and Wassilewskija (fca). Since
MAF4 expression varies in different Arabidopsis accessions (Ratcliffe et al. 2003), this analysis should
be repeated in a complete Col-0 background. Strikingly, accession-dependent MAF4 variation might
also explain the flowering time differences of paps2 paps4 flc-2 and paps2 paps4 flc-5.
The findings regarding the regulatory role of AtPAPSs in the flowering time network have been
summarized in Fig. 54.
Fig. 54 PAPS1 and PAPS2/PAPS4 ensure timely flowering in Arabidopsis. PAPS1 represses flowering by promoting FLC expression. It polyadenylates FLC mRNA directly or polyadenylates an essential FLC activator. In contrast, PAPS2 and PAPS4 promote flowering by suppressing FLC transcription and other flowering inhibitors, probably by polyadenylating a factor (X) required for the transcriptional downregulation of these inhibitors. While FCA acts in concert with PAPS2/PAPS4, these two cPAPs act independently from FY and CstF64. PAPS2/PAPS4 are moreover implicated in the upregulation of the temperature-dependent flowering inhibitors SVP and FLMβ via the polyadenylation of one or more so far unidentified direct target genes (Y).
4.5 Putative PAPS2/PAPS4 targets that inhibit FLC and MAF expression
Since FLC mRNA does not exhibit an altered PAT length in paps2/4, the question arises, which
component might be regulated by FCA and polyadenylated by PAPS2/4 in order to inhibit FLC and
MAF expression. Remarkably, the COOLAIR class II expression was significantly upregulated in both
paps2/4 and paps2/4 FRISf-2 mutants when the plants were transferred to warm temperatures after
growing at 4 °C for six weeks. Accordingly, a trend towards a PAT size increase in paps2/4 was
observed for COOLAIR class II (Fig. 37 b) and the mutants do still flower late after the vernalization
treatment (Fig. 32). The distally polyadenylated FLC antisense transcript has been associated with the
promotion of FLC transcription before (Hornyik et al. 2010; Rataj and Simpson 2014). A functional
significance of COOLAIR class II in the molecular regulation of vernalization is further indicated by the
FCA
PAPS2/PAPS4FY + CstF64PAPS1
FLC flowering inhibitore.g. MAF4
XFLCactivator
or
SVP + FLM
Y

Discussion 124
alternative splicing pattern observed in this study (Fig. 35). Although the different COOLAIR splice
forms have been documented before (Hornyik et al. 2010), this is the first report on cold-induced
intron retention in COOLAIR class II. Recently, defective splicing of COOLAIR class I has been
implicated in flowering time regulation (Marquardt et al. 2014). A similar mechanism is conceivable
for the class II transcript. It is tempting to speculate that PAPS2/4 might regulate flowering time by
suppressing FLC AS class II. However, several observations argue against this scenario. First, the
unvernalized paps2/4 plants flower late but do not exhibit COOLAIR upregulation (Fig. 34). Second,
the high COOLAIR level was not associated with higher FLC levels after the vernalization treatment
(Fig. 33). It can also not be excluded that the FLC level drops faster in Col-0 than in paps2/4 after
return to the warmth. A high-resolution time course analysis of both FLC and COOLAIR abundances
until flowering would be interesting. However, as suggested before, increased levels of the distally
polyadenylated transcript might simply be an artefact due to defects in COOLAIR processing
(Marquardt et al. 2014). Interestingly, COOLAIR class I has been implicated in the vernalization
response in several Arabidopsis species, but class II upregulation during vernalization has only be
observed in Arabidopsis thaliana (Castaings et al. 2014). Similar to MAF4, COOLAIR class II expression
might vary in different Arabidopsis accessions and species. After all, the relatively small flowering
shift caused by the loss of PAPS2/4 suggests an involvement in a regulatory fine-tuning mechanism.
RNA-processing factors have been implicated in the regulation of flowering time before. The
autonomous pathway component FPA is an RNA-binding protein that has also been shown to be
involved in the 3’ end processing of COOLAIR. However, FPA acts genetically independently from FCA
and is most likely not involved in the PAPS2/4-mediated FLC and MAF expression regulation (Hornyik
et al. 2010).
Pcsf4, an Arabidopsis homologue of the yeast polyadenylation factor Paf1c, forms a complex with FY
and controls FCA transcript processing. Interestingly, pcsf4 mutants exhibit a moderately late
flowering phenotype very similar to paps2/4 (Xing et al. 2008b). The delay is increased by FRI, but
only partially rescued by vernalization and by flc-3. Moreover, FLC is upregulated, FPIs are
downregulated and the FY expression is unaffected. The molecular phenotype of pcfs4 is thus
completely identical to paps2/4. Pcfs4 could be a direct target of PAPS2/4 and both expression level
and PAT length of this factor in paps2/4 should be examined. However, Pcfs4 binds FY, but PAPS2/4
have been shown to act independently from FY (Fig. 29). Unfortunately, the phenotype of pcfs4 fy
and pcfs4 fca double mutants has not been examined. It would be relevant to compare the
phenotype of paps2/4 pcfs4, paps2/4 fy and pcfs4 fy mutants and to analyse the FCA transcript
abundances in these mutants, e.g. by Northern blot. Similarly, paps2/4 fca and pcfs4 fca mutants
should be compared. Lastly, it is notable that the deregulation of FCA processing does not necessarily
Discussion 125
result in very strong flowering delays as seen for complete loss-of-function fca mutants. This re-
opens the possibility that PAPS2/4 act upstream of FCA and might be involved in FCA processing.
Several chromatin remodelling factor mutants exhibit FLC-dependent late flowering phenotypes. The
autonomous pathway components FLD and FVE are involved in histone deacetylation at the FLC
locus. Associated in a multiprotein complex, FVE binds FLC chromatin (Jeon and Kim 2011). Similarly,
the mammalian homologue to FLD is part of a histone deacetylase complex (He et al. 2004). Histone
deacetylation is a chromatin mark related to the repression of gene expression (Berger 2007).
Consistently, fld and fve mutants exhibit histone hyperacetylation in FLC chromatin (He et al. 2004).
Similarly, ref6 mutants flower late due to enhanced acetylation of the FLC chromatin (Noh et al.
2004), indicating that the Jumonji/zinc-finger-class transcription factor REF6 is involved in chromatin
remodelling despite the absence of typical DNA-binding domains. Although these autonomous
pathway factor mutants usually exhibit very high FLC levels, deregulations of these factors in paps2/4
cannot be excluded.
Interestingly, next to histone deacetylation both FVE and FLD have also been shown to be involved in
histone demethylation. Trimethylation of lysine 4 of histone 3 (H3K4me3) triggers transcriptional
activation and FLD-mediated histone demethylation contributes to the repression of FLC. FCA
requires FLD to exert its repressive effect on FLC (Liu et al. 2007). The loss of FCA and FLD was
associated with reduced COOLAIR class I expression. Liu et al. (2007) drew this conclusion regarding
reduced ratios of class I to class II in fca and fld mutants. Remarkably, the reduced ratio could also
result from an elevated class II level while the class I abundance remained unchanged (Gordon
Simpson, oral communication). The total transcript abundance values would have been more
meaningful. If PAPS2/4 was for example required for the polyadenylation of FLD, increased H3K4me3
level should be detected at the FLC locus in paps2/4.
In contrast, the autonomous pathway factor FVE (also termed MSI4) does not function as a histone
demethylase itself, but is part of a large complex that regulates the demethylation of FLC chromatin
at lysine 27 of histone 3 (H3K27). The FVE protein interacts with a factor termed DDB1 which in turn
binds an E3 ligase termed CUL4 (Pazhouhandeh et al. 2011). The CUL4-DDB1FVE complex represses
FLC gene activity by binding a PRC2-like complex which contains the methyltransferase CLF.
Strikingly, CLF-mediated H3K27 trimethylation is also implicated in the regulation of MAF4 expression
(Jiang et al. 2008; Alexandre and Hennig 2008). It is difficult to decipher a putative role of PAPS2/4 in
this pathway, especially since clf and cul4 mutants also exhibit increased H3K27me3 levels at the FT
locus. Thus, both clf and cul4 flower early due to high FT expression in spite of simultaneously high
FLC expression (Pazhouhandeh et al. 2011; Jiang et al. 2008). While such a phenomenon has not
been observed in paps2/4, moderately reduced FVE and/or CLF levels might still be responsible for
the upregulation of FLC and putatively MAF4.
Discussion 126
4.6 PAPS1 and PAPS2/4 are involved in the regulation of different stress response pathways
Since PAPS2 and PAPS4 were found to be upregulated during diverse stress treatments (Fig. 38, Fig.
39), a number of stress tests were performed to learn more about the specific cPAPs functions in
Arabidopsis. Unexpectedly, the paps2/4 mutants did not exhibit hyper-resistance or hyper-sensitivity
during osmotic or salt stress, cold stress or drought (chapter 3.2.2). Several RNA-seq data suggested a
regulatory function of these two cPAPs in the response to biotic stress, but paps2/4 did not display
specific reactions to treatments with a bacterial or a fungal elicitor. In particular the upregulation of
PAPS4 under hypoxia implicated that this cPAP has an essential function in the response to oxygen
depletion stress. Surprisingly, the paps2, paps4 and paps2/4 mutants did not react with specific
sensitivity or resistance to hypoxia, submergence or even complete anoxia (Fig. 40, Fig. 41). Instead,
the double mutants exhibited sensitivity to oxidative stress induced by methyl viologen (Fig. 44),
which will be discussed in the next chapter.
The comparison of deregulated genes in paps2/4 with published transcriptome data sets indicated an
involvement of PAPS2 and PAPS4 in short-term stress regulation (Table 8). Amongst others, plants
treated with cold, heat or drought for 15 minutes or for a few hours exhibited the highest opposite
transcriptome overlap to paps2/4. This suggests that PAPS2/4 are required for the polyadenylation of
early stress-response components. Changes in the PAT size have direct consequences with regard to
mRNA localisation, stability or translatability (see chapter 1.1.4). While both PAPS1 and PAPS2/4
might be exchangeable during long-term stress acclimation, PAPS2/4 might specifically polyadenylate
target mRNAs to adjust gene expression immediately upon stress perception. In mammals, functional
consequences of PAT size changes of specific mRNAs during stress were shown. Hyperadenylation of
mRNAs in response to viral or abiotic stress is triggered by cytoplasmic poly(A) binding proteins that
move to the nucleus upon stress perception (Kumar and Glaunsinger 2010). The hyperadenylated
mRNAs are retained in the nucleus and thus cannot be translated. Similar mechanisms are
conceivable in plants, since the polyadenylation machineries of animals and plants exhibit analogous
compositions (see chapter 1.1.1). Since prompt cellular stress acclimations are not reflected at the
phenotypic level, the expression level of indicator genes should be checked in paps2/4 directly after
the beginning of the stress treatment.
Alternatively, the extensive changes in the paps2/4 transcriptome might result in a compensatory
reaction to stress. Arabidopsis plants in which both ascorbate peroxidase and catalase mRNAs are
targeted for decay by antisense constructs are less sensitive to oxidative stress than the respective
single antisense mutants (Rizhsky et al. 2002). The double antisense mutants exhibited a
compensation response due to certain metabolic adjustments that were not induced in the single
mutants. Apparently, plants can adapt to the loss of certain cellular components required for a stress
Discussion 127
response by inducing alternative defence pathways (Foyer and Noctor 2005). Again, testing the
expression level of certain stress marker genes might give insights into the molecular processes
altered in paps2/4. Since the abundance of the majority of stress-related genes does not change in
paps2/4 (Table 7), these two isoforms might indeed polyadenylate only few early downstream
stress-response genes that are responsible to fine tune the plant tolerance or resistance to
environmental stimuli.
In contrast to paps2/4, several stress-related phenotypes of the paps1 mutants have been uncovered
in this thesis. In accordance to the strong overlap of deregulated genes in paps1-1 with the
transcriptome of cold-treated plants, the loss of PAPS1 activity causes enhanced sensitivity to
prolonged cold (Fig. 43). Moreover, paps1-1 seedlings did not survive a vernalization treatment.
Since the MASTA analysis was performed with genes that exhibited altered PAT sizes in paps1-1, the
detected phenotype validates the large-scale mRNA fractionation as a means to identify specific
AtPAPS functions. Cold is an important environmental factor limiting plant growth, and plants
developed a variety of strategies to acclimate to unfavourably low temperatures (reviewed e.g. by
Theocharis et al. 2012; Huang et al. 2012). Upon cold perception, signalling cascades involving
alterations of the intracellular calcium and ROS levels are induced. A variety of cold-responsive
transcription factors are expressed. The membrane composition changes and cellular protectants are
synthesized. Lastly, plant metabolism and photosynthesis are adjusted to chilly temperatures. Since
paps1-1 seedlings bleached during the cold-treatment, metabolic acclimations might be defective.
Putative PAPS1-target genes might be detected among the genes that exhibit a differential tail size in
paps1-1 and overlapped with the transcriptome of cold-treated plants in the MASTA analysis. Indeed,
all of the 46 genes deregulated in paps1 and overlapping in their expression patterns with the
transcriptome of cold-treated plants exhibit shorter A-tails in the mutant (Kappel et al. submitted).
Of these genes 37 are upregulated and nine are downregulated by cold. The expression level of
interesting candidate genes should be determined in the paps mutants under standard and cold
conditions. After all, the cold experiment should be repeated with alternative paps1 alleles, since the
mutant PAPS1 protein expressed in paps1-1 exhibits heat sensitivity. Although to our knowledge no
study has been published so far in which a heat-sensitive protein also exhibits cold-sensitivity, a
growth defect due to further reduction of PAPS1 activity should be excluded.
Compared to Col-0, the paps1-4 mutant exhibited increased resistance to mannitol (Fig. 42). Thus, a
novel function of PAPS1 in the response to osmotic stress was uncovered. Mannitol-induced drought
and high salt concentrations partially lead to similar cellular reactions (Knight et al. 1997), but paps1
was not found to be more resistant to NaCl than the wild type (not shown). However, only the
germination rate on salt-containing media was tested. In the mannitol experiment, the
determination of the fresh weight gave more reliable insights regarding the hyper-resistance

Discussion 128
phenotype of paps1. Moreover, the paps1 reaction to drought stress by water depletion should be
tested. The observation of a cross-tolerance might facilitate the search for specific components that
depend on polyadenylation by PAPS1. Intriguingly, cold, drought and salt stress are partially
regulated via common signalling pathways since these stress types evoke cellular dehydration (Knight
and Knight 2001; Huang et al. 2012). Certain MAP kinases have been shown to be upregulated by
both low temperatures and osmotic stress (Ichimura et al. 2000). However, since paps1 mutants are
less resistant to cold and more resistant to osmotic stress, probably specific downstream
components of the individual pathways are deregulated rather than common upstream factors.
Notably, stress-related genes containing the dehydration-responsive element (DRE) are responsive to
a class of transcription factors named DRE-binding proteins (DREB) (Huang et al. 2012). Since DREB
are differentially responsive to cold and drought, the expression levels and PAT sizes of these factors
should be checked in paps1.
4.7 PAPS1 and PAPS2/4 regulate the response to oxidative stress in different pathways
Since the CPSF30 mutant oxt6 exhibits unspecific resistance to oxidative stress (Zhang et al. 2008),
the response of paps mutants to increased ROS release in the cytoplasm or the chloroplast was
examined (Fig. 44). Interestingly, the paps1-1 mutant behaved very similar to ROS stress like oxt6.
Double mutants of paps1-1 and oxt6 are not viable, which indicates that both PAPS1 and CPSF30
might act in a common pathway to negatively regulate the reaction to ROS stress in the wild type. In
accordance, the bulk of alternatively polyadenylated genes and transcripts with altered abundances
in oxt6 exhibited significantly shorter PAT sizes in paps1 (Kappel et al. submitted).
In contrast, paps2/4 mutants reacted sensitively to ROS-stress induced by MV and paps2/4 oxt6
triple mutants had an intermediate phenotype. Apparently, PAPS2/4 act in a different pathway
independently from CPSF30 to promote resistance against oxidative stress generated in the
chloroplast. The fact that paps1 reacts to both MV and BSO/AT, while paps2/4 only shows a
differential phenotype in response to MV confirms that the chemicals induce ROS-production only in
the specific cell compartments.
The loss of PAPS1 and PAPS2/4 has a great influence on ROS sensitivity and the question arises
whether a direct detoxification mechanism or a signalling pathway requires specific cPAP activity in
Arabidopsis. It is tempting to speculate that the cPAPs polyadenylate specific stress-related genes in
response to elevated ROS levels. For paps1 mutants, a transcriptome correlation was detected with
plants overexpressing tAPX (chapter 3.2.4, Kappel et al. submitted). This enzyme scavenges H2O2 in
the chloroplast. Most of the genes overlapping between the two mutant transcriptomes are more
strongly induced, which indicates that these genes are usually repressed by H2O2 in the wild type.
The redox status of paps1 was tested with a redox-sensitive form of GFP that was specifically
Discussion 129
expressed in the cytosol or the chloroplast (Kappel et al. submitted). While the cytosolic redox state
was not altered compared to wild type, a more oxidizing environment was discovered in the
chloroplast. However, no elevated H2O2 levels were detected in paps1 leaves using 3,3'-
Diaminobenzidine (DAB) staining (Trost et al. 2014). Thus the molecular changes induced by the loss
of PAPS1 seem to be more intricate.
As outlined in the introduction (chapter intro 1.3.2), diverse antioxidant components and enzymes
are constantly being produced by plant cells. In the chloroplast, efficient ROS detoxification by
ascorbate and reduced glutathione is essential to ensure optimal photosynthetic efficiency (Foyer
and Shigeoka 2011). Thioredoxin reductases are implicated in cytosolic and mitochondrial ROS
scavenging (Meyer et al. 2009). Some components required for these cyclic detoxification networks
might directly depend on polyadenylation by a specific cPAP, especially regarding the unspecific ROS
resistance exhibited by paps1-1. The loss of CPSF30 results in a defective expression of a subset of
thioredoxin- and glutaredoxin-related factors (Zhang et al. 2008). However, none of these genes was
deregulated in the paps mutants (not shown).
Alternatively, certain redox-responsive signalling components might be defective in the paps
mutants. The molecular acclimations of plants in response to ROS stress are highlighted in chapter
1.3.2. The ROS-induced signal transduction could be impaired in both paps1 and paps2/4 mutants,
although the defects would have to affect factors of opposite functions. Regarding the very specific
growth defect of paps2/4 that is only observed during paraquat-induced ROS-production in the
chloroplast, a defective downstream factor in the signalling chain depending specifically on
polyadenylation by PAPS2/4 seems likely. Accordingly, the bulk of stress-related genes was not
significantly deregulated in the paps2/4 transcriptome (Table 7). Since the mutant transcriptomes
were determined under standard growth conditions and in particular pap2/4 mutants do normally
not show phenotypic abnormalities, an analysis of gene expression changes in the paps mutants
during the oxidative stress treatment could reveal further PAPS-dependent molecular mechanisms
(Laloi et al. 2007).
The question remains how PAPS1 and CPSF30 might act together. A direct binding of CPSF30 and
PAPS1 has not been shown so far. Instead, a yeast-two-hybrid based screen for direct protein
interactions of Arabidopsis 3’ end processing factors revealed an interaction of CPSF30 with PAPS2
and PAPS3 (Hunt et al. 2008). However, since promoter studies revealed that these two cPAPs are
almost not expressed in Arabidopsis leaves (Meeks et al. 2009), the physiological role of this
interaction seems negligible. The unique features of CPSF30, described in chapter 1.3.3, turn this
polyadenylation factor into a putative sensor of ROS and other environmental stimuli that
simultaneously influences APA. The activity of both the short and the long CPSF30 protein isoform
might not only be influenced by the cellular redox or calcium states, but also by interacting proteins.

Discussion 130
Several CPSF30 binding partners have been identified in Arabidopsis. It has been shown that CPSF30
binds Fip1 (also termed AtFIPS5) (Forbes et al. 2006). Fip1 acts as a bridge to other polyadenylation
factors, to the nuclear poly(A) binding protein and to PAPS itself (Forbes et al. 2006; Hunt et al.
2008). Conformational changes or changes in the CPSF30 activity might influence the PAS choice of
the polyadenylation complex, and potentially even the poly(A) tail length, although altered tail
lengths were not observed in the oxt6 mutant. Moreover, AtCPSF30 can interact with itself, and the
formation of homodimers or heteromeric complexes of both CPSF30 variants in response to certain
impacts might change features of the whole polyadenylation complex (Delaney et al. 2006; Zhao et
al. 1999). PAPS-specific target mRNAs supposedly contain distinct cis elements (described in chapter
1.1.1), which might be detected by specifically composed complexes. Thus, although PAPS1 and
CPSF30 do not directly interact, their functions are intimately linked at the level of mRNA processing
and a molecular bridge could be provided by other polyadenylation factors.
So far, not much is known about the putative functions of the long CPSF30-YT521-B protein (Fig. 13).
As mentioned above, the C-terminal protein domain is highly similar to a human splicing factor. The
mammalian YT521-B homologue is involved in pre-mRNA splicing and binds other regulatory
proteins, e.g. other splicing factors (Stoilov et al. 2002). In other words, the long polypeptide
encoded by the CPSF30 gene combines RNA-binding activity, and all CPSF30 protein features
described above with the potential regulation of splicing (Xing and Li 2011). Proteins containing YTH-
domains (for YT521-B homology) are abundant in plants (Stoilov et al. 2002), but only one yeast YTH
protein has been identified so far. The yeast YTH protein Pho92 is not involved in splicing but
decreases the stability of an mRNA via interaction with a deadenylase complex (Kang et al. 2014).
Pho92-binding to the 3’ UTR of its target decreases the mRNA half-life, probably due to PAT
degradation. Interestingly, Pho92 is responsive to intracellular phosphate levels. Thus, the YTH-
domain protein Pho92 putatively functions in 3’ processing and is responsive to certain cellular
stimuli. These findings indicate the regulatory potential of CPSF30-YT521-B and it is only a matter of
time until this protein will be investigated more in detail.
Lastly, the AtPAPS protein levels might be altered in response to certain environmental stimuli, which
might have consequences regarding the PAT length of PAPS-specific target mRNAs. As outlined above
(chapter 1.1.2), abundance changes of certain factors influence the PAS choice and thus mRNA fate.
Indeed, cPAPs are targeted by diverse protein modifications, which might result in activity changes or
in altered protein binding capacities. Putative changes of PAPS abundances could be traced with the
homozygous offspring of pPAPS::PAPS:YFP-expressing lines.
Conclusion 131
5. Conclusion The detailed analysis of Arabidopsis paps mutants revealed novel and specific functions of two
different canonical poly(A) polymerase subsets in plants. PAPS1 is implicated in the repression of
flowering by activating the main flowering inhibitor FLC. In contrast, the two redundant cPAPs PAPS2
and PAPS4 promote flowering in a novel regulatory pathway downstream of FCA. To repress FLC and
other flowering inhibitors, PAPS2/4 probably polyadenylate factors involved in transcriptional
downregulation, like chromatin remodelling factors. It could not be excluded that PAPS2/4 ensure
timely flowering by modulating the abundance of COOLAIR transcripts which have been implicated in
the regulation of both the autonomous pathway and vernalization before.
Moreover, the loss of PAPS1 activity confers plant resistance to osmotic and oxidative stress and
simultaneously results in cold sensitivity. PAPS2/4 are required to maintain a balanced redox state by
promoting ROS detoxification in the chloroplast and probably regulate early cellular stress responses.
The individual paps mutant phenotypes provide new evidence for an additional layer of gene
regulation based on PAPS-specific polyadenylation of selected mRNAs in response to internal and
environmental stimuli. While PAPS1 exhibits a more global role regarding plant growth, development
and defence, PAPS2/4 seem to be required for the fine-tuning of flowering and stress responses.
The exact transcripts that specifically depend on PAPS1 or PAPS2/4 polyadenylation in the
aforementioned pathways remain elusive. In the future, a reliable assay measuring poly(A) tail
lengths will be essential to confirm the models developed above. The cellular localization of two
cPAPs could be confirmed with paps mutants that were transformed with PAPS1- and PAPS4-YFP
rescue constructs. These plant lines could be used to gain further insights into changes of PAPS
protein abundances during stress treatments. The existence of non-coding PAPS4 splice forms in
Arabidopsis indicates that furthermore an autoregulatory mechanism may be involved in balancing
the cellular PAPS4 protein content. It will be exciting to reveal further details about the intricate gene
regulation mechanisms based on cPAP specificity.
Since yeast encodes only one cPAP and mutations in mammalian cPAPs result in lethality, the
investigation of the differential functions of poly(A) polymerase isoforms in plants provides an
important addition to the research field of 3’ end processing. The polyadenylation apparatus of
mammals and plants exhibit very similar compositions. It is thus conceivable that similar cPAP-based
regulatory mechanisms will be revealed in other organisms in the future.

Appendices 132
Appendix A Technical equipment Name Type; company (located in Germany or as indicated)
Agarose gel chambers PerfectBlue Gel System; Peqlab Biotechnologie GmbH, Erlangen Autoclave 3850 EL; Systec, Wettenberg Bead dispenser TissueLyser; Qiagen, Venlo, The Netherlends Camera SX220 HS Powershot; Canon, Tokio, Japan Centrifuge Avanti J-25; Beckman Coulter, Brea, California USA Clean benches Holten Lamin Air 1.8; Thermo Scientific, Waltham, USA
Nuaire; Integra Biosciences GmbH, Fernwald Confocal laser scanning microscope LSM 710; Carl Zeiss, Jena Cooling centrifuge 5417R; Eppendorf AG, Hamburg Electroporation apparatus Micropulser; Bio-rad Laboratories; Hercules, USA Fluorescence Microscope BX51; Olympus, Tokio, Japan Gas monitoring system LI-800 Gas Hound Analyzer; LI-COR, Lincoln, Nebraska USA
Microx TX2; PreSens Precision Sensing GmbH, Regensburg Gel documentation system BioDocAnalyze; Biometra, Göttingen Homogenizer RZR2020; Heidolph/ Heidrive, Kelheim Incubator/ shaker Ecotron; Infors HT, Bottmingen, Schweiz Laboratory high-accuracy scale AB104-S; Mettler-Toledo GmbH, Gießen Laboratory scales BL150S, BL6100; Sartorius, Göttingen Laser-scanning microscope LSM510 Axioplan2; Carl Zeiss, Jena Light Sensor Lightscout #3415FX Light Sensor Reader; Spectrum Technologies,
Inc., Aurora USA Magnetic stand, 6 Tube AM10055; Applied Biosystems, Foster City, CA, USA Magnetic stirrer heat-stir SB162; Stuart, Stone, Staffordshire, UK Mini Centrifuge Biofuge pico; Heraeus GmbH, Hanau Mixer mill Mixer mill MM301; Retsch GmbH, Haan PCR Machines PTC200; MJ Research, St. Bruno, Quebec, Canada
Mastercycler nexus eco, Mastercycler pro 384; Eppendorf AG; Hamburg
pH meter pH210; Hanna instruments, Kehl am Rain Pipettes Eppendorf AG; Hamburg Plant incubator Percival incubator; Percival, Perry, USA Plate centrifuge 4K15; Sigma Laborzentrifugen GmbH, Osterode im Harz Plate rotator KS 260 basic; IKA-Werke, Staufen Power supplies MP-300V; Major Science, Saratoga, CA, USA SDS-PAGE system Mini-Protean Tetra System; Bio-rad Laboratories, Hercules, USA Spectrophotometer Pico100; Biozym Scientific GmbH; Hessisch Oldendorf Stereo microscope Stemi 2000-C; Carl Zeiss, Jena Table centrifuge Biofuge pico; Heraeus GmbH, Hanau Thermomixer Thermomixer comfort; Eppendorf Tube rotator SB3; Stuart, Stone, Staffordshire, UK UV transilluminator UVstar 312 nm; Biometra, Göttingen Vacuum drying oven VD 115; Binder GmbH, Tuttlingen Vortex Vortex Genie 2; Scientific industries, Bohemia, NY, USA Western Blot Visualization System NightOWL LB 983 NC100; Berthold Technologies GmbH & Co. KG,
Bad Wildbad Wet-Blot Apparatus Mini Trans-Blot Cell; Bio-Rad Laboratories, Hercules, USA

Appendices 133
Appendix B Disposable equipment
Disposable product Company
(located in Germany or as indicated)
96-well PCR plates, 0.2 ml ABgene, Epsom Surrey, UK 96-well plates, 1.2 ml (Collection microtubes, racked) and cap strips Qiagen GmbH, Hilden 384-well PCR plates Applied Biosystem 384-well qPCR plates for LC480 Biozym Scientific GmbH; Hessisch
Oldendorf Blotting paper (Rotilabo®; strength 0.35 mm) Carl Roth, Karlsruhe Cell culture dishes Ø 100 mm Sarstedt, Nümbrecht Cell culture dishes 100 × 100 mm Greiner Bio-One GmbH, Frickenhausen Combitips plus, 0.1 – 0.2 ml Eppendorf, Hamburg Electroporation cuvettes (1 or 2 mm gap) PeqLab Biotechnologie GmbH, Erlangen Glass beads, unwashed, ≤106 µm (glass sand) Sigma-Aldrich, St. Louis, USA Inoculating loops Carl Roth, Karlsruhe Metal beads 0.25 mm Carl Roth, Karlsruhe Nitrocellulose membrane (Roti-NC©; 0.2 µm pore size; 0.15 ± 0.05 mm membrane strength)
Carl Roth, Karlsruhe
Parafilm® M Bemis, Neenah, WI, USA PCR-Softstrips 0.2 ml ABgene, Epsom Surrey, UK Pipette tips, with or without filter (Tipone system) Starlab GmbH, Hamburg Polypropylene tubes 50 ml VWR, Radnor, PA, USA Polypropylene tubes 15 ml VWR, Radnor, PA, USA Reaction tubes (1.5 ml/ 2 ml) Sarstedt, Nümbrecht Sealing-film for PCR ABgene, Epsom Surrey, UK Sealing-film for 384-well qPCR plates for LC480 Biozym Scientific GmbH; Hessisch
Oldendorf Serapore adhesive tape, breathable Seradem GmbH, Krefeld Silicone compression mats for PCR Kisker Biotech GmbH & Co. KG,
Steinfurt Soil, P-Erde and T-Erde Gebrüder Patzer, Einheitserde, Sinntal-
Altengronau Sterile filters (0.2 μm pore size) Whatman Schleicher & Schuell,
München Syringes B. Braun Melsungen AG, Melsungen UVpette P10 pipette tips Biozym Scientific GmbH, Hessisch
Oldendorf Vermiculite Kausek GmbH, Mittenwalde

Appendices 134
Appendix C Oligonucleotide list
Code Name (Reference) Sequence (5‘-3‘)
GTO27 pSV1c_seq_P1_fw GGAAACCAAGTGATTGAGCAGA GTO28 pSV1c_seq_P2_rev GTAGAGAGTAATTTAGCATATAGCAT GTO40 SALK Lba TGGTTCACGTAGTGGGCCATCG GTO41 cstf64.fw ATTCAGATTAGTTACGGATAGAGA GTO42 cstf64.rev ACGGGTTTTGTCAGTGC GTO379 30A_YFP_fw GGACGACGGCAACTACAAGA GTO380 30A_YFP_rev GAACTCCAGCAGGACCATGT GTO381 75A_35s_fw CGACACGCTTGTCTACTCCAA GTO382 75A_35s_rev GAAGGATAGTGGGATTGTGCG GTO383 134A_AlcA_fw CTTCGGGATAGTTCCGACCT GTO384 134A_AlcA_rev CGTCCTCTCCAAATGAAATGA GTO370 PAP13-Genotyping TTGGCAATGTAGGGAAAAGC HBo6 T7 TAATACGACTCACTATAGGG HBo84 PDF2-qPCRfor GCATTTCACTCCTCTGGCTAAG HBo85 PDF2-qPCRrev GGCACTTGGGTATGCAATATG MLo1076 paps1-4_geno_L CCAGTTGATGGGAAGAAGAGAAAA MLo1077 paps1-4_geno_R CTTCGAATGGAGGTATAGTTGCAGTA oHC1 FLC_cDNA_393F AGCCAAGAAGACCGAACTCA oHC2 FLC_cDNA_550R TTTGTCCAGCAGGTGACATC oHC5 SK-003080_LP ACACCACTGTGAGCCTCTTTG oHC6 SK-003080_RP ATGAGAAAAATGAATTGGGGG oHC7 SK-117078_LP CCCGAAACCCTGTAAAAACTC oHC8 SK-117078_RP AGATTTATTGGCTTGGAAGGG oHC14 FT_qRTF ACAACTGGAACAACCTTGGCAATGAG oHC15 FT_qRTR CCTCCGCAGCCACTCTCCCTCTG oHC16 SOC1_qRTF AGCTCTCTGAAAAGTGGGGATCTCAT oHC17 SOC1_qRTR TTTCTTGAAGAACAAGGTAACCCAATG oHC18 LFY_qRTF TGCCCCACCAAGGTGACGAACC oHC19 LFY_qRTR TTCTTCGTCTAGGCAGTGGAGAGCGT oHC20 AP1_qRTF AGGGAAAAAATTCTTAGGGCTCAACAG oHC21 AP1_qRTR CTTCTTGATACAGACCACCCATGTTGA oHC23 FLC_AS_qRTF (Hornyik et al. 2010) CTCGATGCAATTCTCACACG oHC24 FLC_AS1_qRTR (Hornyik et al. 2010) TCCTTGGATAGAAGACAAAAAGAGA oHC25 FLC_AS2_qRTR (Hornyik et al. 2010) TTCTCCTCCGGCGATAAGTA oHC32 SVP_qRTF (Li et al. 2008) CAAGGACTTGACATTGAAGAGCTTCA oHC33 SVP_qRTR (Li et al. 2008) CTGATCTCACTCATAATCTTGTCAC oHC38 flc5_DCAP_40R AACCATAGTTCAGAGCTTTTGACTGAAGATC oHC39 flc5_19+F TTAAAGCCTTGGTAATACAAACATT oHC48 SK-081180_LP CATCAACATGCAAACAAGCAC oHC49 SK-081180_RP AGGGACTCTACGAGAGCAAGG oHC55 FY4 CTGTTGGAAAGGGTTGTTGTAGCCTGGAATC oHC56 LB3 TAGCATCTGAATTTCATAACCAATCTCGATACAC oHC57 CL_FRI_10 CAT GTC GTA ATC ATG CAA CC oHC58 UJ43_FRI prom GAA GAT CAT CGA ATT GGC oHC76 FY_exon16_fw GAACAAGGTTTTGGTCGC oHC101 GSO379 TGTTGAGATGGTGAAACTGTG oHC102 Rlfca9 TCTTTGGCTCAGCAAACC OHC-112 NotI-linker-vYFP_ORF_fw CTACTAGCGGCCGCCCCAGGAGCAGGAGCAGGAG
CAGGAGC OHC-113 vYFP-Stop-NotI_rev TAGTAGGCGGCCGCTTATAACTTGTACAGCTCGTC
CA OHC-114 PAP4_P1_fw CTGTGTTATAACTTGCCTTGTG OHC-115 PAP4-NotI_P3_rev GCCTAGAGGACGTTCAGGCGGCCGCCACAGTGGA
CTTTAAGCTTAACC

Appendices 135
OHC-116 NotI-PAP4_P4_fw GCGGCCGCCTGAACGTCCTCTAGGCTATTG OHC-117 pSV5a_P2-rev AAAAACGAGAGACAAGGAGGC OHC-118 PAP4-NotI_P5_rev TCCATATTAAAAATTCACTTAGGCGGCCGCCCAAA
AGCTTCTGGACTCTGTCG OHC-119 NotI-PAP4_P6_fw GCGGCCGCCTAAGTGAATTTTTAATATGG oHC121 p745 AACGTCCGCAATGTGTTATTAAGTTGTC oHC127 AT1G19180_PAT GTTATTGTCGCCTGTCTAAATCC oHC128 AT1G72450_PAT ACGATCGAGTTCACGTTTCTAG oHC136 AT2G18700_PAT ACAATGTCGAAAGAAAGCATAG oHC161 FLC_transposon_rev (Gazzani et al. 2003) AAACAATCTGGACAGTAGAGGCTTAT oHC162 FLC_transposon_fw (Gazzani et al. 2003) CAGGCTGGAGAGATGACAAAA oHC163 FLC_30bp repeat_fw (Gazzani et al. 2003) AAATGTAAGCCACATTAATTGGGAAA oHC164 FLC_30bp repeat_rev (Gazzani et al. 2003) ATTAAATCATAATTAAGACCAGGAG OHC-165 NPT-5′ (Zhang et al. 2008) CCTGTCCGGTGCCCTGAATG OHC-167 At1g30460_oxt6_fw GAGGATGCTGATGGACTTAG OHC-168 At1g30460_oxt6_rev AATCCTGCTCTCGACATTC oHC187 MAF2 var1_qRTF (Rosloski et al. 2013) TAGAAATAGTCCAAAGCAAGCTTGAAGAATC oHC188 MAF2 var1_qRTR (Rosloski et al. 2013) CGTCTACGAAGGTACAATAAAGATCTACTAT oHC189 MAF2 var2_qRTF (Rosloski et al. 2013) TAGCACAAAGACACTTTTATCTCCCTC oHC190 MAF2 var2_qRTR (Rosloski et al. 2013) CTATAACCAGAAACGTCTTCTTCCC oHC191 FLC-3436.R GCGTCGTGGAAGATGTGTAACTC oHC192 FLC-3569.F GTCAAAACTCAAGCCTCAAAACC oHC204 3045-FY qPCR-F1 (Feng et al. 2011) TCGTCAGCTTCTTCCACTAACATC oHC205 3046-FY qPCR-R1 (Feng et al. 2011) GTGTATGCTTTCTCATTCGTTTCG oHC212 FLM-β_G-30796 (F2) (Posé et al. 2013) CATGCTGATGAACTTAGAGCCTTAGATC oHC213 FLM-β_G-28156 (R2) (Posé et al. 2013) CAGCAACGTATTCTTTCCCAT oHC214 FLM-δ_G-28150 (F2) (Posé et al. 2013) GATAGAAGCGCTGTTCAAGC oHC215 FCA-RT-PCR-F GCTCTTGTCGCAGCAAACTC
oHC216 FCA-RT-PCR-R GATCCAGCCCACTGTTGTTT
oSV110 At4g32850_5R TGCATCTGCTGCCACTATATC oSV111 At4g32850_6F TTGCTGAAGCTGTAGGGTCTG oSV120 SK126395_LP ACATGGAGATGTTGAACTGCC oSV121 SK126395_RP CCACTGTTCCACGTATATCAAAC universal PAT Affymetrix Poly(A) Tail-Length Assay Kit

Appendices 136
Appendix D Oligonucleotide combinations
Experiment Method
chapter
Gene or allele Oligonucleotide combination
(+ restriction endonuclease, if
CAPS/dCAPS marker)
Tm
[°C]
product
sizes [bp]
Genotyping of polyadenylation factor mutants
2.4.10 OXT6, WT allele oHC167 + oHC168 60 319
oxt6 oHC165 + oHC167 60 4000
paps1-4 MLo1076 + MLo1077 + oHC121
60 388 (WT)
paps2-3 oSV120 + oSV121 + GTO40 60 1348 (WT)
paps2-6 oHC5 + oHC6 + GTO40 60 1168 (WT)
paps4-1 oCH48 + oHC49 + GTO40 60 1061 (WT)
paps4-2 oSV110 + oSV111 + oHC121 60 1130 (WT)
paps4-3 oSV110 + oSV111 + GTO40 60 1070 (WT) paps4-4 oHC7 + oHC8 + GTO40 60 1125 (WT)
paps4-5 oHC7 + oHC8 + GTO40 60 1125 (WT)
Genotyping of flowering time mutants; Discriminating FRICol-0 and FRISf-2 (Johanson et al. 2000) Discriminating FLCCol-0 and FLCLer alleles (Gazzani et al. 2003)
2.4.10, 2.4.18
35S::FCAγ oHC63 + oHC68 58 461 FRI, 16 bp indel oHC59 + oHC60 58 208; 224 FRI, promoter oHC57 + oHC58 58 250; 550 fy-2 oHC55 + oHC56 + oH76 58 500; 800 cstf64-1 GTO41 + GTO42 (Hpy188I) 58 175;
100 + 75 fca-9 oHC101 + oHC102 (StyI) 58 ~230;
~200 + 30 flc-2 oHC191 + oHC192 (WT band;
no amplification in flc-2) 60 ~150
flc-5 oHC38 + oHC39 (BglII) 58 220; 200 + 20
FLC, 30 bp-repeat oHC163 + oHC164 60 342; 372 FLC, transposon oHC161 + oHC162 60 570; 1740
qPCR analysis of flowering time genes with Arabidopsis cDNA
2.4.12 AP1 oHC20 + oHC21 60 163 COOLAIR class I oHC23 + oHC24 60 402 COOLAIR class II oHC23 + oHC25 60 171 FCAγ oHC215 + oHC216 60 159 FLC oHC1 + oHC2 60 222
FLM oHC212 + oHC213 60 290
FLMδ oHC213 + oHC214 60 312 FT oHC14 + oHC15 60 230 FY oHC204 + oHC205 60 106 LFY oHC18 + oHC19 60 123 MAF var1 oHC187 + oHC188 60 527 MAF var2 oHC189 + oHC190 60 296 PDF2 HBo84 + HBo85 60 97 SOC1 oHC16 + oHC17 60 145 SVP oHC32 + oHC33 60 104
Poly(A) tail test 2.5.6 At1g19180 oHC127 + universal PAT 60 282 At2g18700 oHC136 + universal PAT 60 233 At1g72450 oHC128 + universal PAT 60 257
qPCR analysis of fractionation control RNAs
2.5.8, 2.4.12
YFP::29A GTO379 + GTO380 60 367 35S::75A GTO381 + GTO382 60 357 AlcA::124A GTO383 + GTO384 60 296

Appendices 137
Appendix E Cloning strategy and vector list
Methods used for cloning Vectors used and produced are listed in Table 10. Specific fragments were amplified by PCR (chapter
2.4.7) using the oligonucleotide combinations listed in Table 9. Oligonucleotide sequences can be
found in Appendix C. The Phusion High-Fidelity DNA Polymerase (NEB) was used for all PCRs. Two
PCR products were fused by fusion PCR (chapter 2.4.9). PCR fragments were subcloned into pGEM-T
via ligation (chapter 2.4.20). E. coli (strain XL-1) was transformed with dilutions of vectors or with
ligation mixes (chapter 2.7.2). The protocol to produce electrocompetent bacteria is described in
chapter 2.7.1. Bacteria colonies containing the transgene were selected by colony PCR (chapter
2.4.8). Vectors were amplified in E. coli and purified by mini prep (chapters 2.4.3, 2.4.5). DNA
sequences were controlled with specific oligonucleotides (chapter 2.4.21) and analysed using Vector
NTI (chapter 2.13). Restriction digests were performed to linearise vectors or to cut fragments from
vectors (chapter 2.4.17). The resulting fragments were purified via agarose gels (chapter 2.4.15).
Linearised vectors were dephosphorylated to avoid self-ligation. The binary low-copy vectors were
amplified via midi prep (chapter 2.4.4). Following a transformation of Agrobacterium tumefaciens
(chapter 2.7.2), colonies positive for the transgene were selected by agrobacteria colony PCR
(chapter 2.4.8). These clones were used to transform Arabidopsis (chapter 2.7.3).
Cloning of the construct pPAPS1:PAPS1::vYFP and plant transformation The PAPS1 promoter (pPAPS1) and the full-length PAPS1 gene had been cloned by cloned by Lang
Son Vi (PhD thesis). By site-directed mutagenesis, an NcoI restriction site had been inserted behind
the stop codon by Gerda Trost (unpublished), resulting in the vector pGT1a. The venusYFP sequence
(vYFP; 750 bp) was amplified from the vector ML850 with the primers oHC112/oHC113 which added
NotI restriction sites to both 3’ and 5’ end of vYFP. The PCR product was subcloned into pGEM-T,
resulting in pHC31. The vYFP sequence was checked using the T7 primer. Both pHC31 and pGT1a
were digested with NcoI and pGT1a was dephosphorylated. The vYFP fragment was ligated into
pGT1a, resulting in the vector pHC26. E. coli colonies positive for the transgene were identified using
primers oHC112/oHC113. The correct insertion of YFP in pHC26 was checked by sequencing the
plasmid with primers GTO27, GTO28 and GTO370. The complete pPAPS1:PAPS1::YFP construct was
cut out of the vector using the restriction endonuclease AscI. The fragment mix was separated on an
agarose gel and the fragment of the correct size was purified. The vector ML1231b was linearised
with AscI and dephosphorylated. The pPAPS1:PAPS1::YFP construct was ligated into ML1231b,
resulting in the vector pHC32. Positive E. coli clones were selected by colony PCR with the primers
oHC112/oHC113. The vector was amplified by midi prep and transformed into agrobacteria (strain
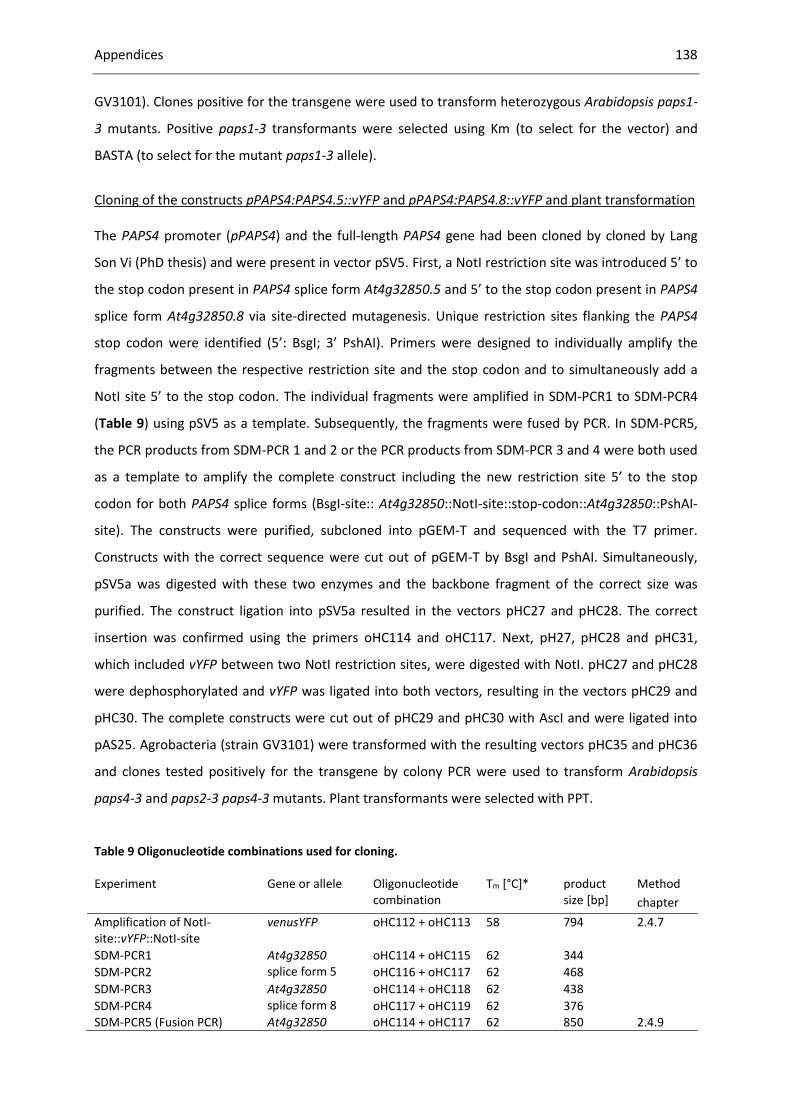
Appendices 138
GV3101). Clones positive for the transgene were used to transform heterozygous Arabidopsis paps1-
3 mutants. Positive paps1-3 transformants were selected using Km (to select for the vector) and
BASTA (to select for the mutant paps1-3 allele).
Cloning of the constructs pPAPS4:PAPS4.5::vYFP and pPAPS4:PAPS4.8::vYFP and plant transformation The PAPS4 promoter (pPAPS4) and the full-length PAPS4 gene had been cloned by cloned by Lang
Son Vi (PhD thesis) and were present in vector pSV5. First, a NotI restriction site was introduced 5’ to
the stop codon present in PAPS4 splice form At4g32850.5 and 5’ to the stop codon present in PAPS4
splice form At4g32850.8 via site-directed mutagenesis. Unique restriction sites flanking the PAPS4
stop codon were identified (5’: BsgI; 3’ PshAI). Primers were designed to individually amplify the
fragments between the respective restriction site and the stop codon and to simultaneously add a
NotI site 5’ to the stop codon. The individual fragments were amplified in SDM-PCR1 to SDM-PCR4
(Table 9) using pSV5 as a template. Subsequently, the fragments were fused by PCR. In SDM-PCR5,
the PCR products from SDM-PCR 1 and 2 or the PCR products from SDM-PCR 3 and 4 were both used
as a template to amplify the complete construct including the new restriction site 5’ to the stop
codon for both PAPS4 splice forms (BsgI-site:: At4g32850::NotI-site::stop-codon::At4g32850::PshAI-
site). The constructs were purified, subcloned into pGEM-T and sequenced with the T7 primer.
Constructs with the correct sequence were cut out of pGEM-T by BsgI and PshAI. Simultaneously,
pSV5a was digested with these two enzymes and the backbone fragment of the correct size was
purified. The construct ligation into pSV5a resulted in the vectors pHC27 and pHC28. The correct
insertion was confirmed using the primers oHC114 and oHC117. Next, pH27, pHC28 and pHC31,
which included vYFP between two NotI restriction sites, were digested with NotI. pHC27 and pHC28
were dephosphorylated and vYFP was ligated into both vectors, resulting in the vectors pHC29 and
pHC30. The complete constructs were cut out of pHC29 and pHC30 with AscI and were ligated into
pAS25. Agrobacteria (strain GV3101) were transformed with the resulting vectors pHC35 and pHC36
and clones tested positively for the transgene by colony PCR were used to transform Arabidopsis
paps4-3 and paps2-3 paps4-3 mutants. Plant transformants were selected with PPT.
Table 9 Oligonucleotide combinations used for cloning. Experiment Gene or allele Oligonucleotide
combination Tm [°C]* product
size [bp] Method
chapter
Amplification of NotI-site::vYFP::NotI-site
venusYFP oHC112 + oHC113 58 794 2.4.7
SDM-PCR1 At4g32850 splice form 5
oHC114 + oHC115 62 344
SDM-PCR2 oHC116 + oHC117 62 468
SDM-PCR3 At4g32850 splice form 8
oHC114 + oHC118 62 438
SDM-PCR4 oHC117 + oHC119 62 376 SDM-PCR5 (Fusion PCR) At4g32850 oHC114 + oHC117 62 850 2.4.9
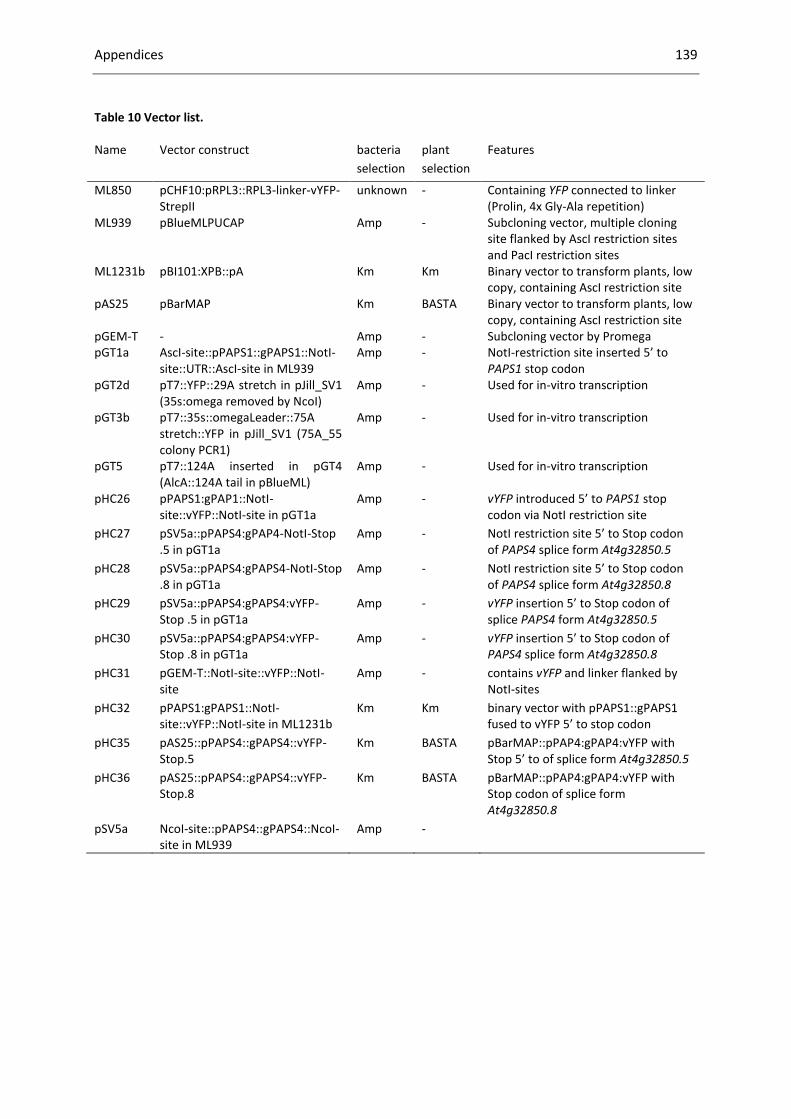
Appendices 139
Table 10 Vector list. Name Vector construct bacteria
selection
plant
selection
Features
ML850 pCHF10:pRPL3::RPL3-linker-vYFP-StrepII
unknown - Containing YFP connected to linker (Prolin, 4x Gly-Ala repetition)
ML939 pBlueMLPUCAP Amp - Subcloning vector, multiple cloning site flanked by AscI restriction sites and PacI restriction sites
ML1231b pBI101:XPB::pA Km Km Binary vector to transform plants, low copy, containing AscI restriction site
pAS25 pBarMAP Km BASTA Binary vector to transform plants, low copy, containing AscI restriction site
pGEM-T - Amp - Subcloning vector by Promega pGT1a AscI-site::pPAPS1::gPAPS1::NotI-
site::UTR::AscI-site in ML939 Amp - NotI-restriction site inserted 5’ to
PAPS1 stop codon pGT2d pT7::YFP::29A stretch in pJill_SV1
(35s:omega removed by NcoI) Amp - Used for in-vitro transcription
pGT3b pT7::35s::omegaLeader::75A stretch::YFP in pJill_SV1 (75A_55 colony PCR1)
Amp - Used for in-vitro transcription
pGT5 pT7::124A inserted in pGT4 (AlcA::124A tail in pBlueML)
Amp - Used for in-vitro transcription
pHC26 pPAPS1:gPAP1::NotI-site::vYFP::NotI-site in pGT1a
Amp - vYFP introduced 5’ to PAPS1 stop codon via NotI restriction site
pHC27 pSV5a::pPAPS4:gPAP4-NotI-Stop .5 in pGT1a
Amp - NotI restriction site 5’ to Stop codon of PAPS4 splice form At4g32850.5
pHC28 pSV5a::pPAPS4:gPAPS4-NotI-Stop .8 in pGT1a
Amp - NotI restriction site 5’ to Stop codon of PAPS4 splice form At4g32850.8
pHC29 pSV5a::pPAPS4:gPAPS4:vYFP-Stop .5 in pGT1a
Amp - vYFP insertion 5’ to Stop codon of splice PAPS4 form At4g32850.5
pHC30 pSV5a::pPAPS4:gPAPS4:vYFP-Stop .8 in pGT1a
Amp - vYFP insertion 5’ to Stop codon of PAPS4 splice form At4g32850.8
pHC31 pGEM-T::NotI-site::vYFP::NotI-site
Amp - contains vYFP and linker flanked by NotI-sites
pHC32 pPAPS1:gPAPS1::NotI-site::vYFP::NotI-site in ML1231b
Km Km binary vector with pPAPS1::gPAPS1 fused to vYFP 5’ to stop codon
pHC35 pAS25::pPAPS4::gPAPS4::vYFP-Stop.5
Km BASTA pBarMAP::pPAP4:gPAP4:vYFP with Stop 5’ to of splice form At4g32850.5
pHC36 pAS25::pPAPS4::gPAPS4::vYFP-Stop.8
Km BASTA pBarMAP::pPAP4:gPAP4:vYFP with Stop codon of splice form At4g32850.8
pSV5a NcoI-site::pPAPS4::gPAPS4::NcoI-site in ML939
Amp -
References 140
References
Abràmoff MD, Magalhães PJ, Ram JS. 2004. Image Processing with ImageJ. Biophotonics Int 11: 36–42.
Addepalli B, Hunt AG. 2007. A novel endonuclease activity associated with the Arabidopsis ortholog of the 30-kDa subunit of cleavage and polyadenylation specificity factor. Nucleic Acids Res 35: 4453–63.
Addepalli B, Hunt AG. 2008. Redox and heavy metal effects on the biochemical activities of an Arabidopsis polyadenylation factor subunit. Arch Biochem Biophys 473: 88–95.
Addepalli B, Meeks LR, Forbes KP, Hunt AG. 2004. Novel alternative splicing of mRNAs encoding poly(A) polymerases in Arabidopsis. Biochim Biophys Acta 1679: 117–28.
Al Husini N, Kudla P, Ansari A. 2013. A role for CF1A 3’ end processing complex in promoter-associated transcription. PLoS Genet 9: e1003722.
Alexandre CM, Hennig L. 2008. FLC or not FLC: the other side of vernalization. J Exp Bot 59: 1127–35.
Amasino RM. 1996. Control of flowering time in plants. Curr Opin Genet Dev 6: 480–487.
Amrani N, Minet M, Le Gouar M, Lacroute F, Wyers F. 1997. Yeast Pab1 interacts with Rna15 and participates in the control of the poly(A) tail length in vitro. Mol Cell Biol 17: 3694–701.
Anders S, Pyl PT, Huber W. 2014. HTSeq - A Python framework to work with high-throughput sequencing data. Bioinformatics 1–4.
Andrés F, Coupland G. 2012. The genetic basis of flowering responses to seasonal cues. Nat Rev Genet 13: 627–39.
Angel A, Song J, Dean C, Howard M. 2011. A Polycomb-based switch underlying quantitative epigenetic memory. Nature 476: 105–8.
Araus JL, Cairns JE. 2014. Field high-throughput phenotyping: the new crop breeding frontier. Trends Plant Sci 19: 52–61.
Atkinson NJ, Urwin PE. 2012. The interaction of plant biotic and abiotic stresses: from genes to the field. J Exp Bot 63: 3523–43.
Aukerman MJ, Lee I, Weigel D, Amasino RM. 1999. The Arabidopsis flowering-time gene LUMINIDEPENDENS is expressed primarily in regions of cell proliferation and encodes a nuclear protein that regulates LEAFY expression. Plant J 18: 195–203.
Barabino SM, Hubner W, Jenny a, Minvielle-Sebastia L, Keller W. 1997. The 30-kD subunit of mammalian cleavage and polyadenylation specificity factor and its yeast homolog are RNA-binding zinc finger proteins. Genes Dev 11: 1703–1716.
Barneche F, Malapeira J, Mas P. 2014. The impact of chromatin dynamics on plant light responses and circadian clock function. J Exp Bot 65: 2895–913.
Bartholomäus L. 2012. Yeast Two-Hybrid Based Interaction Study of Growth-Related Proteins of Arabidopsis thaliana. University of Potsdam.

References 141
Baulcombe DC, Dean C. 2014. Epigenetic regulation in plant responses to the environment. Cold Spring Harb Perspect Biol 6: a019471.
Bäurle I, Dean C. 2008. Differential interactions of the autonomous pathway RRM proteins and chromatin regulators in the silencing of Arabidopsis targets. PLoS One 3: e2733.
Beelman CA, Parker R. 1995. Degradation of mRNA in eukaryotes. Cell 81: 179–83.
Bell S a, Hunt AG. 2010. The Arabidopsis ortholog of the 77 kDa subunit of the cleavage stimulatory factor (AtCstF-77) involved in mRNA polyadenylation is an RNA-binding protein. FEBS Lett 584: 1449–54.
Benjamini Y, Hochberg Y. 1995. Controlling the false discovery rate: a practical and powerful approach to multiple testing. J R Stat Soc Ser B 57: 289–300.
Bentley DL. 2014. Coupling mRNA processing with transcription in time and space. Nat Rev Genet 15: 163–75.
Berger SL. 2007. The complex language of chromatin regulation during transcription. Nature 447: 407–12.
Bernstein P, Peltz SW, Ross J. 1989. The poly(A)-poly(A)-binding protein complex is a major determinant of mRNA stability in vitro. Mol Cell Biol 9: 659–70.
Bowler C, Montagu M, Inze D. 1992. Superoxide dismutase and stress tolerance. Annu Rev Plant Biol 43: 83–116.
Bruggeman Q, Garmier M, de Bont L, Soubigou-Taconnat L, Mazubert C, Benhamed M, Raynaud C, Bergounioux C, Delarue M. 2014. The Polyadenylation Factor Subunit CLEAVAGE AND POLYADENYLATION SPECIFICITY FACTOR30: A Key Factor of Programmed Cell Death and a Regulator of Immunity in Arabidopsis. Plant Physiol 165: 732–746.
Castaings L, Bergonzi S, Albani MC, Kemi U, Savolainen O, Coupland G. 2014. Evolutionary conservation of cold-induced antisense RNAs of FLOWERING LOCUS C in Arabidopsis thaliana perennial relatives. Nat Commun 5: 4457.
Chang H, Lim J, Ha M, Kim VN. 2014. TAIL-seq: genome-wide determination of poly(A) tail length and 3’ end modifications. Mol Cell 53: 1044–52.
Cheval C, Aldon D, Galaud J-P, Ranty B. 2013. Calcium/calmodulin-mediated regulation of plant immunity. Biochim Biophys Acta 1833: 1766–71.
Choi K, Kim J, Hwang H-J, Kim S, Park C, Kim SY, Lee I. 2011. The FRIGIDA complex activates transcription of FLC, a strong flowering repressor in Arabidopsis, by recruiting chromatin modification factors. Plant Cell 23: 289–303.
Choi YH, Hagedorn CH. 2003. Purifying mRNAs with a high-affinity eIF4E mutant identifies the short 3’ poly(A) end phenotype. Proc Natl Acad Sci U S A 100: 7033–8.
Colgan DF, Murthy KG, Prives C, Manley JL. 1996. Cell-cycle related regulation of poly(A) polymerase by phosphorylation. Nature 384: 282–5.
Colgan DF, Murthy KG, Zhao W, Prives C, Manley JL. 1998. Inhibition of poly(A) polymerase requires p34cdc2/cyclin B phosphorylation of multiple consensus and non-consensus sites. EMBO J 17: 1053–62.
Conlon FL, Miteva Y, Kaltenbrun E, Waldron L, Greco TM, Cristea IM. 2012. Immunoisolation of protein complexes from Xenopus. eds. S. HOPPLER and P.D. Vize. Methods Mol Biol 917: 369–90.

References 142
Corbesier L, Vincent C, Jang S, Fornara F, Fan Q, Searle I, Giakountis A, Farrona S, Gissot L, Turnbull C, et al. 2007. FT protein movement contributes to long-distance signaling in floral induction of Arabidopsis. Science 316: 1030–3.
Couée I, Sulmon C, Gouesbet G, El Amrani A. 2006. Involvement of soluble sugars in reactive oxygen species balance and responses to oxidative stress in plants. J Exp Bot 57: 449–59.
Coustham V, Li P, Strange A, Lister C, Song J, Dean C. 2012. Quantitative modulation of polycomb silencing underlies natural variation in vernalization. Science 337: 584–7.
Crisucci EM, Arndt KM. 2012. Paf1 restricts Gcn4 occupancy and antisense transcription at the ARG1 promoter. Mol Cell Biol 32: 1150–63.
Dávila López M, Samuelsson T. 2008. Early evolution of histone mRNA 3’ end processing. RNA 14: 1–10.
Davis R, Shi Y. 2014. The polyadenylation code: a unified model for the regulation of mRNA alternative polyadenylation. J Zhejiang Univ Sci B 15: 429–37.
De Lucia F, Crevillen P, Jones AME, Greb T, Dean C. 2008. A PHD-polycomb repressive complex 2 triggers the epigenetic silencing of FLC during vernalization. Proc Natl Acad Sci U S A 105: 16831–6.
Decker CJ, Parker R. 1993. A turnover pathway for both stable and unstable mRNAs in yeast: evidence for a requirement for deadenylation. Genes Dev 7: 1632–1643.
Delaney KJ, Xu R, Zhang J, Li QQ, Yun K, Falcone DL, Hunt AG. 2006. Calmodulin interacts with and regulates the RNA-binding activity of an Arabidopsis polyadenylation factor subunit. Plant Physiol 140: 1507–21.
Deng W, Ying H, Helliwell CA, Taylor JM, Peacock WJ, Dennis ES. 2011. FLOWERING LOCUS C (FLC) regulates development pathways throughout the life cycle of Arabidopsis. Proc Natl Acad Sci U S A 108: 6680–5.
Ding F, Cui P, Wang Z, Zhang S, Ali S, Xiong L. 2014a. Genome-wide analysis of alternative splicing of pre-mRNA under salt stress in Arabidopsis. BMC Genomics 15: 431.
Ding Y, Tang Y, Kwok CK, Zhang Y, Bevilacqua PC, Assmann SM. 2014b. In vivo genome-wide profiling of RNA secondary structure reveals novel regulatory features. Nature 505: 696–700.
Dower K, Kuperwasser N, Merrikh H, Rosbash M. 2004. A synthetic A tail rescues yeast nuclear accumulation of a ribozyme-terminated transcript. RNA 10: 1888–99.
Duc C, Sherstnev A, Cole C, Barton GJ, Simpson GG. 2013. Transcription termination and chimeric RNA formation controlled by Arabidopsis thaliana FPA. PLoS Genet 9: e1003867.
Elkon R, Ugalde AP, Agami R. 2013. Alternative cleavage and polyadenylation: extent, regulation and function. Nat Rev Genet 14: 496–506.
Elliott BJ, Dattaroy T, Meeks-Midkiff LR, Forbes KP, Hunt AG. 2003. An interaction between an Arabidopsis poly(A) polymerase and a homologue of the 100 kDa subunit of CPSF. Plant Mol Biol 51: 373–84.
Farré EM. 2012. The regulation of plant growth by the circadian clock. Plant Biol 14: 401–10.
Feng W, Jacob Y, Veley KM, Ding L, Yu X, Choe G, Michaels SD. 2011. Hypomorphic alleles reveal FCA-independent roles for FY in the regulation of FLOWERING LOCUS C. Plant Physiol 155: 1425–34.
Forbes KP, Addepalli B, Hunt AG. 2006. An Arabidopsis Fip1 homolog interacts with RNA and provides conceptual links with a number of other polyadenylation factor subunits. J Biol Chem 281: 176–86.

References 143
Ford LP, Bagga PS, Wilusz J. 1997. The poly(A) tail inhibits the assembly of a 3’-to-5' exonuclease in an in vitro RNA stability system. Mol Cell Biol 17: 398–406.
Foyer C, Noctor G. 2005. Redox homeostasis and antioxidant signaling: a metabolic interface between stress perception and physiological responses. Plant Cell Online 17: 1866–1875.
Foyer CH, Shigeoka S. 2011. Understanding oxidative stress and antioxidant functions to enhance photosynthesis. Plant Physiol 155: 93–100.
Fuke H, Ohno M. 2008. Role of poly (A) tail as an identity element for mRNA nuclear export. Nucleic Acids Res 36: 1037–49.
Gao X-H, Xiao S-L, Yao Q-F, Wang Y-J, Fu X-D. 2011. An updated GA signaling “relief of repression” regulatory model. Mol Plant 4: 601–6.
Garfin DE. 2003. Essential Cell Biology, Volume 1: Cell Structure, A Practical Approach. In AES Application Focus (eds. J. Davey and M. Lord), pp. 197–268, Oxford University Press, Oxford UK.
Gazzani S, Gendall A, Lister C, Dean C. 2003. Analysis of the molecular basis of flowering time variation in Arabidopsis accessions. Plant Physiol 132: 1107–1114.
Gilroy S, Suzuki N, Miller G, Choi W-G, Toyota M, Devireddy AR, Mittler R. 2014. A tidal wave of signals: calcium and ROS at the forefront of rapid systemic signaling. Trends Plant Sci 19: 623–30.
Greb T, Mylne JS, Crevillen P, Geraldo N, An H, Gendall AR, Dean C. 2007. The PHD finger protein VRN5 functions in the epigenetic silencing of Arabidopsis FLC. Curr Biol 17: 73–8.
Greco TM, Miteva Y, Conlon FL, Cristea IM. 2012. Complementary proteomic analysis of protein complexes. eds. S. HOPPLER and P.D. Vize. Methods Mol Biol 917: 391–407.
Griffith OW, Meister A. 1979. Potent and specific inhibition of glutathione synthesis by buthionine sulfoximine (S-n-butyl homocysteine sulfoximine). J Biol Chem 254: 7558–60.
Gruber AR, Martin G, Keller W, Zavolan M. 2012. Cleavage factor Im is a key regulator of 3’ UTR length. RNA Biol 9: 1405–12.
Gruber AR, Martin G, Keller W, Zavolan M. 2013. Means to an end: mechanisms of alternative polyadenylation of messenger RNA precursors. Wiley Interdiscip Rev RNA 5: 183–96.
Gunderson SI, Beyer K, Martin G, Keller W, Boelens WC, Mattaj LW. 1994. The human U1A snRNP protein regulates polyadenylation via a direct interaction with poly(A) polymerase. Cell 76: 531–41.
Gunderson SI, Polycarpou-Schwarz M, Mattaj IW. 1998. U1 snRNP inhibits pre-mRNA polyadenylation through a direct interaction between U1 70K and poly(A) polymerase. Mol Cell 1: 255–64.
Han HJ, Tokino T, Nakamura Y. 1998. CSR, a scavenger receptor-like protein with a protective role against cellular damage causedby UV irradiation and oxidative stress. Hum Mol Genet 7: 1039–46.
Hartmann U, Höhmann S, Nettesheim K, Wisman E, Saedler H, Huijser P. 2000. Molecular cloning of SVP: a negative regulator of the floral transition in Arabidopsis. Plant J 21: 351–60.
He Y, Doyle MR, Amasino RM. 2004. PAF1-complex-mediated histone methylation of FLOWERING LOCUS C chromatin is required for the vernalization-responsive, winter-annual habit in Arabidopsis. Genes Dev 18: 2774–84.

References 144
Helliwell C a, Robertson M, Finnegan EJ, Buzas DM, Dennis ES. 2011. Vernalization-repression of Arabidopsis FLC requires promoter sequences but not antisense transcripts. PLoS One 6: e21513.
Helliwell C a, Wood CC, Robertson M, James Peacock W, Dennis ES. 2006. The Arabidopsis FLC protein interacts directly in vivo with SOC1 and FT chromatin and is part of a high-molecular-weight protein complex. Plant J 46: 183–92.
Henderson IR, Dean C. 2004. Control of Arabidopsis flowering: the chill before the bloom. Development 131: 3829–38.
Henderson IR, Liu F, Drea S, Simpson GG, Dean C. 2005. An allelic series reveals essential roles for FY in plant development in addition to flowering-time control. Development 132: 3597–607.
Heo JB, Sung S. 2011. Vernalization-mediated epigenetic silencing by a long intronic noncoding RNA. Science 331: 76–9.
Herr AJ, Molnàr A, Jones A, Baulcombe DC. 2006. Defective RNA processing enhances RNA silencing and influences flowering of Arabidopsis. Proc Natl Acad Sci U S A 103: 14994–5001.
Hollerer I, Grund K, Hentze MW, Kulozik AE. 2014. mRNA 3’end processing: A tale of the tail reaches the clinic. EMBO Mol Med 6: 16–26.
Hornyik C, Terzi LC, Simpson GG. 2010. The spen family protein FPA controls alternative cleavage and polyadenylation of RNA. Dev Cell 18: 203–13.
Huang G-T, Ma S-L, Bai L-P, Zhang L, Ma H, Jia P, Liu J, Zhong M, Guo Z-F. 2012. Signal transduction during cold, salt, and drought stresses in plants. Mol Biol Rep 39: 969–87.
Huang H, Chen J, Liu H, Sun X. 2013. The nucleosome regulates the usage of polyadenylation sites in the human genome. BMC Genomics 14: 912.
Hunt a G, Meeks LR, Forbes KP, Das Gupta J, Mogen BD. 2000. Nuclear and chloroplast poly(A) polymerases from plants share a novel biochemical property. Biochem Biophys Res Commun 272: 174–81.
Hunt AG. 1994. Messenger RNA 3’ end formation in plants. Annu Rev Plant Physiol Plant Mol Biol 45: 47–60.
Hunt AG. 2008. Messenger RNA 3’ end formation in plants. Curr Top Microbiol Immunol 326: 151–77.
Hunt AG. 2011. RNA regulatory elements and polyadenylation in plants. Front Plant Sci 2: 109.
Hunt AG. 2014. The Arabidopsis polyadenylation factor subunit CPSF30 as conceptual link between mRNA polyadenylation and cellular signaling. Curr Opin Plant Biol 21C: 128–132.
Hunt AG, Xing D, Li QQ. 2012. Plant polyadenylation factors: conservation and variety in the polyadenylation complex in plants. BMC Genomics 13: 641.
Hunt AG, Xu R, Addepalli B, Rao S, Forbes KP, Meeks LR, Xing D, Mo M, Zhao H, Bandyopadhyay A, et al. 2008. Arabidopsis mRNA polyadenylation machinery: comprehensive analysis of protein-protein interactions and gene expression profiling. BMC Genomics 9: 220.
Ichimura K, Mizoguchi T, Yoshida R, Yuasa T, Shinozaki K. 2000. Various abiotic stresses rapidly activate Arabidopsis MAP kinases ATMPK4 and ATMPK6. Plant J 24: 655–65.
Ietswaart R, Wu Z, Dean C. 2012. Flowering time control: another window to the connection between antisense RNA and chromatin. Trends Genet 28: 445–53.

References 145
Jalkanen AL, Coleman SJ, Wilusz J. 2014. Determinants and implications of mRNA poly(A) tail size--does this protein make my tail look big? Semin Cell Dev Biol 34: 24–32.
Jänicke A, Vancuylenberg J, Boag PR, Traven A, Beilharz TH. 2012. ePAT: a simple method to tag adenylated RNA to measure poly(A)-tail length and other 3’ RACE applications. RNA 18: 1289–95.
Jeon J, Kim J. 2011. FVE, an Arabidopsis homologue of the retinoblastoma-associated protein that regulates flowering time and cold response, binds to chromatin as a large multiprotein complex. Mol Cells 32: 227–34.
Jiang D, Wang Y, Wang Y, He Y. 2008. Repression of FLOWERING LOCUS C and FLOWERING LOCUS T by the Arabidopsis Polycomb repressive complex 2 components. PLoS One 3: e3404.
Jin JB, Hasegawa PM. 2008. Flowering time regulation by the SUMO E3 ligase SIZ1. Plant Signal Behav 3: 891–2.
Johanson U, West J, Lister C, Michaels S, Amasino R, Dean C. 2000. Molecular analysis of FRIGIDA, a major determinant of natural variation in Arabidopsis flowering time. Science 290: 344–7.
Jurado AR, Tan D, Jiao X, Kiledjian M, Tong L. 2014. Structure and function of pre-mRNA 5’-end capping quality control and 3'-end processing. Biochemistry 53: 1882–98.
Kaiser WM. 1979. Reversible inhibition of the calvin cycle and activation of oxidative pentose phosphate cycle in isolated intact chloroplasts by hydrogen peroxide. Planta 145: 377–82.
Kang Y-N, Lai D-P, Ooi HS, Shen T-T, Kou Y, Tian J, Czajkowsky DM, Shao Z, Zhao X. 2014. Genome-wide profiling of untranslated regions by paired-end ditag sequencing reveals unexpected transcriptome complexity in yeast. Mol Genet genomics, Epub ahead print.
Kappel C, Trost G, Czesnick H, Ramming A, Vi SL, de Moor CH, Lenhard M. Genome-wide analysis of PAPS1-dependent polyadenylation identifies novel roles for functionally specialized poly(A) polymerases in Arabidopsis thaliana. Unpublished.
Kashiwabara S, Zhuang T, Yamagata K, Noguchi J, Fukamizu a, Baba T. 2000. Identification of a novel isoform of poly(A) polymerase, TPAP, specifically present in the cytoplasm of spermatogenic cells. Dev Biol 228: 106–15.
Kashiwabara S-I, Noguchi J, Zhuang T, Ohmura K, Honda A, Sugiura S, Miyamoto K, Takahashi S, Inoue K, Ogura A, et al. 2002. Regulation of spermatogenesis by testis-specific, cytoplasmic poly(A) polymerase TPAP. Science 298: 1999–2002.
Kim D, Pertea G, Trapnell C, Pimentel H, Kelley R, Salzberg SL. 2013. TopHat2: accurate alignment of transcriptomes in the presence of insertions, deletions and gene fusions. Genome Biol 14: R36.
Kinmonth-Schultz HA, Golembeski GS, Imaizumi T. 2013. Circadian clock-regulated physiological outputs: dynamic responses in nature. Semin Cell Dev Biol 24: 407–13.
Kissoudis C, van de Wiel C, Visser RGF, van der Linden G. 2014. Enhancing crop resilience to combined abiotic and biotic stress through the dissection of physiological and molecular crosstalk. Front Plant Sci 5: 207.
Knight H, Knight MR. 2001. Abiotic stress signalling pathways: specificity and cross-talk. Trends Plant Sci 6: 262–267.
Knight H, Trewavas AJ, Knight MR. 1997. Calcium signalling in Arabidopsis thaliana responding to drought and salinity. Plant J 12: 1067–1078.
Kolbe B. 2014. Validation of PAPS1-target mRNA using different poly(A)-tail assays. University of Potsdam.
References 146
Koornneef M, Alonso-Blanco C, Blankestijn-de Vries H, Hanhart CJ, Peeters AJ. 1998. Genetic interactions among late-flowering mutants of Arabidopsis. Genetics 148: 885–92.
Koornneef M, Blankestijn-de Vries H, Hanhart C, Soppe W, Peeters T. 1994. The phenotype of some late-flowering mutants is enhanced by a locus on chromosome 5 that is not effective in the Landsberg erecta wild-type. Plant J 6: 911–919.
Koornneef M, Hanhart CJ, van der Veen JH. 1991. A genetic and physiological analysis of late flowering mutants in Arabidopsis thaliana. Mol Gen Genet MGG 229: 57–66.
Kumar GR, Glaunsinger B a. 2010. Nuclear import of cytoplasmic poly(A) binding protein restricts gene expression via hyperadenylation and nuclear retention of mRNA. Mol Cell Biol 30: 4996–5008.
Kumar SV, Lucyshyn D, Jaeger KE, Alós E, Alvey E, Harberd NP, Wigge P a. 2012. Transcription factor PIF4 controls the thermosensory activation of flowering. Nature 484: 242–5.
Kumar SV, Wigge P a. 2010. H2A.Z-containing nucleosomes mediate the thermosensory response in Arabidopsis. Cell 140: 136–47.
Laemmli UK. 1970. Cleavage of structural proteins during the assembly of the head of bacteriophage T4. Nature 227: 680–5.
Laishram RS. 2014. Poly(A) polymerase (PAP) diversity in gene expression - Star-PAP vs canonical PAP. FEBS Lett Epub ahead print.
Laloi C, Stachowiak M, Pers-Kamczyc E, Warzych E, Murgia I, Apel K. 2007. Cross-talk between singlet oxygen- and hydrogen peroxide-dependent signaling of stress responses in Arabidopsis thaliana. Proc Natl Acad Sci U S A 104: 672–7.
Langridge J. 1957. Effect of Day-length and Gibberellic Acid on the Flowering of Arabidopsis. Nature 180: 36–37.
Lawton K, Weymann K, Friedrich L, Vernooij B, Uknes S, Ryals J. 1995. Systemic acquired resistance in Arabidopsis requires salicylic acid but not ethylene. Mol Plant Microbe Interact 8: 863–70.
Lee I, Aukerman MJ, Gore SL, Lohman KN, Michaels SD, Weaver LM, John MC, Feldmann KA, Amasino RM. 1994. Isolation of LUMINIDEPENDENS: a gene involved in the control of flowering time in Arabidopsis. Plant Cell 6: 75–83.
Lee JH, Ryu H-S, Chung KS, Posé D, Kim S, Schmid M, Ahn JH. 2013. Regulation of temperature-responsive flowering by MADS-box transcription factor repressors. Science 342: 628–32.
Lee S, Lee H-J, Jung J-H, Park C-M. 2014. The Arabidopsis thaliana RNA-binding protein FCA regulates thermotolerance by modulating the detoxification of reactive oxygen species. New Phytol Epub ahead print.
Lee YJ, Lee Y, Chung JH. 2000. An intronless gene encoding a poly(A) polymerase is specifically expressed in testis. FEBS Lett 487: 287–92.
Li D, Liu C, Shen L, Wu Y, Chen H, Robertson M, Helliwell C a, Ito T, Meyerowitz E, Yu H. 2008. A repressor complex governs the integration of flowering signals in Arabidopsis. Dev Cell 15: 110–20.
Li H, Handsaker B, Wysoker A, Fennell T, Ruan J, Homer N, Marth G, Abecasis G, Durbin R. 2009. The Sequence Alignment/Map format and SAMtools. Bioinformatics 25: 2078–9.

References 147
Lim M-H, Kim J, Kim Y-S, Chung K-S, Seo Y-H, Lee I, Kim J, Hong CB, Kim H, Park C. 2004. A new Arabidopsis gene, FLK, encodes an RNA binding protein with K homology motifs and regulates flowering time via FLOWERING LOCUS C. Plant Cell 16: 731–40.
Lingner J, Kellermann J, Keller W. 1991. Cloning and expression of the essential gene for poly(A) polymerase from S. cerevisiae. Nature 354: 496–8.
Liu F, Marquardt S, Lister C, Swiezewski S, Dean C. 2010. Targeted 3’ processing of antisense transcripts triggers Arabidopsis FLC chromatin silencing. Science 327: 94–7.
Liu F, Quesada V, Crevillén P, Bäurle I, Swiezewski S, Dean C. 2007. The Arabidopsis RNA-binding protein FCA requires a lysine-specific demethylase 1 homolog to downregulate FLC. Mol Cell 28: 398–407.
Loke JC, Stahlberg EA, Strenski DG, Haas BJ, Wood PC, Li QQ. 2005. Compilation of mRNA polyadenylation signals in Arabidopsis revealed a new signal element and potential secondary structures. Plant Physiol 138: 1457–68.
Love M, Huber W, Anders S. 2014. Moderated estimation of fold change and dispersion for RNA-Seq data with DESeq2. bioRxiv.
Macknight R, Bancroft I, Page T, Lister C, Schmidt R, Love K, Westphal L, Murphy G, Sherson S, Cobbett C, et al. 1997. FCA, a Gene Controlling Flowering Time in Arabidopsis, Encodes a Protein Containing RNA-Binding Domains. Cell 89: 737–745.
Macknight R, Duroux M, Laurie R, Dijkwel P, Simpson G, Dean C. 2002. Functional significance of the alternative transcript processing of the Arabidopsis floral promoter FCA. Plant Cell 14: 877–88.
Manabe Y, Tinker N, Colville A, Miki B. 2007. CSR1, the sole target of imidazolinone herbicide in Arabidopsis thaliana. Plant Cell Physiol 48: 1340–58.
Mandel C, Bai Y, Tong L. 2008. Protein factors in pre-mRNA 3′-end processing. Cell Mol Life Sci 65: 1099–1122.
Marquardt S, Raitskin O, Wu Z, Liu F, Sun Q, Dean C. 2014. Functional consequences of splicing of the antisense transcript COOLAIR on FLC transcription. Mol Cell 54: 156–65.
Martin G, Keller W. 1996. Mutational analysis of mammalian poly(A) polymerase identifies a region for primer binding and catalytic domain, homologous to the family X polymerases, and to other nucleotidyltransferases. EMBO J 15: 2593–603.
Martin G, Keller W. 2007. RNA-specific ribonucleotidyl transferases. RNA 13: 1834–49.
Martin G, Möglich A, Keller W, Doublié S. 2004. Biochemical and structural insights into substrate binding and catalytic mechanism of mammalian poly(A) polymerase. J Mol Biol 341: 911–25.
Martínez C, Pons E, Prats G, León J. 2004. Salicylic acid regulates flowering time and links defence responses and reproductive development. Plant J 37: 209–217.
Martinson HG. 2011. An active role for splicing in 3’-end formation. Wiley Interdiscip Rev RNA 2: 459–70.
May MJ, Leaver CJ. 1993. Oxidative Stimulation of Glutathione Synthesis in Arabidopsis thaliana Suspension Cultures. Plant Physiol 103: 621–627.
Mazzucotelli E, Mastrangelo AM, Crosatti C, Guerra D, Stanca a. M, Cattivelli L. 2008. Abiotic stress response in plants: When post-transcriptional and post-translational regulations control transcription. Plant Sci 174: 420–431.

References 148
McCracken S, Fong N, Yankulov K, Ballantyne S, Pan G, Greenblatt J, Patterson SD, Wickens M, Bentley DL. 1997. The C-terminal domain of RNA polymerase II couples mRNA processing to transcription. Nature 385: 357–61.
McCracken S, Longman D, Johnstone IL, Cáceres JF, Blencowe BJ. 2003. An evolutionarily conserved role for SRm160 in 3’-end processing that functions independently of exon junction complex formation. J Biol Chem 278: 44153–60.
Medler S, Al Husini N, Raghunayakula S, Mukundan B, Aldea A, Ansari A. 2011. Evidence for a complex of transcription factor IIB with poly(A) polymerase and cleavage factor 1 subunits required for gene looping. J Biol Chem 286: 33709–18.
Meeks LR, Addepalli B, Hunt AG. 2009. Characterization of genes encoding poly(A) polymerases in plants: evidence for duplication and functional specialization. PLoS One 4: e8082.
Meijer H a, Bushell M, Hill K, Gant TW, Willis AE, Jones P, de Moor CH. 2007. A novel method for poly(A) fractionation reveals a large population of mRNAs with a short poly(A) tail in mammalian cells. Nucleic Acids Res 35: e132.
Meijer HA, de Moor CH. 2011. Fractionation of mRNA based on the length of the poly(A) tail. Methods Mol Biol 703: 123–35.
Meinke G, Ezeokonkwo C, Balbo P, Stafford W, Moore C, Bohm A. 2008. Structure of yeast poly(A) polymerase in complex with a peptide from Fip1, an intrinsically disordered protein. Biochemistry 47: 6859–69.
Mellman DL, Gonzales ML, Song C, Barlow C a, Wang P, Kendziorski C, Anderson R a. 2008. A PtdIns4,5P2-regulated nuclear poly(A) polymerase controls expression of select mRNAs. Nature 451: 1013–7.
Meyer Y, Buchanan BB, Vignols F, Reichheld J-P. 2009. Thioredoxins and glutaredoxins: unifying elements in redox biology. Annu Rev Genet 43: 335–67.
Mhamdi A, Noctor G, Baker A. 2012. Plant catalases: peroxisomal redox guardians. Arch Biochem Biophys 525: 181–94.
Michaels SD, Amasino RM. 1999. FLOWERING LOCUS C Encodes a Novel MADS Domain Protein That Acts as a Repressor of Flowering. Plant Cell 11: 949.
Michaels SD, Amasino RM. 2001. Loss of FLOWERING LOCUS C activity eliminates the late-flowering phenotype of FRIGIDA and autonomous pathway mutations but not responsiveness to vernalization. Plant Cell 13: 935–41.
Michaels SD, He Y, Scortecci KC, Amasino RM. 2003. Attenuation of FLOWERING LOCUS C activity as a mechanism for the evolution of summer-annual flowering behavior in Arabidopsis. Proc Natl Acad Sci U S A 100: 10102–7.
Millevoi S, Vagner S. 2010. Molecular mechanisms of eukaryotic pre-mRNA 3’ end processing regulation. Nucleic Acids Res 38: 2757–74.
Miura K, Jin JB, Lee J, Yoo CY, Stirm V, Miura T, Ashworth EN, Bressan R a, Yun D-J, Hasegawa PM. 2007. SIZ1-mediated sumoylation of ICE1 controls CBF3/DREB1A expression and freezing tolerance in Arabidopsis. Plant Cell 19: 1403–14.
Mockler TC, Yu X, Shalitin D, Parikh D, Michael TP, Liou J, Huang J, Smith Z, Alonso JM, Ecker JR, et al. 2004. Regulation of flowering time in Arabidopsis by K homology domain proteins. Proc Natl Acad Sci U S A 101: 12759–64.

References 149
Möller-Steinbach Y, Alexandre C, Hennig L. 2010. Flowering time control. Methods Mol Biol 655: 229–37.
Murgia I, Tarantino D, Vannini C, Bracale M, Carravieri S, Soave C. 2004. Arabidopsis thaliana plants overexpressing thylakoidal ascorbate peroxidase show increased resistance to Paraquat-induced photooxidative stress and to nitric oxide-induced cell death. Plant J 38: 940–53.
Murthy KG, Manley JL. 1995. The 160-kD subunit of human cleavage-polyadenylation specificity factor coordinates pre-mRNA 3’-end formation. Genes Dev 9: 2672–2683.
Nemeroff ME, Barabino SM, Li Y, Keller W, Krug RM. 1998. Influenza virus NS1 protein interacts with the cellular 30 kDa subunit of CPSF and inhibits 3’end formation of cellular pre-mRNAs. Mol Cell 1: 991–1000.
Nishimura N, Kitahata N, Seki M, Narusaka Y, Narusaka M, Kuromori T, Asami T, Shinozaki K, Hirayama T. 2005. Analysis of ABA hypersensitive germination2 revealed the pivotal functions of PARN in stress response in Arabidopsis. Plant J 44: 972–84.
Nishimura N, Yoshida T, Murayama M, Asami T, Shinozaki K, Hirayama T. 2004. Isolation and characterization of novel mutants affecting the abscisic acid sensitivity of Arabidopsis germination and seedling growth. Plant Cell Physiol 45: 1485–99.
Noctor G, Foyer CH. 1998. ASCORBATE AND GLUTATHIONE: Keeping Active Oxygen Under Control. Annu Rev Plant Physiol Plant Mol Biol 49: 249–279.
Noh B, Lee S-H, Kim H-J, Yi G, Shin E-A, Lee M, Jung K-J, Doyle MR, Amasino RM, Noh Y-S. 2004. Divergent roles of a pair of homologous jumonji/zinc-finger-class transcription factor proteins in the regulation of Arabidopsis flowering time. Plant Cell 16: 2601–13.
Novoa I, Gallego J, Ferreira PG, Mendez R. 2010. Mitotic cell-cycle progression is regulated by CPEB1 and CPEB4-dependent translational control. Nat Cell Biol 12: 447–56.
Owttrim GW. 2006. RNA helicases and abiotic stress. Nucleic Acids Res 34: 3220–30.
Page T, Macknight R, Yang CH, Dean C. 1999. Genetic interactions of the Arabidopsis flowering time gene FCA, with genes regulating floral initiation. Plant J 17: 231–9.
Park-Sarge O-K, Sarge KD. 2009. Detection of sumoylated proteins. Methods Mol Biol 464: 255–65.
Pazhouhandeh M, Molinier J, Berr A, Genschik P. 2011. MSI4/FVE interacts with CUL4-DDB1 and a PRC2-like complex to control epigenetic regulation of flowering time in Arabidopsis. Proc Natl Acad Sci U S A 108: 3430–5.
Perochon A, Aldon D, Galaud J-P, Ranty B. 2011. Calmodulin and calmodulin-like proteins in plant calcium signaling. Biochimie 93: 2048–53.
Poethig RS. 2003. Phase change and the regulation of developmental timing in plants. Science 301: 334–6.
Poethig RS. 2013. Vegetative phase change and shoot maturation in plants. Curr Top Dev Biol 105: 125–52.
Posé D, Verhage L, Ott F, Yant L, Mathieu J, Angenent GC, Immink RGH, Schmid M. 2013. Temperature-dependent regulation of flowering by antagonistic FLM variants. Nature 503: 414–7.
Posé D, Yant L, Schmid M. 2012. The end of innocence: flowering networks explode in complexity. Curr Opin Plant Biol 15: 45–50.
References 150
Preiss T, Muckenthaler M, Hentze MW. 1998. Poly(A)-tail-promoted translation in yeast: implications for translational control. RNA 4: 1321–31.
Preker PJ, Lingner J, Minvielle-Sebastia L, Keller W. 1995. The FIP1 gene encodes a component of a yeast pre-mRNA polyadenylation factor that directly interacts with poly(A) polymerase. Cell 81: 379–89.
Proudfoot N. 2004. New perspectives on connecting messenger RNA 3’ end formation to transcription. Curr Opin Cell Biol 16: 272–8.
Proudfoot NJ. 2011. Ending the message: poly(A) signals then and now. Genes Dev 25: 1770–82.
Proudfoot NJ. 1989. How RNA polymerase II terminates transcription in higher eukaryotes. Trends Biochem Sci 14: 105–10.
Quesada V, Dean C, Simpson GG. 2005. Regulated RNA processing in the control of Arabidopsis flowering. Int J Dev Biol 49: 773–80.
Quesada V, Macknight R, Dean C, Simpson GG. 2003. Autoregulation of FCA pre-mRNA processing controls Arabidopsis flowering time. EMBO J 22: 3142–52.
Raabe T, Murthy KG, Manley JL. 1994. Poly(A) polymerase contains multiple functional domains. Mol Cell Biol 14: 2946–57.
Rallapalli G, Kemen EM, Robert-Seilaniantz A, Segonzac C, Etherington GJ, Sohn KH, MacLean D, Jones JDG. 2014. EXPRSS: an Illumina based high-throughput expression-profiling method to reveal transcriptional dynamics. BMC Genomics 15: 341.
Ramakers C, Ruijter JM, Deprez RHL, Moorman AFM. 2003. Assumption-free analysis of quantitative real-time polymerase chain reaction (PCR) data. Neurosci Lett 339: 62–6.
Ramm S. 2013. Untersuchungen zur Kontrolle des Wachstums von Pflanzenorganen am Beispiel von Arabidopsis thaliana. University of Potsdam.
Ramming A. 2014. The Role of Poly(A) Polymerase PAPS1 in Pollen Development and Growth. University of Potsdam.
Rao S, Dinkins RD, Hunt AG. 2009. Distinctive interactions of the Arabidopsis homolog of the 30 kD subunit of the cleavage and polyadenylation specificity factor (AtCPSF30) with other polyadenylation factor subunits. BMC Cell Biol 10: 51.
Rataj K, Simpson GG. 2014. Message ends: RNA 3’ processing and flowering time control. J Exp Bot 65: 353–63.
Ratcliffe OJ, Kumimoto RW, Wong BJ, Riechmann JL. 2003. Analysis of the Arabidopsis MADS AFFECTING FLOWERING gene family: MAF2 prevents vernalization by short periods of cold. Plant Cell 15: 1159–69.
Rausch T, Wachter A. 2005. Sulfur metabolism: a versatile platform for launching defence operations. Trends Plant Sci 10: 503–9.
Reina-Pinto JJ, Voisin D, Teodor R, Yephremov A. 2010. Probing differentially expressed genes against a microarray database for in silico suppressor/enhancer and inhibitor/activator screens. Plant J 61: 166–75.
Rentel MC, Knight MR. 2004. Oxidative stress-induced calcium signaling in Arabidopsis. Plant Physiol 135: 1471–9.
References 151
Rinn JL, Kertesz M, Wang JK, Squazzo SL, Xu X, Brugmann SA, Goodnough H, Helms JA, Farnham PJ, Chang HY. 2007. NIH Public Access. 129: 1311–1323.
Rizhsky L, Hallak-Herr E, Van Breusegem F, Rachmilevitch S, Barr JE, Rodermel S, Inzé D, Mittler R. 2002. Double antisense plants lacking ascorbate peroxidase and catalase are less sensitive to oxidative stress than single antisense plants lacking ascorbate peroxidase or catalase. Plant J 32: 329–342.
Rosloski SM, Singh A, Jali SS, Balasubramanian S, Weigel D, Grbic V. 2013. Functional analysis of splice variant expression of MADS AFFECTING FLOWERING 2 of Arabidopsis thaliana. Plant Mol Biol 81: 57–69.
Rothnie HM. 1996. Plant mRNA 3’-end formation. Plant Mol Biol 32: 43–61.
Rothnie HM, Reid J, Hohn T. 1994. The contribution of AAUAAA and the upstream element UUUGUA to the efficiency of mRNA 3’-end formation in plants. EMBO J 13: 2200–10.
Rowley MJ, Böhmdorfer G, Wierzbicki AT. 2013. Analysis of long non-coding RNAs produced by a specialized RNA polymerase in Arabidopsis thaliana. Methods 63: 160–9.
Ruijter JM, Ramakers C, Hoogaars WMH, Karlen Y, Bakker O, van den Hoff MJB, Moorman AFM. 2009. Amplification efficiency: linking baseline and bias in the analysis of quantitative PCR data. Nucleic Acids Res 37: e45.
Ryan K, Calvo O, Manley JL. 2004. Evidence that polyadenylation factor CPSF-73 is the mRNA 3’ processing endonuclease. RNA 10: 565–573.
Ryan K, Murthy KGK, Kaneko S, Manley JL. 2002. Requirements of the RNA polymerase II C-terminal domain for reconstituting pre-mRNA 3’ cleavage. Mol Cell Biol 22: 1684–92.
Sandalio LM, Rodríguez-Serrano M, Romero-Puertas MC, del Río LA. 2013. Role of peroxisomes as a source of reactive oxygen species (ROS) signaling molecules. ed. L.A. Del Río. Subcell Biochem 69: 231–55.
Schmid M, Davison TS, Henz SR, Pape UJ, Demar M, Vingron M, Schölkopf B, Weigel D, Lohmann JU. 2005. A gene expression map of Arabidopsis thaliana development. Nat Genet 37: 501–6.
Schmidt M-J, Norbury CJ. 2010. Polyadenylation and beyond: emerging roles for noncanonical poly(A) polymerases. Wiley Interdiscip Rev RNA 1: 142–51.
Schmieder R, Lim YW, Edwards R. 2012. Identification and removal of ribosomal RNA sequences from metatranscriptomes. Bioinformatics 28: 433–5.
Scortecci K, Michaels SD, Amasino RM. 2003. Genetic interactions between FLM and other flowering-time genes in Arabidopsis thaliana. Plant Mol Biol 52: 915–22.
Shen L, Thong Z, Gong X, Shen Q, Gan Y, Yu H. 2014. The putative PRC1 RING-finger protein AtRING1A regulates flowering through repressing MADS AFFECTING FLOWERING genes in Arabidopsis. Development 141: 1303–12.
Shen Y, Venu RC, Nobuta K, Wu X, Notibala V, Demirci C, Meyers BC, Wang G-L, Ji G, Li QQ. 2011. Transcriptome dynamics through alternative polyadenylation in developmental and environmental responses in plants revealed by deep sequencing. Genome Res 21: 1478–86.
Sherstnev A, Duc C, Cole C, Zacharaki V, Hornyik C, Ozsolak F, Milos PM, Barton GJ, Simpson GG. 2012. Direct sequencing of Arabidopsis thaliana RNA reveals patterns of cleavage and polyadenylation. Nat Struct Mol Biol 19: 845–52.

References 152
Shigeoka S, Maruta T. 2014. Cellular redox regulation, signaling, and stress response in plants. Biosci Biotechnol Biochem 78: 1457–70.
Shimazu T, Horinouchi S, Yoshida M. 2007. Multiple histone deacetylases and the CREB-binding protein regulate pre-mRNA 3’-end processing. J Biol Chem 282: 4470–8.
Silverman IM, Li F, Gregory BD. 2013. Genomic era analyses of RNA secondary structure and RNA-binding proteins reveal their significance to post-transcriptional regulation in plants. Plant Sci 205-206: 55–62.
Simpson GG, Dean C. 2002. Arabidopsis, the Rosetta stone of flowering time? Science 296: 285–9.
Simpson GG, Dijkwel PP, Quesada V, Henderson I, Dean C. 2003. FY is an RNA 3’ end-processing factor that interacts with FCA to control the Arabidopsis floral transition. Cell 113: 777–87.
Smyth G. 2005. Limma: linear models for microarray data. In Bioinformatics and computational biology solutions using R and Bioconductor (eds. R. Gentleman, V. Carey, S. Dudoit, R. Irizarry, and W. Huber), pp. 397–420, Springer, New York.
Sonmez C, Dean C. 2012. Transcription beyond borders has downstream consequences. RNA Biol 9: 143–7.
Spanudakis E, Jackson S. 2014. The role of microRNAs in the control of flowering time. J Exp Bot 65: 365–80.
Srikanth A, Schmid M. 2011. Regulation of flowering time: all roads lead to Rome. Cell Mol Life Sci 68: 2013–37.
Staiger D, Brown JWS. 2013. Alternative splicing at the intersection of biological timing, development, and stress responses. Plant Cell 25: 3640–56.
Stief A, Brzezinka K, Lämke J, Bäurle I. 2014. Epigenetic responses to heat stress at different time scales and the involvement of short RNAs. Plant Signal Behav Epub ahead print.
Stoilov P, Rafalska I, Stamm S. 2002. YTH: a new domain in nuclear proteins. Trends Biochem Sci 27: 495–7.
Sun Q, Csorba T, Skourti-Stathaki K, Proudfoot NJ, Dean C. 2013. R-loop stabilization represses antisense transcription at the Arabidopsis FLC locus. Science 340: 619–21.
Sun T-P, Gubler F. 2004. Molecular mechanism of gibberellin signaling in plants. Annu Rev Plant Biol 55: 197–223.
Sung S, Amasino RM. 2004. Vernalization in Arabidopsis thaliana is mediated by the PHD finger protein VIN3. Nature 427: 159–64.
Swiezewski S, Crevillen P, Liu F, Ecker JR, Jerzmanowski A, Dean C. 2007. Small RNA-mediated chromatin silencing directed to the 3’ region of the Arabidopsis gene encoding the developmental regulator, FLC. Proc Natl Acad Sci U S A 104: 3633–8.
Swiezewski S, Liu F, Magusin A, Dean C. 2009. Cold-induced silencing by long antisense transcripts of an Arabidopsis Polycomb target. Nature 462: 799–802.
Takagaki Y, Manley JL. 1997. RNA recognition by the human polyadenylation factor CstF. Mol Cell Biol 17: 3907–14.
Takagaki Y, Seipelt RL, Peterson ML, Manley JL. 1996. The polyadenylation factor CstF-64 regulates alternative processing of IgM heavy chain pre-mRNA during B cell differentiation. Cell 87: 941–52.

References 153
Tarun SZ, Sachs a B. 1996. Association of the yeast poly(A) tail binding protein with translation initiation factor eIF-4G. EMBO J 15: 7168–77.
Theocharis A, Clément C, Barka EA. 2012. Physiological and molecular changes in plants grown at low temperatures. Planta 235: 1091–105.
Thimm O, Bläsing O, Gibon Y, Nagel A, Meyer S, Krüger P, Selbig J, Müller LA, Rhee SY, Stitt M. 2004. MAPMAN: a user-driven tool to display genomics data sets onto diagrams of metabolic pathways and other biological processes. Plant J 37: 914–39.
Thomas H. 2013. Senescence, ageing and death of the whole plant. New Phytol 197: 696–711.
Thomas PE, Wu X, Liu M, Gaffney B, Ji G, Li QQ, Hunt AG. 2012. Genome-wide control of polyadenylation site choice by CPSF30 in Arabidopsis. Plant Cell 24: 4376–88.
Thuresson a C, Aström J, Aström a, Grönvik KO, Virtanen a. 1994. Multiple forms of poly(A) polymerases in human cells. Proc Natl Acad Sci U S A 91: 979–83.
Tian B, Manley JL. 2013. Alternative cleavage and polyadenylation: the long and short of it. Trends Biochem Sci 38: 312–20.
Tikhonov M, Georgiev P, Maksimenko O. 2013. Competition within Introns: Splicing Wins over Polyadenylation via a General Mechanism. Acta Naturae 5: 52–61.
Tör M, Gordon P, Cuzick A, Eulgem T, Sinapidou E, Mert-Türk F, Can C, Dangl JL, Holub EB. 2002. Arabidopsis SGT1b is required for defense signaling conferred by several downy mildew resistance genes. Plant Cell 14: 993–1003.
Trapet P, Kulik A, Lamotte O, Jeandroz S, Bourque S, Nicolas-Francès V, Rosnoblet C, Besson-Bard A, Wendehenne D. 2014. NO signaling in plant immunity: A tale of messengers. Phytochem Epub ahead print.
Trost G. 2014. Poly(A) Polymerase 1 (PAPS1) influences organ size and pathogen response in Arabidopsis thaliana. University of Potsdam.
Trost G, Vi SL, Czesnick H, Lange P, Holton N, Giavalisco P, Zipfel C, Kappel C, Lenhard M. 2014. Arabidopsis poly(A) polymerase PAPS1 limits founder-cell recruitment to organ primordia and suppresses the salicylic acid-independent immune response downstream of EDS1/PAD4. Plant J 77: 688–99.
Tsuchiya T, Eulgem T. 2013. Mutations in EDM2 selectively affect silencing states of transposons and induce plant developmental plasticity. Sci Rep 3: 1701.
Tsukaya H, Byrne ME, Horiguchi G, Sugiyama M, Van Lijsebettens M, Lenhard M. 2013. How do “housekeeping” genes control organogenesis?--Unexpected new findings on the role of housekeeping genes in cell and organ differentiation. J Plant Res 126: 3–15.
Tzafrir I, Pena-Muralla R, Dickerman A, Berg M, Rogers R, Hutchens S, Sweeney TC, McElver J, Aux G, Patton D, et al. 2004. Identification of genes required for embryo development in Arabidopsis. Plant Physiol 135: 1206–20.
Uhler JP, Hertel C, Svejstrup JQ. 2007. A role for noncoding transcription in activation of the yeast PHO5 gene. Proc Natl Acad Sci U S A 104: 8011–6.
Ulitsky I, Shkumatava A, Jan CH, Subtelny AO, Koppstein D, Bell GW, Sive H, Bartel DP. 2012. Extensive alternative polyadenylation during zebrafish development. Genome Res 22: 2054–66.

References 154
Van Larebeke N, Engler G, Holsters M, Van den Elsacker S, Zaenen I, Schilperoort RA, Schell J. 1974. Large plasmid in Agrobacterium tumefaciens essential for crown gall-inducing ability. Nature 252: 169–70.
Veley KM, Michaels SD. 2008. Functional redundancy and new roles for genes of the autonomous floral-promotion pathway. Plant Physiol 147: 682–95.
Vethantham V, Rao N, Manley JL. 2008. Sumoylation regulates multiple aspects of mammalian poly(A) polymerase function. Genes Dev 22: 499–511.
Vi SL. 2013. The role of a canonical Poly(A) Polymerase in organ-identity dependent size regulation in Arabidopsis thaliana. University of Potsdam.
Vi SL, Trost G, Lange P, Czesnick H, Rao N, Lieber D, Laux T, Gray WM, Manley JL, Groth D, et al. 2013. Target specificity among canonical nuclear poly(A) polymerases in plants modulates organ growth and pathogen response. Proc Natl Acad Sci U S A 110: 13994–9.
Villajuana-Bonequi M, Elrouby N, Nordström K, Griebel T, Bachmair A, Coupland G. 2014. Elevated salicylic acid levels conferred by increased expression of ISOCHORISMATE SYNTHASE 1 contribute to hyperaccumulation of SUMO1 conjugates in the Arabidopsis mutant early in short days 4. Plant J 79: 206–19.
Wahle E. 1995. Poly(A) tail length control is caused by termination of processive synthesis. J Biol Chem 270: 2800–8.
Wahle E, Rüegsegger U. 1999. 3’-End processing of pre-mRNA in eukaryotes. FEMS Microbiol Rev 23: 277–95.
Wang ET, Sandberg R, Luo S, Khrebtukova I, Zhang L, Mayr C, Kingsmore SF, Schroth GP, Burge CB. 2008a. Alternative isoform regulation in human tissue transcriptomes. Nature 456: 470–6.
Wang J-W. 2014. Regulation of flowering time by the miR156-mediated age pathway. J Exp Bot 65: 4723–30.
Wang J-W, Schwab R, Czech B, Mica E, Weigel D. 2008b. Dual effects of miR156-targeted SPL genes and CYP78A5/KLUH on plastochron length and organ size in Arabidopsis thaliana. Plant Cell 20: 1231–43.
Wang L, Eckmann CR, Kadyk LC, Wickens M, Kimble J. 2002. A regulatory cytoplasmic poly(A) polymerase in Caenorhabditis elegans. Nature 419: 312–6.
Weill L, Belloc E, Bava F-A, Méndez R. 2012. Translational control by changes in poly(A) tail length: recycling mRNAs. Nat Struct Mol Biol 19: 577–85.
Willekens H, Chamnongpol S, Davey M, Schraudner M, Langebartels C, Van Montagu M, Inzé D, Van Camp W. 1997. Catalase is a sink for H2O2 and is indispensable for stress defence in C3 plants. EMBO J 16: 4806–16.
Willmann MR, Poethig RS. 2011. The effect of the floral repressor FLC on the timing and progression of vegetative phase change in Arabidopsis. Development 138: 677–85.
Wilson RN, Somerville CR. 1995. Phenotypic Suppression of the Gibberellin-Insensitive Mutant (gai) of Arabidopsis. Plant Physiol 108: 495–502.
Wrzaczek M, Brosché M, Kangasjärvi J. 2013. ROS signaling loops - production, perception, regulation. Curr Opin Plant Biol 16: 575–82.
Wu G, Park MY, Conway SR, Wang J, Weigel D, Poethig RS. 2009. The sequential action of miR156 and miR172 regulates developmental timing in Arabidopsis. Cell 138: 750–9.

References 155
Wu X, Liu M, Downie B, Liang C, Ji G, Li QQ, Hunt AG. 2011. Genome-wide landscape of polyadenylation in Arabidopsis provides evidence for extensive alternative polyadenylation. Proc Natl Acad Sci U S A 108: 12533–8.
Xing D, Li QQ. 2011. Alternative polyadenylation and gene expression regulation in plants. Wiley Interdiscip Rev RNA 2: 445–58.
Xing D, Wang Y, Xu R, Ye X, Yang D, Li QQ. 2013. The regulatory role of Pcf11-similar-4 (PCFS4) in Arabidopsis development by genome-wide physical interactions with target loci. BMC Genomics 14: 598.
Xing D, Zhao H, Li QQ. 2008a. Arabidopsis CLP1-SIMILAR PROTEIN3, an ortholog of human polyadenylation factor CLP1, functions in gametophyte, embryo, and postembryonic development. Plant Physiol 148: 2059–69.
Xing D, Zhao H, Xu R, Li QQ. 2008b. Arabidopsis PCFS4, a homologue of yeast polyadenylation factor Pcf11p, regulates FCA alternative processing and promotes flowering time. Plant J 54: 899–910.
Xu R, Ye X, Quinn Li Q. 2004. AtCPSF73-II gene encoding an Arabidopsis homolog of CPSF 73 kDa subunit is critical for early embryo development. Gene 324: 35–45.
Xu R, Zhao H, Dinkins RD, Cheng X, Carberry G, Li QQ. 2006. The 73 kD subunit of the cleavage and polyadenylation specificity factor (CPSF) complex affects reproductive development in Arabidopsis. Plant Mol Biol 61: 799–815.
Xu Y, Gan E-S, Ito T. 2013. The AT-hook/PPC domain protein TEK negatively regulates floral repressors including MAF4 and MAF5. Plant Signal Behav 8: 1–3.
Yamaguchi A, Abe M. 2012. Regulation of reproductive development by non-coding RNA in Arabidopsis: to flower or not to flower. J Plant Res 125: 693–704.
Yang Q, Nausch LWM, Martin G, Keller W, Doublié S. 2014. Crystal structure of human poly(A) polymerase gamma reveals a conserved catalytic core for canonical poly(A) polymerases. J Mol Biol 426: 43–50.
Yanovsky MJ, Kay SA. 2002. Molecular basis of seasonal time measurement in Arabidopsis. Nature 419: 308–12.
Yao Y, Song L, Katz Y, Galili G. 2002. Cloning and characterization of Arabidopsis homologues of the animal CstF complex that regulates 3′ mRNA cleavage and polyadenylation. J Exp Bot 53: 2277–8.
Zhang J, Addepalli B, Yun K-Y, Hunt AG, Xu R, Rao S, Li QQ, Falcone DL. 2008. A polyadenylation factor subunit implicated in regulating oxidative signaling in Arabidopsis thaliana. PLoS One 3: e2410.
Zhao J, Hyman L, Moore C. 1999. Formation of mRNA 3’ ends in eukaryotes: mechanism, regulation, and interrelationships with other steps in mRNA synthesis. Microbiol Mol Biol Rev 63: 405–45.
Zhao W, Manley JL. 1996. Complex alternative RNA processing generates an unexpected diversity of poly(A) polymerase isoforms. Mol Cell Biol 16: 2378–86.
Zhu Z-H, Yu YP, Shi Y-K, Nelson JB, Luo J-H. 2009. CSR1 induces cell death through inactivation of CPSF3. Oncogene 28: 41–51.
Zipfel C, Robatzek S, Navarro L, Oakeley EJ, Jones JDG, Felix G, Boller T. 2004. Bacterial disease resistance in Arabidopsis through flagellin perception. Nature 428: 764–7.

156
Affidavit
I confirm that the PhD thesis entitled “Functional Specialization of Arabidopsis Poly(A) Polymerases in
Relation to Flowering Time and Stress” is the result of my own work. I did not receive any aids or
support other than stated. All sources and materials applied are listed and specified in the thesis.
Furthermore I confirm that this thesis has not yet been submitted as part of another examination
process, neither in identical nor in similar form.
Ich versichere hiermit, dass ich die Doktorarbeit mit dem Titel „Functional Specialization of
Arabidopsis Poly(A) Polymerases in Relation to Flowering Time and Stress“ selbstständig und ohne
unzulässige fremde Hilfe erbracht habe. Ich habe keine anderen als die angegebenen Quellen und
Hilfsmittel benutzt sowie wörtliche und sinngemäße Zitate kenntlich gemacht. Die Arbeit hat in
gleicher oder ähnlicher Form noch keiner Prüfungsbehörde vorgelegen.
Berlin, 20.11.2014 Hjördis Czesnick

157
Acknowledgements
First of all, I would like to thank Michael Lenhard for being a fantastic supervisor and for giving great
scientific advice. He supported me constantly during the last three years. I am very grateful that
Michael gave me the opportunity to work on my PhD in his creative and innovative lab.
I would like to thank all members of the group for the scientific discussions and for the very
supportive and friendly working atmosphere. Thanks to our technicians Peggy Lange, Cindy Marona
and Melanie Teltow the lab runs like clockwork. Special thanks to my office companions Christian
Kappel, Adrien Sicard and Ushio Fujikura for countless discussions about science and life in general. I
would like to thank Christian for the analysis of the RNA-seq data and Adrien for all the help and
advice throughout the years. I thank Anahid Powell for being a very honest and critical scientist and
for being a great friend. I would also like to thank Son Vi, who started the project, for sharing his
great enthusiasm and optimism and Holger Breuninger for making the start in the new lab much
easier for me. Thanks to my PhD student fellows Gerda Trost, Moritz Jöst, Anna Stief and Claudia Sas
for sharing experiences and for our great after-lab hours. I thank Cuong Huu Nguyen and Jo
Hepworth for always making me look forward to the train rides to Golm. Lastly, special thanks go to
all students who were working on the project with me and who became very good friends over the
years: Patrizia Thoma, Jill Kant, Moriz Halbmeier, Lisa Bartholomäus, Sascha Ramm, Anna Ramming
and Ben Kolbe. It was a great pleasure to work in such an international and open-minded lab.
I would also like to thank Isabel Bäurle and her whole lab for great scientific discussions and for the
support during the thermotolerance assays. Moreover, I thank Joost van Dongen and Francesco
Licausi for scientific advice and for the support during the oxygen stress experiments.
I am very grateful that I had the opportunity to discuss my results with many excellent scientists at
several national and international plant science conferences. Every time, I returned with many new
ideas and a lot of motivation and that certainly advanced the project. Also, I very much enjoyed
discussing my work with the many scientists that had been invited to visit the genetics group at the
university.
Lastly, I thank my partner, my family and my friends for their constant love and support and for their
confidence.


![BMC Plant Biology BioMed Central - Springer...methylation polymorphism is greater than DNA poly-morphism in rice [8], Arabidopsis thaliana [9] or cotton [10]. Methylation patterns](https://img.dokumen.tips/doc/110x75/60f87c169cd23c76530b139f/bmc-plant-biology-biomed-central-springer-methylation-polymorphism-is-greater.jpg)