Embed Size (px)
Citation preview

Functional Responses of Coyotes and Lynx to the Snowshoe Hare CycleAuthor(s): Mark O'Donoghue, Stan Boutin, Charles J. Krebs, Gustavo Zuleta, Dennis L.Murray, Elizabeth J. HoferSource: Ecology, Vol. 79, No. 4 (Jun., 1998), pp. 1193-1208Published by: Ecological Society of AmericaStable URL: http://www.jstor.org/stable/176736Accessed: 13/01/2010 10:50
Your use of the JSTOR archive indicates your acceptance of JSTOR's Terms and Conditions of Use, available athttp://www.jstor.org/page/info/about/policies/terms.jsp. JSTOR's Terms and Conditions of Use provides, in part, that unlessyou have obtained prior permission, you may not download an entire issue of a journal or multiple copies of articles, and youmay use content in the JSTOR archive only for your personal, non-commercial use.
Please contact the publisher regarding any further use of this work. Publisher contact information may be obtained athttp://www.jstor.org/action/showPublisher?publisherCode=esa.
Each copy of any part of a JSTOR transmission must contain the same copyright notice that appears on the screen or printedpage of such transmission.
JSTOR is a not-for-profit service that helps scholars, researchers, and students discover, use, and build upon a wide range ofcontent in a trusted digital archive. We use information technology and tools to increase productivity and facilitate new formsof scholarship. For more information about JSTOR, please contact [email protected].
Ecological Society of America is collaborating with JSTOR to digitize, preserve and extend access to Ecology.
http://www.jstor.org

Ecology, 79(4), 1998, pp. 1193-1208 ? 1998 by the Ecological Society of America
FUNCTIONAL RESPONSES OF COYOTES AND LYNX TO THE SNOWSHOE HARE CYCLE
MARK O'DONOGHUE," 5 STAN BOUTIN,2 CHARLES J. KREBS,' GUSTAVO ZULETA,3 DENNIS L. MURRAY,26 AND ELIZABETH J. HOFER4
'Ecology Group, Department of Zoology, 6270 University Boulevard, Vancouver, British Columbia V6T 1Z4 Canada 2Department of Biological Sciences, University of Alberta, Edmonton, Alberta T6G 2E9 Canada
3INEUCI Institute (CONICET), Department of Biology, University of Buenos Aires, Ciudad Universitaria, Pab. 2, Piso 4, 1428, Buenos Aires, Argentina
4Mile 1055 Alaska Highway, Silver Creek, Yukon YJA 3V4 Canada
Abstract. Coyotes and lynx are the two most important mammalian predators of snow- shoe hares throughout much of the boreal forest. Populations of hares cycle in abundance, with peaks in density occurring every 8-11 yr, and experimental results suggest that pre- dation is a necessary factor causing these cycles. We measured the functional responses of coyotes and lynx during a cyclic fluctuation of hare populations in the southwest Yukon, to determine their effect on the cyclic dynamics. We used snow-tracking and radio telemetry to examine changes in the foraging behavior of the predators.
Coyotes and lynx both fed mostly on hares during all winters except during cyclic lows, when the main alternative prey of coyotes was voles, and lynx switched to hunting red squirrels. Both predators showed clear functional responses to changes in the densities of hares. Kill rates of hares by coyotes varied from 0.3 to 2.3 hares/d, with the most hares killed one year before the cyclic peak, while those of lynx varied from 0.3 to 1.2 hares/d, with the highest one year after the peak. Maximum kill rates by both predators were greater than their energetic needs. The functional response of coyotes was equally well described by linear and type-2 curves, and that of lynx was well described by a type-2 curve. Kill rates by coyotes were higher during the increase in density of hares than during the cyclic decline, while the reverse was true for lynx. Coyotes killed more hares early in the winter, and cached many of these for later retrieval. Lower densities of hares were associated with longer reactive distances of both predators to hares, but with little apparent change in time spent searching or handling prey. In summary, our data show that the two similarly sized predators differed in their foraging behavior and relative abilities at capturing alternative prey, leading to different patterns in their functional responses to fluctuations in the density of their preferred prey.
Key words: Canis latrans; coyote; functional response, components of; Lepus americanus; lynx; Lynx canadensis; predation; population cycle; snowshoe hare.
INTRODUCTION
Populations of snowshoe hares (Lepus anericanus) undergo regular cycles in abundance throughout the northern boreal forest in North America, with ampli- tudes over two orders of magnitude, and 8-11 yr be- tween cyclic peaks (Elton and Nicholson 1942, Keith 1990). These cycles have major effects on predators of hares and other herbivores in the relatively simple bo- real ecosystem (Finerty 1980).
The role of predation in generating cyclic fluctua- tions in abundance of prey has been much studied and debated. In a review, Finerty (1980) summarized the prevailing view that predation was unlikely to be the
Manuscript received 12 November 1996; revised 20 May 1997; accepted 22 May 1997; final version received 13 June 1997.
5Present address: Box 251, Mayo, Yukon Territory, YOB IMO Canada.
6 Present address: Department of Fish and Wildlife Re- sources, University of Idaho, Moscow, Idaho 83844 USA.
sole cause of cycles in the abundance of small mam- mals but that it likely did: (1) hasten the decline of herbivore populations already declining for other rea- sons (e.g., food shortage); (2) increase the amplitude of cycles by driving prey populations to very low num- bers; (3) increase the period of cycles, due to a lag effect of predators persisting into periods of low prey numbers (delayed density dependence); and (4) pos- sibly synchronize cycles over large geographic areas due to the high mobility of many predators. This agrees with the hypothesis put forward by Lloyd Keith and colleagues, based on studies spanning two complete cycles of hares in Alberta (Keith and Windberg 1978, Keith et al. 1984, Keith 1990). The Keith Hypothesis proposed that the cycle in hare numbers was generated by an interaction between the hares and their winter food supply, with predation playing a key role only during the decline phase of the cycle (Keith et al. 1977).
Recent empirical and theoretical studies suggest that predation may be a necessary factor in causing cyclic
1193

1194 MARK O'DONOGHUE ET AL. Ecology, Vol. 79, No. 4
dynamics of prey. In the southwest Yukon, neither ex- perimental food addition nor exclusion of mammalian predators alone changed the timing or magnitude of cyclic declines in numbers of snowshoe hares (Krebs et al. 1995). Only when hares were both provided with supplemental food and protected from predators did the dynamics of the cycle change, suggesting that a three- trophic level explanation must be invoked (Krebs et al. 1995). Mathematical models support the proposal that predation is a necessary factor in the hare cycle (Ak- qakaya 1992, Royama 1992, Stenseth 1995).
Likewise, Scandinavian researchers have presented theoretical (Hanski et al. 1991, 1993, Hanski and Kor- pimaki 1995) and empirical (Henttonen et al. 1987, Korpimaki and Norrdahl 1991, Korpimaki 1993) evi- dence that predation is an essential factor in generating 3-4 yr cycles of microtine rodents in northern Fen- noscandia. Strong functional responses by a large suite of generalist predators may regulate vole numbers in southern regions (Erlinge et al. 1983, 1984, 1988), while delayed numerical responses of specialist pred- ators, mostly weasels, cause a lag and cyclic dynamics in the north (Korpimaki et al. 1991).
The effects of any predators on populations of their prey are determined by their numerical (changes in reproduction, survival, or aggregation) and functional responses (changes in kill rates) to prey density (So- lomon 1949). In order for predation to have a regula- tory effect, the proportion of a prey population killed must both increase with prey density (i.e., density de- pendent), and be greater than the net production of prey at prey densities exceeding an equilibrium (Sinclair and Pech 1996). Depensatory predation, in which the per- centage of prey killed increases with declining prey abundance, can result from time lags in the responses of predators to fluctuations in prey abundance. The shapes and timing of the numerical and functional re- sponses of predators to prey are thus critical to deter- mining the effects of predation on prey populations. However, there have been very few direct measure- ments of both these responses in wild populations of animals (Boutin 1995).
Holling (1959b) described three basic forms of func- tional responses of predators to changes in density of prey. Type- I responses describe linearly increasing kill rates with prey density up to a threshold, above which the rate is constant. Type-2 responses describe kill rates increasing at a monotonically decreasing rate with prey density (i.e., a convex curve approaching an asymp- tote), and type-3 responses are sigmoidal in shape. Type-2 responses may be typical of specialist preda- tors, predators with few alternative prey, or they may arise due to adaptive adjustment of search rates and time to the benefits and costs of foraging (Abrams 1990, 1992). Type-3 responses are more typical of gen- eralist predators, and they may result from a number of mechanisms: (1) predators learning to recognize, capture, or handle prey better with increasing prey den-
sity (Holling 1959b), (2) predators switching among prey types, habitats, or foraging tactics (Royama 1970, Murdoch and Oaten 1975, Akre and Johnson 1979), (3) adaptive variation in foraging rates (Holling 1966, Hassell et al. 1977, Dunbrack and Giguere 1987), and (4) changes in the behavior or vulnerability of prey, or prey having a refuge below a fixed density (Holling 1965, Murdoch and Oaten 1975, Taylor 1984). Only type-3 responses describe density-dependent predation (although, in combination with positive numerical re- sponses, all types of functional responses may lead to density-dependent predation), and there is evidence from field (e.g., Pech et al. 1992) and theoretical (e.g., Hassell and Comins 1978, Nunney 1980) studies that sigmoidal functional responses may stabilize predator- prey interactions.
The main predators of snowshoe hares are the same throughout much of their range: lynx (Lynx canaden- sis), coyotes (Canis latrans), Great Horned Owls (Bubo virginianus), and Goshawks (Accipiter gentiles). Keith and colleagues (Keith et al. 1977) estimated the pop- ulation sizes and kill rates of these predators during a complete hare cycle in order to analyze the effects of predation on hare dynamics. They found that both coy- otes and lynx responded to the increase in hare numbers with increasing kill rates. Coyotes killed virtually no hares at cyclic lows, while they killed an estimated 0.66/d per coyote when numbers of hares were high. The kill rate by lynx increased about threefold over the same time period. The functional responses of coyotes and lynx were judged to be type 3 and type 2, respec- tively (Keith et al. 1977).
Lynx are usually considered prototypical specialists on snowshoe hares, and virtually all studies of their food habits have shown hares to be their predominant prey (Saunders 1963, Brand and Keith 1979, Parker et al. 1983, Ward and Krebs 1985). They are morpholog- ically well adapted to hunting in the deep snows of the north (Murray and Boutin 1991), and their geographic range overlaps almost exactly with that of hares (Ban- field 1974).
Coyotes, in contrast, are often considered prototyp- ical generalists. Over their large and expanding range in North America, they are adapted to a wide variety of habitats, climates, and foods (see papers in Bekoff 1978). Morphologically, coyotes are not well suited for hunting in deep, soft snow because they have a high foot-load relative to other northern mammals (Murray and Boutin 1991). Coyotes are fairly recent immigrants into the far north, appearing in the Yukon between 1910 and 1920 (G. Lotenberg, unpublished report).
Theoretical (Murdoch and Oaten 1975, Hassell and May 1986, Crawley 1992) and empirical (e.g., Erlinge et al. 1983, Henttonen et al. 1987, Korpimaki 1993) evidence predicts that the effects of generalist and spe- cialist predators on prey populations are likely to be very different. Rapid functional responses of generalist predators may increase the stability of predator-prey

June 1998 PREDATION BY COYOTES AND LYNX 1195
interactions, while the delay in the numerical responses of specialists may introduce lags and dynamic insta- bility.
While there is ample evidence that the hare cycle has persisted since long before coyotes immigrated into the north (Elton and Nicholson 1942), there is little quantitative evidence of their effect on hare popula- tions, populations of alternative prey, and other pred- ators. Very few studies have been conducted of coyotes in contiguous boreal forest (Theberge and Wedeles 1989, Murray and Boutin 1991, Murray et al. 1994, 1995); Keith's study area was approximately one-third agricultural land, which was used by coyotes exten- sively during periods of low hare numbers (Todd et al. 1981). The functional responses in Keith's study area were calculated using an unverified energetic model for coyotes (i.e., assuming no surplus killing or wast- age), and an assumption that lynx rested only once per day (Keith et al. 1977). There is therefore a need for direct measurement of the functional responses of coy- otes and lynx in the boreal forest to better understand their effects on the snowshoe hare cycle.
OBJECTIVES, HYPOTHESES, AND PREDICTIONS
The goals of this paper are to present and contrast the functional responses of coyotes and lynx to the snowshoe hare cycle, and to examine the associated changes in the "components" of these responses (Holl- ing 1959b, 1966): rate of successful search, foraging time, and handling time. This research is aimed at meet- ing part of a larger objective of evaluating the total impact of mammalian predators on the dynamics of snowshoe hares. Both predators are approximately the same size (9-12 kg adult body size in the southwest Yukon), and they are therefore reliant on essentially the same prey base.
Specifically, we present the average kill rates of coy- otes and lynx each winter during a cycle in abundance of hares in the southwest Yukon. We then examine the predators' travel rates, reactive distances, capture suc- cess, foraging time, and handling time to determine mechanisms contributing to the functional responses. Changes in these components with prey density can result in either type-2 or type-3 functional responses, and it is valuable to look at the separate components to understand the predators' reactions to changing den- sity of hares (Abrams 1990).
We postulate two null hypotheses: (1) The shapes of the functional responses of coyotes and lynx are de- termined only by the relative abundances of hares and alternative prey. If this were true, then the functional responses and dietary composition of both species should be similar as hare numbers fluctuate. Alterna- tively, lynx may respond very quickly to increasing hare density and have type-2 functional responses, while coyotes may switch to and from alternative prey as the relative abundances of prey change, resulting in type-3 responses. (2) The asymptotes of the functional
responses to hares of both predators are determined by their respective daily metabolic requirements (esti- mated at -0.9 hares per day for coyotes [Litvaitis and Mautz 1980], and 0.4 hares per day for lynx [Nellis et al. 1972], from trials with captive animals). Alterna- tively, one or both species may exhibit surplus killing or wastage (Kruuk 1972), and kill more animals than expected at high densities of hares.
STUDY AREA
This study was conducted in the southwest Yukon Territory, Canada (60?57' N, 138?12' W), in a broad glacial valley of -350 km2. The study area was bound- ed to the north and south by alpine tundra, to the west by Kluane Lake, and to the east by Kloo Lake and the Jarvis River. Elevation ranges from -830 to 1170 m. The dominant vegetation of the area is white spruce forest (Picea glauca) with scattered aspen stands (Pop- ulus tremuloides), and a dense but patchy understory of willow (mostly Salix glauca and S. alaxensis), bog birch (Betula glandulosa), and soapberry (Shepherdia canadensis) (Douglas 1974). The climate is cold con- tinental, with mean January temperatures of -18'C, and -65 cm average snow accumulation. Snow cover is usually continuous from October through May.
METHODS
This study was conducted as a part of the Kluane Boreal Forest Ecosystem Project, an experimental study of the vertebrate food web in the northern forests (Krebs et al. 1995). Field work was started in 1986, and continued through the winter of 1994-1995. With the exception of some scat collection, live-trapping, and radio telemetry, field work was conducted during the winter months, from October to April.
Estimation of hare and predator densities
We estimated densities of snowshoe hares by live- trapping on 1-3 60-ha grids each March and October- November, from 1986 through 1995 (Boutin et al. 1995). Population estimates were made using the jack- knife estimator in program CAPTURE (White et al. 1982). A sample of hares was radio-collared during this period (n = 803 hares from 1987-1988 through 1994-1995, not including those on fenced and food addition experimental grids; radio collars from Lotek, Newmarket, Ontario), and they were monitored each 1-2 d for estimation of survival rates (Krebs et al. 1995).
We estimated the numbers of coyotes and lynx in our study area by monitoring the movements of radio- collared animals, and "filling in" the locations and numbers of uncollared predators using evidence from their tracks and, in the case of coyotes, their howling (details in O'Donoghue et al. 1997).
Snow-tracking of coyotes and lynx
We followed the tracks of coyotes and lynx each winter from 1987-1988 through 1994-1995, beginning

1196 MARK O'DONOGHUE ET AL. Ecology, Vol. 79, No. 4
as soon as there was enough snow, usually in mid- to late October, and finishing at the end of March. Nine- teen different observers snow-tracked predators during the eight winters of study. This was the main method that we used for determining species and frequencies of kills and attempted kills, hunting success rates, lengths of chases, proportions of prey eaten, frequen- cies of scavenging and caching, and frequencies of beds. We also collected scats along these tracks for later analysis.
Fresh tracks were selected along snowmobile trails and roads in our study area on any days that weather and snow conditions permitted. We were usually unable to distinguish among individual predators based on their tracks, and so we chose tracks to follow that spread our tracking effort as evenly as possible over the study area, between coyotes and lynx, and among different group sizes of predators. Once a track was selected, it was usually followed backwards (relative to the animal's direction of travel) until it was lost due to poor snow conditions or confusion with the tracks of other animals. We then tried to follow it forwards as far as possible, to have continuous segments of max- imum length; this sometimes required several days of following the same tracks.
We counted the distance tracked on hand-held tally counters (numbers of paces were later converted to meters, using observer-specific conversion factors), and recorded events along the tracks on microcassette recorders. At each site of a kill, we recorded the prey species, number of bounds by the predator, proportion of the carcass consumed (estimated subjectively), which parts were left uneaten, whether or not any of the carcass was cached, and a detailed description of any signs left. We recorded the prey species and number of bounds for all unsuccessful attempts. At sites where predators scavenged old kills or retrieved caches, we estimated the amount of food eaten when possible (e.g., impressions from cached prey were sometimes clear enough to see what parts of the prey were cached), and noted any evidence of the initial cause of death of the prey. All beds were classified as crouches (or hunting beds), "short" beds (where the predator had lain down but did not stay long enough to melt the snow), or resting beds.
We analyzed tracking data using the MGLH (Mul- tivariate General Linear Hypothesis) procedure in SYS- TAT (Wilkinson 1990), and considered P < 0.05 the criterion for rejecting null hypotheses. We considered each instance of a chase or kill by a predator, rather than each individual predator (which we were unable to distinguish), as an independent data point in our statistical analyses. The outcomes of encounters be- tween predators and their prey depend on many factors (including the behaviors and conditions of both ani- mals, habitat, snow conditions, and weather), and while it would have been valuable to control for individual predators, we felt justified in considering each preda-
tory attempt as independent. Proportions of diet by biomass were calculated by multiplying numbers of prey killed by 1500 g for hares, 250 g for red squirrels (Tamiasciurus hudsonicus), and 20 g for small mam- mals.
Scat analysis
We analyzed scats of coyotes and lynx collected in all winters to supplement our estimates of the preda- tors' diets obtained from the tracking data. Scats were frozen and stored until ready for analysis, at which time they were autoclaved for 20-30 min. We divided our scat samples into separate months for each year and predator, and selected subsamples for analysis to max- imize the spatial distribution over the study area and avoid selecting multiple scats from the same trails. Scats were analyzed by several different observers and in three laboratories, each using slightly different tech- niques for handling scats and quantifying the undi- gested remains of prey species. In all protocols, scats were manually broken apart, 10-30 random samples of hairs were selected, and hairs from these subsamples were identified based on color-banding, and patterns of cuticular scales and medullary pigments (e.g., Moore et al. 1974).
We report the results of scat analyses here only as the relative frequency of occurrence of different prey items in scats, since this measure does not depend on the protocol used for quantifying the contents of scats. Although smaller sized prey are frequently overrepre- sented in scat samples (Floyd et al. 1978, O'Gara 1986), Johnson and Hansen (1979) reported that rela- tive frequency of occurrence of prey in scats of coyotes was closely related to the percentage intake by biomass.
Monitoring of radio-collared predators
We live-trapped coyotes and lynx, mostly during the fall and winter months, using padded foot-hold traps (No. 3 Soft-catch traps, Woodstream Corporation, Li- titz, Pennsylvania), cable snares (Fremont leg snares, Fremont Humane Traps, Candle Lake, Saskatchewan), and box traps (techniques similar to Mowat et al. 1994). We checked traps at least once per day, and locked traps open when the temperature was <-20'C. During the first 4 yr of the study, we immobilized captured animals using a 7:1 mixture of ketamine hydrochloride and xylazine hydrochloride, but we switched to using a mixture of tiletamine hydrochloride and zolazepam hydrochloride (Telazol, A. H. Robbins Company, Rich- mond, Virginia) since then (Poole et al. 1993).
We fitted animals with radio collars weighing 250- 350 g (Telonics, Incorporated, Mesa, Arizona); most of these had internal mercury switches sensitive to movement, which allowed us to monitor the activity of collared animals. The pulse rate of the radio signal switched between 60 and 90 beeps/min, depending on the inclination of the mercury switch.
We monitored the radio-collared animals to gather

June 1998 PREDATION BY COYOTES AND LYNX 1197
information on their travel rates and activity patterns, in order to interpret the snow-tracking data. From 1989 through 1995, we opportunistically measured normal travel rates of coyotes and lynx when they were in accessible locations. To do this, we first walked in on a collared animal until we gained a very accurate fix on its location (either by actually seeing the animal or waiting until it left a bed, which we subsequently lo- cated). We then monitored the animal's activity until it either settled down into a bed or was in a location that we could once again pinpoint. On occasions that we successfully determined two exact locations without disturbing the animal, we then followed the animal's tracks between the two sites and measured its exact travel distance, from which we calculated a travel rate.
We also monitored the signals of radio-collared coy- otes and lynx during continuous blocks of time from 1990 through 1995, to determine their activity patterns. We set up monitoring stations at several high-altitude locations in the study area, where we could regularly receive the signals of collared animals wherever they moved in their home ranges. We used a Lotek SRX- 400 programmable receiver with a data logger (Lotek, Newmarket, Ontario) to monitor the activity of pred- ators. We set this to record the pulse rate and signal strength of a target animal's collar each 30 s, based on three signal pulses each reading. At these settings, we could record -18 h of continuous activity before the memory of the data logger was full.
We conducted a series of trials with activity moni- toring to develop a statistical technique to interpret these data. We simultaneously monitored the signals of target animals using the automatic receiver and an ob- server listening constantly to the signal. Observers re- corded continuous records of the activity of one coyote for 20 h (in four different sessions), and five lynx for 45.75 h (in 15 different sessions). We used the activity recorded by the observers as the standards for inter- preting the data records from the automatic receiver.
We used discriminant function analysis to analyze the activity data. We first calculated separate discrim- inant functions for coyotes and lynx based on our trial data. We calculated the mean, median, variance, and range of the pulse rate and signal strength in a 5-min sliding window from the data record of the automatic receiver. These were standardized within each collar to a mean - 0 and standard deviation = 1, and each period was classified as "active" or "inactive" based on our trial monitoring. The discriminant functions calculated with these variables correctly predicted active periods for coyotes 92% of the time and for lynx 79% of the time, and inactive periods for coyotes 77% of the time, and for lynx 78% of the time. We used these discrim- inant functions to classify all of the activity records from the automatic receiver.
We calculated the overall percentage time active each winter for each animal monitored, in six 4-h blocks, beginning with 2400-0359. The mean of these was
taken as the overall percentage time active per animal per year, and then the means of all coyotes and all lynx within each year were calculated to give us estimates of the average percentage time that coyotes and lynx were active each winter. Confidence limits were cal- culated using arcsine-transformed data. We carried out a further check on the accuracy of this method in 1991- 1992, by listening to the signals of three coyotes for 122 h and of nine lynx for 295 h, and subjectively classifying them as active or inactive each 5 min based on variations in signal strength and pulse rate. We cal- culated the overall percentage time active of these an- imals in the same manner as with data from the au- tomatic receiver.
Calculation offunctional responses
We used travel rates and activity patterns estimated from radio-collared animals to transform kills per ki- lometer trail from our snow-tracking data to kills per day. Kill rates were adjusted for group size (including coyote pups and lynx kittens) for all tracks where more than one animal was followed. We calculated the amount of "active predator time" represented by our tracks in each winter, by predator species, by dividing the total track distances by measured travel rates, and adding standard times for observations of kills and scavenging (0.75 h for each kill of a hare, based on observations of a captive lynx, 0.25 h for each kill of a squirrel, 0.08 h for each kill of a small mammal, 0.50 h for each digging up and feeding on a cache, and 0.25 h for each instance of scavenging). We then divided the active times for coyotes and lynx by the percentage times they were active each year to estimate the total amount of coyote and lynx time (including resting pe- riods) represented by our snow-tracking each winter. Kill rates of hares per day were calculated by predator each winter, by dividing our measured numbers of kills by the numbers of "coyote days" and "lynx days" that we had followed.
We calculated the functional responses of coyotes and lynx by plotting kill rates against the fall and spring densities of hares, and the means of these two, based on live-trapping. For descriptive purposes, we fitted Rolling's disc equation (1959a) to these data, using the NONLIN least-squares curve-fitting procedure in SYS- TAT (Wilkinson 1990). It would have been desirable to statistically test whether the data were best described by type-i, type-2, or type-3 curves. However, given that we only had eight data points (from eight winters) per predator, and no replication at each density of hares, this would have been little more than an exercise in curve-fitting, with little power to distinguish among the true shapes of the curves (Trexler et al. 1988).
Monitoring of caches
We observed caching of prey and use of caches by both coyotes and lynx during the first years of this study. We had no way of knowing, however, how often

1198 MARK O'DONOGHUE ET AL. Ecology, Vol. 79, No. 4
200 20 E
U 150 15
100 10 0
C15~~~~~~~~~~~~~~h
z 50 / , xt 5 z
0 L 0
1986- 1988- 1990- 1992- 1994- 1987 1989 1991 1993 1995
Winter FIG. 1. Estimated densities of snowshoe hares (means of
autumn and late winter estimates from live-trapping on 1-3 60-ha grids), coyotes, and lynx (estimates based on locations of radio-collared animals and snow-tracking; O'Donoghue et al. 1997), from 1986 through 1995 in the southwest Yukon. The mean coefficients of variation were 34 and 44% for au- tumn and late winter estimates of hares, respectively (Boutin et al. 1995).
and when caches were returned to, or whether the cach- es that we located while snow-tracking had been killed by the same species that ate it later in the winter, killed by a different species, or had originally died of causes besides predation. Distinguishing among these alter- natives is important in understanding the kill rates and foraging tactics of the predators.
Beginning in the winter of 1992-1993, we began monitoring caches made by coyotes and lynx, which we located while snow-tracking or from kills of radio- collared hares between October and April. When we located caches with substantial meat left on them, we disturbed the sites as little as possible, and set up mon- itoring radios. These each consisted of a beacon radio, hung in a tree overhead so the site could be located again, and a second "cache radio," which was buried in the snow near the cache. The cache radio had a steel wire wrapped around its battery, and the batteries were left uncemented to the radio transmitters. The wire ran under the snow, and was twisted around an accessible part of the cache (often a leg). When caches were dis- turbed, the battery pulled loose from the radio, which then stopped transmitting. The cache radios were mon- itored every 2 d; when we could not hear signals from them, we followed the signals of the beacons to the sites, and recorded data about the cause of the distur- bance, how much of the cache was eaten, and details of the cache retrieval.
RESULTS
Densities of hares and predators Densities of hares increased from 1986-1987 to a
peak of ~-2/ha in 1989-1990, and then declined to very
n 5 27 20 24 12 13 69 19 o Other 100 K
80
60-
40-
20-
0-
0-_
(I
n 27 32 52 67 44 75 135 70 .-Other
100 4 IM7
80
60 - I IX
40
20-
0 1987- 1989- 1991- 1993- 1988 1990 1992 1994
Winter FIG. 2. Percentage of kills by prey species located along
tracks of coyotes and lynx during winter, 1987-1988 through 1994-1995. Sample sizes are given above bars. "Other" kills for coyotes were 2 grouse, 1 flying squirrel, and 1 unknown prey, and for lynx were 12 grouse, 2 muskrats, 2 flying squir- rels, 1 short-tailed weasel, 1 red fox, and 1 unknown prey.
low numbers by the winter of 1992-1993 (Fig. 1). The cyclic amplitude was 26-44 fold, depending on wheth- er fall or spring densities are considered (Boutin et al. 1995). Numbers of hares began to climb again in 1994. Densities of coyotes and lynx fluctuated 6-fold and 7.5- fold, respectively, as the abundance of hares cycled, with a 1-yr lag in the numerical responses (Fig. 1; see also O'Donoghue et al. 1997).
Diets of coyotes and lynx
Coyotes.-We followed the tracks of coyotes for 1897 km during the eight winters from 1987-1988 through 1994-1995 (mean [+1 SD] per winter, 237 ?
100 km). We found 189 kills by coyotes, 47.1% of which were hares, 13.2% red squirrels, and 37.6% small mammals (Fig. 2). Coyotes killed mostly hares from 1987-1988 through 1991-1992, plus some red squirrels and small mammals from 1989-1990 through 1991-1992. Small mammals comprised most kills in

June 1998 PREDATION BY COYOTES AND LYNX 1199
X Other
n =5 27 20 24 12 13 69 19
1 00 -
80-
60-
40-
20 -
ci, 0
E o n27 32 52 67 44 75 135 70 ~ 1 00 4-WOther
80 -
60-
40-
20-
0 1987- 1989- 1991- 1993- 1988 1990 1992 1994
Winter FIG. 3. Percentage biomass of kills by prey species lo-
cated along tracks of coyotes and lynx during winter, 1987- 1988 through 1994-1995. Sample sizes (numbers of kills) are given above bars.
1992-1993 and 1993-1994, while hares and red squir- rels were killed more frequently in 1994-1995. In terms of biomass, the diets of coyotes were composed largely of hares in all winters (Fig. 3). Small mammals made up a maximum of 9.5% of biomass in 1993-1994, a winter of high vole density, and red squirrels made up a maximum of 19.9% in 1994-1995 (Fig. 3).
Scat analyses suggest that coyotes used a greater diversity of prey during the cyclic increase (1987-1988 and 1988-1989) and low (1992--1993 and 1993-1994) phases in numbers of hares than indicated by our snow- tracking (Fig. 4). The relative frequency of occurrence of small mammals (mostly Microtus) in scats ranged from 18.0 to 42.2% during these years; we likely missed many of these kills while snow-tracking. Hares comprised most of the diets of coyotes from 1989- 1990 through 1991-1992 (relative frequency of oc- currence 82.9-90.7%), but only 31.1-65.4% (based on scats) in other years. Red squirrels were a minor com- ponent of the diet in all winters (relative frequency of occurrence 0.0-13.5%).
n =102 60 39 55 30 31 32 39 100 -- Other
80 -
$_ 60 - 0
Cl) 40-
20
0
0
0 j' 0
n=6064 35 44 36 34 37 30 100 -W Other
LL 80-
60 60
40-
20 4
0 1987- 1989- 1991- 1993- 1988 1990 1992 1994
Winter FIG. 4. Relative frequency of occurrence of prey species
in the scats of coyotes and lynx during winter, 1987-1988 through 1994-1995. Sample sizes (numbers of scats ana- lyzed) are given above bars. Relative frequency of occurrence is roughly equivalent to biomass ingested, although smaller sized prey species may be overestimated. Other prey species for both predators included moose, Arctic ground squirrel, and unidentified prey remains in scats.
Lynx.-We followed the tracks of lynx for 2232 km during the eight winters from 1987-1988 through 1994-1995 (mean [ L 1 SD] per winter, 279 + 85 km). We found 502 kills by lynx, 50.2% of which were hares, 34.7% red squirrels, and 11.0% small mammals (Fig. 2). Lynx killed mostly hares from 1987-1988 through 1991-1992, plus some red squirrels in 1987-1988. Red squirrels comprised most kills from 1992--1993 through 1994-1995. In terms of biomass, the diets of lynx were composed largely of hares from 1987-1988 through 1991-1992, but red squirrels became increasingly im- portant from 1992-1993 through 1994-1995 (20.4- 43.9%; Fig. 3). Small mammals made up a negligible proportion of the diet in all winters.
Scat analyses suggest that lynx used a greater di- versity of prey during the cyclic increase (1987-1988 and 1988-1989) and low (1993-1994) phases in num-

1200 MARK O'DONOGHUE ET AL. Ecology, Vol. 79, No. 4
bers of hares than indicated by our snow-tracking (Fig. 4). The relative frequency of occurrence of small mam- mals in scats ranged from 23.1 to 25.5% during these years. Hares comprised most of the diets of lynx from 1989-1990 through 1991-1992 (relative frequency of occurrence 84.6-94.4%), and 38.5-60.0% of diets (based on scats) in other years. Red squirrels were an important component of the diets of lynx from 1992- 1993 through 1994-1995 (relative frequency of oc- currence 25.0-36.5%).
Travel speed of coyotes and lynx
Between 1989 and 1995, we successfully completed measures of the travel rates of coyotes 7 times (average duration 46 min, range 15-150 min), and of lynx 16 times (average duration 99 min, range 11-274 min). Coyotes traveled at 2.49 ? 0.39 km/h (?1 SD, range 1.77-3.06 km/h), while lynx traveled at 1.09 ? 0.21 km/h (? 1 SD, range 0.75-1.46 km/h).
Activity of coyotes and lynx
Coyotes.-We used radio telemetry to monitor the activity of three coyotes in 1990-1991 (522 h), three in 1991-1992 (279 h), one in 1992-1993 (73 h), and two in 1993-1994 (468 h). The percentage time active averaged 46.7%, and varied little among years (range 44.3-49.7%) and animals (mean cv = 2.4%). Like- wise, the number of beds of coyotes that we found while snow-tracking was approximately the same in all years (range 2.5-4.3 beds/10-km trail).
Lynx.-We used radio telemetry to monitor the ac- tivity of five lynx in 1990-1991 (1595 h), four in 1991 - 1992 (181 h), six in 1992-1993 (195 h), five in 1993- 1994 (845 h), and six in 1994-1995 (1441 h). The percentage time active averaged 41.5%, and varied lit- tle among years (39.2-43.5%) and animals (mean cv = 4.8%). Unlike coyotes though, the number of beds of lynx that we found while snow-tracking increased over three-fold from 1989-1990 (5.1 beds/10-km trail) to 1993-1994 (18.4 beds/10-km trail). The frequency of resting beds was more stable (range 1.9-5.0/10-km trail) than that of ambush and short beds (range 3.2- 13.4/10-km trail) during this period.
Accuracy of method.-We listened to the signals of three coyotes (122 h) and nine lynx (295 h) during the winter of 1991-1992 to assess the accuracy of inferring activity patterns from the output of the automatic re- ceiver. Coyotes were judged to be active 47.4% of the time based on this monitoring, compared to 48.1% of the time from the automatic receiver, and lynx were judged to be active 41.9% of the time, compared to 40.0% of the time from the automatic receiver. Ana- lyzing the output of the automatic receiver therefore seems to be an accurate method of assessing activity of predators.
Functional responses of coyotes and lynx
Coyotes.-Coyotes showed a strong functional re- sponse to changes in density of hares (Fig. 5). (Activity
2.5 88
2.0
a)
0~~~~~~~~~8
1 .2 5 -------- a)~~~~~~~~~~~~8
20~~~~~~9
1 5 99 0.5 _1S9-
t93
(D
0
0 50 100 150 200 250
No. hares/i100 ha FIG. 5. Functional responses of coyotes and lynx (kills
per day per predator) to the density of snowshoe hares from 1987-1988 through 1994-1995. The solid lines represent the best fits of the disc equation (Holling 1959a) and, in the case of coyotes, a linear functional response curve, plotting kill rates against the mean over-winter densities of hares. Num- bers next to each point indicate the year starting each winter (e.g., 87 =1987-1988). For comparison, functional responses of predators were also calculated using fall densities of hares and kills by predators from October to December (long- dashed lines), and late winter densities of hares and kills from January to March (short-dashed lines).
measurements from 1990-199 1 were used for the three previous winters, and those from 1993-1994 were used for 1994-1995, to calculate the kill rates in those win- ters in which no measurements of activity were made.) The disc equation (type-2 curve) was fitted to these data for the purpose of description (fitted parameters a = 0.021, h =0.418), but its fit (r2 = 0.83) is little better than the fit of a linear functional response (r2 =
0.80). When functional responses are plotted separately for the early and late winter, the early-winter curve is nearly linear, while the late-winter response approaches an asymptote over observed prey densities (Fig. 5). The maximum over-winter kill rate per coyote suggested by the disc equation is 2.4 hares per day, which is close to what we observed in 1988-1989 (2.3 hares/day). Kill rates peaked in 1988-1989, a year before hare numbers peaked, and they were generally higher during periods of increase in density of hares (1987-1988 through 1988-1989, and 1994-1995) than during the peak, de- cline, and low phases of the cycle (1989-1990 through 1993--1994).
Lynx.-Lynx also showed a functional response to changes in density of hares (Fig. 5). (Activity mea-

June 1998 PREDATION BY COYOTES AND LYNX 1201
surements from 1990-1991 were used for the three previous winters to calculate the kill rates in those win- ters in which no measurements of activity were made.) The disc equation was fitted to these data for the pur- pose of description (fitted parameters a = 0.031, h =
0.756), and it fits the observed kill rates quite closely (r2 = 0.96, compared to r2 = 0.88 for a linear functional response). Type-2 functional responses in the early- winter and late-winter periods are similar in shape to that calculated for the whole winter, and, as with coy- otes, the early-winter asymptote is higher (Fig. 5). The maximum kill rate per lynx suggested by the disc equa- tion is 1.3 hares per day, which is close to what we observed in 1990-1991 (1.2 hares/d). Kill rates peaked in 1990-1991, the year after hare numbers peaked, and unlike coyotes, they were lower during periods of in- crease in density of hares (1987-1988 through 1988- 1989, and 1994-1995) than during the peak, decline, and low phases of the cycle (1989-1990 through 1993- 1994).
Components of the functional responses of coyotes and lynx
Holling (1959a, 1966) considered that there were three basic components of functional responses of pred- ators to prey: the rate of successful search (determined by the reactive distance of the predator to its prey, the rates of movements of both the predator and prey, and the predator's capture success), the time the predator was exposed to the prey, and the handling time (the sum of time spent pursuing, subduing, eating, and di- gesting prey). These parameters were constants in Holl- ing's disc equation (Holling 1959a), but it is likely they vary with changing densities of prey (Abrams 1990). We briefly examine our data here for evidence of changes in these components with hare density; other behavioral changes of predators are considered in O'Donoghue et al. (1998).
Rate of successful search.-The only measures that we made of the reactive distances of coyotes and lynx to hares were the lengths of their chases, and we use these here as indices of the actual reactive distances (although they are invariably longer, due to the prey being flushed). Chases of hares made by both coyotes and lynx were considerably longer during the low and early increase phases of the hare cycle (1992-1993 through 1994-1995) than during the late increase, peak, and decline winters (1987-1988 through 1991- 1992) (Fig. 6; ANOVA on log-transformed data, Effect of Year, F = 32.26, df = 7, 990, P = 0.000; Tukey's HSD for coyote and lynx data pooled, [1987-1988 = 1988-1989 = 1989-1990] < [1989-1990 = 1990- 1991 = 1991-1992] < [1992-1993 = 1993-1994 =
1994-1995]). Unsuccessful chases were significantly longer (F = 98.77, df = 1, 990, P = 0.000) than chases at successful kills.
Since six of seven of our measures of rates of travel by coyotes were made during years of high hare den-
30
20
0* Kills of hares
1 -U- - Aftempted kills,'
(I)
0- i
? 30 0)
20 -.* Kills of hares ,
. -U- - Attempted kills,' '.
10
0 1987- 1989- 1991- 1993- 1988 1990 1992 1994
Winter FIG. 6. Lengths of chases of hares in successful (coyote,
n = 59; lynx, n = 193) and unsuccessful (coyote, n = 149; lynx, n = 623) attempts by coyotes and lynx from 1987- 1988 through 1994-1995. Mean coefficient of variation of chase lengths = 103% (error bars are omitted for the sake of clarity).
sity, we can only evaluate changes in travel rates during the hare cycle for lynx. The mean travel rate of lynx did not differ between periods of higher numbers of hares (1989-1990 through 1991-1992; travel rate (mean ? 1 SD) = 1.02 ? 0.23 km/h and periods of lower numbers (1992-1993 through 1994-1995; travel rate (mean + 1 SD = 1.13 ? 0.16 km/h; t test, t =
1.63, df = 14; P = 0.13). We gathered no data on the travel rates of hares.
Hunting success of coyotes preying on hares was relatively constant from 1989-1990 through 1993- 1994 (range 26.8-37.5%; Fig. 7), but considerably higher in the cyclic increase years of 1988-1989 (57.4%) and 1994-1995 (68.8%, although the sample size was quite small that year). Success rates of lynx preying on hares were less variable than those of coy- otes (range 20.0-38.8%); the lowest success rates were in the last three winters of the study (20.0-21.9%; Fig. 7).
Time exposed to prey.-As previously noted, the per- centage of time active by both coyotes and lynx was fairly constant from 1990 through 1995. For lynx, how- ever, the percentage of time active may not be a good measure of time exposed to prey. Lynx often used am- bush beds, and use of ambush and short beds increased over four-fold during the cyclic decline of hares (see also O'Donoghue et al. 1998).
1202 MARK O'DONOGHUE ET AL. Ecology, Vol. 79, No. 4
100
80 -6
C 60 - 47 (I)
U) () ]~~~~~60 8 40 1 *
2 C/) -556/''1 ] 63
4 138,~ 20 14 78 55 ! | i
1987- 1989- 1991- 1993- 1988 1990 1992 1994
Winter
FIG. 7. Hunting success rates (percentage of all chases that were successful) of coyotes and lynx preying on hares from 1987-1988 through 1994-1995. Sample sizes (number of chases) are given next to the points.
Handling time.-We have no measures of the amount of time necessary to digest hares, but we did record the amount of prey eaten per kill for both predators. The percentage of the carcasses of hares eaten by coy- otes and lynx remained fairly constant from 1987-1988 through 1994-1995 (ANOVA on arcsine-transformed data, Effect of Year, F = 0.43, df = 7, 285, P = 0.886). Coyotes ate 82.2-95.6% of carcasses in all years except 1993-1994, when an average of only 62.1% per hare carcass was eaten (but only five hares were killed in this winter). Lynx ate an average of 78.2-95.2% per carcass. The total amount of time devoted to chasing, subduing, and eating hares are likely very minor com- ponents of the time budgets of coyotes and lynx.
Scavenging and caching by coyotes and lynx
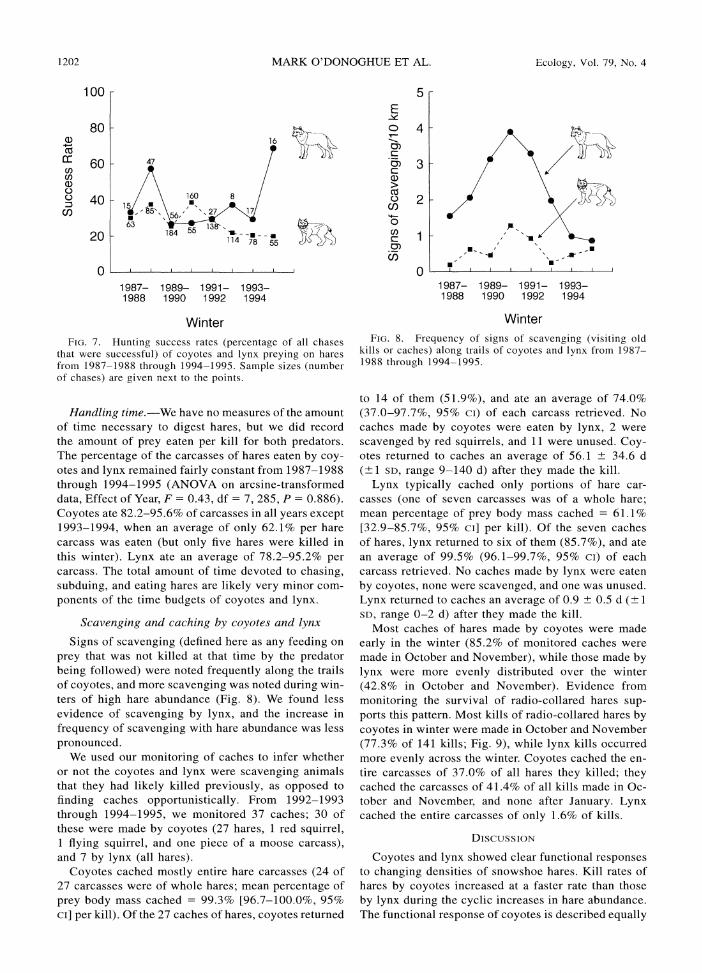
Signs of scavenging (defined here as any feeding on prey that was not killed at that time by the predator being followed) were noted frequently along the trails of coyotes, and more scavenging was noted during win- ters of high hare abundance (Fig. 8). We found less evidence of scavenging by lynx, and the increase in frequency of scavenging with hare abundance was less pronounced.
We used our monitoring of caches to infer whether or not the coyotes and lynx were scavenging animals that they had likely killed previously, as opposed to finding caches opportunistically. From 1992-1993 through 1994-1995, we monitored 37 caches; 30 of these were made by coyotes (27 hares, 1 red squirrel, 1 flying squirrel, and one piece of a moose carcass), and 7 by lynx (all hares).
Coyotes cached mostly entire hare carcasses (24 of 27 carcasses were of whole hares; mean percentage of prey body mass cached = 99.3% [96.7-100.0%, 95% CI] per kill). Of the 27 caches of hares, coyotes returned
5 E o 4
(a) 2 g\ a 2
"' 1 " /\ 0) * ' U)~~~~~~~~
1987- 1989- 1991- 1993- 1988 1990 1992 1994
Winter FIG. 8. Frequency of signs of scavenging (visiting old
kills or caches) along trails of coyotes and lynx from 1987- 1988 through 1994-1995.
to 14 of them (51.9%), and ate an average of 74.0% (37.0-97.7%, 95% ci) of each carcass retrieved. No caches made by coyotes were eaten by lynx, 2 were scavenged by red squirrels, and 11 were unused. Coy- otes returned to caches an average of 56.1 ? 34.6 d (? 1 SD, range 9-140 d) after they made the kill.
Lynx typically cached only portions of hare car- casses (one of seven carcasses was of a whole hare; mean percentage of prey body mass cached = 61.1% [32.9-85.7%, 95% ci] per kill). Of the seven caches of hares, lynx returned to six of them (85.7%), and ate an average of 99.5% (96.1-99.7%, 95% ci) of each carcass retrieved. No caches made by lynx were eaten by coyotes, none were scavenged, and one was unused. Lynx returned to caches an average of 0.9 ? 0.5 d (?1 SD, range 0-2 d) after they made the kill.
Most caches of hares made by coyotes were made early in the winter (85.2% of monitored caches were made in October and November), while those made by lynx were more evenly distributed over the winter (42.8% in October and November). Evidence from monitoring the survival of radio-collared hares sup- ports this pattern. Most kills of radio-collared hares by coyotes in winter were made in October and November (77.3% of 141 kills; Fig. 9), while lynx kills occurred more evenly across the winter. Coyotes cached the en- tire carcasses of 37.0% of all hares they killed; they cached the carcasses of 41.4% of all kills made in Oc- tober and November, and none after January. Lynx cached the entire carcasses of only 1.6% of kills.
DISCUSSION
Coyotes and lynx showed clear functional responses to changing densities of snowshoe hares. Kill rates of hares by coyotes increased at a faster rate than those by lynx during the cyclic increases in hare abundance. The functional response of coyotes is described equally

June 1998 PREDATION BY COYOTES AND LYNX 1203
0 110 92 65 153 48 62 60= n 0-
80 -Other FIG. 9. Unidentified
given above bars.Predator
-Q 60-
0 4
a) 40_
20-
0)
rr ~~~Month FIG. 9. Percentages of deprediated radio-collared hares
killed by coyotes and lynx by month during winter from 1986 through 1995. Sample sizes (total number of mortalities) are given above bars. Other includes avian predators, red foxes, wolverines, wolves, and cases where the identity of the pred- ator could not be determined.
well by linear and type-2 curves, while that of lynx is well described by a type-2 curve. Both predators killed more hares than energetically required when hares were abundant. At lower densities of hares, coyotes preyed more on small mammals, and lynx on red squirrels. Coyotes frequently scavenged carcasses of hares, and many of these may be hares previously killed and cached by coyotes.
In the following discussion, we will discuss these main points in more detail, and finish with an evalu- ation of potential biases in our estimates of functional responses.
Functional responses of coyotes and lynx
Our estimates of kill rates were based on measured numbers of kills per distance traveled, travel rates, and activity budgets of coyotes and lynx. The variance of the latter two parameters was very low among radio- collared animals, but as we were unable to distinguish among tracks of individuals, we have no measures of variance of kill rates per winter. The functional re- sponses calculated for predators therefore reflect over- all trends among years, but we have no estimates of their precision. We must be accordingly conservative in the inferences we make based on these observed patterns.
Although we had too few data points to accurately determine the shapes of the functional responses of coyotes and lynx, it is clear that the two predators responded differently to changing densities of hares in our study. The functional response of coyotes showed no clear asymptote, especially in the early winter, while that of lynx clearly had a decelerating slope (Fig. 5). Lack of evidence for satiation in functional responses
measured in the field is typical (Boutin 1995), contrary to theoretical expectations. Coyotes responded to in- creasing hare numbers, both in 1987-1988 through 1988-1989 and in 1994-1995, with kill rates that were higher than those at comparable densities of hares dur- ing the cyclic decline (Fig. 5). Lynx showed the op- posite pattern. This was not what we had expected based on the simple contrast of coyotes as generalists and lynx as hare specialists; typically, specialists re- spond with kill rates increasing at a faster rate at low densities of their preferred prey than do generalists. In Alberta, the functional response of lynx was stronger than that of coyotes at low numbers of hares (type-2 vs. type-3 responses; Keith et al. 1977).
The availability of alternative prey in the Yukon may be one reason for the difference in the relative re- sponses of coyotes and lynx. The main prey of coyotes besides hares in our study area were small mammals (Figs. 2-4). Populations of small mammals were high in 1987-1988 and from 1991-1992 through 1993- 1994, and low in other years (Boutin et al. 1995). Based on scat analyses (Fig. 4), they were the most important alternative prey of coyotes during years that they were abundant. The availability of small mammals during winter, however, is limited by snow cover (Wells and Bekoff 1982, Halpin and Bissonette 1988) and affected by species-specific vulnerabilities; Microtus, which are mostly confined to grassy meadows (which comprised only -7% of our study area), appear to be much more vulnerable to predation than the more widespread Clethrionomys (Henttonen et al. 1987).
Coyotes may have opportunistically taken advantage of increasing numbers of hares because they had few alternatives. The most important prey of coyotes during cyclic lows in other northern studies was either not available (livestock carcasses in Alberta; Todd et al. 1981, Todd and Keith 1983) or available in low num- bers (moose carcasses in Alaska; Staples 1995) for coy- otes in our study area. Coyotes were evidently not as skilled at catching red squirrels as were lynx, since they made few kills of this abundant potential prey. Alternatively, lower kill rates by coyotes during cyclic declines, and, in our case, at the cyclic peak of hare abundance (1989-1990; Fig. 5), may reflect an in- creased proportion of inexperienced young animals in the predator population, derived from the pulse of re- production from 1988-1989 through 1991-1992 (O'Donoghue et al. 1997).
The main alternative prey of lynx during our study was red squirrels (Figs. 2-4). Populations of red squir- rels were relatively stable during the eight winters of this study (Boutin et al. 1995). Behavioral data suggest that lynx increased active foraging for squirrels during the cyclic low in hare abundance (1992-1993 and 1993-1994; O'Donoghue et al. 1998). Despite the in- crease in hare numbers in 1994, lynx that had mostly hunted squirrels during the previous two winters, con- tinued to do so during the winter of 1994-1995. While

1204 MARK O'DONOGHUE ET AL. Ecology, Vol. 79, No. 4
hunting success of lynx preying on hares declined from 1990-1991 through 1994-1995 (38.8% to 20.0%; Fig. 7), it increased from 1992-1993 through 1994-1995 (30.5% to 50.5%; O'Donoghue et al. 1998) for lynx hunting red squirrels.
These data suggest that lynx surviving into the low of the hare cycle became skilled at hunting squirrels, and these may have been less plastic than coyotes in modifying their foraging behavior when hare numbers started to increase again. There is ample evidence from the literature that foraging decisions are more strongly influenced by recent feeding choices than those made over a longer time frame (Shettleworth et al. 1993), and this effect may be stronger in some predators than others.
The maximum kill rates of hares by coyotes (2.3 hares per day per coyote) and lynx (1.2 hares per day per lynx) calculated in this study are higher than those reported in the literature, and those based on estimates of energetic requirements. The energetic needs of coy- otes have been estimated to be from 0.7 to 0.9 hares per day (Keith et al. 1977, Litvaitis and Mautz 1980), and those of lynx to be from 0.4 to 0.5 hares per day (Nellis et al. 1972, Aldama et al. 1991). Estimated kill rates by lynx have ranged from 0.5 hares/d in New- foundland (Saunders 1963) to 0.8 hares/d in Alberta (Brand et al. 1976, Keith et al. 1977) to -I hare/d in Nova Scotia (Parker 1981). The studies in both Alberta and Newfoundland based their estimates of kill rates on the assumption that the distance between two resting beds represented 1 d of travel by lynx. Several studies have noted though, that lynx may rest more than once per day (Haglund 1966, Parker 1981; M. O'Donoghue, unpublished data), and estimates made with this as- sumption are likely underestimates.
Our estimates of kill rates of hares by lynx, and particularly coyotes, are likely conservative, due to po- tential biases in our field sampling (see Discussion: How accurate are our estimates of kill rates?). Ap- parently then, coyotes, and to a lesser extent, lynx, killed more than they energetically needed during years of high abundance of hares. Some of this excess food was cached by coyotes, and some of these caches were lost to scavengers or not retrieved. Storing excess food may guard against future periods of scarcity or losses of caches (review in Vander Wall 1990). While lynx seldom cached food, our data suggest some wastage (incomplete consumption) of prey by lynx during peak years of hare abundance (mean 78.2-83.0% consumed per carcass from 1989 through 1991).
Components of the functional responses of coyotes and lynx
Our data suggest that the reactive distances of coy- otes and lynx to hares (as indexed by the lengths of chases) increased once hares had declined to low abun- dance (Fig. 6), and they provide weaker evidence that the average hunting success of coyotes was higher dur-
ing years of increasing densities of hares (Fig. 7). In- creases in either of these parameters would lead to higher rates of successful search. Reactive distances of predators may be a function of hunger or environmental factors (Holling 1965, Abrams 1990, Bell 1991), and there is evidence from other field studies that satiated predators react to prey within smaller perceptual fields (e.g., Wood and Hand 1985). The average hunting suc- cess of coyotes preying on hares was 36.9% and of lynx 28.7% in our study; this was higher than previ- ously reported success rates of 6-10% for coyotes (Ozoga and Harger 1966, Berg and Chesness 1978), but within the range of 19-57% reported for lynx (Saunders 1963, Haglund 1966, Brand et al. 1976, Par- ker 1981, Major 1989). As in this study, hunting suc- cess of lynx was not related to hare density in Alberta (Brand et al. 1976). The apparently higher hunting suc- cess by coyotes in 1988-1989 and 1994-1995 may have been partly due to the absence of young, inex- perienced coyotes in the population during these years.
We have no evidence that coyotes or lynx changed their rate of travel as densities of hares changed (we did not, however, have an adequate sample size of coy- ote travel rates at low hare densities). Several studies have noted that travel rates vary with density of prey (e.g., Smith 1974, Bell 1991), but Holling (1966) con- sidered hunting speed to be adaptive for specific prey, and unlikely to vary.
Our measures of the activity patterns of coyotes and lynx showed that neither species increased their amount of active time in response to declining numbers of hares. During times of food shortage, many arthropod predators decrease the amount of time they spend for- aging (review in Bell 1991), but this is not true for all predators; lions do not change foraging time even dur- ing periods when cubs are starving (Schaller 1972). While Ward and Krebs (1985) found that lynx increased their daily movements during periods of low hare den- sity in the Yukon, this was not the case in studies in Alberta (Brand et al. 1976). As discussed previously, active time is not likely equivalent to foraging time for lynx. Lynx increased their use of hunting beds during the decline and low phases of the hare cycle (O'Donoghue et al. 1998), which likely represented an increase in the amount of time they were exposed to prey.
We have no evidence that the handling time of coy- otes and lynx preying on hares changed significantly during our study. We did note, however, that coyotes scavenged (and possibly cached) more often, and lynx consumed slightly less of hare carcasses, during peri- ods of high hare abundance. Partial consumption of prey may decrease handling time (Abrams 1990).
Diets of coyotes and lynx
Coyotes depended heavily on snowshoe hares during most years of our study, and preyed on small mammals during winters when voles were abundant (Figs. 2-4),

June 1998 PREDATION BY COYOTES AND LYNX 1205
which coincided with years of low hare densities. Al- though not quantified here, most small mammals killed were Microtus (M. O'Donoghue, unpublished data). We likely underestimated the number of kills of small mammals from our snow-tracking because, while it was easy to distinguish attempted captures of voles by coy- otes "mousing," it was often difficult to judge whether they were successful. The results of our scat analyses suggest that we missed many kills of voles. In Alberta (in the only other comparable study of diets of coyotes during a cycle in abundance of hares), the proportion of hares in the diets of coyotes ranged from 0% to 77% during cyclic lows and highs, respectively (Nellis and Keith 1976, Todd et al. 1981, Todd and Keith 1983), considerably lower than we observed (Figs. 2-4).
The preponderance of hares in the diets of lynx in our study was consistent with all studies of North American lynx (e.g., Saunders 1963, Van Zyll de Jong 1966, Brand et al. 1976, Brand and Keith 1979, Parker et al. 1983, Staples 1995). However, extensive use of red squirrels as the main alternative prey has not been noted previously. Only two other studies, one in Wash- ington (Koehler 1990) and one in Alaska (Staples 1995), have recorded squirrels as more than minor com- ponents of the diets of lynx; in both these areas, pop- ulations of hares were low. Our behavioral data show that lynx actively hunted for squirrels from 1992-1993 through 1994-1995, and may have switched (sensu Murdoch 1969) from preying on hares to preying on red squirrels during these years (O'Donoghue et al. 1998). Our scat analyses suggest that lynx also preyed on small mammals in significant numbers during win- ters when voles were abundant (Fig. 4).
The contrast between coyotes and lynx as generalists vs. hare specialists is obviously not appropriate at the local scale in our study area. Where few alternative prey are available, coyotes may be as or more depen- dent on hares than are lynx.
Scavenging and caching by coyotes and lynx
The evidence from our monitoring of radio-collared hares and caches suggests that many of the instances of scavenging of hares by coyotes, which we noted while snow-tracking, may have been of their own pre- vious kills. Lynx seldom cached prey, and when they did, they usually retrieved it the next day. Coyotes, in contrast, returned to about half of their caches, as long as 41/ mo after they were made. The wires and radios that we attached to the caches may have discouraged some animals from retrieving their caches, so this re- turn rate is a minimum estimate. This nevertheless sug- gests that coyotes have a long-term spatial memory that allows them to remember the location of caches even after they have been covered by a half meter of snow (review of spatial memory by other species in Vander Wall 1990). This corresponds with our field observa- tions of coyotes deviating well away from their travel routes (sometimes >0.5 km) to retrieve caches.
Coyotes killed and cached most hares early in the winter (Fig. 9). This is also the time when snow is shallow, and travel is easier. Hares may also be more vulnerable at this time of year due to a higher propor- tion of young animals in their population.
How accurate are our estimates of kill rates?
There are a number of potential biases that could have affected the accuracy of our estimates of kill rates of hares by coyotes and lynx:
1) In some winters, snow conditions were poor for snow-tracking in October, so we could have missed some tracking during the time of year when kill rates by coyotes were highest.
2) During the winters of peak densities of coyotes and hares, the abundance of tracks often made snow- tracking in prime habitats difficult, due to confusion caused by criss-crossing and obliterated tracks. Tracks were easier to follow when they were away from these habitats. As a result, we may have tracked longer dis- tances outside of the best habitats where more kills would have been located. We attempted to avoid this by tracking right after fresh snows when tracks were least confusing.
3) Coyotes and lynx often circled many times in the areas of kills, and made mazes of tracks that were con- fusing to follow. This was particularly true of coyotes. We may have missed some kills because we were un- able to follow some tracks to kills. We attempted to avoid this by searching very carefully in any areas with frequent circling.
4) Coyotes were very skilled at hiding caches of hares with minimal deviation from their trail and little noticeable disturbance to the snow. We may have missed some of these, although we searched very care- fully around any areas where coyotes broke stride.
5) Coyotes and lynx that were the most successful hunters may have moved less than unsuccessful pred- ators, and therefore crossed our trails, where we started snow-tracking, less frequently.
6) We may have overestimated the amount of active time of radio-collared coyotes and lynx. Activities such as eating or grooming, in which the animal frequently moved its head up and down, were probably classified as active in our analyses, even though the animal was not traveling. This bias would cause us to underesti- mate the total amount of time represented by our tracks, and therefore overestimate kill rates. We added in stan- dard times for each instance of a kill or scavenging that we observed, to account for active time spent at these activities. While we could not directly measure these standard times, the total amount of time spent feeding was a relatively small proportion (means of 10.0% [7.5-12.9%, 95% ci] and 4.1% [3.3-4.9%, 95% ci] of the total estimated time budgets of coyotes and lynx, respectively), and we suggest that there was little error introduced by this potential bias. In Alberta, Bow- en (1982) estimated that coyotes were active 50% of

1206 MARK O'DONOGHUE ET AL. Ecology, Vol. 79, No. 4
the time during winter, and Bekoff and Wells (1981, 1986) estimated that coyotes spent 46% of their time traveling and hunting during winter; these are quite close to our estimates of 44-50% time active for coy- otes.
In summary, most of the potential biases in our meth- od of estimating kill rates would cause us to under- estimate the true kill rates. We therefore consider the calculated kill rates from this study to be conservative, particularly for coyotes.
CONCLUSIONS
Coyotes and lynx both killed more hares per day at higher densities of this prey, but the patterns of their functional responses differed, contrary to our null hy- pothesis. The functional response of coyotes showed no clear level of satiation, while that of lynx ap- proached a maximum kill rate of about 1.3 hares per day. Second, although the kill rates of both predators differed between the increase and decline phases of the hare cycle, the direction of change was the opposite; coyotes killed more hares, at comparable hare densities, during the cyclic increase, while lynx killed more dur- ing the decline. These data suggest mechanisms in the behavior (e.g., plasticity, caching) and relative abilities of the two predators in catching alternative prey that contribute to their different functional responses.
ACKNOWLEDGMENTS
This paper is based on eight years of field work, as a part of the Kluane Boreal Forest Ecosystem Project. Many people contributed their time, work, and ideas to the predator re- search. S. Antpoehler, C. Bell, J. Bishop, M. Blower, R. Buck, E. Claus-Sinclair, M. Connor, T. Heakes, T. Hucal, A. Milani, S. Schweiger, I. Sinclair, P. Upton, and J. Wilmshurst tracked coyotes and lynx. V. 0. Nams developed the data entry pro- tocols. C. Doyle, F Doyle, and S. Schweiger gathered much of the data on hare populations. W. Hochachka developed the statistical analyses of the activity data, and I. Wingate helped with logistics. B. Williams and A. Williams provided a quiet spot for analyzing data and writing. L. D. Mech, F Messier, J. H. Myers, R. S. Ostfeld, A. R. E. Sinclair, J. N. M. Smith, S. Stuart, and two anonymous reviewers offered helpful crit- icisms on earlier versions of this manuscript. The Kluane project was supported by a Collaborative Special Project grant from the Natural Sciences and Engineering Research Council of Canada. This is paper No. 105 from the Kluane Boreal Forest Ecosystem Project.
LITERATURE CITED
Abrams, P. A. 1990. The effects of adaptive behavior on the type-2 functional response. Ecology 71:877-885.
1992. Adaptive foraging by predators as a cause of predator-prey cycles. Evolutionary Ecology 6:56-72.
Akqakaya, H. R. 1992. Population cycles of mammals: ev- idence for a ratio-dependent predation hypothesis. Ecolog- ical Monographs 62:119-142.
Akre, B. G., and D. M. Johnson. 1979. Switching and sig- moidal functional response curves by damselfly naiads with alternative prey available. Journal of Animal Ecology 48: 703-720.
Aldama, J. J., J. E Beltran, and M. Delibes. 1991. Energy expenditure and prey requirements of free-ranging Iberian lynx in southwestern Spain. Journal of Wildlife Manage- ment 55:635-641.
Banfield, A. W. F. 1974. The mammals of Canada. University of Toronto Press, Toronto, Canada.
Bekoff, M., editor. 1978. Coyotes: biology, behavior, and management. Academic Press, New York, New York, USA.
Bekoff, M., and M. C. Wells. 1981. Behavioral budgeting by wild coyotes: the influence of food resources and social organization. Animal Behaviour 29:794-801.
Bekoff, M., and M. C. Wells. 1986. Social ecology and be- havior of coyotes. Advances in the Study of Behavior 16: 251-338.
Bell, W. J. 1991. Searching behaviour. Chapman and Hall, London, UK.
Berg, W. E., and R. A. Chesness. 1978. Ecology of coyotes in northern Minnesota. Pages 229-247 in M. Bekoff, editor. Coyotes: biology, behavior, and management. Academic Press, New York, New York, USA.
Boutin, S. 1995. Testing predator-prey theory by studying fluctuating populations of small mammals. Wildlife Re- search 22:89-100.
Boutin, S., et al. 1995. Population changes of the vertebrate community during a snowshoe hare cycle in Canada's bo- real forest. Oikos 74:69-80.
Bowen, W. D. 1981. Variation in coyote social organization: the influence of prey size. Canadian Journal of Zoology 59:639-652.
Brand, C. J., and L. B. Keith. 1979. Lynx demography during a snowshoe hare decline in Alberta. Journal of Wildlife Management 43:827-849.
Brand, C. J., L. B. Keith, and C. A. Fischer. 1976. Lynx responses to changing snowshoe hare densities in Alberta. Journal of Wildlife Management 40:416-428.
Crawley, M. J. 1992. Overview. Pages 476-489 in M. J. Crawley, editor. Natural enemies. Blackwell Scientific Pub- lications, Oxford, UK.
Douglas, G. W. 1974. Montane zone vegetation of the Alsek River region, south-western Yukon. Canadian Journal of Botany 52:2505-2532.
Dunbrack, R. L., and L. A. Giguere. 1987. Adaptive re- sponses to accelerating costs of movement: a bioenergetic basis for the type-III functional response. American Nat- uralist 130:147-160.
Elton, C., and M. Nicholson. 1942. The ten year cycle in numbers of lynx in Canada. Journal of Animal Ecology 11: 215-244.
Erlinge, S., G. Goransson, L. Hansson, G. Hbgstedt, 0. Lib- erg, I. N. Nilsson, T. Nilsson, T. von Schantz, and M. Syl- ven. 1983. Predation as a regulating factor on small mam- mal populations in southern Sweden. Oikos 40:36-52.
Erlinge, S., G. Gbransson, G. Hdgstedt, G. Jansson, 0. Lib- erg, J. Loman, I. N. Nilsson, T. von Schantz, and M. Sylvdn. 1984. Can vertebrate predators regulate their prey? Amer- ican Naturalist 123:125-133.
Erlinge, S., G. Gdransson, G. Hdgstedt, G. Jansson, 0. Lib- erg, J. Loman, I. N. Nilsson, T. von Schantz, and M. Sylvdn. 1988. More thoughts on vertebrate regulation of prey. American Naturalist 132:148-154.
Finerty, J. P. 1980. The population ecology of cycles in small mammals. Yale University Press, New Haven, Connecticut, USA.
Floyd, T. J., L. D. Mech, and P. A. Jordan. 1978. Relating wolf scat content to prey consumed. Journal of Wildlife Management 42:528-532.
Haglund, B. 1966. Winter habits of the lynx (Lynx lynx L.) and wolverine (Gulo gulo L.) as revealed by tracking in the snow. (In Swedish; English summary.) Viltrevy 4:81- 310.
Halpin, M. A., and J. A. Bissonette. 1988. Influence of snow depth on prey availability and habitat use by red fox. Ca- nadian Journal of Zoology 66:587-592.
Hanski, I., L. Hansson, and H. Henttonen. 1991. Specialist

June 1998 PREDATION BY COYOTES AND LYNX 1207
predators, generalist predators, and the microtine rodent cycle. Journal of Animal Ecology 60:353-367.
Hanski, I., and E. Korpimdki. 1995. Microtine rodent dy- namics in northern Europe: parameterized models for the predator-prey interaction. Ecology 76:840-850.
Hanski, I., P. Turchin, E. Korpimdki, and H. Henttonen. 1993. Population oscillations of boreal rodents: regulation by mustelid predators leads to chaos. Nature 364:232-235.
Hassell, M. P., and H. N. Comins. 1978. Sigmoid functional responses and population stability. Theoretical Population Biology 14:62-67.
Hassell, M. P., J. H. Lawton, and J. R. Beddington. 1977. Sigmoid functional responses by invertebrate predators and parasitoids. Journal of Animal Ecology 46:249-262.
Hassell, M. P., and R. M. May. 1986. Generalist and spe- cialist natural enemies in insect predator-prey interactions. Journal of Animal Ecology 55:923-940.
Henttonen, H., T. Oksanen, A. Jortikka, and V. Haukisalmi. 1987. How much do weasels shape microtine cycles in the northern Fennoscandian taiga? Oikos 50:353-365.
Holling, C. S. 1959a. Some characteristics of simple types of predation and parasitism. Canadian Entomologist 91: 385-398.
. 1959b. The components of predation as revealed by a study of small-mammal predation of the European pine sawfly. Canadian Entomologist 91:293-320.
. 1965. The functional response of predators to prey density and its role in mimicry and population regulation. Memoirs of the Entomological Society of Canada 45:1-60.
. 1966. The functional response of vertebrate pred- ators to prey density. Memoirs of the Entomological So- ciety of Canada 48:1-86.
Johnson, M. K., and R. M. Hansen. 1979. Estimating coyote food intake from undigested residues in scats. American Midland Naturalist 102:363-367.
Keith, L. B. 1990. Dynamics of snowshoe hare populations. Pages 119-195 in H. H. Genoways, editor. Current mam- malogy. Plenum, New York, New York, USA.
Keith, L. B., J. R. Cary, 0. J. Rongstad, and M. C. Britting- ham. 1984. Demography and ecology of a declining snow- shoe hare population. Wildlife Monographs 90:1-43.
Keith, L. B., A. W. Todd, C. J. Brand, R. S. Adamcik, and D. H. Rusch. 1977. An analysis of predation during a cyclic fluctuation of snowshoe hares. Proceedings of the International Congress of Game Biologists 13:151-175.
Keith, L. B., and L. A. Windberg. 1978. A demographic analysis of the snowshoe hare cycle. Wildlife Monographs 58:1-70.
Koehler, G. M. 1990. Population and habitat characteristics of lynx and snowshoe hares in north central Washington. Canadian Journal of Zoology 68:845-851.
Korpimaki, E. 1993. Regulation of multiannual vole cycles by density-dependent avian and mammalian predation? Oi- kos 66:359-363.
Korpimaki, E., and K. Norrdahl. 1991. Numerical and func- tional responses of kestrels, short-eared owls, and long- eared owls to vole densities. Ecology 72:814-826.
Korpimdki, E., K. Norrdahl, and T. Rinta-Jaskari. 1991. Re- sponses of stoats and least weasels to fluctuating food abun- dances: is the low phase of the vole cycle due to mustelid predation? Oecologia (Berlin) 88:552-561.
Krebs, C. J., S. Boutin, R. Boonstra, A. R. E. Sinclair, J. N. M. Smith, M. R. T. Dale, K. Martin, and R. Turkington. 1995. Impact of food and predation on the snowshoe hare cycle. Science 269:1112-1115.
Kruuk, H. 1972. Surplus killing by carnivores. Journal of Zoology 166:233-244.
Litvaitis, J. A., and W. W. Mautz. 1980. Food and energy use by captive coyotes. Journal of Wildlife Management 44:56-61.
Major, A. R. 1989. Lynx, Lynx canadensis canadensis (Kerr) predation patterns and habitat use in the Yukon Territory, Canada. Thesis. State University of New York, Syracuse, New York, USA.
Moore, T. D., L. E. Spence, C. E. Dugnolle, and W. P. Hep- worth. 1974. Identification of the dorsal guard hairs of some mammals of Wyoming. Wyoming Game and Fish Department Bulletin 14.
Mowat, G., B. G. Slough, and R. Rivard. 1994. A comparison of three live capturing devices for lynx: capture efficiency and injuries. Wildlife Society Bulletin 22:644-650.
Murdoch, W. W. 1969. Switching in generalist predators: experiments on predator specificity and stability of prey populations. Ecological Monographs 39:335-354.
Murdoch, W. W., and A. Oaten. 1975. Predation and popu- lation stability. Advances in Ecological Research 9:1-131.
Murray, D. L., and S. Boutin. 1991. The influence of snow on lynx and coyote movements: does morphology affect behavior? Oecologia (Berlin) 88:463-469.
Murray, D. L., S. Boutin, and M. O'Donoghue. 1994. Winter habitat selection by lynx and coyotes in relation to snow- shoe hare abundance. Canadian Journal of Zoology 72: 1444-1451.
Murray, D. L., S. Boutin, M. O'Donoghue, and V. 0. Nams. 1995. Hunting behaviour of a sympatric felid and canid in relation to vegetative cover. Animal Behaviour 50:1203- 1210.
Nellis, C. H., and L. B. Keith. 1976. Population dynamics of coyotes in central Alberta, 1964-68. Journal of Wildlife Management 40:389-399.
Nellis, C. H., S. P. Wetmore, and L. B. Keith. 1972. Lynx- prey interactions in central Alberta. Journal of Wildlife Management 36:320-329.
Nunney, L. 1980. The influence of the Type 3 (sigmoid) functional response upon the stability of predator-prey dif- ference models. Theoretical Population Biology 18:257- 278.
O'Donoghue, M., S. Boutin, C. J. Krebs, and E. J. Hofer. 1997. Numerical responses of coyotes and lynx to the snowshoe hare cycle. Oikos 80:150-162.
O'Donoghue, M., S. Boutin, C. J. Krebs, D. L. Murray, and E. J. Hofer. 1998. Behavioural responses of coyotes and lynx to the snowshoe hare cycle. Oikos, in press.
O'Gara, B. W. 1986. Reliability of scat analysis for deter- mining coyote feeding on large mammals. Murrelet 67:79- 81.
Ozoga, J. J., and E. M. Harger. 1966. Winter activities and feeding habits of northern Michigan coyotes. Journal of Wildlife Management 30:809-818.
Parker, G. R. 1981. Winter habitat use and hunting activities of lynx (Lynx canadensis) on Cape Breton Island, Nova Scotia. Pages 221-248 in J. A. Chapman and D. Pursley, editors. Worldwide Furbearer Conference Proceedings, Aug. 3-11, 1980. Frostburg, Maryland, USA.
Parker, G. R., J. W. Maxwell, L. D. Morton, and G. E. J. Smith. 1983. The ecology of the lynx (Lynx canadensis) on Cape Breton Island. Canadian Journal of Zoology 61: 770-786.
Pech, R. P., A. R. E. Sinclair, A. E. Newsome, and P. C. Catling. 1992. Limits to predator regulation of rabbits in Australia: evidence from predator-removal experiments. Oecologia 89:102-112.
Poole, K. G., G. Mowat, and B. G. Slough. 1993. Chemical immobilization of lynx. Wildlife Society Bulletin. 21:136- 140.
Royama, T. 1970. Factors governing the hunting behaviour and selection of food by the great tit (Parus major L.). Journal of Animal Ecology 39:619-668.
1992. Analytical population dynamics. Chapman and Hall, London, UK.

1208 MARK O'DONOGHUE ET AL. Ecology, Vol. 79, No. 4
Saunders, J. K. 1963. Food habits of lynx in Newfoundland. Journal of Wildlife Management 27:384-390.
Schaller, G. B. 1972. The Serengeti lion. University of Chi- cago Press, Chicago, Illinois, USA.
Shettleworth, S J., P. J. Reid, and C. M. S. Plowright. 1993. The psychology of diet selection. Pages 56-77 in R. N. Hughes, editor. Diet selection. Blackwell Scientific Pub- lications, London, UK.
Sinclair, A. R. E., and R. P. Pech. 1996. Density dependence, stochasticity, compensation and predator regulation. Oikos 75:164-173.
Smith, J. N. M. 1974. The food searching behaviour of two European thrushes. II. The adaptiveness of search patterns. Behaviour 59:1-59.
Solomon, M. E. 1949. The natural control of animal popu- lations. Journal of Animal Ecology 18:1-35.
Staples, W. R. 1995. Lynx and coyote diet and habitat re- lationships during a low hare population on the Kenai Pen- insula, Alaska. Thesis. University of Alaska, Fairbanks, Alaska, USA.
Stenseth, N. C. 1995. Snowshoe hare populations: squeezed from below and above. Science 269:1061-1062.
Taylor, R. J. 1984. Predation. Chapman and Hall, London, UK.
Theberge, J. B., and C. H. R. Wedeles. 1989. Prey selection and habitat partitioning in sympatric coyote and red fox populations, southwest Yukon. Canadian Journal of Zool- ogy 67:1285-1290.
Todd, A. W., and L. B. Keith. 1983. Coyote demography
during a snowshoe hare decline in Alberta. Journal of Wild- life Management 47:394-404.
Todd, A. W., L. B. Keith, and C. A. Fischer. 1981. Population ecology of coyotes during a fluctuation of snowshoe hares. Journal of Wildlife Management 45:629-640.
Trexler, J. C., C. E. McCulloch, and J. Travis. 1988. How can the functional response best be determined? Oecologia (Berlin) 76:206-214.
Vander Wall, S. B. 1990. Food hoarding in animals. Uni- versity of Chicago Press, Chicago, Illinois, USA.
Van Zyll de Jong, C. G. 1966. Food habits of the lynx in Alberta and the Mackenzie District, N.W.T. Canadian Field- Naturalist 80:18-23.
Ward, R. M. P., and C. J. Krebs. 1985. Behavioural responses of lynx to declining snowshoe hare abundance. Canadian Journal of Zoology 63:2817-2824.
Wells, M. C., and M. Bekoff. 1982. Predation by wild coy- otes: behavioral and ecological analyses. Journal of Mam- malogy 63:118-127.
White, G. C., K. P. Burnham, and D. L. Otis. 1982. Capture- recapture and removal methods for sampling closed pop- ulations. Los Alamos National Laboratory, Los Alamos, New Mexico, USA.
Wilkinson, L. 1990. SYSTAT: the system for statistics. SYS- TAT, Evanston, Illinois, USA.
Wood, C. C., and C. M. Hand. 1985. Food-searching be- haviour of the common merganser (Mergus merganser) I: Functional responses to prey and predator density. Cana- dian Journal of Zoology 63:1260-1270.