Embed Size (px)
Citation preview

Functionalneuroimaging inchild psychiatry
Edited by
Monique ErnstBrain Imaging Center,
National Institute on Drug Abuse, Baltimore, MD, USA
and
Judith M. RumseyClinical Neuroscience Branch,
National Institute of Mental Health, Rockville, MD, USA
With a Foreword by
Joseph T. CoyleChairman, Department of Psychiatry, Harvard Medical School, Boston, MA, USA
The Pitt Building, Trumpington Street, Cambridge, United Kingdom
The Edinburgh Building, Cambridge CB2 2RU, UK
40 West 20th Street, New York, NY 10011-4211, USA
10 Stamford Road, Oakleigh, VIC 3166, Australia
Ruiz de Alarcón 13, 28014 Madrid, Spain
Dock House, The Waterfront, Cape Town 8001, South Africa
http://www.cambridge.org
© Cambridge University Press 2000
This book is in copyright. Subject to statutory exception
and to the provisions of relevant collective licensing agreements,
no reproduction of any part may take place without
the written permission of Cambridge University Press.
First published 2000
Printed in the United Kingdom at the University Press, Cambridge
Typeface Utopia 8.5/12 pt. System QuarkXPress® []
A catalogue record for this book is available from the British Library
Library of Congress Cataloguing in Publication data
Functional neuroimaging in child psychiatry / edited by Monique Ernst and Judith M. Rumsey
p. ; cm.
Includes index.
ISBN 0 521 65044 5 (hb)
1. Pediatric neuropsychiatry. 2. Brain–Imaging. 3. Developmental neurophysiology.
I. Ernst, Monique, 1953– . II. Rumsey, Judith M.
[DNLM: 1. Mental Disorders – diagnosis – Child. 2. Brain Diseases – diagnosis – Child.
3. Diagnostic Imaging – Child. WS 350 F979 2000]
RJ486.5.F865 2000
618.929890754–dc 21 99–04455
ISBN 0 521 65044 5 hardback
Every effort has been made in preparing this book to provide accurate and up-to-date information
which is in accord with accepted standards and practice at the time of publication. Nevertheless,
the authors, editors and publisher can make no warranties that the information contained herein
is totally free from error, not least because clinical standards are constantly changing through
research and regulation. The authors, editors and publisher therefore disclaim all liability for direct
or consequential damages resulting from the use of material contained in this book. Readers are
strongly advised to pay careful attention to information provided by the manufacturer of any drugs
or equipment that they plan to use.
The views stated herein do not necessarily represent the official views of the National Institute
on Drug Abuse, the National Institute of Mental Health, the National Institutes of Health nor the
Department of Health and Human Services, nor any other agency of the United States
government.

Contents
List of contributors page viiPreface xiForeword xiii
Joseph T. Coyle
Part 1 Techniques of functional imaging
1 Functional brain imaging with PET and SPECT 3Peter Herscovitch and Monique Ernst
2 Modeling of receptor images in PET and SPECT 27Evan D. Morris, Raymond F. Muzic Jr,Bradley C. Christian, Christopher J. Endres andRonald E. Fisher
3 Functional magnetic resonance imaging 45Guinevere F. Eden and Thomas A. Zeffiro
4 MRS in childhood psychiatric disorders 59Deborah A. Yurgelun-Todd and Perry F. Renshaw
5 Magnetoencephalography 77Donald C. Rojas, Peter D. Teale and Martin L. Reite
Part 2 Ethical foundations
6 Ethical issues in neuroimaging research with 99childrenL. Eugene Arnold, Alan J. Zametkin, Lauren Caravella and Nicole Korbly
Part 3 Normal development
7 Brain development and evolution 113Manuel F. Casanova, Daniel Buxhoeveden and Gurkirpal S. Sohal
v

8 Cognitive development from a 137neuropsychologic perspectiveDaisy M. Pascualvaca and Gloria Morote
9 Cognitive and behavioral probes of 155developmental landmarks for use in functionalneuroimagingB. J. Casey, Kathleen M. Thomas, Tomihisa F. Welsh,Rona Livnat and Clayton H. Eccard
Part 4 Psychiatric disorders
10 Autism 171Diane C. Chugani
11 Functional imaging in childhood-onset 189schizophreniaLeslie K. Jacobsen and Alessandro Bertolino
12 Pediatric mood disorders and neuroimaging 205Robert A. Kowatch, Pablo A. Davanzo andGraham J. Emslie
13 Neuroimaging of childhood-onset anxiety 224disordersDavid R. Rosenberg, Lori Anne D. Paulson,Frank P. MacMaster and Gregory J. Moore
14 Tourette’s syndrome: what are we really imaging? 242Bradley S. Peterson and Prakash Thomas
15 Dyslexia: conceptual issues and psychiatric 266comorbidityFrank B. Wood and D. Lynn Flowers
16 Attention-deficit hyperactivity disorder: 278neuroimaging and behavioral/cognitive probesJulie B. Schweitzer, Carl Anderson and Monique Ernst
17 Eating disorders 298Uttom Chowdhury, Isky Gordon and Bryan Lask
Part 5 Future directions
18 Techniques of molecular genetics 315David J. Vandenbergh
19 Issues in the genetic study of complex 328neurobehavioral conditionsDavid L. Pauls
20 The duplicity of plasticity: a conceptual 335approach to the study of early lesions anddevelopmental disordersRalph-Axel Müller and Eric Courchesne
21 Utility of CANTAB in functional 366neuroimagingAndy C. H. Lee, Adrian M. Owen,Robert D. Rogers, Barbara J. Sahakian andTrevor W. Robbins
22 Neurodevelopmental assessment of cognitive 379function using CANTAB: validation and future goalsMonica Luciana and Charles A. Nelson
23 Functional neuroimaging in child psychiatry: 398future directionsMonique Ernst and Judith M. Rumsey
Glossary 408Index 418
Colour plates between pp. 82 and pp. 83 and betweenpp. 242 and pp. 243
vi Contents

Introduction
Functional brain imaging refers to the use of techniques toobtain images of the brain that are related to its physiologyor biochemistry, rather than its structural anatomy. Twonuclear medicine-based approaches to functional brainimaging can be used to study the pediatric population,positron emission tomography (PET) and single-photonemission computed tomography (SPECT). Both will bereviewed in this chapter.
PET is a nuclear medicine technique for performingphysiologic measurements in vivo. The PET scanner pro-vides tomographic images of the distribution of positron-emitting radiopharmaceuticals in the body. From theseimages, measurements such as regional cerebral blood flow(rCBF) and glucose metabolism can be obtained. PET hasbeen widely used as a research tool to study normal brainfunction and the pathophysiology of neurologic and psychi-atric disease in adults (Grafton and Mazziotta, 1992; Volkowand Fowler, 1992). Its role in the management of patientswith brain disorders is at an earlier stage (Powers et al., 1991)and its use in children has been limited. Conceptually, PETconsists of three components: (i) tracer compounds labeledwith radioactive atoms that emit positrons; (ii) scanners thatprovide tomographic images of the concentration ofpositron-emitting radioactivity in the body; and (iii)mathematical models that describe the in vivo behavior ofradiotracers and allow the physiologic process under studyto be quantified from the images. The first tomographs forquantitative PET imaging were developed in the mid-1970s(Ter-Pogossian, 1992). Subsequently, instrument design hasbecome more sophisticated, with improved spatial resolu-tion and sensitivity. Radiotracer techniques have beendeveloped to study regional CBF and blood volume; glucose,oxygen, and protein metabolism; blood–brain barrierpermeability; numerous neuroreceptor–neurotransmitter
systems; tissue pH; and the concentration of radiolabeleddrugs in brain.
SPECT is another nuclear medicine technique that pro-vides tomographic images of radioactivity (George et al.,1991; Wyper, 1993; Green, 1996). SPECT is simpler than PETbecause it uses radiopharmaceuticals labeled with conven-tional radionuclides such as technetium-99m (99mTc);however, it still has the same three components: radiotrac-ers, scanners, and mathematical models. Its quantitativeaccuracy is less than that of PET and the range of radio-pharmaceuticals for studying the brain is relatively limited;it has primarily been used to map cerebral perfusion.Improvements in instrumentation and radiopharmaceuti-cals are being actively pursued, especially in the develop-ment of radiotracers labeled with iodine-123 (123I) to imageneuroreceptors (Holman and Devous, 1992; Juni, 1994),and there is a strong interest in clinical SPECT brain studies.
This chapter will provide an overview of PET instru-mentation, radiotracers, and mathematical modeling,emphasizing methods to measure cerebral hemodynamicsand metabolism, and the most common applications. Inaddition, SPECT instrumentation and radiopharmaceuti-cals are described. The analysis and interpretation of func-tional brain images and special considerations for thepediatric age group are discussed. Methods for studyingneurotransmitter systems are treated elsewhere in thisvolume (Chapter 2). An abbreviated lexicon of various termsused in nuclear medicine is provided in the glossary (p. 408).
Positron emission tomography
Imaging
PET provides tomographic images of the distribution ofpositron-emitting radioactivity using rings of radiation
3
1
Functional brain imaging withPET and SPECT
Peter Herscovitch and Monique Ernst

detectors that are arrayed around the body (or head).Because of the special nature of the positron and the tech-niques used for image reconstruction, it is possible toobtain absolute radioactivity measurements from theseimages (Daube-Witherspoon and Herscovitch, 1996).
Formation of the PET imageCertain radioactive atoms, such as oxygen-15 (15O) orfluorine-18 (18F), decay by the emission of a positron fromthe nucleus. Positrons are the “antimatter” particles to elec-trons; they have the same mass as electrons but are posi-tively charged. After emission from the nucleus, positronstravel a variable distance in tissue, up to a few millimeters,losing kinetic energy. When almost at rest, they interactwith atomic electrons, resulting in the “annihilation” ofboth particles. Their combined mass is converted into twohigh-energy (511 keV each) photons that travel in oppositedirections from the annihilation site at the speed of light.Detection of these photon pairs is used to measure both thelocation and the amount of radioactivity in the field of viewof the scanner. The two annihilation photons are detectedby two opposing radiation detectors connected by an elec-tronic coincidence circuit (Fig. 1.1). This circuit records adecay event only when both detectors sense the almostsimultaneous arrival of both photons (the time window forcoincidence detection is typically 5–20ns). The site of thedecay event is, therefore, localized to the volume of spacebetween the two detectors, although there is no informa-tion about the depth or location of the radioactive sourcewithin the volume between the two detectors.
In practice, several rings, each consisting of many radia-tion detectors, are used. Opposing detector pairs in each
ring are connected by coincidence circuits. With eachdecay event, the two resulting annihilation photons aredetected as a coincidence line; as a result, the number ofcoincidence lines sensed by any detector pair is propor-tional to the amount of radioactivity between them. Acomputer records the coincidence events from each ring.Tomographic images of the underlying distribution ofradioactivity are then reconstructed with the samemathematical technique, referred to as filtered back-pro-jection, that is used in conventional X-ray computedtomography (CT) (Hoffman and Phelps, 1986). In additionto filtered back-projection, there are other approaches toimage reconstruction. These require considerably morecomputational time and are used much less frequently.
The intensity of each point or pixel in the reconstructedPET image is proportional to the concentration of radio-activity at the corresponding location in the brain. For thecalibration of the scanner to obtain absolute radioactivitymeasurements, a cylinder filled with a uniform solution ofradioactivity is imaged. The radioactivity concentration ofthe solution is then measured with a calibrated wellcounter, and the scanner calibration factor is calculated toconvert PET image counts (in units of cts/s per pixel) tounits of radioactivity concentration (e.g., nCi/ml).
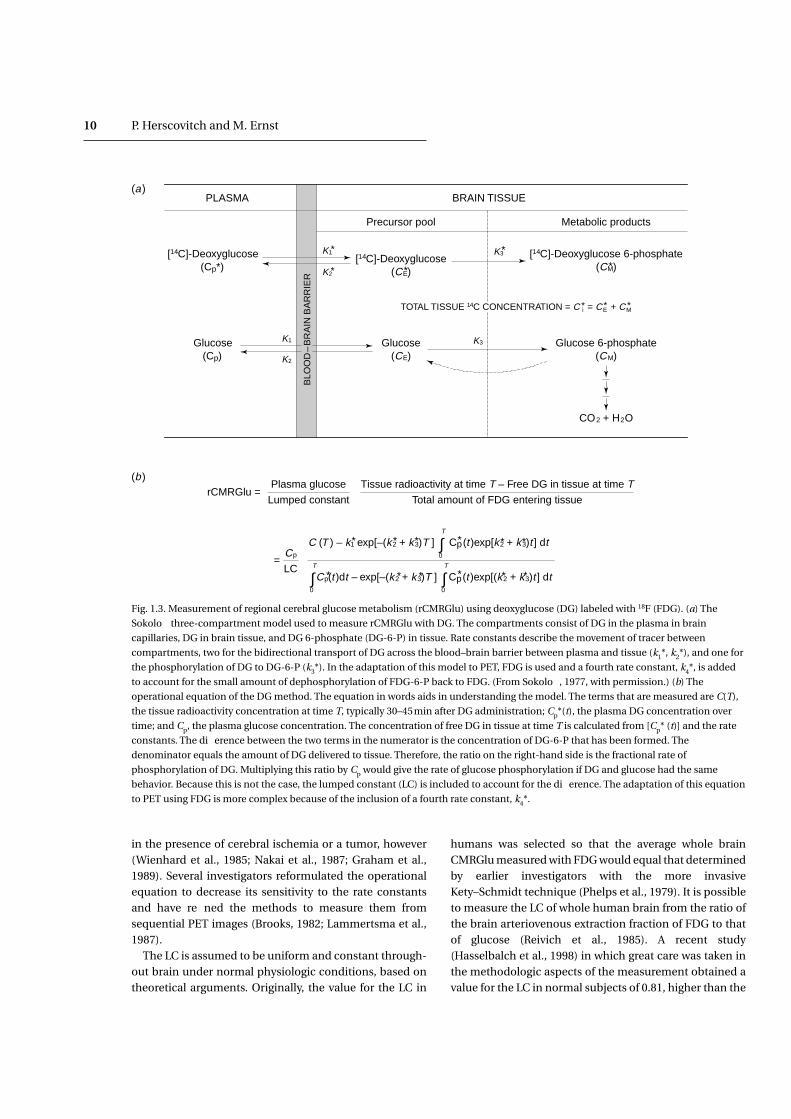
Limitations in image quality and quantificationA variety of physical effects, such as attenuation, deadtimelosses, scatter, and random coincidences, affect the PETimage and are corrected for as part of the imagereconstruction process. Other factors such as image noiseand spatial resolution also affect image quality and areimportant considerations in the design and interpretationof PET studies (Hoffman and Phelps, 1986; Karp et al., 1991;Daube-Witherspoon and Herscovitch, 1996).
Attenuation correctionA key step in image reconstruction is correction for theabsorption or attenuation of annihilation photons thatoccurs through their interactions with tissue (Bailey, 1998).This substantially decreases the number of coincidencecounts detected. Although the amount of attenuation canbe estimated using an assumed value for the attenuatingproperties of tissue, actual measurements are more accu-rate. Before the administration of the radiotracer, a separate“transmission scan” is performed with a source of positron-emitting radioactivity positioned between the subject’shead and the detector rings. The outside source, filled withgermanium-68/gallium-68 (68Ge/68Ga) radioactivity, is aring or a rod that is rotated around the body. A similarmeasurement is made with nothing in the scanner field ofview. The ratio of the two measurements gives the amount
4 P. Herscovitch and M. Ernst
Detector
Coincidencecircuit
Site ofannihilation
Annihilation photon pathway
Volume in which annihilation eventsare detected
Detector
Fig. 1.1. The two high-energy photons resulting from a positron
emission and annihilation are detected by two radiation
detectors that are connected by an electronic coincidence circuit.
A decay event is recorded as a coincidence line between the
detectors only when both photons are detected almost
simultaneously. A very short time window for photon arrival,
typically 5–20ns, called the coincidence resolving time, is allowed
for registration of a coincidence event. This coincidence
requirement localizes the site of the annihilation to the volume of
space between the detectors.
of attenuation between each detector pair and is used in theimage reconstruction process to correct for attenuation.
To respond to the demands of some protocols in whichthere is a long delay between radiotracer administrationand subsequent emission scanning, techniques have beendevised to calculate the attenuation correction using atransmission scan obtained after radiotracer administra-tion, that is, with positron-emitting radioactivity still in thebody (Carson et al., 1988). This approach is particularlyuseful when using (18F)-labeled deoxyglucose (FDG) tomeasure regional cerebral glucose metabolism (rCMRGlu;see below).
Image noiseThe PET image has inherent statistical noise because of therandom nature of radioactive decay. The disintegration rateof a radioactive sample undergoes moment-to-momentvariation. The resultant uncertainty in measuring theamount of radioactivity decreases as the number of countsrecorded increases. Similarly, the statistical reliability of aPET measurement depends on the number of counts. Thesituation is more complex, however, because the value ofradioactivity in any small brain region is obtained from animage reconstructed from multiple views or projections ofthe radioactivity distribution throughout the entire brainslice. Therefore, the noise in any individual brain region isaffected by noise in other brain regions and tends to begreater (Budinger et al., 1978). Excessive noise gives the PETimage a grainy, “salt and pepper” appearance anddecreases the ability to quantitate radioactivity accurately.
Image noise depends upon the number of counts col-lected, which in turn depends upon scanner sensitivity, theduration of the scan, and the concentration of radioactivityin the field of view. Scanner sensitivity (measured in unitsof (counts/s)/(mCi/ml)), is determined by its design fea-tures, such as the nature and arrangement of the radiationdetectors. For example, the sensitivity is inversely propor-tional to the diameter of the detector rings. Althoughincreasing scan duration increases counts, this is fre-quently not possible, either because of the short half-life ofthe radiotracer or because it would not be compatible withthe tracer-kinetic mathematical model that is used.Administering more radioactivity increases counts, but thisapproach is limited by radiation safety considerations andalso by the inability of tomographs to operate accurately athigh count rates, that is by count rate performance.
Deadtime losses and random coincidencesCount rate performance refers to the level of radioactivitythat can be accurately measured with a PET scanner. It islimited by deadtime loss and by random coincidences.
Deadtime loss is the decreasing ability of a scanner toregister counts as the count rate increases because of thetime required by the physical processes involved in han-dling each count. Deadtime loss originates from limita-tions of the electronic circuitry used to processinformation from the detectors and from the recovery timeof the detectors themselves. Deadtime causes a reductionin measured coincidences as radioactivity increases in thefield of view of the scanner. This reduction can be pre-dicted for a given count rate and a correction factor can beapplied. This correction, no matter how accurate, does notcompensate for the loss in statistical accuracy of the imagethat occurs because fewer counts were actually collected.
Random coincidences also limit count rate per-formance. These occur when two photons from twodifferent positron annihilations are sensed by a detectorpair within the coincidence resolving time; as a result, afalse or random coincidence count is collected. The frac-tion of total coincidences recorded that are randomincreases linearly with radioactivity. Random coincidencesadd noisy background to the image. Although correctionscan be made that subtract an estimate of these falsecounts, the contribution to the image noise persists(Hoffman et al., 1981). Therefore, for any given tomograph,the amount of radioactivity administered must be carefullyselected to balance the competing effects of improvedcounting statistics with the “diminishing returns” resultingfrom deadtime and random coincidences.
ScatterAnother source of background noise in the PET image isscatter. Scatter occurs when an annihilation photon travel-ing in tissue is deflected in a collision with an electron andits direction changes. This results in incorrect positioningof the coincidence line. Not only is information lost fromthe affected coincidence line but also a noisy backgroundlevel is added to the image. This leads to an overestimationof radioactivity, especially in areas containing relativelyless radioactivity, e.g., regions with low blood flow ormetabolism. The amount of scatter in an image is a func-tion of the distribution of radioactivity, the anatomy of thetissue scattering the photons, and the design of thescanner. It is necessary to correct for scatter because it cancontribute up to 20% of the counts in an image. Methodshave been developed to correct for scatter that vary in theircomplexity and effectiveness (Bergstrom et al., 1983;Hoffman and Phelps, 1986).
Spatial resolutionA critical issue in interpreting PET (and SPECT) images isthe concept of image resolution. Image resolution is the
Functional brain imaging with PET/SPECT 5

minimum distance by which two points of radioactivitymust be separated to be perceived independently in thereconstructed image. Limited resolution, which is visuallyapparent as blurring of the image, has a major effect on theability to quantify radioactivity accurately, especially insmall structures (see below).
In PET, image resolution depends upon the accuratelocalization of positron-emitting nuclei. This is limited bythe physics of positron annihilation and by detectordesign. Annihilation photons are produced only after thepositron has traveled up to several millimeters from thenucleus. This limits the accuracy of localizing the nucleus.The distance the positron travels (positron range) variesand depends on the specific radionuclide and tissuedensity; it averages 1.2mm for 18F, 2.1mm for 11C. In addi-tion, the angle between the two annihilation photons devi-ates slightly from 180°, causing a slight misplacement ofthe coincidence line (noncolinearity of the annihilationphotons). These effects result in a 1–3mm resolution loss(Phelps and Hoffman, 1976) and are larger when the detec-tors are farther apart, as in a body scanner compared witha head scanner. Detector size and shape determine howaccurately the position of each coincidence line isrecorded; smaller detectors provide better resolution.
Resolution is measured by imaging a thin line source ofpositron-emitting radioactivity (Fig. 1.2). Because oflimited resolution, the radioactivity in the source appearsblurred or spread out over a large area; resolution isdefined by the amount of spreading. The resolution ofcurrent scanners is about 4–5mm in the image plane (deGrado et al., 1994; Wienhard et al., 1994).
PET InstrumentationA PET system consists of many components (Hoffman andPhelps, 1986; Council on Scientific Affairs, 1988; Koeppeand Hutchins, 1992). Several rings of radiation detectorsare mounted in a gantry. Each detector consists of a smallscintillation crystal that gives off light when the energy ofan annihilation photon is deposited in it. The detector iscoupled to a photomultiplier tube that converts the lightpulse to an electrical signal which is fed into the coin-cidence circuitry. Scanners have numerous rings, eachcontaining up to several hundred detectors (de Grado etal., 1994; Wienhard et al., 1994), with a tomographic sliceprovided by each ring. In addition, “cross-slices” halfwaybetween the detector rings are derived from coincidencesbetween detectors in adjacent rings. Therefore, 47 contigu-ous slices can be obtained simultaneously by a 24-ringsystem. To date, the most sophisticated scanners have 32rings, which permit the acquisition of 63 slices. A dedicatedcomputer is used to control the scanning process, collect
the coincidence count information, and reconstruct anddisplay the images.
During the scan, the subject lies on a special table that isfitted with a head holder to restrain head movement. Thegantry has low-powered lasers that project lines onto thesubject’s head and aid in positioning. Some gantries can betilted from the vertical to obtain slices in specific planes,for example parallel to the canthomeatal line.
A relatively recent, major advance in scanner designpermits coincidence counts to be collected by opposingdetectors that do not have to be in the same or adjacentrings (Spinks et al., 1992; de Grado et al., 1994; Bailey et al.,1998). Because more coincidence lines are collected bythis three-dimensional (3D) imaging approach, scannersensitivity is substantially increased. This improves imagequality or, alternatively, permits the same number of imagecounts to be obtained with less administered radioactivity.These factors are a great benefit in pediatric imaging, inwhich radiation exposure is a particular consideration. Thedisadvantages of 3D acquisition are an increase in theamount of scatter and contribution from radioactivityoutside the field of view (i.e., from other parts of the body)to the counts seen by the detector rings. This can be more ofa problem when scanning small pediatric subjects becausethe rest of the body is closer to the gantry than it is in adults.
Positron-emitting radiotracers
The second requirement for PET is a radiotracer of physio-logic interest that is labeled with a positron-emitting radio-nuclide. A radiotracer can be a naturally occurringcompound in which one of the atoms is replaced with itsradioactive counterpart or it can be a labeled analog whichbehaves in vivo similarly to the natural substance. It canalso be a synthetic substance, such as a radiolabeled drug,that interacts with a specific biologic system.
The positron-emitting nuclides most commonly usedto label PET radiotracers are 15O, 13N, 11C, and 18F withhalf-lives of 2.05, 10.0, 20.3, and 109.8min, respectively.(The half-life is the time required for radioactivity todecay to one-half of its original value.) The chemicalnature of 15O, 13N, and 11C is identical to that of their non-radioactive counterparts, which are basic constituents ofliving matter as well as of most drugs. Consequently, theycan be incorporated into radiotracers with the same invivo behavior as the corresponding nonradioactive com-pound. Fluorine-18 is used to substitute for hydrogen orhydroxyl groups to synthesize analogs with character-istics similar to those of the unsubstituted compound.Drugs that would normally contain fluorine can be syn-thesized as their 18F-labeled counterparts. Relatively large
6 P. Herscovitch and M. Ernst

Functional brain imaging with PET/SPECT 7
Fig. 1.2. Definition and measurement of the resolution of a PET scanner. Thin line sources of positron-emitting radioactivity
perpendicular to the image plane are scanned (upper panel). Because of resolution limitations, the radioactivity in each source appears
blurred or spread over a larger area (middle panel). Scanner resolution is defined by the amount of spreading that occurs. A plot of the
image intensity along a line through the center of the images (lower panel) shows that this spreading approximates a bell-shaped or
Gaussian curve. The width of this curve at one-half of its maximum height (termed the full width at half maximum, FWHM) is the
measure of resolution. Here the resolution is 1.2cm. Another interpretation of the FWHM is that it is the minimum distance by which
two points of radioactivity must be separated to be independently perceived in the reconstructed image. (From Ter-Pogossian et al. 1975,
with permission.)

amounts of these radionuclides with short half-lives canbe administered to provide good-quality images withacceptable radiation exposure because of their rapiddecay. The short half-lives, especially of 15O, permit repeatstudies in the same subject in one experimental sessionbecause of the rapid physical decay after each adminis-tration.
The disadvantage of these short half-lives is that thesynthesis of PET radiotracers is demanding. On-site pro-duction of radionuclides by means of a cyclotron isrequired (Wolf and Schlyer, 1993), and rapid techniquesmust be devised for radiotracer synthesis and qualitycontrol. These must yield products that are pure, sterile,and nontoxic. The tracer must have the appropriate prop-erties to permit the desired physiologic measurement tobe made (Kilbourn, 1991; Dannals et al., 1993). Importantfactors include its permeability across the blood–brain
barrier, the formation and fate of any radioactive metabo-lites, the ability to develop a mathematical model todescribe the behavior of the tracer, and, for neuroreceptorligands, the binding characteristics. Preclinical studiesare typically performed, using tissue sampling or auto-radiography in small animals and PET studies in largeones. The recent development of PET scanners designedto image small animals (e.g., rat), should facilitate the pre-clinical assessment of new PET tracers (Cherry et al.,1998). A wide variety of positron-emitting radio-pharmaceuticals has been synthesized (Table 1.1) (Fowlerand Wolf, 1991).
Radiotracer modeling
A mathematical model is required to calculate the value ofthe physiologic variable of interest from measurements of
8 P. Herscovitch and M. Ernst
Table 1.1. Representative PET radiotracers
Physiologic process or system Radiotracer
Cerebral blood flow H215O
[15O]-Butanol; [11C]-butanol, [18F]-fluoromethane
Cerebral blood volume C15O; 11CO
Cerebral energy metabolism
Oxygen metabolism 15O2
Glucose metabolism [18F]-Fluorodeoxyglucose; [11C]-deoxyglucose, [11C]-glucose
Glucose transport [11C]-3-O-Methylglucose
Neuroreceptor systems
Dopaminergic
Presynaptic dopamine pool [18F]-Fluoro-L-dopa; [18F]-fluoro-L-m-tyrosine
Dopamine D2 receptors [11C]-N-Methylspiperone; [11C]-raclopride; [18F]-spiperone; [18F]-N-methylspiperone
Dopamine D1 receptors [11C]-SCH23390
Dopamine reuptake sites [11C]-Nomifensine; [11C]-cocaine; [18F]-labeled 1-[2-(diphenylmethoxy)ethyl]-4-
(3-phenyl-2-propenyl)piperazine ([18F]-GBR)
Opiate [11C]-Carfentanil; [11C]-diprenorphine, [18F]-cyclofoxy
Benzodiazepine [11C]-Flumazenil
Serotonergic (5-HT)
Presynaptic serotonin pool [11C]-a-Methyltryptophan
5-HT1A receptors [11C]-WAY100,635
5-HT2A receptors [11C]-MDL100,907; [18F]-altanserin; [18F]-setoperone
5-HT reuptake sites [11C]-McN5652
Monoamine oxidase B [11C]-Deprenyl
Amino acid transport, protein synthesis [11C]-Methionine; [11C]-leucine; [11C]-tyrosine
Tissue pH 11CO2; [11C]-Dimethadione
Tissue drug kinetics [11C]-Phenytoin; [11C]-valproate; [13N]-carmustine (BCNU)
Note: This is a partial listing of radiotracers that have been used to study physiologic processes or systems in the brain with PET. The
most commonly used radiotracer methods are those to measure regional cerebral blood flow and metabolism.

radiotracer concentration in brain and blood. The modeldescribes the in vivo behavior of the radiotracer, that is therelationship over time between the amount of tracer deliv-ered to a brain region in its arterial input and the amountof tracer in the region. The use of models allows PET to bea quantitative physiological technique rather than only animaging modality (Huang and Phelps, 1986; Carson, 1991,1996). Compartmental models are typically used. It isassumed that there are entities called compartments thathave uniform biologic properties and in which the tracerconcentration is uniform at any instant in time. Thecompartments can be physical spaces such as theextravascular space, or biochemical entities such as neu-roreceptor-binding sites. The model is described by one ormore equations, that contain measurable terms (i.e., thebrain and blood radiotracer concentrations over time) andunknowns such as blood flow or receptor concentrationthat are of interest.
Several factors must be considered in developing amodel. These include tracer transport across theblood–brain barrier, the behavior of the tracer in brain, thepresence of labeled metabolites in blood, the potential foralterations in tracer behavior if there is pathology, and theability to solve the model accurately for the unknownparameters. Error analysis and model validation areimportant. Error analysis consists of mathematical simula-tions to determine the sensitivity of the model to potentialsources of measurement error. Validation experiments areusually performed to demonstrate that the method pro-vides reproducible, accurate, and biologically meaningfulmeasurements.
This chapter will describe the PET methods used tomeasure rCBF and cerebral blood volume (rCBV) andglucose and oxygen metabolism. Measurements of CBFglucose metabolism are widely used as indices of neuronalactivity (see below). In addition, SPECT tracer methods forassessing cerebral perfusion will be discussed.
PET radiotracer techniques
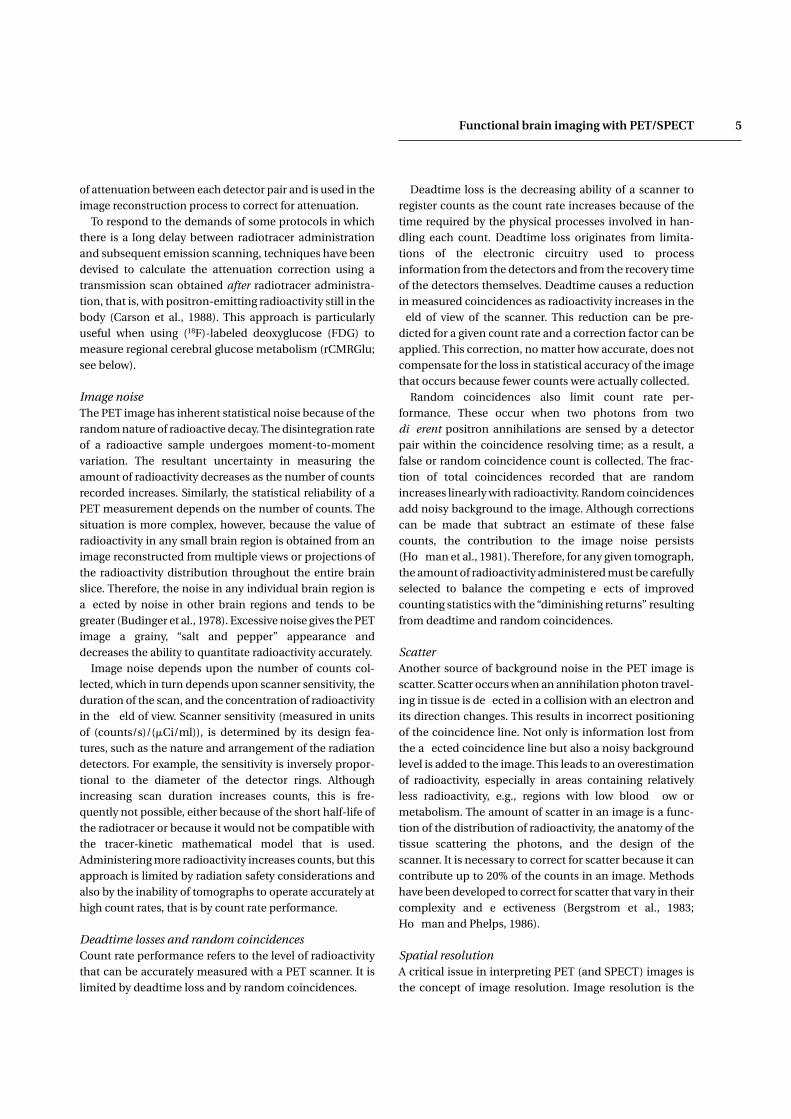
Cerebral glucose metabolismThe measurement of rCMRGlu utilizes FDG. The approachis based on the technique used to measure rCMRGlu in lab-oratory animals with [14C]-deoxyglucose and tissue auto-radiography (Sokoloff et al., 1977) and adapted for PET byusing 18F as the label (Phelps et al., 1979; Reivich et al., 1979;Huang et al., 1980). FDG is a glucose analog in which ahydroxyl group has been replaced with an 18F atom. FDG istransported across the blood–brain barrier and is phospho-rylated in tissue, as is glucose, by hexokinase to form FDG6-phosphate (FDG-6-P). Because of its anomalous struc-
ture, however, FDG-6-P cannot proceed further along theglucose metabolic pathway. Also, there is little dephos-phorylation of FDG-6-P back to FDG. As a result of this“metabolic trapping”, there is negligible loss of FDG-6-P.This facilitates the calculation of rCMRGlu from measure-ments of local tissue radioactivity. Sokoloff’s three-com-partment model applied to FDG consists of plasma FDG inbrain capillaries, free FDG in tissue, and FDG-6-P in tissue(Fig. 1.3a). Rate constants describe the movement of tracerbetween these compartments. An operational equationpermits the calculation of rCMRGlu from the tissue radio-activity concentration, the arterial plasma concentration ofFDG over time, and the plasma glucose concentration (Fig.1.3b). The equation also contains the rate constants and afactor termed the lumped constant (LC). The LC corrects forthe differences between glucose and FDG in blood–brainbarrier transport and in phosphorylation. Neither the rateconstants nor the LC can be routinely determined for eachexperimental subject or condition. It was found possible,however, to use standard values that can be determinedonce in separate groups of normal subjects.
To implement the method, images are obtained starting30–45min after intravenous injection of 5–10mCi FDG.Blood is sampled to measure the concentrations of glucoseand FDG in plasma over time. The operational equationwith standard values for the rate constants and LC is usedto generate images of rCMRGlu (Fig. 1.4). Typical normalvalues of rCMRGlu are 6–7 and 2.5–3mg/min per g tissuein gray and white matter, respectively. (Sasaki et al., 1986;Hatazawa et al., 1988; Tyler et al., 1988; Camargo et al.,1992).
Measurements of rCMRGlu with FDG reflect the state ofthe subject primarily during the first 10–20min after tracerinjection (Huang et al., 1981). This means that if a chal-lenge is used, such as cognitive, motor, or pharmacologicactivation, it must start slightly before FDG injection andcontinue for some time. If unwanted subject activityoccurs during tracer uptake, such as anxiety or fidgeting, itwill affect the results particularly if it occurs during the first10–20min.
The accuracy of using standard values for the rate con-stants and LC has been the subject of considerable discus-sion (Cunningham and Cremer, 1985; Baron et al., 1989).Their values may change in the presence of pathology, andthe use of incorrect values results in inaccurate rCMRGlucalculations (Sokoloff et al., 1977; Sokoloff, 1985). Becausethe terms in the operational equation containing rate con-stants approach zero with increasing time (see Fig. 1.3b), adelay of 30–45min between FDG injection and PETimaging is used to minimize the error associated withusing standard values. There can still be substantial error
Functional brain imaging with PET/SPECT 9
in the presence of cerebral ischemia or a tumor, however(Wienhard et al., 1985; Nakai et al., 1987; Graham et al.,1989). Several investigators reformulated the operationalequation to decrease its sensitivity to the rate constantsand have refined the methods to measure them fromsequential PET images (Brooks, 1982; Lammertsma et al.,1987).
The LC is assumed to be uniform and constant through-out brain under normal physiologic conditions, based ontheoretical arguments. Originally, the value for the LC in
humans was selected so that the average whole brainCMRGlu measured with FDG would equal that determinedby earlier investigators with the more invasiveKety–Schmidt technique (Phelps et al., 1979). It is possibleto measure the LC of whole human brain from the ratio ofthe brain arteriovenous extraction fraction of FDG to thatof glucose (Reivich et al., 1985). A recent study(Hasselbalch et al., 1998) in which great care was taken inthe methodologic aspects of the measurement obtained avalue for the LC in normal subjects of 0.81, higher than the
10 P. Herscovitch and M. Ernst
(a)PLASMA BRAIN TISSUE
[14C]-Deoxyglucose(Cp*)
BLO
OD
–B
RA
IN B
AR
RIE
R
Glucose(Cp)
Glucose(CE)
Glucose 6-phosphate(CM)
CO2 + H2O
K1*
K2
K3
K1
K2
K3
Precursor pool Metabolic products
[14C]-Deoxyglucose(CE)*
[14C]-Deoxyglucose 6-phosphate(CM)*
TOTAL TISSUE 14C CONCENTRATION = C i = CE + CM* * *
*
*
rCMRGlu = Plasma glucose
Lumped constant
Tissue radioactivity at time T – Free DG in tissue at time TTotal amount of FDG entering tissue
= Cp
LC
C (T ) – k1 exp[–(k2 + k3)T ] Cp(t )exp[k2 + k3)t ] dt∫T
0
Cp(t )dt – exp[–(k2 + k3)T ] Cp(t )exp[(k2 + k3)t ] dt∫T
0∫T
0
* * * *
* * * *
*
*
*
*
Fig. 1.3. Measurement of regional cerebral glucose metabolism (rCMRGlu) using deoxyglucose (DG) labeled with 18F (FDG). (a) The
Sokoloff three-compartment model used to measure rCMRGlu with DG. The compartments consist of DG in the plasma in brain
capillaries, DG in brain tissue, and DG 6-phosphate (DG-6-P) in tissue. Rate constants describe the movement of tracer between
compartments, two for the bidirectional transport of DG across the blood–brain barrier between plasma and tissue (k1*, k2*), and one for
the phosphorylation of DG to DG-6-P (k3*). In the adaptation of this model to PET, FDG is used and a fourth rate constant, k4*, is added
to account for the small amount of dephosphorylation of FDG-6-P back to FDG. (From Sokoloff, 1977, with permission.) (b) The
operational equation of the DG method. The equation in words aids in understanding the model. The terms that are measured are C(T),
the tissue radioactivity concentration at time T, typically 30–45min after DG administration; Cp*(t), the plasma DG concentration over
time; and Cp, the plasma glucose concentration. The concentration of free DG in tissue at time T is calculated from [Cp* (t)] and the rate
constants. The difference between the two terms in the numerator is the concentration of DG-6-P that has been formed. The
denominator equals the amount of DG delivered to tissue. Therefore, the ratio on the right-hand side is the fractional rate of
phosphorylation of DG. Multiplying this ratio by Cp would give the rate of glucose phosphorylation if DG and glucose had the same
behavior. Because this is not the case, the lumped constant (LC) is included to account for the difference. The adaptation of this equation
to PET using FDG is more complex because of the inclusion of a fourth rate constant, k4*.
(a)
(b)

values of 0.42–0.52 used in earlier work. The LC doeschange in pathologic conditions such as acute cerebralischemia, recent cerebral infarction, and brain tumor(Gjedde et al., 1985; Nakai et al., 1987; Spence et al., 1990;Greenberg et al., 1992). Since calculated rCMRGlu isinversely proportional to the LC (see Fig. 1.3), the use of anincorrect value leads to a corresponding error in thecalculation. Consequently, it is necessary to redetermineboth the LC and the rate constants to avoid such errors inpathologic conditions where there is a gross abnormalityof tissue or an imbalance between glucose supply anddemand. This is difficult and has been rarely done in PETstudies.
An alternative approach to measure rCMRGlu uses [11C]-glucose, which is transported and metabolized in the sameway as glucose (Blomqvist et al., 1990). As a result, thecompartmental model does not require a LC correctionfactor. A disadvantage is that the labeled metabolites ofglucose, such as 11CO2, are not all trapped in tissue and themodel must account for their egress. [11C]-Glucose may be
more widely used in the future, especially in pathologicconditions. For example, it has been recently used tomeasure cerebral glucose transport and metabolism inpreterm infants (Powers et al., 1998).
Cerebral blood volumeMeasurement of rCBV uses trace amounts of 11CO or C15Oadministered by inhalation (Grubb et al., 1978; Martin etal., 1987). The tracer binds to hemoglobin and is confinedto the intravascular space. Local radioactivity in brain isproportional to its red cell content; consequently, rCBVcan be calculated from the ratio of the radioactivity inbrain to that in peripheral blood. However, the hematocritis less in brain than in peripheral large vessels owing to thebehavior of blood in the brain microvasculature, and theratio of cerebral hematocrit to peripheral hematocrit (R)must be incorporated into the calculation (Grubb et al.,1978; Lammertsma et al., 1984; Martin et al., 1987).Equation (1.1), or a modification (Videen et al., 1987), isused to calculate rCBV in units of milliliters per 100g
Functional brain imaging with PET/SPECT 11
Fig. 1.4. Cerebral glucose metabolic rates. Quantitative images obtained in a normal subject with [18F]-fluorodeoxyglucose and
application of Sokoloff’s model. Anterior is up and left is to the reader’s left. These images start at the level of the superior cortical level
(upper left) and proceed down through the brain to the level of the cerebellum. Note the bar scale at the right indicating the
correspondence between glucose metabolic rates and gray levels in the image.

tissue, from the radiotracer concentrations in tissue (Ct)and blood (Cbl):
(1.1)
The use of C15O has practical advantages over 11CO (Martinet al., 1987). The 2min half-life of 15O permits other PETstudies to be performed with little delay and lowers radia-tion exposure, and the synthesis is more convenient.Normal values for rCBV are 4–6ml/100g in gray matter and2–3ml/100g in white matter (Lammertsma et al., 1983;Perlmutter et al., 1987).
In cerebrovascular disease, rCBV reflects vasodilatationin response to decreased cerebral perfusion pressure, asmay occur with a narrowed internal carotid artery (Powers,1991; Heiss and Podreka, 1993). Changes in rCBV can alsobe seen with elevated intracranial pressure (Grubb et al.,1975). In addition, rCBV data may be required as part ofother PET methods (e.g., the measurement of cerebraloxygen metabolism and extraction fraction or some neuro-receptor studies) to correct for radiotracer located in theintravascular space so as to determine the amount ofradiotracer that actually enters tissue. Measurement ofrCBV has recently been used to determine the vascularresponse to focal brain activation (Wang et al., 1998).
Cerebral blood flowMethods to measure rCBF with PET are based on a modeldeveloped by Kety to measure rCBF in laboratory animals(Kety, 1951; Landau et al., 1955). The model describes inerttracers that can diffuse freely across the blood–brainbarrier. The technique involves infusing a radioactive tracerover a brief time period T, often 1min. Frequent timedblood samples are obtained during the infusion to deter-mine the arterial time–radioactivity curve Ca(t). The animalis then killed. Regional brain radioactivity at the end of theinfusion, Ct(T), is measured by quantitative tissue auto-radiography. Tissue blood flow f (units of ml/min per 100g)is calculated from these measurements using Eq. (1.2):
Ct(T )5 f Ca(t)exp[2f/l(T2t)]dt (1.2)
Where l is the brain–blood partition coefficient for thetracer defined as the ratio between the tissue and bloodradiotracer concentrations when they are in equilibrium.Its value can be determined from independent experi-ments or can be calculated as the ratio of the solubilities ofthe tracer in brain and blood (Kety, 1951; Herscovitch andRaichle, 1985). Equation (1.2) is solved numerically forflow, using measured values for Ct(T) and Ca(t), and aspecified value for l.
ET
0
rCBV 5Ct
CblR
Kety’s method is the basis for methods to measure rCBFwith PET. Although there are different approaches, they allinvolve administering a diffusible, positron-emittingradiotracer, blood sampling to determine the time–activitycurve in arterial blood (typically from the radial artery),and the application of a modification of Eq. (1.2) to gener-ate images of rCBF from PET images of radioactivity. Thetracer most commonly used is [15O]-water (H2
15O) admin-istered by intravenous injection. Because of the short half-life of 15O, repeat measurements can be performed within10–12min.
The steady-state method was the earliest widely usedPET method to measure rCBF (Subramanyam et al., 1978;Frackowiak et al., 1980). The subject inhales C15O2 deliv-ered at a fixed rate. The action of carbonic anhydrase in redblood cells results in transfer of 15O to water and the H2
15Oconstantly generated in the lungs circulates throughoutthe body. A steady state is reached in which radioactivitydelivered to brain tissue equals that leaving by decay andby venous washout. The brain distribution of radioactivityremains constant, and a simple equation can be used tocalculate rCBF. This method was convenient with the early,single-ring tomographs, since multiple tomographic slicescould be obtained by repositioning the patient duringC15O2 inhalation. A limitation is the nonlinear relationshipbetween rCBF and tissue radioactivity, which increases thesensitivity of the CBF calculation to errors in measuredtissue and blood radioactivity (Lammertsma et al., 1981;Herscovitch and Raichle, 1983; Baron et al., 1989). Becauseof this, the long period required for CBF measurement,and the development of multislice scanners, the steady-state method has been largely supplanted.
Alternative approaches use bolus intravenous injectionsof H2
15O and an adaptation of Kety’s equation. Equation(1.2) is not used directly because scanners cannot measurethe instantaneous brain radiotracer concentration Ct(T). Ithas been modified in different ways to allow for per-formance of the scans over many seconds, summingenough counts to obtain satisfactory images. With thePET/autoradiographic approach, H2
15O is administered bybolus intravenous injection, and a 40 s scan is obtainedafter the radiotracer arrives in the head (Herscovitch et al.,1983; Raichle et al., 1983). The relationship between tissuecounts and rCBF is almost linear and errors in measure-ment of tissue radioactivity result in approximately equiv-alent errors in calculated rCBF. Because the PET imageobtained with a brief scan (1min or less) closely reflectsflow differences in different brain regions, useful informa-tion about relative CBF can be obtained without bloodsampling. This approach is widely used in functional brainmapping experiments, in which H2
15O images are used to
12 P. Herscovitch and M. Ernst

determine relative rCBF changes during neurobehavioraltasks (Frackowiak and Friston, 1994). Average values forrCBF in normal subjects obtained with either the steady-state method (Leenders et al., 1990) or the PET/autoradio-graphic method (Herscovitch et al., 1987; Perlmutter et al.,1987) are 40–60ml/min per 100g in gray matter and 20–30ml/per 100g in white matter.
There are other methods for measuring rCBF based onthe Kety model. One approach involves collecting severalsequential, brief images after bolus intravenousadministration of tracer (Koeppe et al., 1985). Parameterestimation techniques are used to estimate both rCBF andl from the scan and blood radioactivity data. To simplifyblood sampling for these H2
15O rCBF techniques, auto-mated systems have been designed to withdraw arterialblood continuously past a radiation detector (Eriksson etal., 1988).
Methods using H215O assume that it is freely diffusible
across the blood–brain barrier. However, there is a modestdiffusion limitation, which results in an underestimationof rCBF at higher flows (Raichle et al., 1983). There areother tracers without a diffusion limitation, such as [11C]-or [15O]-butanol (Herscovitch et al., 1987; Berridge et al.,1991). The diffusion limitation of H2
15O is accepted,however, because of the tracer’s convenience. Also, inconditions with decreased rCBF, tracer diffusion limitationis less important.
Cerebral oxygen metabolismThe regional cerebral metabolic rate of oxygen (rCMRO2),which is more complex to obtain than cerebral glucosemetabolism, is not widely used in research in pediatric dis-orders. It is measured using inhaled 15O2. One methoddeveloped in conjunction with the steady-state rCBF tech-nique uses continuous inhalation of 15O2 (Subramanyam etal., 1978; Frackowiak et al., 1980). Another, a companion tothe PET/autoradiographic rCBF method, uses a briefinhalation of 15O2 (Mintun et al., 1984). The principlesunderlying these methods are similar. Approximately35–40% of the oxygen delivered to the brain is extractedand metabolized (Perlmutter et al., 1987; Leenders et al.,1990). Both methods measure this oxygen extraction frac-tion (OEF). There are essentially no stores of oxygen inbrain, and all extracted oxygen is metabolized. Therefore,rCMRO2 can be determined from the product of OEF andthe rate of oxygen delivery to brain, which equals rCBFmultiplied by arterial oxygen content. The tracer modelsdescribe the fate of the 15O label following 15O2 inhalation.Extracted 15O2 is metabolized to H2
15O, which is thenwashed out of brain. The H2
15O that is produced by brain aswell as by the rest of the body recirculates to brain and
diffuses into and out of brain tissue. Another component ofthe measured radioactivity is intravascular 15O2 that is notextracted by brain. It is necessary to account for this com-ponent so that it is not attributed to radioactivity in tissue.Therefore, an independent measurement of rCBV isneeded. Both PET methods require three scans to measureregional oxygen extraction fraction (rOEF) and rCMRO2: anrCBF scan, an rCBV scan, and a scan obtained with 15O2.
With the steady-state method, scanning is performedduring continuous inhalation of 15O2 and rCBF is measuredwith continuous inhalation of C15O2 and rCBV with C15O.The rOEF is computed from these scans and frommeasurements of blood radioactivity (Lammertsma et al.,1983). An alternative method for measuring rOEF andrCMRO2 uses a brief inhalation of 15O2 (Mintun et al., 1984;Videen et al., 1987). A 40 s scan is obtained following 15O2
inhalation, and frequent arterial blood samples are col-lected for measurements of blood radioactivity. It alsoinvolves measurement of rCBF with H2
15O and thePET/autoradiographic method, and of rCBV with C15O. Themethod was validated in baboons in a series of experi-ments that included very reduced rCMRO2 (Mintun et al.,1984; Altman et al., 1991). A different approach has beendescribed to measure rCMRO2 that involves dynamic scan-ning (i.e., obtaining multiple short scans over time) follow-ing only one brief inhalation of 15O2 (Ohta et al., 1992).Average normal values for gray matter rCMRO2 are2.5–3.5 ml/min per 100g (Perlmutter et al., 1987; Leenderset al., 1990).
Single photon emission computed tomography
Principles
The radionuclides used in SPECT decay by emitting asingle photon or gamma ray from their nucleus; radioactiv-ity distribution is estimated by detection of gamma rays.The most commonly used SPECT systems have one ormore gamma camera “heads” (Devous et al., 1986; Georgeet al., 1991; Holman and Devous, 1992; Masdeu et al., 1994;Devous, 1995). The gamma camera head has a large, rela-tively thin (e.g., 3/8 in by 12–20 in (0.96cm by 30–50cm)diameter) scintillation crystal of sodium iodide, whichgives off a localized pulse of light when it absorbs a gammaray. The front of the crystal is covered with a parallel-holecollimator, which is typically made up of lead perforated byan array of small hexagonal holes. The collimator limits thegamma rays that strike the crystal to those traveling alongparallel lines perpendicular to the crystal face. An array ofphotomultiplier tubes and position logic circuits behind
Functional brain imaging with PET/SPECT 13
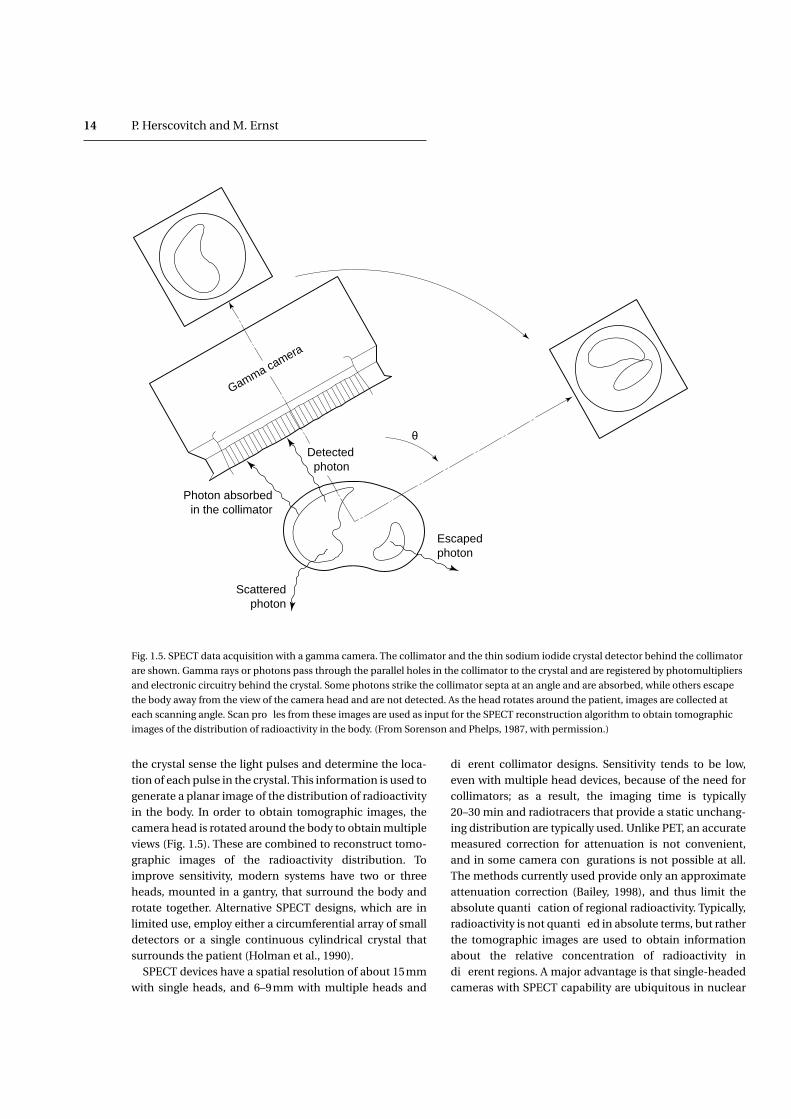
the crystal sense the light pulses and determine the loca-tion of each pulse in the crystal. This information is used togenerate a planar image of the distribution of radioactivityin the body. In order to obtain tomographic images, thecamera head is rotated around the body to obtain multipleviews (Fig. 1.5). These are combined to reconstruct tomo-graphic images of the radioactivity distribution. Toimprove sensitivity, modern systems have two or threeheads, mounted in a gantry, that surround the body androtate together. Alternative SPECT designs, which are inlimited use, employ either a circumferential array of smalldetectors or a single continuous cylindrical crystal thatsurrounds the patient (Holman et al., 1990).
SPECT devices have a spatial resolution of about 15mmwith single heads, and 6–9mm with multiple heads and
different collimator designs. Sensitivity tends to be low,even with multiple head devices, because of the need forcollimators; as a result, the imaging time is typically20–30 min and radiotracers that provide a static unchang-ing distribution are typically used. Unlike PET, an accuratemeasured correction for attenuation is not convenient,and in some camera configurations is not possible at all.The methods currently used provide only an approximateattenuation correction (Bailey, 1998), and thus limit theabsolute quantification of regional radioactivity. Typically,radioactivity is not quantified in absolute terms, but ratherthe tomographic images are used to obtain informationabout the relative concentration of radioactivity indifferent regions. A major advantage is that single-headedcameras with SPECT capability are ubiquitous in nuclear
14 P. Herscovitch and M. Ernst
Gamma camera
Photon absorbedin the collimator
Detected photon
θ
Scatteredphoton
Escapedphoton
Fig. 1.5. SPECT data acquisition with a gamma camera. The collimator and the thin sodium iodide crystal detector behind the collimator
are shown. Gamma rays or photons pass through the parallel holes in the collimator to the crystal and are registered by photomultipliers
and electronic circuitry behind the crystal. Some photons strike the collimator septa at an angle and are absorbed, while others escape
the body away from the view of the camera head and are not detected. As the head rotates around the patient, images are collected at
each scanning angle. Scan profiles from these images are used as input for the SPECT reconstruction algorithm to obtain tomographic
images of the distribution of radioactivity in the body. (From Sorenson and Phelps, 1987, with permission.)

medicine departments, and multi-headed systems havebecome more widespread. In addition, a cyclotron is notrequired to produce SPECT radiopharmaceuticals. Thecost of SPECT instruments at the end of the 1990s rangesfrom $250000 to $1000000, depending primarily upon thenumber of heads; in contrast PET scanners cost about$2500000 (and, additionally, the cyclotron needed toproduce PET radionuclides itself costs about $1500000).
Radiotracer methods
Most SPECT brain studies are performed with radio-pharmaceuticals that map CBF. Several radio-pharmaceuticals are available for this purpose (George etal., 1991; Holman and Devous, 1992; van Heertum et al.,1993). The most commonly used radiotracer strategy isbased on the microsphere method, a technique used tomeasure local flow in experimental animals (Warner et al.,1987). With that method, radioactive microspheres of a sizeappropriate to be trapped in capillaries are introduced intothe left side of the animal’s heart. They are distributed andtrapped in tissue in proportion to flow and then localradioactivity is measured in samples of tissue. SPECT useslipophilic radiotracers with microsphere-like behavior thatare administered intravenously. Ideally they are freelydiffusible across the blood–brain barrier and are com-pletely extracted and retained by brain in a distributionthat is proportional to local flow. The tracers have a stabledistribution in the brain, facilitating imaging. SeveralSPECT perfusion agents are based on this principle,although their extraction or retention by brain is not com-plete (Gemmell et al., 1992).
The first widely use SPECT CBF tracer was [123I]-iodoam-phetamine ([123I]-IMP). It must be prelabeled by the com-mercial supplier, however, which is logistically difficult.Tracers using 99mTc are preferable because 99mTc is moreconvenient to use: it is obtained from generators that aredelivered regularly to nuclear medicine departments; thuson-site labeling is possible. In addition, the physicalcharacteristics of its radioactive decay are more favorablefor SPECT imaging. A widely used 99mTc CBF agent is[99mTc]-labeled hexamethylpropylene amine oxime (alsocalled [99mTc]-exametazime, [99mTc]-HMPAO). Anothercompound, [99mTc]-labeled ethyl cysteinate dimer [99mTc]-bicisate, [99mTc]-ECD), is replacing HMPAO. ECD provideshigher brain-to-background radioactivity ratios because ofmore rapid blood clearance and is more convenient toemploy because of greater in vitro stability. Although thereare methods to calculate absolute rCBF with these tracersthat use arterial blood sampling and a tracer kinetic model(Greenberg et al., 1990; Murase et al., 1992), they are rarely
used. As a result, SPECT studies typically provide informa-tion about relative rCBF, not absolute rCBF.
SPECT studies are relatively easy to perform since thescanners are widely available and they do not require an in-house cyclotron to produce the radiotracer. The distribu-tion of radiotracer in brain reflects the blood flow duringthe first few minutes after injection of the tracer andremains relatively stable. Therefore, scanning can start upto 30min after tracer injection and it is not necessary toinject the tracer while the subject is in the scanner. RepeatSPECT studies cannot be performed rapidly because thehalf-life of 99mTc is 6h, unless methods are used to subtractresidual radioactivity. SPECT perfusion studies have beenperformed in the pediatric age group, and even in newborninfants (Borch and Greisen, 1997). It is also possible tomeasure rCBV with SPECT using [99mTc]-labeled red cells(Kuhl et al., 1980); the approach is similar to that used forPET. However, there are no SPECT radiotracers to studycerebral metabolism.
Recently, there has been considerable progress in thedevelopment of receptor-binding ligands for SPECT, espe-cially for dopamine and benzodiazepine receptors(Holman and Devous, 1992) and for dopamine reuptaketransporters (Seibyl et al., 1996) (Table 1.2). Iodine-123 istypically used to label these ligands. The techniques oftracer kinetic modeling described above are applied toanalyze image and blood radioactivity data (Laruelle et al.,1994a,b).
Data analysis
After a PET study has been completed, the relevant tracermodel is applied to calculate the physiologic variable ofinterest. For the methods to measure cerebral hemo-dynamics and metabolism described above, the model isapplied on a point-by-point basis and the intensity of theresultant image depends upon the local value of thephysiologic measurement (see Fig. 1.4). Although visualinspection of PET images may reveal abnormalities, quan-titative analysis and appropriate statistical techniques arerequired for clinical research. Data reduction, analysis, andinterpretation are very demanding. Newer scannersacquire up to 63 slices simultaneously, each containingdata from many brain structures. Several scans of the sameor different types may be obtained in one session, forexample multiple rCBF scans, or rCBF and rCMRGlu scans,and subjects may have repeat studies on different days.The analysis of PET data is greatly facilitated by interactivecomputer programs. These programs permit regions ofinterest (ROIs) of arbitrary size and shape to be placed over
Functional brain imaging with PET/SPECT 15
different structures for which the physiologic variable isthen computed. Also, whole-brain measurements can beobtained by averaging over several PET slices, or by using atemplate of ROIs to sample multiple brain regions.
PET measurements must be related to the underlyinganatomy. Early approaches to data analysis used PETimages obtained in standard planes, for example parallel tothe canthomeatal line. The images were visually comparedto corresponding anatomic sections in a brain atlas and theROIs manually drawn. This method, however, is subjectiveand liable to observer bias. A refinement uses a template ofstandard regions to sample brain structures of interest,with visual adjustment to fit the template to the images.Alternative approaches have been developed that relatePET images to anatomy more accurately and objectively. Awidely used approach uses the principles of stereotacticlocalization to establish a correspondence between brainareas or volumes in a stereotactic brain atlas and specificregions or pixels in the PET image (Fox et al., 1985; Fristonet al., 1989). Other methods are required if there are struc-tural abnormalities. An approach widely used for bothnormal and abnormal brain is to obtain anatomic imageswith CT or MRI in the same planes as the PET slices.Methods to achieve this include head holders transferablebetween imaging modalities, fiducial markers affixed tothe head, and, most conveniently, automated computertechniques to register and reslice PET and MR or CTimages (Pelizzari et al., 1989; Wilson and Mountz, 1989;Evans et al., 1991; Woods et al., 1993; Ge et al., 1994). Aftercoplanar anatomic and PET images have been obtained,
ROIs can be transferred between them. These automatedtechniques have also been used to register brain SPECTimages with CT or MR images (Holman et al., 1991).
A variety of sophisticated methods have been developedto extract information from functional brain images. Oneapproach consists of calculating the relationship betweenCBF or metabolism in multiple pairs of brain regions(Horwitz et al., 1992). A high degree of correlation orcovariance between the activity in two brain regions isattributed to a high level of functional connectivity or cou-pling between them during a particular condition (Friston,1994). This implies that the regions work together,influence each other, or are affected in a similar fashion bya third region. In a refinement of this approach called pathanalysis, knowledge of the neuroanatomic connectionsbetween brain areas is included in the computation ofinterregional correlations, and functional networks con-sisting of several brain regions can be identified (McIntoshet al., 1994). An alternative group of approaches, includingprinciple components analysis and scaled subprofile mod-eling, attempts to identify groups of regions that accountfor the variability in a dataset and which may be function-ally related (Strother et al., 1995).
The technique of statistical parametric mapping (SPM)has become a widely applied method. It is typically used todetermine the difference, on a pixel-by-pixel basis,between sets of rCBF images obtained in different studyconditions (Friston et al., 1991; Frackowiak and Friston,1994; Acton and Friston, 1998). This method basically con-sists of three steps. The first is image normalization in
16 P. Herscovitch and M. Ernst
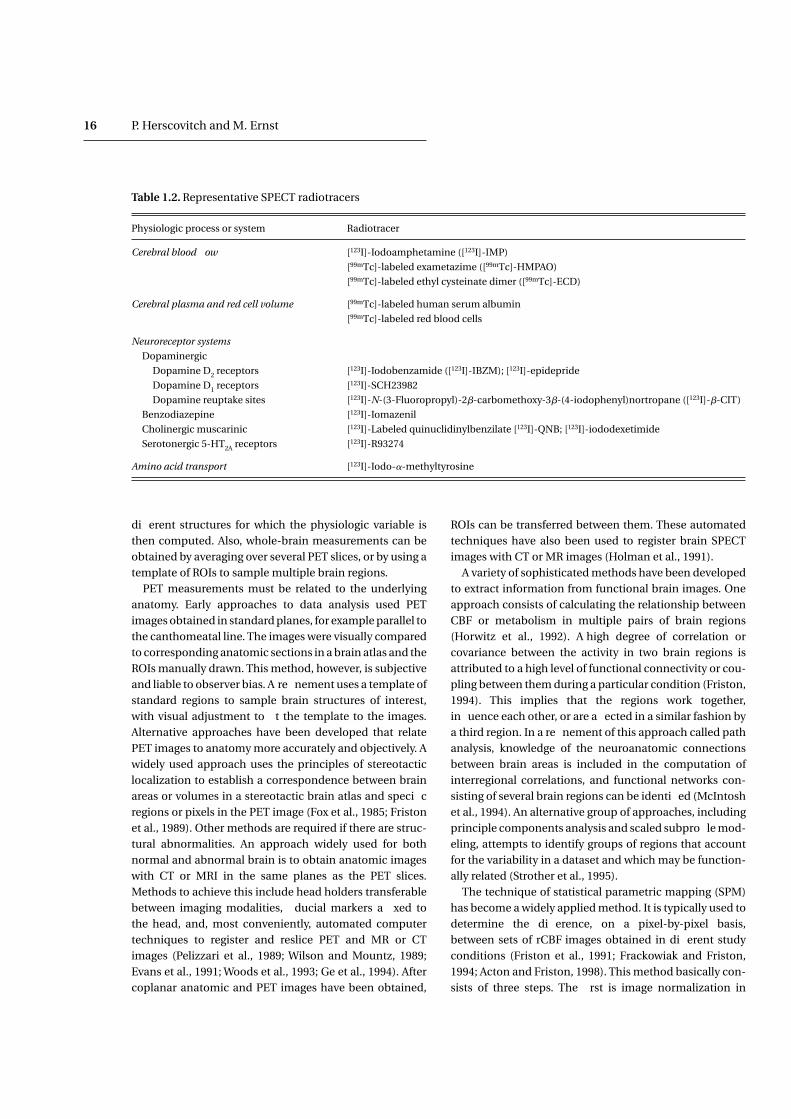
Table 1.2. Representative SPECT radiotracers
Physiologic process or system Radiotracer
Cerebral blood flow [123I]-Iodoamphetamine ([123I]-IMP)
[99mTc]-labeled exametazime ([99mTc]-HMPAO)
[99mTc]-labeled ethyl cysteinate dimer ([99mTc]-ECD)
Cerebral plasma and red cell volume [99mTc]-labeled human serum albumin
[99mTc]-labeled red blood cells
Neuroreceptor systems
Dopaminergic
Dopamine D2 receptors [123I]-Iodobenzamide ([123I]-IBZM); [123I]-epidepride
Dopamine D1 receptors [123I]-SCH23982
Dopamine reuptake sites [123I]-N-(3-Fluoropropyl)-2b-carbomethoxy-3b-(4-iodophenyl)nortropane ([123I]-b-CIT)
Benzodiazepine [123I]-Iomazenil
Cholinergic muscarinic [123I]-Labeled quinuclidinylbenzilate [123I]-QNB; [123I]-iododexetimide
Serotonergic 5-HT2A receptors [123I]-R93274
Amino acid transport [123I]-Iodo-a-methyltyrosine

which each pixel is mapped into the same stereotacticspace; thus all pixels in the image set are transformed intoa common reference brain in a 3D coordinate system. Thispermits the second step, that is averaging images obtainedfrom different subjects studied during the same condition.This reduces image noise and facilitates the detection ofsignificant differences between conditions. Because imagenoise in PET images is random, it decreases when imagesare averaged, while the rCBF pattern, which is consistentacross subjects, remains. The final step is to perform sta-tistical tests on a pixel-by-pixel basis between datasets toidentify regions of significant rCBF change. The results aredisplayed as 3D maps or views of the reference brain inwhich pixels with a significant change in rCBF are high-lighted.
SPM was originally designed to determine the changes inlocal CBF measured with H2
15O in subjects studied duringtwo or more different neurobehavioral tasks in functionalbrain mapping experiments. It can also be applied in aparametric analysis to see which brain regions covary in asystematic fashion with some parameter related to the per-formance of a cognitive, sensory, or motor task (e.g., therate of hand movement). SPM has subsequently beenapplied to both H2
15O and FDG images in other types ofstudy, for example before and after administration of a drugor to compare a group of patients with a control group. Ithas also been used to analyze perfusion images obtainedwith SPECT (Acton and Friston, 1998).
There is variability in both regional and global PETmeasurements. The coefficient of variation (i.e., the ratio ofthe standard deviation to the mean value) for measure-ments of rCBF, rCMRGlu, and rCMRO2 is 15–25% in groupsof normal subjects (Perlmutter et al., 1987; Tyler et al., 1988;Camargo et al., 1992; Wang et al., 1994), although the vari-ability in repeat measurements in the same subject is less(Matthew et al., 1993). This may reflect normal physiologicvariation or methodologic inaccuracies. Approaches havebeen developed to facilitate detecting regional changes inspite of this variability. These adjust for the effect of globalvariations by “normalizing” regional data, thereby decreas-ing their variance. This can be done by dividing regionalvalues by the global average value or by the value in a struc-ture presumed to be minimally involved in the diseasebeing studied. Such techniques, however, can result in aloss of the information contained in the absolute values,especially if widespread changes occur. If the denominatoras well as the numerator differs between groups, erroneousconclusions may be drawn. For example, in a study ofAlzheimer’s disease (Cutler et al., 1985), normalizedrCMRGlu in thalamus was significantly increased becauseof a decrease in global metabolism. In other words, the
metabolism in the thalamus may be relatively spared.Therefore, normalized PET data must be carefully inter-preted. In spite of the variability of PET measurements, it ispossible to demonstrate meaningful physiologic abnor-malities with absolute data, for example in cerebrovascu-lar disease (Powers, 1998).
SPECT perfusion studies typically do not involvequantitation of absolute rCBF. Although the image inten-sity is proportional to flow, it also depends on the amountof tracer reaching the brain, which can vary betweenpatients and even in the same patient because of variationsin the peripheral circulation as well as body size. A normal-ization procedure is performed if regional tissue countdata are to be averaged in a patient group or comparedwith data from normal subjects. This is accomplished bydividing the count data in individual ROIs by the averagecount value (Goldenberg et al., 1992) or by the value in thecerebellum, assuming that it is not involved in the diseaseprocess. There are potential ambiguities with thisapproach. For example, a region with the appearance ofincreased perfusion may actually have an elevated flow,but the finding may also reflect reduced flow in other brainregions (Wilson and Wyper, 1992).
Data from control subjects are required to interpret PETor SPECT measurements obtained in patients.Quantitative data obtained in appropriately selectednormal subjects are used. Depending on the nature of thestudy, selection criteria must control for variables such asage, gender, handedness, and condition of general health;in children, sexual and cognitive maturation must also beincluded. Average data from patients are statistically com-pared with the same regional measurements made in agroup of normal control subjects. It is also possible toanalyze regional data obtained in an individual patient, forexample by determining whether they are outside therange of normal. In comparing measurements obtainedfrom many brain regions, it is possible that some regionswill be found to be significantly different by chancebecause of the large number of multiple comparisonsbeing made. One approach to avoid this error, which israther conservative, is to adjust the study p value (typically0.05) by dividing it by the number of measurements beingmade (the Bonferroni correction).
One must also consider the possibility of a drift inmeasurements over years in the case of longitudinalstudies, which have a special place in pediatric research.Usually, these changes over time caused by subtle changesin scanner performance can be corrected by covarianceanalysis. This stresses the importance of systematic andrigorous quality control of scanners and the interleaving ofpatients and controls over the duration of a study.
Functional brain imaging with PET/SPECT 17

If visual analysis of SPECT and PET images is used, itrequires a rigorous approach. SPECT images are frequentlyinterpreted visually for abnormalities. The criteria fordefining an abnormality are usually subjective, however,and further work must be done to define the sensitivity andspecificity for detecting abnormalities (Juni, 1994; Stapletonet al., 1994). In some SPECT studies, there is a cleardefinition of regional abnormality and scans are graded byagreement among two or more observers (Jacobs et al.,1994), whereas other studies have used less careful method-ology. This makes it difficult to compare different studies.
Interpretation of changes in cerebral blood flowand metabolism
Physiologic considerations
To interpret changes in PET and SPECT studies, it is neces-sary to understand the relationships among CBF, metabo-lism, and local neuronal activity, and the mechanisms bywhich CBF and metabolism can become abnormal.
Normally, about 30% of the brain’s energy metabolismsupports synaptic transmission, 30% residual ion fluxesand transport, and 40% other processes such as axoplasmictransport and macromolecular synthesis (Astrup et al.,1981). In the resting state, the energy needs of the brain aremet by the oxidative metabolism of glucose, and there is aproportional relationship, termed coupling, between rCBFand both rCMRO2 and rCMRGlu (Sokoloff, 1981; Baron etal., 1984; Fox and Raichle, 1986; Fox et al., 1988). Duringincreased local neuronal activity, for example withsomatosensory or visual stimulation, there are coupled orparallel increases in rCBF and rCMRGlu in the brain regionsinvolved (Sokoloff, 1961; Leniger-Follert and Hossman,1979; Toga and Collins, 1981; Yarowsky et al., 1983; Fox andRaichle, 1984; Ginsberg et al., 1987; Fox et al., 1988). Withinphysiologic limits, these increases parallel the stimulus rateand the rate of neuronal firing. Most of the brain’s addi-tional glucose consumption during increased neuronalactivity is used to maintain ionic gradients across cell mem-branes, which must be restored after depolarization(Yarowsky and Ingvar, 1981). These observations form thebasis for using measurements of rCBF and rCMRGlu asmarkers of local neuronal function (Raichle, 1987). PETstudies in humans have shown, however, that there is onlya slight increase in rCMRO2 during functional activation(Fox and Raichle, 1986; Fox et al., 1988). This observationchallenged the hypothesis that oxidative glucose metabo-lism or its products regulate the rCBF changes duringneuronal activation. In fact, the processes responsible for
coupling rCBF to rCMRGlu at rest and during activationremain to be elucidated (Lou et al., 1987; Raichle, 1991;Edvinsson et al., 1993b; Jueptner and Weiller, 1995).
Various mechanism can lead to abnormalities of CBFand metabolism. Changes in neuronal activity can result inincreases or decreases in local CBF and metabolism.Decreased neuronal activity in coma decreases CBF andmetabolism (Obrist et al., 1984), as can drugs and anes-thetics that act on synapses or membranes to depressneuronal activity. Abnormalities in blood flow and metab-olism in specific brain regions have been found in manyneurologic and psychiatric diseases. These may reflectaltered neuronal activity either in the area(s) of abnormal-ity or in distant brain regions that project to the area(s). Inmany diseases, several brain areas are affected, implyingan abnormality in underlying brain networks. Both acuteand chronic administration of drugs have been shown tochange rCBF and metabolism. These changes have beenrelated to the action of the drug on a specific receptorsystem with a resulting change in activity.
Tissue damage or loss, either gross or through loss ofneurons, can decrease flow and metabolism. In addition,coupled decreases in flow and metabolism can be seen instructures distant to a lesion. This phenomenon, calleddiaschisis, is attributed to a decrease in neuronal activity ina brain structure through loss of afferent projections fromthe damaged region (Feeney and Baron, 1986). For example,decreased flow and metabolism can be seen in the cerebel-lum contralateral to a cerebral infarct. There are situationswhen flow and metabolism are not coupled, for examplewith changes in arterial blood gases (Edvinsson et al., 1993a)and in pathologic conditions such as cerebrovasculardisease (Powers, 1988, 1991; Heiss and Podreka, 1993) or ele-vated intracranial pressure (Grubb et al., 1975).
Effect of limited spatial resolution
Artifactual abnormalities of CBF and metabolism can beobserved with PET or SPECT because of the limited spatialresolution of the imaging devices. Limited resolutionresults in blurring of PET and SPECT images (Fig. 1.6).More important is its effect on the accuracy of radioactiv-ity measurement (Hoffman et al., 1979; Mazziotta et al.,1981). Because the radioactivity appears spread out over alarger area, a brain region in the image contains only aportion of the radioactivity that was in the correspondingbrain structure. In addition, some of the radioactivity insurrounding structures appears to be spread into theregion. Because of this effect, called partial volume aver-aging, a regional measurement contains a contributionfrom both the structure of interest and surrounding struc-
18 P. Herscovitch and M. Ernst

tures. High radioactivity levels surrounded by lower valueswill be underestimated, while low radioactivity sur-rounded by high activity will be overestimated. Theseerrors are less when the size of the structure of interest islarge with respect to scanner resolution. In a circular,uniform structure with a diameter twice the resolution, theradioactivity concentration will be accurately representedin the center. However, statistical considerations limitobtaining a measurement with a very small ROI. In general,it is not possible to measure pure gray matter radioactivity,especially in thin cortical regions.
Partial volume averaging with cerebrospinal fluid in sulcior ventricles can lead to an underestimation of tissue bloodflow and metabolism. If there is cerebral atrophy, PET andSPECT measurements will be further reduced because ofpartial volume averaging with enlarged, metabolically inac-tive, cerebrospinal fluid spaces (Herscovitch et al., 1986;Videen et al., 1988). Beyond the border of a circumscribed
region of decreased flow or metabolism, one would observea gradual transition of the physiologic measurement to thevalue in surrounding normal tissue, also caused by partialvolume averaging (Powers, 1988). This gives rise to the falseperception that the PET or SPECT “lesion” is larger than theactual abnormality. Recently, decreased CBF and metabo-lism in the subgenual prefrontal cortex in patients withfamilial depression was found to be associated with a focalreduction in gray matter volume of the affected corticalstructure. This intriguing observation indicates that alteredPET measurements can be found through partial volumeaveraging in conditions with an unsuspected anatomicabnormality (Drevets et al., 1997).
Methods have been developed to correct for partialvolume averaging and recover a more accurate radioactiv-ity measurement from small brain structures (Meltzer etal., 1996), and these should find increasing application.The contribution of partial volume effect is particularly
Functional brain imaging with PET/SPECT 19
Fig. 1.6. The effect of scanner resolution on the accuracy of images obtained. At the upper center is a simulated “ideal” PET image of
regional radioactivity, reflecting the higher metabolic activity in gray matter. Subsequent images simulate the effect of obtaining this
image with tomographs of varying spatial resolution, from 5 to 15mm FWHM (full width at half maximum). Note the blurring or
spreading out of radioactivity, with gray matter structures appearing paler. As a result, radioactivity in cortical and subcortical gray
matter regions is underestimated. Similar considerations hold for SPECT images. (From Mazziotta et al., 1981, with permission.)
important in the developing brain where size, shape, andhomogeneity of structures vary with neural maturation(Giedd et al., 1996a, b; Rajapakse et al., 1996).
Effect of patient motion
Head movement is particularly important when subjectsare children who have trouble remaining immobile.Motion between the transmission and emission scans canlead to a mismatch in the attenuation correction factors.Motion during an emission can blur the image in a nonuni-form manner and increase partial volume errors. Motionbetween scans obtained at rest and during performance ofa task in a given subject can lead to artefactual differencesbetween the scans being interpreted as activation. The rel-ative impact of this blurring becomes greater as the resolu-tion of the scanner improves.
Head motion during brain scans can be reduced with avariety of head support or stabilization devices, but itcannot be entirely eliminated. Several methods of detect-ing and correcting for motion have been developed. Onetechnique is based on radioactive fiducial markers that areused to align scans of short duration, which are thensummed (Koeppe et al., 1991). Another method employsthe images of the brain themselves to estimate the correc-tions necessary to obtain maximum alignment of the serialimages (Minoshima et al., 1992).
Radiation exposure and technical issues inpediatric imaging
Radiation exposure
Although the short half-lives of PET radionuclides favour-ably affects the radiation exposure to subjects, this expo-sure is not negligible. Radiation exposure in the context ofPET and SPECT is an important consideration when theyare used for research rather than diagnostic purposes(Veatch, 1982; Huda and Scrimger, 1989). Limits on radia-tion exposure to research subjects are set by regulatorybodies such as the US Food and Drug Administration andinstitutional radiation safety committees. The potentialrisks associated with low levels of radiation such as thosereceived from PET are carcinogenesis and genetic effects infuture generations (Brill, 1987). Although the risk is verylow (for review, see Ernst et al., 1998), it is agreed that theleast amount of radiotracer necessary to perform an ade-quate PET study should be administered.
Methods have been developed to determine radiationexposure from internally administered radiopharma-
ceuticals (Cloutier and Watson, 1987; Loevinger et al., 1988;Kassis, 1992). The distribution of the radiotracer in thebody is first determined as a function of time following itsadministration. This information can be calculated usingphysiologic models of in vivo tracer behavior, extrapolatedfrom measurements in animals, or measured in a smallgroup of human subjects. Then the radiation exposure toeach organ is calculated using a model of the body thatsimulates the size, shape, and properties of body organs.Appropriate models have been designed for the pediatricage group, including the neonate.
Regulations in the USA typically restrict radiation expo-sure in minors participating in research studies to one-tenth that allowed in adults. The use of newer, 3D PETscanners has improved the situation with regard to radia-tion exposure in pediatric PET studies. Because of thegreater sensitivity of these scanners, it is possible toadminister smaller doses of radiotracer and maintainimage quality. In addition, in some cases specific strategiescan be employed to reduce radiation exposure. Forexample, in FDG studies one can have the subject void afterthe 30–45min uptake period rather than after the comple-tion of emission scanning, to reduce radiation exposure tothe urinary bladder, the organ that receives the greatestradiation exposure (Zametkin et al., 1993) (see Chapter 6).
Technical issues
Clinical research with PET is more complex in the pediatricage group than in adults for several reasons.
Measurement of radioactivity in arterial blood is typ-ically required to perform truly quantitative studies. In theadult, arterial catheters can routinely be inserted purely forresearch purposes (Lockwood, 1985), but this is a majorobstacle in minors. In sick infants, arterial samples havebeen obtained from catheters previously placed for inten-sive care purposes (Volpe et al., 1983). There are alterna-tives, however. For FDG studies, venous sampling can beperformed from a hand heated to 44 °C to “arterialize”venous blood (Phelps et al., 1979); this does require coop-eration from the subject. With certain PET tracer tech-niques, the image of local radioactivity is approximatelyproportional to the underlying physiologic variable, forexample rCBF with a bolus intravenous injection of H2
15O,or rCMRGlu with FDG. With appropriate data analysisstrategies, information about regional abnormalities canbe obtained without blood sampling.
A novel approach to obtaining the arterial time–radio-activity curve involves imaging the heart after injection oftracer. Multiple brief scans are obtained, and the bloodcurve is measured using an ROI placed over the left
20 P. Herscovitch and M. Ernst
ventricle. This approach was originally applied to PETstudies of the heart, where both the heart chamber and thetissue of interest (the myocardium) are simultaneously inthe field of view of the scanner (Weinberg et al., 1988;Bergmann et al., 1989; Iida et al., 1992). It can also be usedwith certain radiotracer techniques that are used to studythe brain, for example with FDG or [11C]-a-methyltrypto-phan (Muzik et al., 1998), for which there is a prolongedtracer uptake period that is followed by emission imagingof the brain.
During a PET scan, it is necessary to prevent head move-ment. In cooperative adults, this is accomplished by meansof a specially designed headholder affixed to the scannercouch. Children may find this difficult to tolerate. For theFDG method, it is possible to sedate the subject for theemission image after the 30–45min tracer uptake period,because the tracer distribution in brain has already beenestablished. Also, for scans that require prolongedimaging, it is possible to collect the data in multiple briefscans that can be spatially registered to each other tocorrect for head movement.
Although normal adults are frequently scanned toobtain control data for comparison with patient data, it isusually difficult to scan normal children in PET or SPECTstudies because of ethical considerations (Chapter 6).Depending upon the research question, some studies donot require control data (e.g., Altman et al., 1989; Perlmanand Altman, 1992). For studies that require normal controldata, a suboptimal approach can be used: the controlgroup can include retrospectively selected children whohad been scanned for appropriate clinical research indica-tions, such as a neurologic event thought not to affect braindevelopment or diagnostic evaluation for a neurologicdisease that is ultimately excluded (Chugani and Phelps,1991; Bentourkia et al., 1998; van Bogeart et al., 1998).Another strategy is to enroll healthy siblings of childrenaffected by the condition being studied because the sib-lings have the possibility of indirect benefit from increasedknowledge of the condition. The issue of studying normalchildren is discussed further in Chapter 6.
iReferencesi
Acton, P. D. and Friston, K. J. (1998). Statistical parametric mapping
in functional neuroimaging: beyond PET and fMRI activation
studies. Eur. J. Nucl. Med., 25, 663–7.
Altman, D. I., Perlman, J. M., Volpe, J. J. and Powers, W. J. (1989).
Cerebral oxygen metabolism in newborn infants measured with
positron emission tomography. J. Cereb. Blood Flow Metab.,
9(Suppl. 1), S25.
Altman, D. I., Lich, L. L. and Powers, W. J. (1991). Brief inhalation
method to measure cerebral oxygen extraction with PET: accu-
racy determination under pathologic conditions. J. Nucl. Med.,
32, 1738–41.
Astrup, J., Sorensen, P. M. and Sorensen, H. R. (1981). Oxygen and
glucose consumption related to Na1-K1 transport in canine
brain. Stroke, 12, 726–30.
Bailey D. L. (1998). Transmission scanning in emission tomogra-
phy. Eur. J. Nucl. Med., 25, 774–87.
Bailey, D. L., Miller, M. P., Spinks, T. J. et al. (1998). Experience with
fully 3D PET and implications for future high-resolution 3D
tomographs. Phys. Med. Biol., 43, 777–86.
Baron, J. C., Rougemont, D., Soussaline, F. et al. (1984). Local inter-
relationships of oxygen consumption and glucose utilization in
normal subjects and in ischemic stroke patients: a positron emis-
sion tomographic study. J. Cereb. Blood Flow Metab., 4, 140–9.
Baron, J. C., Frackowiak, R. S. J., Herholz, K. et al. (1989). Use of PET
methods for measurement of cerebral energy metabolism and
hemodynamics in cerebrovascular disease. J. Cereb. Blood Flow
Metab., 9, 723–42.
Bentourkia, M., Michel, C., Ferriere, G. et al. (1998). Evolution of
brain glucose metabolism with age in epileptic infants, children
and adolescents. Brain Dev., 20, 524–9.
Bergmann, S. R., Herrero, P., Markham, J., Weinheimer, C. J. and
Walsh, M. N. (1989). Noninvasive quantitation of myocardial
blood flow in human subjects with oxygen-15-labeled water and
positron emission tomography, J. Am. Coll. Cardiol., 14, 639–52.
Bergstrom, M., Eriksson, L., Bohm, C., Blomqvist, G. and Litton, J.
(1983). Correction for scattered radiation in a ring detector
positron camera by integral transformation of the projections. J.
Comput. Assist. Tomogr., 7, 42–50.
Berridge, M. S., Adler, L. P., Nelson, A. D. et al. (1991). Measurement
of human cerebral blood flow with [15O]butanol and positron
emission tomography. J. Cereb. Blood Flow Metab., 11, 707–15.
Blomqvist, G., Stone-Elander, S., Halldin, C. et al. (1990). Positron
emission tomographic measurements of cerebral glucose
utilization using [1-11C]-glucose. J. Cereb. Blood Flow Metab.,
11, 467–83.
Borch, K. and Greisen, G. (1997). 99mTc-HMPAO as a tracer of cere-
bral blood flow in newborn infants. J. Cereb. Blood Flow Metab.,
17, 448–54.
Brill, A. B. (1987). Biological effects of ionizing radiation. In Nuclear
Medical Physics, ed. L. E. Williams, pp. 163–83. Boca Raton, FL,
CRC Press.
Brooks, R. A. (1982). Alternative formula for glucose utilization
using labeled deoxyglucose. J. Nucl. Med., 23, 583–9.
Budinger, T. F., Derenzo, S. E., Greenberg, W. L., Gullberg, G. T. and
Huesman, R. H. (1978). Quantitative potentials of dynamic emis-
sion computed tomography. J. Nucl. Med., 19, 309–15.
Camargo, E. E., Szabo, Z., Links, J. M. et al. (1992). The influence of
biological and technical factors on the variability of global and
regional brain metabolism of 2-[18F]fluoro-2-deoxy-D-glucose. J.
Cereb. Blood Flow Metab., 12, 281–90.
Carson, R. E. (1991). Precision and accuracy considerations of
physiological quantitation in PET. J. Cereb. Blood Flow Metab.,
11, A45–50.
Functional brain imaging with PET/SPECT 21

Carson, R. E. (1996). Mathematical modeling and compartmental
analysis. In Nuclear Medicine, ed. J. C. Harbert, W. E. Eckelman
and R. D. Neumann, pp. 167–93. New York: Thieme.
Carson, R. E., Daube-Witherspoon, M. E. and Green, M. V. (1988). A
method for postinjection PET transmission measurements with
a rotating source. J. Nucl. Med., 29, 1558–67.
Cherry, S. R., Chatziioannou, A., Shao, Y., Silverman, R. W.,
Meadors, K. and Phelps, M. E. (1998). Brain imaging in small
animals using MicroPET, In Quantitative Functional Brain
imaging with Positron Emission Tomography, ed. R. E. Carson,
M. E. Daube-Witherspoon and P. Herscovitch, pp. 201–6. San
Diego, CA: Academic Press.
Chugani, H. T. and Phelps, M. E. (1991). Imaging human brain
development with positron emission tomography [editorial
comment]. J. Nucl. Med., 32, 23–6.
Cloutier, R. J. and Watson, E. E. (1987). Internal dosimetry – an
introduction to the ICRP technique. In Nuclear Medical Physics,
ed. L. E. Williams, p. 143. Boca Raton, FL: CRC Press.
Council on Scientific Affairs (1988). Instrumentation in positron
emission tomography. J. Am. Med. Assoc., 259, 1351–6.
Cunningham, V. and Cremer, J. E. (1985). Current assumptions
behind the use of PET scanning for measuring glucose utiliza-
tion in brain. Trends Neurosci., 8, 96–9.
Cutler, N. R., Haxby, J. V., Duara, R. et al. (1985). Clinical history,
brain metabolism, and neuropsychological function in
Alzheimer’s disease. Ann. Neurol., 18, 298–309.
Dannals, R. F., Ravert, H. T. and Wilson, A. A. (1993). Chemistry of
tracers for positron emission tomography. In Nuclear Imaging in
Drug Discovery, Development, and Approval, ed. D. H. Burns, R.
E. Gibson, R. F. Dannals and P. K. S. Siegl, pp. 55–74. Boston:
Birkhäuser.
Daube-Witherspoon, M. E. and Herscovitch, P. (1996). Positron
emission tomography. In Nuclear Medicine, ed. J. C. Harbert,
W. E. Eckelman and R. D. Neumann, pp. 121–43. New York:
Thieme.
de Grado, T. R., Turkington, T., Williams, J. J., Stearns, C. W.,
Hoffman, J. M. and Coleman, R. E. (1994). Performance
characteristics of a whole-body PET scanner. J. Nucl. Med., 35,
1398–1406.
Devous, M. D., Stokely, E. M., Chehabi, H. H. and Bonte, F. J. (1986).
Normal distribution of regional cerebral blood flow measured by
dynamic single-photon emission tomography. J. Cereb. Blood
Flow Metab., 6, 95–104.
Devous, M. D. (1995). SPECT functional brain imaging: technical
considerations. J. Neuroimaging, 5(Suppl. 1), S2–13.
Drevets, W. C., Price, J. L., Simpson, J. R. et al. (1997). Subgenual
prefrontal cortex abnormalities in mood disorders. Nature, 386,
824–7.
Edvinsson, L., MacKenzie, E. T. and McCulloch, J. (1993a). Changes
in arterial gas tensions. In Cerebral Blood Flow and Metabolism,
pp. 524–52. New York: Raven Press.
Edvinsson, L., MacKenzie, E. T. and McCulloch, J. (1993b).
Neurotransmitters: metabolic and vascular effects in vivo. In
Cerebral Blood Flow and Metabolism, pp. 159–80. New York:
Raven Press.
Eriksson, L., Holte, S., Bohm, C., Kesselberg, M. and Hovander, B.
(1988). Automated blood sampling systems for positron emis-
sion tomography. IEEE Trans. Nucl. Sci., 35, 703–7.
Ernst M., Freed M. E. and Zametkin, A. J. (1998). Health hazards of
radiation exposure in the context of brain imaging research:
special consideration for children. J. Nucl. Med., 39, 689–98.
Evans, A. C., Marrett, S., Torrescorzo, J., Ku, S. and Collins, L. (1991).
MRI–PET correlation in three dimensions using a volume-of-
interest (VOI) atlas. J. Cereb. Blood Flow Metab., 11, A69–78.
Feeney, D. M. and Baron, J. C. (1986). Diaschisis. Stroke, 17, 817–30.
Fowler, J. S. and Wolf, A. P. (1991). Recent advances in radiotracers
for PET studies of the brain. In Radiopharmaceuticals and Brain
Pathology Studied with PET and SPECT, ed. M. Diksic and R. C.
Reba, pp. 11–34. Boca Raton, FL: CRC Press.
Fox, P. T. and Raichle, M. E. (1984). Stimulus rate dependence of
regional cerebral blood flow in human striate cortex, demon-
strated by positron emission tomography. J. Neurophysiol., 51,
1109–20.
Fox, P. T. and Raichle, M. E. (1986). Focal physiological uncoupling
of cerebral blood flow and oxidative metabolism during
somatosensory stimulation in human subjects. Proc. Natl. Acad.
Sci. USA, 83, 1140–4.
Fox, P. T., Perlmutter, J. S. and Raichle, M. E. (1985). A stereotactic
method of anatomical localization for positron emission tomog-
raphy. J. Comput. Assist. Tomogr., 9, 141–53.
Fox, P. T., Raichle, M. E., Mintun, M. A. and Dence, C. (1988).
Nonoxidative glucose consumption during focal physiologic
neural activity. Science, 241, 462–4.
Frackowiak, R. S. and Friston, K. J. (1994). Functional neuro-
anatomy of the human brain: positron emission tomography – a
new neuroanatomical technique. J. Anat., 184, 211–25.
Frackowiak, R. S. J., Lenzi, G.-L., Jones, T. and Heather, J. D. (1980).
Quantitative measurement of regional cerebral blood flow and
oxygen metabolism in man using 15O and positron emission
tomography: theory, procedure and normal values. J. Comput.
Assist. Tomogr., 4, 727–36.
Friston, K. J. (1994). Functional and effective connectivity in
neuroimaging: a synthesis. Hum. Brain Map., 2, 56–78.
Friston, K. J., Passingham, R. E., Nutt, J. G., Heather, J. D., Sawle, G.
V. and Frackowiak, R. S. J. (1989). Localisation in PET images:
direct fitting of the intercommissural (AC–PC) line. J. Cereb.
Blood Flow Metab., 9, 690–5.
Friston, K. J., Frith, C. D., Liddle, P. F. and Frackowiak, R. S. J. (1991).
Comparing functional (PET) images: the assessment of
significant change. J. Cereb. Blood Flow Metab., 11, 690–9.
Ge, Y. R., Fitzpatrick, J. M., Votaw, J. W. et al. (1994). Retrospective
registration of PET and MR brain images – an algorithm and its
stereotaxic validation. J. Comput. Assist. Tomogr., 18, 800–10.
Gemmell, H. G., Evans, N. T. S., Besson, J. A. O. et al. (1992).
Regional cerebral blood flow imaging: a quantitative compari-
son of technetium-99m-SPECT with C15O2 PET. J. Nucl. Med., 31,
1595–1600.
George, M. S., Ring, H. A., Costa, D. C., Ell, P. J., Kouris, K. and Jarritt,
P. H. (1991). Neuroactivation and Neuroimaging with SPECT.
London: Springer-Verlag.
22 P. Herscovitch and M. Ernst

Giedd, J. N., Snell, J. W., Lange, N. et al. (1996a). Quantitative mag-
netic resonance imaging of human brain development: ages
4–18. Cereb. Cortex, 6, 551–60.
Giedd, J. N., Vaituzis, A., Hamburger, S. D. et al. (1996b).
Quantitative MRI of the temporal lobe, amygdala, and hip-
pocampus in normal development: ages 4–18 years. J. Comp.
Neurol., 366, 223–30.
Ginsberg, M. D., Dietrich, W. D. and Busto, R. (1987). Coupled fore-
brain increases of local cerebral glucose utilization and blood
flow during physiologic stimulation of a somatosensory
pathway in the rat: demonstration by double-label auto-
radiography. Neurology, 37, 11–19.
Gjedde, A., Weinhard, K., Heiss, W.-D. et al. (1985). Comparative
regional analysis of 2-fluorodeoxyglucose and methylglucose
uptake in brain of four stroke patients. With special reference to
the regional estimation of the lumped constant. J. Cereb. Blood
Flow Metab., 5, 163–78.
Goldenberg, G., Oder, W., Spatt, J. and Podreka, I. (1992). Cerebral
correlates of disturbed executive function and memory in sur-
vivors of severe closed head injury: a SPECT study. J. Neurol.
Neurosurg. Psychiatry, 55, 362–8.
Grafton, S. T. and Mazziotta, J. C. (1992). Cerebral pathophysiology
evaluated with positron emission tomography. In Diseases of the
Nervous System: Clinical Neurobiology, 2nd edn, ed. A. K. Asbury,
G. M. McKhann and W. I. McDonald, pp. 1573–88. Philadelphia,
PA: Saunders.
Graham, M. M., Spence, A. M., Muzi, M. and Abbott, G. L. (1989).
Deoxyglucose kinetics in a rat brain tumor. J. Cereb. Blood Flow
Metab., 9, 315–22.
Green, M. V. (1996). Single photon imaging. In Nuclear Medicine,
ed. J. C. Harbert, W. E., Eckelman and R. D. Neumann, pp. 87–120.
New York: Thieme.
Greenberg, J. H., Kushner, M., Rangno, M., Alavi, A. and Reivich, M.
(1990). Validation studies of iodine-123-iodoamphetamine as a
cerebral blood flow agent using emission tomography. J. Nucl.
Med., 31, 1364–9.
Greenberg, J. H., Hamar, J., Welsh, F. A., Harris, V. and Reivich, M.
(1992). Effect of ischemia and reperfusion on the lumped con-
stant of the [14C] deoxyglucose technique. J. Cereb. Blood Flow
Metab., 12, 70–7.
Grubb, R. L., Jr, Raichle, M. E., Phelps, M. E. and Ratcheson, R. A.
(1975). Effects of increased intracranial pressure on cerebral
blood volume, blood flow, and oxygen utilization in monkeys. J.
Neurosurg., 43, 385–98.
Grubb, R. L., Jr, Raichle, M. E., Higgins, C. S. and Eichling, J. O.
(1978). Measurement of regional cerebral blood volume by emis-
sion tomography. Ann. Neurol., 4, 322–8.
Hasselbalch, S. G., Madsen, P. L., Knudsen, G. M., Holm S. and
Paulson O. B. (1998). Calculation of the FDG lumped constant by
simultaneous measurements of global glucose and FDG metab-
olism in humans. J. Cereb. Blood Flow Metab., 18, 154–60.
Hatazawa, J., Masatoshi, I., Matsuzawa, T., Ido, T. and Watanuki, S.
(1988). Measurement of the ratio of cerebral oxygen consump-
tion to glucose utilization by positron emission tomography: its
consistency with the values determined by the Kety–Schmidt
method in normal volunteers. J. Cereb. Blood Flow Metab., 8,
426–32.
Heiss, W.-D. and Podreka, I. (1993). Role of PET and SPECT in the
assessment of ischemic cerebrovascular disease. Cerebrovasc.
Brain Metabol. Rev., 5, 235–63.
Herscovitch, P. and Raichle, M. E. (1983). Effect of tissue hetero-
geneity on the measurement of cerebral blood flow with the
equilibrium C15O2 inhalation technique. J. Cereb. Blood Flow
Metab., 3, 407–15.
Herscovitch, P. and Raichle, M. E. (1985). What is the correct value
for the brain–blood partition coefficient of water? J. Cereb. Blood
Flow Metab., 5, 65–9.
Herscovitch, P., Markham, J. and Raichle, M. E. (1983). Brain blood
flow measured with intravenous H215O. I. Theory and error
analysis. J. Nucl. Med., 24, 782–9.
Herscovitch, P., Auchus, A., Gado, M., Chi, D. and Raichle, M. E.
(1986). Correction of positron emission tomography data for
cerebral atrophy. J. Cereb. Blood Flow Metab., 6, 120–4.
Herscovitch, P., Raichle, M. E., Kilbourn, M. R. and Welch, M. J.
(1987). Positron emission tomographic measurements of cere-
bral blood flow and permeability–surface area product of water
using [15O]water and [11C]butanol. J. Cereb. Blood Flow Metab., 7,
527–42.
Hoffman, E. J. and Phelps, M. E. (1986). Positron emission tomog-
raphy: principles and quantitation. In Positron Emission
Tomography and Autoradiography, ed. M. E. Phelps, J. C.
Mazziotta and H. R. Schelbert, pp. 237–86. New York: Raven Press.
Hoffman, E. J., Huang, S.-C. and Phelps, M. E. (1979). Quantitation
in positron emission computed tomography: 1. Effect of object
size. J. Comput. Assist. Tomogr., 3, 299–308.
Hoffman, E. J., Huang, S. C., Phelps, M. E. and Kuhl, D. E. (1981).
Quantitation in positron emission computed tomography. 4.
Effect of accidental coincidences. J. Comput. Assist. Tomogr., 5,
391–400.
Holman, B. L. and Devous, M. S. (1992). Functional brain SPECT:
the emergence of a powerful clinical method. J. Nucl. Med., 33,
1888–904.
Holman, B. L., Carvalho, P. A., Zimmerman, R. E. et al. (1990). Brain
perfusion SPECT using an annular single crystal camera: initial
clinical experience. J. Nucl. Med., 31, 1456–61.
Holman, B. L., Zimmerman, R. E., Johnson, K. A. et al. (1991).
Computer-assisted superimposition of magnetic resonance and
high-resolution technetium-99m-HMPAO and thallium-201
SPECT images of the brain. J. Nucl. Med., 32, 1478–84.
Horwitz, B., Soncrant, T. T. and Haxby, J. V. (1992). Covariance
analysis of functional interactions in the brain using metabolic
and blood flow data. In Advances in Metabolic Mapping
Techniques for Brain Imaging of Behavioral and Learning
Functions, ed. F. Gonzalez-Lima, T. Finkenstaedt and H. Scheich,
pp. 189–217. Dordrecht, the Netherlands: Kluwer.
Huang, S.-C. and Phelps, M. E. (1986). Principles of tracer kinetic
modeling in positron emission tomography and autoradiography.
In Positron Emission Tomography and Autoradiography, ed. M. E.
Phelps, J. C. Mazziotta and H. R. Schelbert, pp. 237–86. New York:
Raven Press.
Functional brain imaging with PET/SPECT 23

Huang, S. C., Phelps, M. E., Hoffman, E. J., Sideris, K., Selin, C. J. and
Kuhl, D. E. (1980). Non-invasive determination of local cerebral
metabolic rate of glucose in man. Am. J. Physiol., 238, E69–82.
Huang, S. C., Phelps, M. E., Hoffman, E. J. and Kuhl, D. E. (1981).
Error sensitivity of fluorodeoxyglucose method for measure-
ment of cerebral metabolic rate of glucose. J. Cerebr. Blood Flow
Metab., 1, 391–401.
Huda, W. and Scrimger, J. W. (1989). Irradiation of volunteers in
nuclear medicine. J. Nucl. Med., 30, 260–4.
Iida, H., Rhodes, C. G., de Silva, R. et al. (1992). Use of the left ven-
tricular time–activity curve as a noninvasive input function in
oxygen-15-water positron emission tomography. J. Nucl. Med.,
33, 1669–77.
Jacobs, A., Put, E., Ingels, M. and Bossuyt, A. (1994). Prospective
evaluation of technetium-99m-HMPAO SPECT in mild and
moderate traumatic brain injury. J. Nucl. Med., 35, 942–7.
Jueptner, M. and Weiller, C. (1995). Does measurement of regional
cerebral blood flow reflect synaptic activity – implications for
PET and fMRI. [Review] Neuroimage 2, 148–56.
Juni, J. E. (1994). Taking brain SPECT seriously: reflections on
recent clinical reports in the Journal of Nuclear Medicine. J. Nucl.
Med., 35, 1891–5.
Karp, J. S., Daube-Witherspoon, M. E., Hoffman, E. J. et al. (1991).
Performance standards in positron emission tomography. J.
Nucl. Med., 32, 2342–50.
Kassis, A. I. (1992). The MIRD approach: remembering the limita-
tions. J. Nucl. Med., 33, 781–2.
Kety, S. S. (1951). The theory and applications of the exchange of
inert gas at the lungs and tissues. Pharmacol. Rev., 3, 1–41.
Kilbourn, M. (1991). Radiotracers for PET studies of neurotrans-
mitter binding sites: design considerations. In In Vivo Imaging of
Neurotransmitter Functions in Brain, Heart and Tumors, ed. D. E.
Kuhl, pp. 47–65. Washington, DC: American College of Nuclear
Physicians.
Koeppe, R. A. and Hutchins, G. D. (1992). Instrumentation for
positron emission tomography: tomographs and data pro-
cessing and display systems. Semin. Nucl. Med., 22, 162–81.
Koeppe, R. A., Holden, J. E. and Ip, W. R. (1985). Performance
comparison of parameter estimation techniques for the
quantitation of local cerebral blood flow by dynamic positron
computed tomography. J. Cereb. Blood Flow Metab., 5, 224–34.
Koeppe, R. A., Holthoff, V. A., Frey, K. A., Kilbourn, M. R. and Kuhl,
D. E. (1991). Compartmental analysis of [11C]flumazenil kinetics
for the estimation of ligand transport rate and receptor distribu-
tion using positron emission tomography. J. Cereb. Blood Flow
Metab., 11, 735–44.
Kuhl, D. E., Alavi, A., Hoffman, E. J. et al. (1980). Local cerebral
blood volume in head-injured patients: determination by emis-
sion computed tomography of 99mTc-labeled red cells. J.
Neurosurg., 52, 309–20.
Lammertsma, A. A., Jones, T., Frackowiak, R. S. J. and Lenzi, G.-L.
(1981). A theoretical study of the steady-state model for measur-
ing regional cerebral blood flow and oxygen utilization using
oxygen-15. J. Comput. Assist. Tomogr., 5, 544–50.
Lammertsma, A. A., Wise, R. J. S., Heather, J. D. et al. (1983).
Correction for the presence of intravascular oxygen-15 in the
steady-state technique for measuring regional oxygen extrac-
tion ratio in the brain. 2. Results in normal subjects and brain
tumor and stroke patients. J. Cereb. Blood Flow Metab., 3,
425–31.
Lammertsma, A. A., Brooks, D. J., Beaney, R. P. et al. (1984). In vivo
measurement of regional cerebral haematocrit using positron
emission tomography. J. Cereb. Blood Flow Metab., 4, 317–22.
Lammertsma, A. A., Brooks, D. J., Frackowiak, R. S. J. et al. (1987).
Measurement of glucose utilization with [18F]2-fluoro-2-deoxy-
D-glucose: a comparison of different analytical methods. J.
Cereb. Blood Flow Metab., 7, 161–72.
Landau, W. M., Freygang, W. H., Jr, Rowland, L. P., Sokoloff, L. and
Kety, S. (1955). The local circulation of the living brain; values in
the unanesthetized and anesthetized cat. Trans. Am. Neurol.
Assoc., 80, 125–9.
Laruelle, M., Baldwin, R. M., Rattner, Z. et al. (1994a). SPECT
quantification of [123I]iomazenil binding to benzodiazepine
receptors in nonhuman primates. I. Kinetic modeling of single
bolus experiments. J. Cereb. Blood Flow Metab., 14, 439–52.
Laruelle, M., van, Dyck, C., Abi, D. A. et al. (1994b). Compartmental
modeling of iodine-123-iodobenzofuran binding to dopamine
D2 receptors in healthy subjects. J. Nucl. Med., 35, 743–54.
Leenders, K. L., Perani, D., Lammertsma, A. A. et al. (1990). Cerebral
blood flow, blood volume and oxygen utilization: normal values
and effect of age. Brain, 113, 27–47.
Leniger-Follert, E. and Hossman, K.-A. (1979). Simultaneous mea-
surements of microflow and evoked potentials in the somato-
motor cortex of rat brain during specific sensory activation.
Pflugers Arch., 380, 85–9.
Lockwood, A. H. (1985). Invasiveness in studies of brain function
by positron emission tomography. J. Cereb. Blood Flow Metab., 5,
487–9.
Loevinger, R., Budinger, T. F. and Watson, E. E. (1988). MIRD Primer
for Absorbed Dose Calculations. New York: Society of Nuclear
Medicine.
Lou, H. C., Edvinsson, L. and MacKenzie, E. T. (1987). The concept
of coupling blood flow to brain function: revision required? Ann.
Neurol., 22, 289–97.
Martin, W. R. W., Powers, W. J. and Raichle, M. E. (1987). Cerebral
blood volume measured with inhaled C15O and positron emis-
sion tomography. J. Cerebr. Blood Flow Metab., 7, 421–6.
Masdeu, J. C., Brass, L. M., Holman, B. L. and Kushner, M. J. (1994).
Brain single-photon emission computed tomography.
Neurology, 44, 1970–7.
Matthew, E., Andreason, P., Carson, R. E. et al. (1993).
Reproducibility of resting cerebral blood-flow measurements
with H215O positron emission tomography in humans. J. Cereb.
Blood Flow Metab., 13, 748–54.
Mazziotta, J. C., Phelps, M. E., Plummer, D. and Kuhl, D. E. (1981).
Quantitation in positron computed tomography. 5. Physical-
anatomical effects. J. Comput. Assist. Tomogr., 5, 734–43.
McIntosh, A. R., Grady, C. L., Ungerleider, L. G., Haxby, J. V.,
Rapoport, S. I. and Horwitz, B. (1994). Network analysis of corti-
cal visual pathways mapped with PET. J. Neurosci., 14, 655–66.
Meltzer, C. C., Zubieta, J. K., Links, J. M., Brakeman, P., Stumpf, M.
J. and Frost, J. J. (1996). MR-based correction of brain PET
24 P. Herscovitch and M. Ernst

measurements for heterogeneous gray-matter radioactivity dis-
tribution. J. Cereb. Blood Flow Metab., 16, 650–8.
Minoshima, S., Berger, K. L., Lee, K. S. and Mintun, M. A. (1992). An
automated method for rotational correction and centering of
three-dimensional functional brain images. J. Nucl. Med., 33,
1579–85.
Mintun, M. A., Raichle, M. E., Martin, W. R. W. and Herscovitch, P.
(1984). Brain oxygen utilization measured with O-15 radiotrac-
ers and positron emission tomography. J. Nucl. Med., 25, 177–87.
Murase, K., Tanada, S., Fujita, H., Sakaki, S. and Hamamoto, K.
(1992). Kinetic behavior of technetium-99m-HMPAO in human
brain and quantification of cerebral blood flow using dynamic
SPECT. J. Nucl. Med., 33, 135–43.
Muzik, O., Chugani, D. C., Shen, C. and Chugani, H. T. (1998).
Noninvasive imaging of serotonin synthesis rate using PET and
a-methyltryptophan in autistic children. In Quantitative
Functional Brain Imaging with Positron Emission Tomography,
ed. R. E. Carson, M. E. Daube-Witherspoon and P. Herscovitch,
pp. 201–6. San Diego, CA: Academic Press.
Nakai, H., Yamamoto, Y. L., Diksic, M. et al. (1987). Time-dependent
changes of lumped and rate constants in the deoxyglucose
method in experimental cerebral ischemia. J. Cereb. Blood Flow
Metab., 7, 640–8.
Obrist, W. D., Langfitt, T. W., Jaggi, J., Cruz, J. and Gennarelli, T. A.
(1984). Cerebral blood flow and metabolism in comatose
patients with acute head injury. J. Neurosurg., 61, 241–53.
Ohta, S., Meyer, E., Thompson, C. J. and Gjedde, A. (1992). Oxygen
consumption of the living human brain measured after a single
inhalation of positron emitting oxygen. J. Cereb. Blood Flow
Metab., 12, 179–92.
Pelizzari, C. A., Chen, G. T. Y., Spelbring, D. R., Weichselbaum, R. R.
and Chen, C.-T. (1989). Accurate three-dimensional registration
of CT, PET, and/or MR images of the brain. J. Comput. Assist.
Tomogr., 13, 20–6.
Perlman, J. M. and Altman, D. I. (1992). Symmetric cerebral blood
flow in newborns who have undergone successful extracorpo-
real membrane oxygenation. Pediatrics, 89, 235–9.
Perlmutter, J. S., Powers, W. J., Herscovitch, P., Fox, P. T. and Raichle,
M. E. (1987). Regional asymmetries of cerebral blood flow, blood
volume, oxygen utilization and extraction in normal subjects. J.
Cereb. Blood Flow Metab., 7, 64–7.
Phelps, M. E. and Hoffman, E. J. (1976). Resolution limit of positron
cameras. J. Nucl. Med., 17, 757–8.
Phelps, M. E., Huang, S. C., Hoffman, E. J., Selin, C., Sokoloff, L. and
Kuhl, D. E. (1979). Tomographic measurement of local cerebral
glucose metabolic rate in humans with (F-18) 2-fluoro-2-deoxy-
D-glucose: validation of method. Ann. Neurol., 6, 371–88.
Powers, W. J. (1988). Positron emission tomography in the evalua-
tion of cerebrovascular disease: clinical applications? In Clinical
Neuroimaging, ed. W. H. Theodore, pp. 49–74. New York: Alan R.
Liss.
Powers, W. J. (1991). Cerebral hemodynamics in ischemic cere-
brovascular disease. Ann. Neurol., 29, 231–40.
Powers, W. J., Berg, L., Perlmutter, J. S. and Raichle, M. E. (1991).
Technology assessment revisited: does positron emission tomog-
raphy have proven clinical efficacy? Neurology, 41, 1339–40.
Powers, W. J., Rosenbaum, J. L., Dence, C. S., Markham, J. and
Videen, T. O. (1998). Cerebral glucose transport and metabolism
in preterm human infants. J. Cereb. Blood Flow Metab., 18, 632–8.
Raichle, M. E. (1987). Circulatory and metabolic correlates of brain
function in normal humans. In Handbook of Physiology: The
Nervous System, ed. V. B. Mountcastle and F. Plum, pp. 643–74.
Bethesda, MD: American Physiological Society.
Raichle, M. E. (1991). The metabolic requirements of functional
activity in human brain: a positron emission tomography study.
In Fuel Homeostatis and the Nervous System, ed. M. Vranic, S.
Efendic and C. H. Hollenberg, pp. 1–4. New York: Plenum.
Raichle, M. E., Martin, W. R. W., Herscovitch, P., Mintun, M. A. and
Markham, J. (1983). Brain blood flow measured with intravenous
H215O. II. Implementation and validation. J. Nucl. Med., 24,
790–8.
Rajapakse, J. C., Giedd, J. N., Rumsey, J. M., Vaituzis, A. C.,
Hamburger, S. D. and Rapoport, J. L. (1996). Regional MRI
measurements of the corpus callosum: a methodological and
developmental study. Brain Dev., 18, 379–88.
Reivich, M., Kuhl, D., Wolf, A. et al. (1979). The [18F]fluoro-
deoxyglucose method for the measurement of local cerebral
glucose utilization in man. Circ. Res., 44, 127–37.
Reivich, M., Alavi, A., Wolf, A. et al. (1985). Glucose metabolic rate
kinetic model parameter determination in humans: the lumped
constants and rate constants for [18F]fluorodeoxyglucose and
[11C]deoxyglucose. J. Cereb. Blood Flow Metab., 5, 179–92.
Sasaki, H., Kanno, I., Murakami, M., Shishido, F. and Uemera, K.
(1986). Tomographic mapping of kinetic rate constants in the
fluorodeoxyglucose model using dynamic positron emission
tomography. J. Cereb. Blood Flow Metab., 6, 447–54.
Seibyl, J. P., Laruelle, M., van Dyck, C. H. et al. (1996).
Reproducibility of iodine-123-b-CIT SPECT brain measurement
of dopamine transporters. J. Nucl. Med., 37, 222–8.
Sokoloff, L. (1961). Local cerebral circulation at rest and during
altered cerebral activity induced by anesthesia or visual stimula-
tion. In Regional Neurochemistry, ed. S. S. Kety and J. Elkes, pp.
107–17. New York: Pergamon Press.
Sokoloff, L. (1981). Relationships among local functional activity,
energy metabolism, and blood flow in the central nervous
system. FASEB J., 40, 2311–16.
Sokoloff, L. (1985). Basic principles in imaging of cerebral meta-
bolic rates. In Brain Imaging and Brain Function, ed. L. Sokoloff,
pp. 21–49. New York: Raven Press.
Sokoloff, L., Reivich, M., Kennedy, C. et al. (1977). The [14C]deoxy-
glucose method for the measurement of local cerebral glucose
utilization; theory, procedure, and normal values in the con-
scious and anesthetized albino rat. J. Neurochem., 28, 897–916.
Sorenson, J. A. and Phelps, M. E. (1987). Physics in Nuclear
Medicine. Orlando, FL: Grune and Stratton.
Spence, A. M., Graham, M. M., Muzi, M. et al. (1990). Deoxyglucose
lumped constant estimated in a transplanted rat astrocytic
glioma by the hexose utilization index. J. Cereb. Blood Flow
Metab., 10, 190–8.
Spinks, T. J., Jones, T., Bailey, D. L. et al. (1992). Physical per-
formance of a positron tomograph for brain imaging with
retractable septa. Phys. Med. Biol., 37, 1637–55.
Functional brain imaging with PET/SPECT 25

Stapleton, S. J., Caldwell, C. B., Leonhardt, C. L., Ehrlich, L. E.,
Black, S. E. and Yaffe, M. J. (1994). Determination of thresholds
for detection of cerebellar blood flow deficits in brain SPECT
images. J. Nucl. Med., 35, 1547–55.
Strother, S. C., Kanno, I. and Rottenberg, D. A. (1995). Commentary
and opinion. 1. Principal component analysis, variance parti-
tioning, and functional connectivity. J. Cereb. Blood Flow Metab.,
15, 353–60.
Subramanyam, R., Alpert, N. M., Hoop, B., Jr, Brownell, G. L. and
Taveras, J. M. (1978). A model for regional cerebral oxygen distri-
bution during continuous inhalation of 15O2, C15O, and C15O2. J.
Nucl. Med., 19, 13–53.
Ter-Pogossian, M. M. (1992). The origins of positron emission
tomography. Semin. Nucl. Med., 22, 140–9.
Ter-Pogossian, M. M., Phelps, M. E., Hoffman, E. J. and Mullani, N.
A. (1975). A positron-emission transaxial tomograph for nuclear
imaging (PETT). Radiology, 114, 89–98.
Toga, A. W. and Collins, R. C. (1981). Metabolic response of optic
centers to visual stimuli in the albino rat: anatomical and
physiological considerations. J. Comp. Neurol., 199, 443–64.
Tyler, J. L., Strother, S. C., Zatorre, R. J. et al. (1988). Stability of
regional cerebral glucose metabolism in the normal brain mea-
sured by positron emission tomography. J. Nucl. Med., 29, 631–42.
van Bogeart, P., Wikler, D., Damhaut, P., Szliwowska, H. B. and
Goldman, S. (1998). Regional changes in glucose metabolism
during brain development from the age of 6 years. Neuroimage,
8, 62–8.
van Heertum, R. L., Miller, S. H. and Mosesson, R. E. (1993). SPECT
brain imaging in neurologic disease. Radiol. Clin. North Am., 31,
881–907.
Veatch, R. M. (1982). The ethics of research involving radiation.
IRB: Rev. Hum. Subjects Res., 4, 3–5.
Videen, T. O., Perlmutter, J. S., Herscovitch, P. and Raichle, M. E.
(1987). Brain blood volume, flow, and oxygen utilization mea-
sured with 15O radiotracers and positron emission tomography:
revised metabolic computations. J. Cereb. Blood Flow Metab., 7,
513–16.
Videen, T. O., Perlmutter, J. S., Mintun, M. A. and Raichle, M. E.
(1988). Regional correction of positron emission tomography
data for the effects of cerebral atrophy. J. Cereb. Blood Flow
Metab., 8, 662–70.
Volkow, N. and Fowler, J. S. (1992). Neuropsychiatric disorders:
investigation of schizophrenia and substance abuse. Semin.
Nucl. Med., 22, 254–67.
Volpe, J. J., Herscovitch, P., Perlman, J. M. and Raichle, M. E. (1983).
Positron emission tomography in the newborn: Extensive
impairment of regional cerebral blood flow with intraventricular
hemorrhage and hemorrhagic intracerebral involvement.
Pediatrics, 72, 589–601.
Wang, B., Thompson, C. J., Tremblay, H., Reutens, D., Jolly, D. and
Meyer, E. (1998). Measurement of the evoked vascular response
(EVR) to cerebral activation due to vibro-tactile stimulation
using gated C-11-CO PET acquisition. IEEE Trans. Nucl. Sci., 45,
1111–16.
Wang, G.-J., Volkow, N. D., Wolf, A. P., Brodie, J. D. and Hitzeman, R.
J. (1994). Intersubject variability of brain glucose metabolic
measurements in young normal males. J. Nucl. Med., 35,
1457–66.
Warner, D. S., Kassell, N. F. and Boarini, D. J. (1987). Microsphere
cerebral blood flow determination. In Cerebral Blood Flow:
Physiologic and Clinical Aspects, ed. J. H. Wood, pp. 288–98. New
York: McGraw-Hill.
Weinberg, I. N., Huang, S. C., Hoffman, E. J. et al. (1988). Validation
of PET-acquired input functions for cardiac studies. J. Nucl.
Med., 29, 241–7.
Wienhard, K., Pawlik, G., Herholz, K., Wagner, R. and Heiss, W.-D.
(1985). Estimation of local cerebral glucose utilization by
positron emission tomography of [18F]2-fluoro-2-deoxy-D-
glucose: a critical appraisal of optimization procedures. J. Cereb.
Blood Flow Metab., 5, 115–25.
Wienhard, K., Dahlbom, M., Eriksson, L. et al. (1994). The ECAT
EXACT HR: performance of a new high resolution positron
scanner. J. Comput. Assist. Tomogr., 18, 110–18.
Wilson, J. T. L. and Wyper, D. (1992). Neuroimaging and neuro-
psychological functioning following closed head injury: CT, MRI,
and SPECT. J. Head Trauma Rehab., 7, 29–39.
Wilson, M. W. and Mountz, J. M. (1989). A reference system for
neuroanatomical localization on functional reconstructed cere-
bral images. J. Comput. Assist. Tomogr., 13, 174–8.
Wolf, A. P. and Schlyer, D. J. (1993). Accelerators for positron emis-
sion tomography. In Nuclear Imaging in Drug Discovery,
Development, and Approval, ed. D. H. Burns, R. E. Gibson, R. F.
Dannals and P. K. S. Siegl, pp. 33–54. Boston: Birkhäuser.
Woods, R. P., Mazziotta, J. C. and Cherry, S. R. (1993). MRI–PET
registration with automated algorithm. J. Comput. Assist.
Tomogr., 17, 536–46.
Wyper, D. J. (1993). Functional neuroimaging with single photon
emission computed tomography (SPECT). Cerebrovasc. Brain
Metabo. Rev., 5, 199–217.
Yarowsky, P. J. and Ingvar, D. H. (1981). Neuronal activity and
energy metabolism. Fed. Proc., 40, 2353–62.
Yarowsky, P., Kadekaro, M. and Sokoloff, L. (1983). Frequency-
dependent activation of glucose utilization in the superior cer-
vical ganglion by electrical stimulation of cervical sympathetic
trunk. Proc. Nat. Acad. Sci. USA, 80, 4179–83.
Zametkin, A. J., Liebenauer, L. L., Fitzgerald, G. A. et al. (1993).
Brain metabolism in teenagers with attention deficit hyperactiv-
ity disorder. Arch. Gen. Psychiatry, 50, 333–40.
26 P. Herscovitch and M. Ernst