Embed Size (px)
Citation preview
JOURNAL OF CLINICAL AND EXPERIMENTAL NEUROPSYCHOLOGY2011, 33 (4), 410–421
Functional equivalence of the National Adult ReadingTest (NART) and Schonell reading tests and NART
norms in the Dynamic Analyses to Optimise Ageing(DYNOPTA) project
Kim M. Kiely1, Mary A. Luszcz2, Olivier Piguet3,4, Helen Christensen1, Hayley Bennett3,and Kaarin J. Anstey1
1Centre for Mental Health Research, The Australian National University, Australia2Flinders University, Adelaide, South Australia, Australia3Prince of Wales Medical Research Institute, Sydney, New South Wales, Australia4School of Medical Sciences, the University of New South Wales, Sydney, New South Wales, Australia
This study investigates the functional equivalence of two measures of irregular word pronunciation—NationalAdult Reading Test (NART) and Schonell—which are popular instruments used to assess verbal neurocognitivefunctioning and to estimate premorbid IQ. We report norms for the NART in a pooled sample from 3 Australianpopulation-based studies of adults aged 65–103 years. Norms were stratified by sex and age left school in 5-yearage groups. The NART and the Schonell had a strong linear relation, allowing for the imputation of NART scoresbased on Schonell performance within 1 study. Neither measure was sensitive to the effects of sex after adjust-ing for the effects of age and education. Early school leavers performed worse on both measures. Data poolingenables greater precision and improved generalizability of NART norms than do methods that use single olderadult samples.
Keywords: Verbal abilities; Harmonization; Premorbid IQ; Crystallized intelligence; National Adult Reading Test;Norms; Dynamic Analyses to Optimise Ageing; Australian Longitudinal Study of Ageing; Canberra LongitudinalStudy of Ageing; Sydney Older Persons Study.
Investments in large-scale studies of neuropsychologi-cal function have underwritten the current movementtowards a greater synthesis and optimal use of exist-ing data sources within ageing research disciplines.One strategy to achieve synthesis is data pooling andvariable harmonization. Pooling independently designed
The data on which this research is based were drawn from several Australian longitudinal studies including: the AustralianLongitudinal Study of Ageing (ALSA), the Canberra Longitudinal Study of Ageing (CLS), and the Sydney Older Persons Study(SOPS). These studies were pooled and harmonized for the Dynamic Analyses to Optimise Ageing (DYNOPTA) project. DYNOPTAwas funded by National Health and Medical Research Council (NHMRC) Grant 410215. O.P. is supported by NHMRC ClinicalCareer Development Award Fellowship 510184, K.A. is supported by NHMRC Fellowship 366756, and H.C. is supported by NHMRCFellowship 525411. All studies would like to thank the participants for volunteering their time to be involved in the respective studies.Details of all studies contributing data to DYNOPTA, including individual study leaders and funding sources, are available on theDYNOPTA website (http://dynopta.anu.edu.au).The findings and views reported in this paper are those of the authors and not those ofthe original studies or their respective funding agencies.
Address correspondence to Kim M. Kiely, CMHR, Bldg 63 Eggleston Rd, The Australian National University, Canberra, ACT, 0200Australia (E-mail: [email protected]).
studies enables analyses of large datasets, increases sta-tistical power to investigate low-prevalence disorders,aids comparative cross-population research, and pro-vides for simultaneous replication of empirical find-ings (Anstey et al., 2010; Hofer & Piccinin, 2009; vanBuuren, Eyres, Tennant, & Hopman-Rock, 2005). Data
© 2010 Psychology Press, an imprint of the Taylor & Francis Group, an Informa business
http://www.psypress.com/jcen DOI: 10.1080/13803395.2010.527321
EQUIVALENCE AND NORMS OF WORD PRONOUNCIATION TASKS 411
pooling is particularly useful for the generation of norms,which otherwise are often based on small sample stud-ies with restricted population coverage (e.g., Tombaugh& Hubiey, 1997; Uttl, 2002). Although the notion of mul-tistudy analysis via data pooling or meta-analysis is notnew, often pooled studies will not share operationallyidentical measures. In these instances, data pooling iscontingent upon the existence of measures that indexthe same (though not identical) theoretical constructand so are functionally equivalent. A growing literatureexplicitly addresses the use of harmonization methodsfor combining functionally equivalent measures to facil-itate multistudy analyses (McArdle, Grimm, Hamagami,Bowles, & Meredith, 2009; Pommerich & Dorans, 2004;van Buuren et al., 2005). Research on the harmoniza-tion of cognitive measures is a relatively recent endeavordespite the more developed practice of data poolingof biological variables, such as serum cholesterol, inother epidemiological and medical disciplines (e.g., Dyer,1986).
Both the Schonell Graded Word Reading Test(“Schonell”; Schonell, 1942) and the National AdultReading Test (NART; Nelson, 1982) are 50-item gradedpronunciation tasks for irregularly pronounced words.They each assess verbal abilities and have been usedas a proxy for premorbid verbal IQ (VIQ) and full-scale IQ (FSIQ) in adults (Crawford, Deary, Starr, &Whalley, 2001; Crawford, Parker, Stewart, Besson, &De Lacey, 1989; Nelson & McKenna, 1975) based onthe Wechsler Adult Intelligent Scale (WAIS; Wechsler,1955). The Schonell, however, was originally devel-oped to assess reading ability in children and is there-fore relatively insensitive to reading ability in well-educated adults (Franzen, 2000). In order to providemore accurate indexation of premorbid IQ, the NARTwas developed and standardized in an adult populationin Britain (Nelson, 1982; Nelson & McKenna, 1975)and has since been revised (NART–2) for the WechslerAdult Intelligence Scale–Revised (WAIS–R) and forNorth American populations (American National AdultReading Test, AMNART; North American AdultReading Test, NAART). Short forms have also beendeveloped (Strauss, Sherman, & Spreen, 2006).
The NART has robust reliability, sound psychometricproperties, and brief administration time, and it is resis-tant against cognitive decline except in severe cases orin the presence of focal reading disorders or semanticdementia. Reflecting their strong indexation of putativecrystallized abilities (Horn & Cattell, 1967), longitudi-nal analyses of word pronunciation tasks have revealedtheir relative stability in late life, typically showing onlyslight age-related declines in performance with no indi-vidual differences in intraindividual variability (Anstey,Hofer, & Luszcz, 2003). For these reasons, the NARTis commonly used as a proxy measure of premorbid IQin large population-based studies used in epidemiologi-cal and cognitive neurobiological research (e.g., Ansteyet al., 2003; Christensen et al., 1999; Luszcz, Bryan, &Kent, 1997).
The NART and the Schonell are functionally equiv-alent measures that share similar task parameters and
differ predominantly in item difficulty. Research investi-gating their shared psychometric properties has primar-ily been in relation to predicting WAIS IQ. Crawfordet al. (1989), for example, investigated whether com-bining the NART and Schonell tasks would provideincreased prediction accuracy of IQ for subjects with lim-ited verbal abilities (i.e., NART items correct <10). Theyreported, however, that doing so systematically underes-timated WAIS IQ and resulted in a nonlinear relation-ship between predicted and observed WAIS IQ. Therehas been little research investigating the direct associa-tion and compatibility between these two measures innonclinical populations.
The available norms for the NART itself are lim-ited. NART norms have not been derived from ran-dom samples of the general population, but rather havebeen generated through recruitment via interest groups,advertisements, and convenience samples. Sample sizerestrictions have also necessitated the reporting of nor-mative data for the NART in overlapping 10-year agegroups, with typically small cell counts for older agegroups (e.g., Spreen & Strauss, 1998; Uttl, 2002). Forexample, norms reported for adults between the agesof 50 and 100 years, stratified by 5-year age groups,sex, and a binary measure of education, would resultin 40 subgroups. The likelihood of low cell counts inthese subgroups brings into question the generalizabil-ity of reported norms, particularly for older age groups,and undermines the validity of regression-based normsthat adjust for sociodemographic variables (Fastenau,1998). Moreover, NART norms specific to the Australianpopulation do not exist. Currently, Australian cliniciansmust use UK NART norms, which may be biased bycultural differences in curriculum, vernacular, and pro-nunciation (Mathias, Bowden, & Barrett-Woodbridge,2007).
Objectives
The objectives of this study were twofold. The first aimwas to assess the functional equivalence of NART andSchonell tasks and the capacity to produce comparablepredicted NART scores based on Schonell performancewithin a single study where baseline NART scores werenot obtained. The second aim was to perform multi-study comparisons across three large population-basedstudies that have obtained NART data. The baselinedata from these studies were used to produce norma-tive NART data based on a sample of over 2,636 olderAustralians, producing greater subgroup precision thanpreviously reported. The relations between the NARTand contextual variables were also explored.
METHOD
Study design
The data were drawn from the Dynamic Analyses toOptimise Ageing (DYNOPTA) project (Anstey et al.,
412 KIELY ET AL.
2010) dataset, which has harmonized and pooled datafrom nine Australian longitudinal studies of ageing.Three studies within DYNOPTA administered either theNART or the Schonell. Both the Australian LongitudinalStudy of Ageing (ALSA; Luszcz et al., 2007) and theCanberra Longitudinal Study (CLS; Christensen et al.,2004) have repeated measures of the NART on up tofour occasions. The Sydney Older Person Study (SOPS)included the Schonell at both baseline and first follow-up, whereas the NART was only included at the firstfollow-up assessment. Baseline NART scores are there-fore study censored for SOPS participants. Study cen-soring refers to data that were not obtained by a par-ticular study. This is a common problem encounteredin data pooling. Because the NART was not adminis-tered at baseline, the mechanism for study-censored datais known and can be classified entirely as Missing atRandom (MAR; Little & Rubin, 2002; Salthouse, 2004).The first study aim relates to predicting baseline NARTscores for this study-censored population by imputa-tion procedures that are appropriate for data that areassumed MAR.
Contributing study sample profiles
The study-censored SOPS sample consisted of a ran-dom sample of community-dwelling residents aged 75years and older from eight local government areasfrom the inner west of Sydney. The two-stage sam-pling design included 327 World War II veterans andwidows and 320 nonveterans. Because of the selectionprocess, 17 participants were sampled in both samplingframes (Piguet et al., 2003). Clinical interview and cog-nitive assessments were conducted by a trained physi-cian experienced in geriatric medicine. The investiga-tion of the functional equivalence between the NARTand Schonell is based on data from the first follow-upwave when each measure was obtained concurrently inSOPS.
Within SOPS the baseline measurement wave occurredbetween August of 1991 and September of 1993 andincluded 630 participants (females = 50.5%) with a meanage of 80.5 years (SD = 4.2). The average time inter-val between baseline and the first follow-up wave was2.9 years (SD = 0.3). A total of 128 participants diedbefore the start of the first follow-up wave; 448 respon-dents (female = 54.7%) participated in the first follow-upwave, resulting in an attrition rate of 12.9%. The averageschool leaving age was 14.6 years (SD = 1.56), with 55%of participants leaving school before the age of 15 years.
The Australian Longitudinal Study of Ageing (ALSA;Luszcz et al., 2007) randomly sampled both communitydwellers and residents in aged care, aged over 70, from20 local government areas from metropolitan Adelaide.Coresident partners aged over 65 years and other cores-idents over 70 were also invited to participate. TheCanberra Longitudinal Study (CLS; Christensen et al.,2004) randomly sampled community-dwelling residentsaged 70 years from the Australian Capital Territory andQueanbeyan.
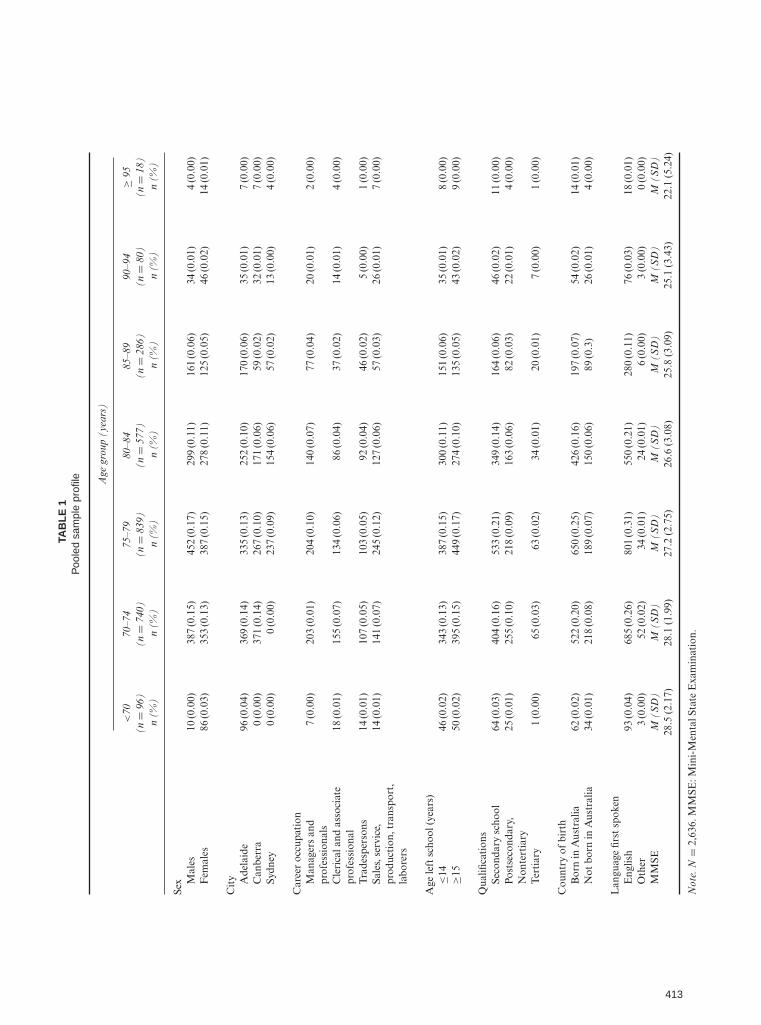
Pooled sample profile
Pooled baseline data from the three studies were usedto generate NART norms, which are based on observedNART scores for ALSA and CLS and predicted NARTscores for SOPS. The pooled sample (see Table 1) com-prised 2,636 participants (female = 51.1%). Of these,48.2% left secondary school at the age of 14 years oryounger, 73% were born in Australia, and 95% reportedEnglish as their first language. The average age was 77.8years (SD = 5.9, range: 64–103), and average score onthe Mini-Mental State Examination (MMSE) was 27.1(SD = 2.9). Baseline waves from the contributing studieswere contemporaneous, and NART data were obtainedbetween the years 1990 and 1993.
Measures
In SOPS, the Schonell was administered at both base-line and the first follow-up wave, with the NART beingadministered in the first follow-up wave only. The ALSAand the CLS each administered the NART on four mea-surement occasions; however, only baseline NART scoresare used for the generation of norms. The NART andSchonell were each scored as the number of words cor-rectly pronounced and ranged between 0 and 50.
Time-invariant covariates were obtained at baselineand included “sex” (0 = male, 1 = female), “language firstspoken” (0 = English, 1 = other), and “age left school.”A continuous measure of age left school was used totest whether education mediated the relation betweenthe NART and Schonell in SOPS. To ensure common-ality across studies when reporting norms, a harmonizedvariable for “age left school” was collapsed to a binarycoding (0 = 14 years or younger; 1 = 15 years or older).Time-varying covariates included “age at time of observa-tion” and MMSE scores (Folstein, Folstein, & McHugh,1975), which were used as an index of cognitive status.Covariates were chosen as candidates for inclusion in theimputation model because of their documented relationswith the NART and Schonell.
Analysis
Imputation of NART scores in SOPS
Baseline NART scores were imputed by conditionalordinary least squares mean imputation (Little & Rubin2002; McKnight, McKnight, Sidani, & Figueredo, 2007).Bivariate Pearson correlations were used to determineassociation between the Schonell, NART, and candi-date covariates. Covariates were mean centered to mini-mize multicollinearity. Backwards hierarchical regressionwas used to identify predictor covariates for inclusionin the imputation model, with both linear and nonlin-ear effects. Backwards regression is appropriate becausethe aim of this exploratory analysis is to identify theoptimal model for predicting NART scores, rather thanhypothesis testing. The NART was not imputed for cases
TAB
LE
1P
oole
dsa
mpl
epr
ofile Age
grou
p(y
ears
)
<70
(n=
96)
n(%
)
70–7
4(n
=74
0)n
(%)
75–7
9(n
=83
9)n
(%)
80–8
4(n
=57
7)n
(%)
85–8
9(n
=28
6)n
(%)
90–9
4(n
=80
)n
(%)
≥95
(n=
18)
n(%
)
Sex M
ales
10(0
.00)
387
(0.1
5)45
2(0
.17)
299
(0.1
1)16
1(0
.06)
34(0
.01)
4(0
.00)
Fem
ales
86(0
.03)
353
(0.1
3)38
7(0
.15)
278
(0.1
1)12
5(0
.05)
46(0
.02)
14(0
.01)
Cit
y Ade
laid
e96
(0.0
4)36
9(0
.14)
335
(0.1
3)25
2(0
.10)
170
(0.0
6)35
(0.0
1)7
(0.0
0)C
anbe
rra
0(0
.00)
371
(0.1
4)26
7(0
.10)
171
(0.0
6)59
(0.0
2)32
(0.0
1)7
(0.0
0)Sy
dney
0(0
.00)
0(0
.00)
237
(0.0
9)15
4(0
.06)
57(0
.02)
13(0
.00)
4(0
.00)
Car
eer
occu
pati
onM
anag
ers
and
prof
essi
onal
s7
(0.0
0)20
3(0
.01)
204
(0.1
0)14
0(0
.07)
77(0
.04)
20(0
.01)
2(0
.00)
Cle
rica
land
asso
ciat
epr
ofes
sion
al18
(0.0
1)15
5(0
.07)
134
(0.0
6)86
(0.0
4)37
(0.0
2)14
(0.0
1)4
(0.0
0)
Tra
desp
erso
ns14
(0.0
1)10
7(0
.05)
103
(0.0
5)92
(0.0
4)46
(0.0
2)5
(0.0
0)1
(0.0
0)Sa
les,
serv
ice,
prod
ucti
on,t
rans
port
,la
bore
rs
14(0
.01)
141
(0.0
7)24
5(0
.12)
127
(0.0
6)57
(0.0
3)26
(0.0
1)7
(0.0
0)
Age
left
scho
ol(y
ears
)≤1
446
(0.0
2)34
3(0
.13)
387
(0.1
5)30
0(0
.11)
151
(0.0
6)35
(0.0
1)8
(0.0
0)≥1
550
(0.0
2)39
5(0
.15)
449
(0.1
7)27
4(0
.10)
135
(0.0
5)43
(0.0
2)9
(0.0
0)
Qua
lifica
tion
sSe
cond
ary
scho
ol64
(0.0
3)40
4(0
.16)
533
(0.2
1)34
9(0
.14)
164
(0.0
6)46
(0.0
2)11
(0.0
0)Po
stse
cond
ary,
Non
tert
iary
25(0
.01)
255
(0.1
0)21
8(0
.09)
163
(0.0
6)82
(0.0
3)22
(0.0
1)4
(0.0
0)
Ter
tiar
y1
(0.0
0)65
(0.0
3)63
(0.0
2)34
(0.0
1)20
(0.0
1)7
(0.0
0)1
(0.0
0)
Cou
ntry
ofbi
rth
Bor
nin
Aus
tral
ia62
(0.0
2)52
2(0
.20)
650
(0.2
5)42
6(0
.16)
197
(0.0
7)54
(0.0
2)14
(0.0
1)N
otbo
rnin
Aus
tral
ia34
(0.0
1)21
8(0
.08)
189
(0.0
7)15
0(0
.06)
89(0
.3)
26(0
.01)
4(0
.00)
Lan
guag
efir
stsp
oken
Eng
lish
93(0
.04)
685
(0.2
6)80
1(0
.31)
550
(0.2
1)28
0(0
.11)
76(0
.03)
18(0
.01)
Oth
er3
(0.0
0)52
(0.0
2)34
(0.0
1)24
(0.0
1)6
(0.0
0)3
(0.0
0)0
(0.0
0)M
MSE
M(S
D)
M(S
D)
M(S
D)
M(S
D)
M(S
D)
M(S
D)
M(S
D)
28.5
(2.1
7)28
.1(1
.99)
27.2
(2.7
5)26
.6(3
.08)
25.8
(3.0
9)25
.1(3
.43)
22.1
(5.2
4)
Not
e.N
=2,
636.
MM
SE:M
ini-
Men
talS
tate
Exa
min
atio
n.
413
414 KIELY ET AL.
where concurrent Schonell data were unavailable; thispreserves missing data patterns that are conditional onfactors other than survey design, such as respondentcharacteristics. Conditional ordinary least squares meanimputation is attractive because it is simple, produces asingle estimate, is based on existing relations in the data,and provides more accurate estimates than unconditionalmean imputation or follow-up NART scores carriedbackward. Stochastic regression or multiple imputation,however, remain preferable as they provide more robustimputation procedures with closer approximations of theconditional distributions and, in the case of multipleimputation, account for the uncertainty of predicted val-ues (Graham, 2009; Little & Rubin, 2002; Schafer &Graham, 2002). For this reason, results of the condi-tional mean imputation procedure will be compared withmultiple imputation of five datasets.
Criteria for assessing imputed values
Criteria for the most reliable estimates were the fit ofdistribution properties, the shared variance between pre-dicted and observed NART scores, and the time-laggedassociations between the NART and Schonell within theSOPS sample.
Generation of norms
NART norms were reported for subgroups stratifiedby 5-year birth cohorts, sex, and a binary measure of ageleft school using harmonized baseline data from ALSA,CLS, and SOPS. Analysis of covariance (ANCOVA) wasused to test for study effects and to investigate the relationbetween the NART and sociodemographic variables.
Evaluation of age differences and age changes
Mixed models (Singer & Willett, 2003) were usedto estimate annualized within-person change in NARTscores to provide a comparison with age differencesin NART performance based on cross-sectional data.Unadjusted and adjusted (controlling for study, sex, ageleft school, and total MMSE) estimates were computedusing STATA 10 (2007).
RESULTS
Baseline NART prediction for SOPS
At follow-up for SOPS, NART scores (M = 25.96,SD = 9.98) were lower than the Schonell scores (M =35.47, SD = 10.7). The Schonell scores were not normallydistributed and were negatively skewed at both waves(baseline: –1.08; follow-up: –1.01). To correct for the neg-ative skew, a square root transformation was applied.After the transformation, Schonell scores had a skew of0.13 (SE = 0.11) at baseline and 0.36 (SE = 0.13) atfollow-up.
No sex differences in Schonell scores were observedat baseline (mean difference = 1.4; p = .14). At follow-up, however, males performed better than females onboth the NART (mean difference = 3.3, p < .001) andSchonell (mean difference = 2.8, p = .02). This differencein scores was thought to reflect the greater propensity oflower functioning males to drop out of the study dueto morbidity or mortality-related factors. We thereforeinvestigated sociodemographic differentials for mortalityand attrition. Chi square test revealed no sex differencesin attrition not associated with mortality (χ2 = 0.01,p = .94); however, males were more likely to die betweenbaseline and first follow-up (χ 2 = 13.9, p < .001). We alsoregressed a binary indicator of mortality prior to the firstfollow-up wave on age, sex, MMSE, and age left school.Participants who died between baseline and first follow-up were more likely to be older (odds ratio, OR = 1.1,SE = .03, p < .001), male (OR = 2.9, SE = .80, p <
.001) and score below 23 on the MMSE (OR = 1.8, SE= .57, p = .038). Age left school was not associated withmortality between baseline and first follow-up (OR = 1.2,SE = .30, p = .41).
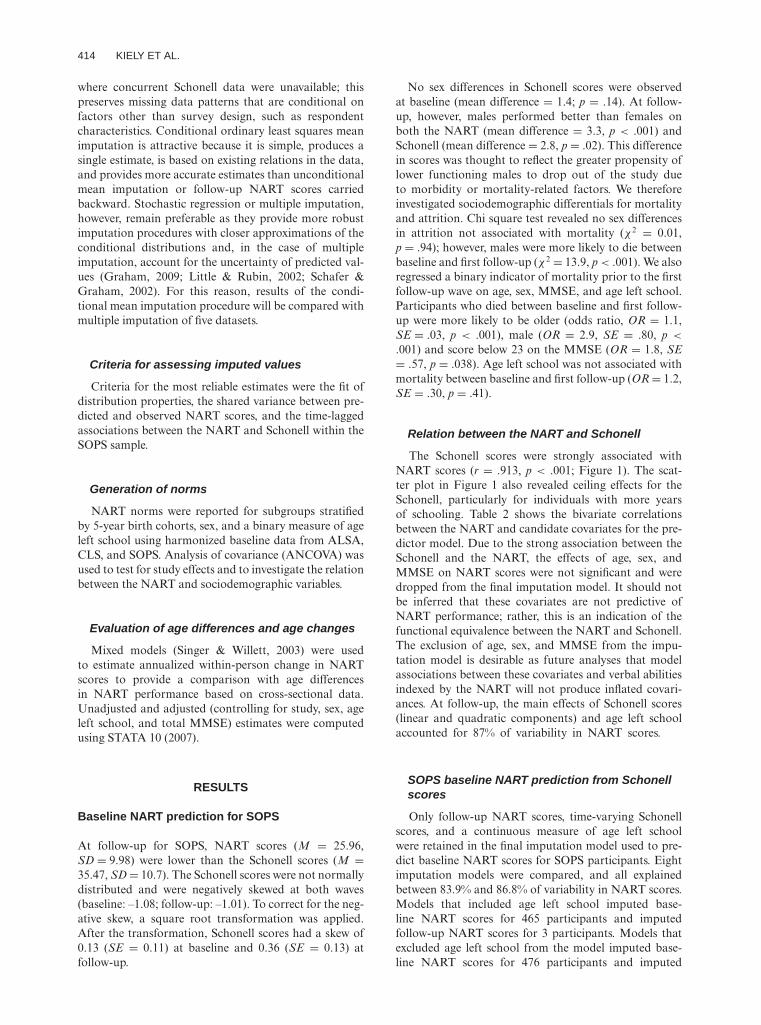
Relation between the NART and Schonell
The Schonell scores were strongly associated withNART scores (r = .913, p < .001; Figure 1). The scat-ter plot in Figure 1 also revealed ceiling effects for theSchonell, particularly for individuals with more yearsof schooling. Table 2 shows the bivariate correlationsbetween the NART and candidate covariates for the pre-dictor model. Due to the strong association between theSchonell and the NART, the effects of age, sex, andMMSE on NART scores were not significant and weredropped from the final imputation model. It should notbe inferred that these covariates are not predictive ofNART performance; rather, this is an indication of thefunctional equivalence between the NART and Schonell.The exclusion of age, sex, and MMSE from the impu-tation model is desirable as future analyses that modelassociations between these covariates and verbal abilitiesindexed by the NART will not produce inflated covari-ances. At follow-up, the main effects of Schonell scores(linear and quadratic components) and age left schoolaccounted for 87% of variability in NART scores.
SOPS baseline NART prediction from Schonellscores
Only follow-up NART scores, time-varying Schonellscores, and a continuous measure of age left schoolwere retained in the final imputation model used to pre-dict baseline NART scores for SOPS participants. Eightimputation models were compared, and all explainedbetween 83.9% and 86.8% of variability in NART scores.Models that included age left school imputed base-line NART scores for 465 participants and imputedfollow-up NART scores for 3 participants. Models thatexcluded age left school from the model imputed base-line NART scores for 476 participants and imputed
EQUIVALENCE AND NORMS OF WORD PRONOUNCIATION TASKS 415
Figure 1. Relation between NART (National Adult Reading Test) and Schonell scores. Scatter plot of raw NART and Schonell scoresby age left school for SOPS (Sydney Older Persons Study) at Wave 2 (r = .91, p < .001). The relationship is best modeled with both alinear and a quadratic component (r = .93, p < .001).
follow-up NART scores for 8 participants. Models thatdid not correct for the skew in Schonell scores system-atically underestimated NART scores for early school
TABLE 2Pairwise bivariate correlations between the NART,
Schonell, and covariates at follow-up for SOPS
NART Schonell√
Schonell MMSE ALScont
NART 1Schonellraw .91∗∗ 1√
Schonelltrans −.93∗∗ −.97∗∗ 1MMSE .52∗∗ .56∗∗ −.52∗∗ 1ALScont .31∗∗ .26∗∗ −.29∗∗ .03 1Age −.22∗∗ −.19∗∗ .19∗∗ −.22∗∗ −.09
Note. N = 345. MMSE: Mini-Mental State Examination.NART: National Adult Reading Test. SOPS: Sydney OlderPersons Study. ALScont: age left school, continuous measure;Schonellraw: raw Schonell scores; Schonelltrans: square-roottransformed Schonell scores.∗∗p < .01, two-tailed.
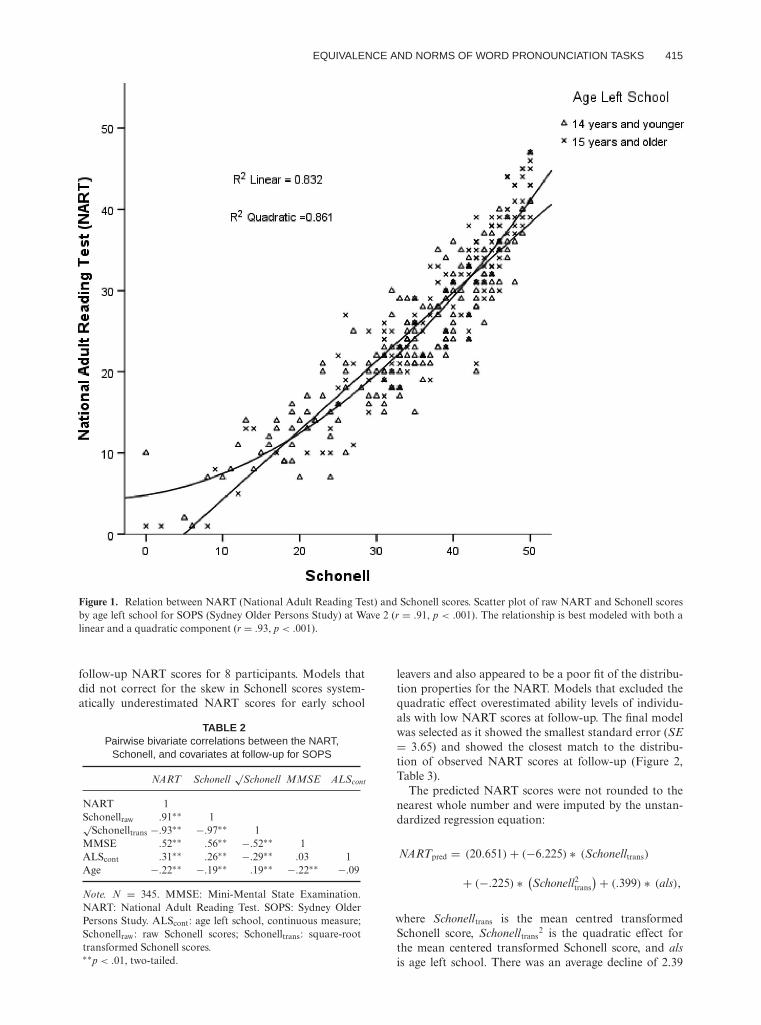
leavers and also appeared to be a poor fit of the distribu-tion properties for the NART. Models that excluded thequadratic effect overestimated ability levels of individu-als with low NART scores at follow-up. The final modelwas selected as it showed the smallest standard error (SE= 3.65) and showed the closest match to the distribu-tion of observed NART scores at follow-up (Figure 2,Table 3).
The predicted NART scores were not rounded to thenearest whole number and were imputed by the unstan-dardized regression equation:
NARTpred = (20.651) + (−6.225) ∗ (Schonelltrans)
+ (−.225) ∗ (Schonell2
trans
) + (.399) ∗ (als),
where Schonelltrans is the mean centred transformedSchonell score, Schonelltrans
2 is the quadratic effect forthe mean centered transformed Schonell score, and alsis age left school. There was an average decline of 2.39
416 KIELY ET AL.
Figure 2. Relation between predicted and observed NART (National Adult Reading Test) scores. Scatter plot of predicted (y-axis) andobserved NART (x-axis) scores for SOPS (Sydney Older Persons Study) Wave 2 (r = .93, p < .001).
points (SD = 4.81) in NART performance between base-line and follow-up (Myears = 2.9, SD = 0.3), comparedto an average decline of 2.61 points (SD = 4.77) onthe Schonell. The correlation between the NART andSchonell difference scores was r = .61 (p < .001), indi-cating a moderate to strong association in change overtwo waves between these two measures.
The variances and correlations between predicted andobserved NART and Schonell scores across both wavesare presented in Table 4. Correlations ranged between .85and .98. No significant differences were found betweenpredicted baseline NART scores estimated by imputa-tion (M = 28.22, SE = 0.44) or multiple imputation(M = 28.11, SE = 0.53), t(10) = 0.363, p = .725; r =.93, p < .001. It is evident that the final mean imputationmodel underestimated variability, as predicted NARTscores had a standard deviation of 9.38 at follow-up,whereas the actual NART standard deviation was 10.4.Further, the mean standard error was larger for estimatesderived from multiple imputation. This was not unex-pected and is a common problem of conditional meanimputation as predicted values do not deviate from theregression line (Graham, 2009). Baseline NART norms
for the SOPS sample are based on the values imputed byconditional mean imputation.
NART norms
Normative data
Only the CLS provided item-level data that could beused to investigate the psychometric properties of theNART. Reliability analysis for this sample revealed thatCronbach’s alpha was comparable across all age groupsand ranged from .85 to .93 (Table 5). This is gener-ally consistent with previous findings. For example Uttl(2002) reported alphas of .92, .94, and .93 for broad agecohorts (young, 18–39 years; middle-aged, 40–59 years;and older adults, 60–91 years, respectively). The relativelylower alpha of .85 reported for this sample was for theoldest age group (95+), which had a small sample size(n = 18) and comprised an age cohort not captured inthe Uttl (2002) sample. Luszcz et al. (1997) reported test–retest reliability of .83 across all ages ranging from 65to 103 years. Test–retest reliability is considered a more
EQUIVALENCE AND NORMS OF WORD PRONOUNCIATION TASKS 417
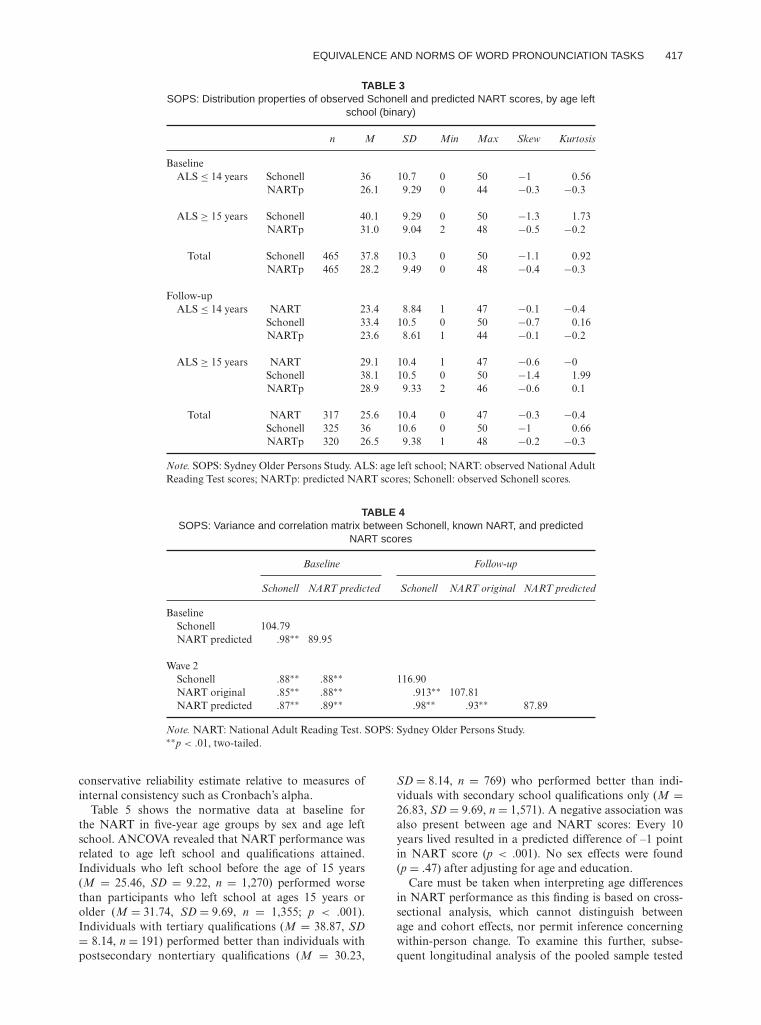
TABLE 3SOPS: Distribution properties of observed Schonell and predicted NART scores, by age left
school (binary)
n M SD Min Max Skew Kurtosis
BaselineALS ≤ 14 years Schonell 36 10.7 0 50 −1 0.56
NARTp 26.1 9.29 0 44 −0.3 −0.3
ALS ≥ 15 years Schonell 40.1 9.29 0 50 −1.3 1.73NARTp 31.0 9.04 2 48 −0.5 −0.2
Total Schonell 465 37.8 10.3 0 50 −1.1 0.92NARTp 465 28.2 9.49 0 48 −0.4 −0.3
Follow-upALS ≤ 14 years NART 23.4 8.84 1 47 −0.1 −0.4
Schonell 33.4 10.5 0 50 −0.7 0.16NARTp 23.6 8.61 1 44 −0.1 −0.2
ALS ≥ 15 years NART 29.1 10.4 1 47 −0.6 −0Schonell 38.1 10.5 0 50 −1.4 1.99NARTp 28.9 9.33 2 46 −0.6 0.1
Total NART 317 25.6 10.4 0 47 −0.3 −0.4Schonell 325 36 10.6 0 50 −1 0.66NARTp 320 26.5 9.38 1 48 −0.2 −0.3
Note. SOPS: Sydney Older Persons Study. ALS: age left school; NART: observed National AdultReading Test scores; NARTp: predicted NART scores; Schonell: observed Schonell scores.
TABLE 4SOPS: Variance and correlation matrix between Schonell, known NART, and predicted
NART scores
Baseline Follow-up
Schonell NART predicted Schonell NART original NART predicted
BaselineSchonell 104.79NART predicted .98∗∗ 89.95
Wave 2Schonell .88∗∗ .88∗∗ 116.90NART original .85∗∗ .88∗∗ .913∗∗ 107.81NART predicted .87∗∗ .89∗∗ .98∗∗ .93∗∗ 87.89
Note. NART: National Adult Reading Test. SOPS: Sydney Older Persons Study.∗∗p < .01, two-tailed.
conservative reliability estimate relative to measures ofinternal consistency such as Cronbach’s alpha.
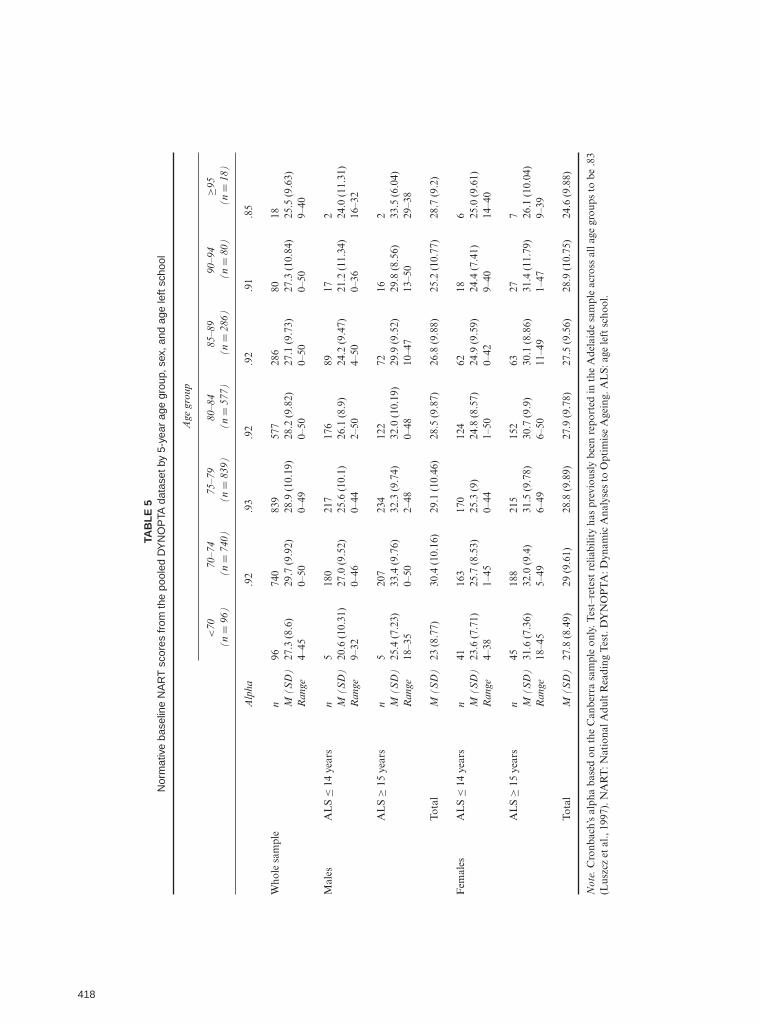
Table 5 shows the normative data at baseline forthe NART in five-year age groups by sex and age leftschool. ANCOVA revealed that NART performance wasrelated to age left school and qualifications attained.Individuals who left school before the age of 15 years(M = 25.46, SD = 9.22, n = 1,270) performed worsethan participants who left school at ages 15 years orolder (M = 31.74, SD = 9.69, n = 1,355; p < .001).Individuals with tertiary qualifications (M = 38.87, SD= 8.14, n = 191) performed better than individuals withpostsecondary nontertiary qualifications (M = 30.23,
SD = 8.14, n = 769) who performed better than indi-viduals with secondary school qualifications only (M =26.83, SD = 9.69, n = 1,571). A negative association wasalso present between age and NART scores: Every 10years lived resulted in a predicted difference of –1 pointin NART score (p < .001). No sex effects were found(p = .47) after adjusting for age and education.
Care must be taken when interpreting age differencesin NART performance as this finding is based on cross-sectional analysis, which cannot distinguish betweenage and cohort effects, nor permit inference concerningwithin-person change. To examine this further, subse-quent longitudinal analysis of the pooled sample tested
TAB
LE
5N
orm
ativ
eba
selin
eN
AR
Tsc
ores
from
the
pool
edD
YN
OP
TAda
tase
tby
5-ye
arag
egr
oup,
sex,
and
age
left
scho
ol
Age
grou
p
<70
(n=
96)
70–7
4(n
=74
0)75
–79
(n=
839)
80–8
4(n
=57
7)85
–89
(n=
286)
90–9
4(n
=80
)≥9
5(n
=18
)
Alp
ha.9
2.9
3.9
2.9
2.9
1.8
5
Who
lesa
mpl
en
9674
083
957
728
680
18M
(SD
)27
.3(8
.6)
29.7
(9.9
2)28
.9(1
0.19
)28
.2(9
.82)
27.1
(9.7
3)27
.3(1
0.84
)25
.5(9
.63)
Ran
ge4–
450–
500–
490–
500–
500–
509–
40
Mal
esA
LS
≤14
year
sn
518
021
717
689
172
M(S
D)
20.6
(10.
31)
27.0
(9.5
2)25
.6(1
0.1)
26.1
(8.9
)24
.2(9
.47)
21.2
(11.
34)
24.0
(11.
31)
Ran
ge9–
320–
460–
442–
504–
500–
3616
–32
AL
S≥
15ye
ars
n5
207
234
122
7216
2M
(SD
)25
.4(7
.23)
33.4
(9.7
6)32
.3(9
.74)
32.0
(10.
19)
29.9
(9.5
2)29
.8(8
.56)
33.5
(6.0
4)R
ange
18–3
50–
502–
480–
4810
–47
13–5
029
–38
Tota
lM
(SD
)23
(8.7
7)30
.4(1
0.16
)29
.1(1
0.46
)28
.5(9
.87)
26.8
(9.8
8)25
.2(1
0.77
)28
.7(9
.2)
Fem
ales
AL
S≤
14ye
ars
n41
163
170
124
6218
6M
(SD
)23
.6(7
.71)
25.7
(8.5
3)25
.3(9
)24
.8(8
.57)
24.9
(9.5
9)24
.4(7
.41)
25.0
(9.6
1)R
ange
4–38
1–45
0–44
1–50
0–42
9–40
14–4
0
AL
S≥
15ye
ars
n45
188
215
152
6327
7M
(SD
)31
.6(7
.36)
32.0
(9.4
)31
.5(9
.78)
30.7
(9.9
)30
.1(8
.86)
31.4
(11.
79)
26.1
(10.
04)
Ran
ge18
–45
5–49
6–49
6–50
11–4
91–
479–
39
Tota
lM
(SD
)27
.8(8
.49)
29(9
.61)
28.8
(9.8
9)27
.9(9
.78)
27.5
(9.5
6)28
.9(1
0.75
)24
.6(9
.88)
Not
e.C
ronb
ach’
sal
pha
base
don
the
Can
berr
asa
mpl
eon
ly.T
est–
rete
stre
liabi
lity
has
prev
ious
lybe
enre
port
edin
the
Ade
laid
esa
mpl
eac
ross
alla
gegr
oups
tobe
.83
(Lus
zcz
etal
.,19
97).
NA
RT
:Nat
iona
lAdu
ltR
eadi
ngT
est.
DY
NO
PT
A:D
ynam
icA
naly
ses
toO
ptim
ise
Age
ing.
AL
S:ag
ele
ftsc
hool
.
418
EQUIVALENCE AND NORMS OF WORD PRONOUNCIATION TASKS 419
for age trajectories of intraindividual change in NARTscore. Participants were assessed on the NART on up tofour occasions (M = 1.9), and the average time intervalbetween waves was 2.2 years (SD = 0.7; range 0.09–5.9).Unadjusted linear mixed models revealed an averagedecline in NART performance of 1.4 words correctly pro-nounced over 10 years (SE = 0.17, p < .001). However,after adjusting for study, sex, age left school (binary), andtotal MMSE score, the average rate of decline in NARTattenuated to 0.4 words correctly pronounced over 10years (SE = 0.17, p = .02).
Study differences
Differences in baseline NART performance acrossstudies were observed: The Canberra sample (M = 30.5,SD = 11.7) scored higher than both Sydney (M = 28.2,SD = 9.58, p < .001) and Adelaide (M = 27.52, SD =8.48, p < .001) samples. After adjusting for age, sex, ageleft school, qualifications attained, language first spoken,and MMSE, study differences were no longer presentbetween the estimated marginal means for the Sydneyand Canberra samples (p = .75), although lower perfor-mance for Adelaide participants remained (p < .001).
DISCUSSION
This study investigated the functional equivalence oftwo irregular word pronunciation tests and found thatthe Schonell and NART have a strong linear relation,with a slight curvilinear component. These findings indi-cate that NART scores can be estimated based on theSchonell and age left school. Given the strength of therelation between the tests, little benefit is gained fromadministering each measure concurrently aside fromthe opportunity to investigate their functional equiva-lence.
Imputation of baseline NART scores for SOPS par-ticipants ensures that NART norms reported for thispopulation are not biased by participative effects, attri-tion, or mortality. Although verbal abilities indexed bythe NART are not expected to decline with age, NARTperformance may decline in relation to disease or mor-tality processes (White & Cunningham, 1988). Thus,baseline estimates also lay the groundwork for futureinvestigations into individual differences in change ofNART scores. Salthouse (2009) has recently argued thatthe true extent of age-related declines in cognition willbe largely obscured in longitudinal studies that do notaccount for learning effects, to which verbal tasks arehighly susceptible. The use of alternate measures is oneapproach to minimizing these participative effects. Thispaper therefore joins a growing realization that identi-cal measures need not be applied across all measurementoccasions of longitudinal studies. Longitudinal analy-ses can be applied to changing scales of functionallyequivalent measures (McArdle et al., 2009) and bene-fit from planned missingness designs (Graham, Taylor,
& Cumsille, 2001). Although in this instance the oppor-tunity to investigate the functional equivalence of twomeasures of verbal abilities was largely serendipitous,researchers involved in the design of future longitudi-nal studies may wish to consider incorporating alternateforms of functionally equivalent measures across waves.
The second aim of this study was to combinethree large population-based studies to report norma-tive NART data with greater precision and representationof a broader national population. This is a key strengthof the study as historically normative NART data havebeen based on relatively small samples of recruited vol-unteers or from community groups via advertisementsand are not drawn from a random sample of the generalpopulation.
Our investigations confirmed that educational attain-ment is related to NART scores: Early school leaverssystematically performed worse than participants whocompleted secondary schooling. Likewise, those failingto obtain a postsecondary schooling qualification weremore likely to incorrectly pronounce irregular wordsthan individuals who did obtain further postsecondaryand tertiary qualifications. Sex did not account for anyvariability in NART scores after adjusting for sociode-mographics, which is consistent with previous findings.Contrary to reported norms for the North AmericanAdult Reading test (NAART), which show improvedNART performance in older adults (Strauss et al., 2006;Uttl, 2002), older adults were more likely to performworse than their younger counterparts in this study. Thisdifference, however, is most likely due to the greaterage range (18–91 years, n = 351) of the sample avail-able to Uttl than that in this study (65–103 years, n =2,636). Perhaps of greater interest is the gradual decreasein NART performance with age. Age-related rates ofdecline remained after adjusting for basic sociodemo-graphics and MMSE score, though they were greatlyreduced. We did not adjust for health, mortality, orother dementia risk factors, which may further accountfor age-related declines in verbal abilities, as this wasbeyond the scope of this study. However, as previouslymentioned, the possibility that true decline rates weremasked by practice effects cannot be discounted. Thus itis important to note that despite the strongly supportednotion of age stability for putative crystallized abilitiesin late adulthood (Baltes, Staudinger, & Lindenberger,1999), subtle declines in verbal abilities, as indexed bythe NART, may be expected in the general popula-tion.
The issue of cohort differences across studies is intrigu-ing as it does not arise in typical reports of norma-tive data that rely on single study samples. Even afteradjusting for sociodemographic and health variables, theAdelaide sample on average scored lower than the Sydneyand Canberra samples. This could be due to respondentcharacteristics not accounted for in the analyses, or studydifferences in administration protocols. Regardless of theunderling cause of these study differences in NART per-formance, this finding demonstrates a further advantageof analyzing harmonized and pooled data. The represen-tativeness of the broader national population is enhanced
420 KIELY ET AL.
while study-specific sample biases, which would otherwisebe undetected, are minimized.
Limitations
Although imputation by ordinary least squares regres-sion underestimated the variability in baseline NARTscores for SOPS participants, the comparable distribu-tions and strong association between the Schonell andNART indicate that this was of little consequence. Inthis context, little benefit was to be gained by predictingNART scores via more computationally and analyti-cally complex missing data methods such as multipleimputation.
Responses to individual items were not available for theNART and Schonell in two of the three studies, whichonly coded summed total scores. Absence of individualitem responses prevents reliability analyses, investigationof item characteristics, and the use of more robust tech-niques of harmonization such as those orientated by itemresponse theory. This is an important reminder of theimportance of having access to raw item-level data.
A possible shortcoming of this study is that theseNART norms do not include participants from a nonur-ban population. In addition, we do not report NARTnorms for adults under the age of 65 years and acknowl-edge the small cell counts for adults aged over 95 years.
In summary, this study successfully demonstrates thebenefits afforded by the harmonization of functionallyequivalent measures and reports NART norms for adultsaged 65 years and older that have increased precision andrepresentativeness than those previously available. Thesedata are of considerable clinical importance and will be ofsignificant value to clinicians and researchers who workwith older cohorts and apply the NART to obtain a proxyof premorbid verbal IQ and verbal functioning.
Original manuscript received 7 June 2010Revised manuscript accepted 17 September 2010
First published online 4 December 2010
REFERENCES
Anstey, K. J., Byles, J. E., Luszcz, M. A., Mitchell, P.,Steel, D., Booth, H., et al. (2010). Cohort profile:The Dynamic Analyses to Optimise Ageing (DYNOPTA)Project. International Journal of Epidemiology, 39, 44–51.
Anstey, K. J., Hofer, S. M., & Luszcz, M. (2003). A latent growthcurve analysis of late-life sensory and cognitive function over8 years: Evidence for specific and common factors underlyingchange. Psychology & Aging, 18, 714–726.
Baltes, P. B., Staudinger, U. M., & Lindenberger, U. (1999).Lifespan psychology: Theory and application to intellectualfunctioning. Annual Review of Psychology, 50, 471–507.
Christensen, H., Mackinnon, A., Jorm, A. F., Korten, A.,Jacomb, P., Hofer, S. M., et al. (2004). The CanberraLongitudinal Study: Design, aims, methodology, outcomesand recent empirical investigations. Aging, Neuropsychology,and Cognition, 11, 169–195.
Christensen, H., Mackinnon, A. J., Korten, A. E., Jorm, A. F.,Henderson, A. S., Jacomb, P., et al. (1999). An analysis ofdiversity in the cognitive performance of elderly communitydwellers: Individual differences in change scores as a functionof age. Psychology and Aging, 14, 365–379.
Crawford, J. R., Deary, I. J., Starr, J., & Whalley, L. J. (2001).The NART as an index of prior intellectual functioning:A retrospective validity study covering a 66-year interval.Psychological Medicine, 31, 451–458.
Crawford, J. R., Parker, D. M., Stewart, L. E., Besson,J. A. O., & De Lacey, G. (1989). Prediction of WAIS IQwith the National Adult Reading Test: Cross-validationand extension. British Journal of Clinical Psychology, 28,267–273.
Dyer, A. R. (1986). A method for combining results from severalprospective epidemiologic studies. Statistics in Medicine, 5,303–317.
Fastenau, P. S. (1998). Validity of regression-based norms: Anempirical test of the comprehensive norms with older adults.Journal of Clinical and Experimental Neuropsychology, 20,906–916.
Folstein, M. F., Folstein, S. E., & McHugh, P. R. (1975). “Mini-mental state”: A practical method for grading the cognitivestate of patients for the clinician. Journal of PsychiatricResearch, 12, 189–198.
Franzen, M. D. (2000). The assessment of child neuropsycholog-ical function. In M. D. Franzen (Ed.), Reliability and validityin neuropsychological assessment (2nd ed.). New York, NY:Kluwer Academic.
Graham, J. W. (2009). Missing data analysis: Making itwork in the real world. Annual Review of Psychology, 60,549–576.
Graham, J. W., Taylor, B. J., & Cumsille, P. E. (2001). Plannedmissing-data designs in analysis of change. In L. M. Collins& A. G. Sayer (Eds.), New methods for the analysis of change.Washington, USA: American Psychological Association.
Hofer, S. M., & Piccinin, A. M. (2009). Integrative data analysisthrough coordination of measurement and analysis proto-col across independent longitudinal studies. PsychologicalMethods, 14, 150–164.
Horn, J. L., & Cattell, R. B. (1967). Age differences in fluid andcrystallized intelligence. Acta Psychologica, 26, 107–129.
Little, R. J. A., & Rubin, D. B. (2002). Statistical analysis withmissing data (2nd ed.). Hoboken, NJ: Wiley.
Luszcz, M. A., Bryan, J., & Kent, P. (1997). Predictingepisodic memory performance of very old men and women:Contributions from age, depression, activity, cognitive abil-ity, and speed. Psychology and Aging, 12, 340–351.
Luszcz, M. A., Giles, L., Eckermann, S., Edwards, P.,Browne-Yung, K., & Hayles, C. (2007). The AustralianLongitudinal Study of Ageing: 15 years of ageing in SouthAustralia. Adelaide, Australia: South Australian Departmentof Families and Communities.
Mathias, J. L., Bowden, S. C., & Barrett-Woodbridge, M. (2007).Accuracy of the Wechsler Test of Adult Reading (WTAR)and National Adult Reading Test (NART) when estimatingIQ in a healthy Australian sample. Australian Psychologist,42, 49–56.
McArdle, J. J., Grimm, K. J., Hamagami, F., Bowles, R. P., &Meredith, W. (2009). Modeling life-span growth curves ofcognition using longitudinal data with multiple samples andchanging scales of measurement. Psychological Methods, 14,126–149.
McKnight, P. E., McKnight, K. M., Sidani, S., & Figueredo,A. J. (2007). Single imputation procedures. In P. E.McKnight, K. M. McKnight, S. Sidani, & A. J. Figueredo(Eds.), Missing data: A gentle introduction (pp. 173–195).New York, NY: Guilford Press.
Nelson, H. E. (1982). National Adult Reading Test. Windsor,UK: NFER-Nelson.
Nelson, H. E., & McKenna, P. (1975). The use of current readingability in the assessment of dementia. The British Journal ofSocial and Clinical Psychology, 14, 259–267.
Piguet, O., Grayson, D. A., Creasey, H., Bennett, H. P., Brooks,W. S., Waite, L. M., et al. (2003). Vascular risk factors, cogni-tion and dementia incidence over 6 years in the Sydney OlderPersons Study. Neuroepidemiology, 22(3), 165–171.
Pommerich, M., & Dorans, N. J. (2004). Linking scores viaconcordance: Introduction to the special issue. AppliedPsychological Measurement, 28, 216–218.
EQUIVALENCE AND NORMS OF WORD PRONOUNCIATION TASKS 421
Salthouse, T. A. (2004). Localizing age-related individual differ-ences in a hierarchical structure. Intelligence, 32, 541–561.
Salthouse, T. A. (2009). When does age-related cognitive declinebegin? Neurobiology of Aging, 30, 507–514.
Schafer, J. L., & Graham, J. W. (2002). Missing data: Our viewof the state of the art. Psychological Methods, 7, 147–177.
Schonell, F. (1942). Backwardness in the basic subjects. London,UK: Oliver & Boyd.
Singer, J. D., & Willett, J. B. (2003). Applied longitudinal dataanalysis modeling change and event occurrence. New York,NY: Oxford University Press.
Spreen, O., & Strauss, E. (1998). A compendium of neuropsy-chological tests: Administration, norms and commentary (2nded.). New York, NY: Oxford University Press.
StataCorp. (2007). Stata Statistical Software: Release 10. CollegeStation, TX: StataCorp.
Strauss, E., Sherman, E. M. S., & Spreen, O. (2006). A com-pendium of neuropsychological tests: Administration, norms,
and commentary (3rd ed.). New York, NY: Oxford UniversityPress.
Tombaugh, T. N., & Hubiey, A. M. (1997). The 60-itemBoston Naming Test: Norms for cognitively intact adultsaged 25 to 88 years. Journal of Clinical and ExperimentalNeuropsychology, 19, 922–932.
Uttl, B. (2002). North American Adult Reading Test: Agenorms, reliability, and validity. Journal of Clinical andExperimental Neuropsychology, 24, 1123–1137.
van Buuren, S., Eyres, S., Tennant, A., & Hopman-Rock, M.(2005). Improving comparability of existing data byresponse conversion. Journal of Official Statistics, 21,53–72.
Wechsler, D. (1955). Manual for the Wechsler Adult IntelligenceScale. New York, NY: The Psychological Corporation.
White, N., & Cunningham, W. R. (1988). Is terminal droppervasive or specific? Journal of Gerontology: PsychologicalSciences, 43, 141–144.