Embed Size (px)
Citation preview

Appl Microbiol Biotechnol (2003) 60:594–600DOI 10.1007/s00253-002-1165-7
O R I G I N A L P A P E R
H. Futamata · S. Harayama · A. Hiraishi · K. Watanabe
Functional and structural analyses of trichloroethylene-degradingbacterial communities under different phenol-feeding conditions:laboratory experiments
Received: 26 June 2002 / Revised: 19 September 2002 / Accepted: 4 October 2002 / Published online: 14 December 2002� Springer-Verlag 2002
Abstract The effects of different phenol-feeding condi-tions on trichloroethylene (TCE) biodegradation andbacterial population structure in an aquifer soil commu-nity were studied. The soil sample, minerals, phenol, andTCE were mixed in glass bottles, which were thenincubated under three different phenol-feeding conditions.First, phenol was supplied only once at 0.2 mM (condition0.2P); second, it was added at 2.0 mM (condition 2.0P);and third, it was periodically supplied ten times at 0.2 mM(condition 0.2PS). TCE concentrations remained stableunder conditions 0.2P and 2.0P. In contrast, TCE wascompletely degraded under condition 0.2PS. TCE/phenol-degrading bacteria were enumerated indirectly and func-tionally by quantitative PCR. The low-Ks (half saturationconstant) group of phenol-degrading bacteria, exhibitinghigh TCE-degrading activity, yielded a 50-fold higherpopulation under condition 0.2PS than under condition2.0P. The bacterial community structure under condition0.2PS was studied by denaturing gradient gel electropho-resis targeting the genes encoding 16S rRNA and thelargest subunit of multicomponent phenol hydroxylase.Sequence analysis of the major bands detected indicatedthe predominance of the low-Ks group of TCE/phenol-degrading bacteria belonging to b-Proteobacteria. Theseresults suggest that continuous supplementation withphenol at a low concentration increases the populationof the low-Ks group of TCE/phenol-degrading bacteria.
Introduction
Trichloroethylene (TCE) is a volatile chlorinated organiccompound widely used as a solvent and degreasing agent.Because of uninformed disposal practices for spentsolvents in the past, TCE has become a major contam-inant of groundwater and soil, and this situation hasbrought about a serious environmental issue of publicconcern. A promising approach to solving this problem isbioremediation using TCE-degrading bacteria. For thispurpose, many strains of TCE-degrading bacteria havebeen isolated and characterized. In addition, several fieldtrials of TCE bioremediation have been reported (Hopkinset al. 1993a, Hopkins and McCarty 1995; Baker et al.2001; Tani et al. 2002). Since TCE is degradedcometabolically by aliphatic and aromatic hydrocarbon-degrading bacteria (Ensley 1991; Semprini 1997), eitherphenol, toluene, or methane have been injected as inducedsubstrates to facilitate degradation of TCE by indigenousmicroorganisms (Semprini et al. 1990, 1991; Hopkins etal. 1993a, b; Hopkins and McCarty 1995; McCarty et al.1998; Baker et al. 2001).
However, since the degradative enzymes prefer theseinduced substrates rather than TCE in general, TCE is notalways efficiently degraded in the presence of inducerssuch as phenol (Futamata et al. 2001a). Only some strainsof phenol-degrading bacteria exhibit high TCE-degradingactivities, but in both ‘high’- and ‘low’-degraders,degradation of TCE competes with degradation of phenol(Fries et al. 1997b; Futamata et al. 2001a). Thesecompetitive relationships between TCE and phenol asthe substrate and between the high and low degradersdecrease the efficiency of biostimulation. Thus, obviationof competitive inhibition is an important subject of studyin this research area (Hopkins et al. 1993b; Mu and Scow1994; Futamata et al. 2001a). In this context, the effect ofinduced substrates on microbial communities and TCEdegradation have been studied (Fan and Scow 1993; Muand Scow 1994; Fuller et al. 1995; Shih et al. 1996; Frieset al. 1997a, b; Mars et al. 1998). To date, however, littleis known about what kinds of bacteria in natural
H. Futamata ()) · A. HiraishiDepartment of Ecological Engineering,Toyohashi University of Technology, Aichi 441–8580, Japane-mail: [email protected].: +81-532-446912Fax: +81-532-446929
H. Futamata · S. Harayama · K. WatanabeMarine Biotechnology Institute, Kamaishi Laboratories, Kamaishi,Iwate 026–0001, Japan

environments play a major role for TCE degradation withaddition of phenol. Furthermore, although injection ofmethane has been carried out most frequently, phenol hasshown to be relatively more effective at removing TCEand cis-dichloroethylene (Hopkins et al. 1993b; Fries etal. 1997a). These studies have proposed phenol to be aneffective cosubstrate for TCE bioremediation, althoughphenol addition may be questioned since chlorination ofgroundwater containing phenol produces chlorinatedphenols that cause taste and odor problems, and phenolis categorized as a harmful chemical compound. Hence, itis important to investigate more effective and saferfeeding conditions of phenol with regard to removal ofTCE.
Studies on both kinetics for TCE- and phenol-degra-dation are essential for our comprehensive understandingof TCE bioremediation utilizing the cometabolic activi-ties of phenol-degrading bacteria. In our previous study,kinetic parameters for TCE and phenol were analyzedusing various phenol-degrading bacteria (Futamata et al.2001a). As a result of this study, a positive correlationwas observed between the half saturation constant (Ks)values for TCE and phenol, and TCE/phenol-degradingbacteria were categorized into three groups with respectto their affinities to both substrates, i.e., low-, moderate-,and high-Ks groups. The application of different concen-trations of phenol to in situ biostimulation for TCEremoval may stimulate different groups of phenol-degrading bacteria. Hence, this study was undertaken toinvestigate changes in TCE degradation patterns inresponse to different concentrations of phenol using anaquifer soil. Competitive population dynamics of the low-Ks group and the high-Ks group of bacteria weremonitored by a quantitative PCR method using specificsets of primers (Futamata et al. 2001b). Bacterialcommunity changes were also analyzed by the denaturinggel gradient electrophoresis (DGGE) technique, targetingthe genes encoding 16S rRNA and the large subunit ofphenol hydroxylase (LmPH).
Materials and methods
Soil sample
A soil sample was collected from a pristine sandy aquifer at a depthof between 10 and 10.5 m upstream of a TCE-contaminated site(Kururi, Chiba, Japan), near the TCE-bioremediation site (Hanadaet al. 1998; Baker et al. 2001; Futamata et al. 2001a, b)
TCE degradation
Wet soil sample (8 g), 1.0 ml MP medium (Watanabe et al. 1998) asinorganic nutrients, and phenol were put into a glass bottle (33-mlcapacity) that was then capped with a Teflon-lined rubber septumand sealed with an aluminum crimp seal. Since Shifang and Scow(1993) have demonstrated that the soil moisture content affectsTCE-degradation by soil microorganisms, the soil moisturecontents of samples were adjusted to approximately equivalentlevels. In the control condition, 1.0 ml deionized H2O was addedinstead of MP medium. The sterilized soil was prepared by an
autoclave treatment for 60 min at 121�C. The volume of mixedsample was approximately 5 cm3. TCE was injected with amicrosyringe through the septum to give an initial TCE concen-tration of 4.0 �M. The bottle was placed in a water bath at 20�C,and the TCE concentration was determined at appropriate intervalsby gas chromatography as described previously (Futamata et al.2001a).
Different phenol-feeding conditions were used in this study.First, phenol was supplied only once to a final concentration of0.2 mM in soil solution (condition 0.2P); second, it was added to2.0 mM in soil solution (condition 2.0P); and third, it wasperiodically supplied at 0.2 mM each time at 1 day intervals withthe exception of day 2 and day 3 (condition 0.2PS). Undercondition 0.2PS, phenol was supplied with a microsyringe throughthe septum and the TCE concentration was measured beforeaddition of phenol. To discriminate whether the decrease of TCE isdue to biodegradation or volatilization, the TCE concentration of5 ml control samples without soil containing the TCE solution at4.0 �M, were also measured under conditions 0.2P, 2.0P, and0.2PS. Decreases of 1–3% in the initial TCE concentration wereobserved.
Enumeration of viable cells and phenol-degrading bacteria
Viable bacteria were enumerated by the agar plating method. Soilsample (1 g) was diluted with 10 mM phosphate-potassium buffer(pH 7.0). The diluted soil solutions were spread onto agar platescontaining one-tenth-strength TSB medium (Difco), which isusually used for counting of soil bacteria. The plates wereincubated at 25�C for 14 days before the final recording ofcolony-forming units (cfu).
Phenol-degrading bacteria were enumerated indirectly by acompetitive PCR method (q-PCR) as described previously (Futa-mata et al. 2001b). For PCR use, bulk DNA was extracted from5.0 g (wet wt) of soil sample according to Zhou et al. (1996) asmodified in Futamata et al. (2001a). Three cycles of the freeze-thaw treatment (Sprott et al. 1994) were performed after the initialsodium dodecyl sulfate lysis step. Final DNA purification wasconducted with a Suprec-2 column (Takara Shuzo, Otsu, Japan).Our previous study showed that phenol-degrading bacterial com-munities can be classified into three groups with respect to theiraffinities for TCE and phenol, i.e., the low-Ks, high-Ks andmoderate/high-Ks groups (Futamata et al. 2001a). The low-Ks groupexhibits high affinities for TCE and phenol, and high TCE-degrading activity at 3.8 �M of TCE, with the correspondingaffinities and activities being low for the high-Ks group. SpecificPCR primers developed for monitoring these different groups(Futamata et al. 2001b) were used for q-PCR in this study. Thepopulation ratio of the high-Ks group to the low-Ks group wasexpressed as the competitive inhibition value.
DGGE analysis
Bacterial community structures were analyzed by DGGE targeting16S rDNA and the gene encoding LmPH. Variable region V3 ofbacterial 16S rDNA (corresponding to positions 341–534 in theEscherichia coli sequence) was amplified with primers P2 and P3(containing a 40-bp GC clamp (Muyzer et al. 1993). The LmPHgenes were amplified using primers Phe149GC and Phe212 and aProgene thermal cycler (Techne) as described previously (Watan-abe et al. 1998). The Dcode DGGE system (Bio-Rad) was used forelectrophoresis as recommended by the manufacturer. PCR-ampli-fied mixture (10 �l) was subjected to electrophoresis in a 10% (w/v)polyacrylamide gel at 200 V for 3.5 h. Gel gradients used forseparation were 30–50% for the 16S rDNA fragments and 40–60%for LmPH gene fragments; these gradients were applied in parallelto the direction of electrophoresis. After electrophoresis, the gelwas stained with SYBR Green I (FMC Bioproducts, Rockland,) for30 min as recommended by the manufacturer. The nucleotide
595
sequences of DGGE bands were determined as described previ-ously (Watanabe et al. 1998).
Nucleotide sequence analysis
Homology searches were conducted using the BLAST program(Altschul et al. 1997). The sequences determined in this study andthose retrieved from the DDBJ/EMBL/GenBank database werealigned using Clustal W, version 1.7 (Thompson et al. 1994) andrefined manually. Neighbor-joining trees (Saitou and Nei 1987)were constructed using the NJplot program in Clustal W, version1.7. Nucleotide positions at which sequences had gaps, but notambiguous bases, were included in the calculations for 16S rDNA.Nucleotide positions at which any sequence had a gap or anambiguous base were not included in the calculations for LmPHsequences.
Accession number
The nucleotide sequences reported in this study have beendeposited in the DDBJ, EMBL, and GenBank nucleotide sequencedatabases under accession numbers AB080318–AB080340.
Results
Comparison of TCE-degrading patterns
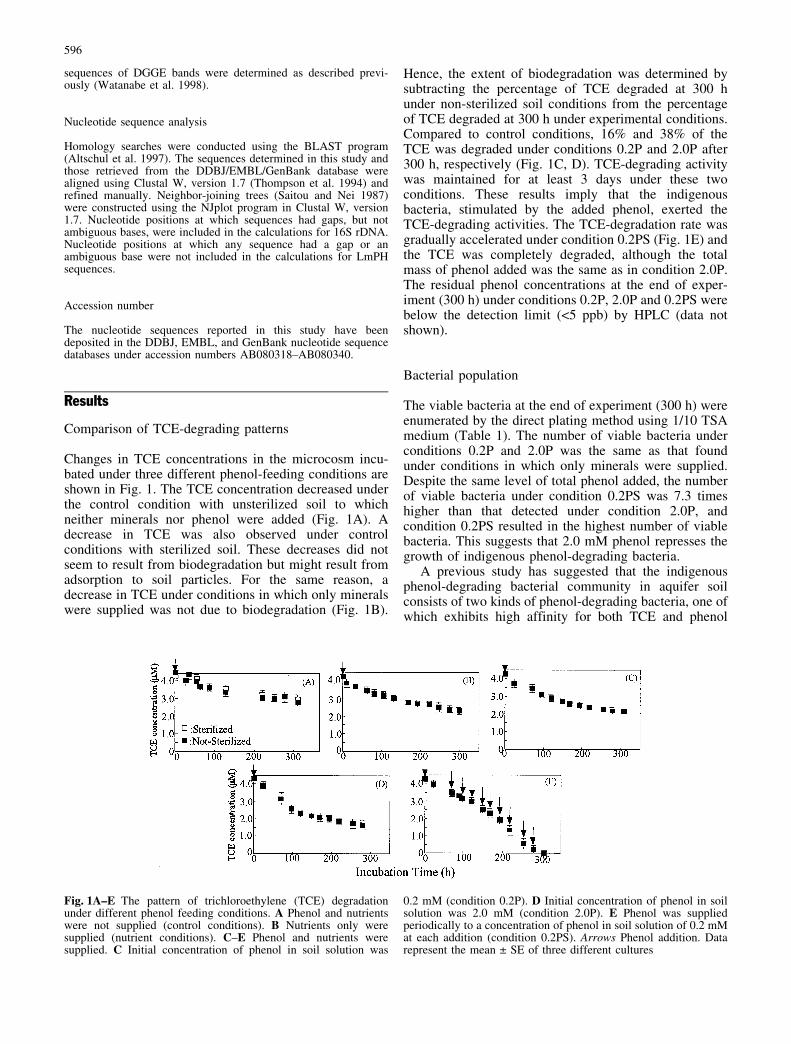
Changes in TCE concentrations in the microcosm incu-bated under three different phenol-feeding conditions areshown in Fig. 1. The TCE concentration decreased underthe control condition with unsterilized soil to whichneither minerals nor phenol were added (Fig. 1A). Adecrease in TCE was also observed under controlconditions with sterilized soil. These decreases did notseem to result from biodegradation but might result fromadsorption to soil particles. For the same reason, adecrease in TCE under conditions in which only mineralswere supplied was not due to biodegradation (Fig. 1B).
Hence, the extent of biodegradation was determined bysubtracting the percentage of TCE degraded at 300 hunder non-sterilized soil conditions from the percentageof TCE degraded at 300 h under experimental conditions.Compared to control conditions, 16% and 38% of theTCE was degraded under conditions 0.2P and 2.0P after300 h, respectively (Fig. 1C, D). TCE-degrading activitywas maintained for at least 3 days under these twoconditions. These results imply that the indigenousbacteria, stimulated by the added phenol, exerted theTCE-degrading activities. The TCE-degradation rate wasgradually accelerated under condition 0.2PS (Fig. 1E) andthe TCE was completely degraded, although the totalmass of phenol added was the same as in condition 2.0P.The residual phenol concentrations at the end of exper-iment (300 h) under conditions 0.2P, 2.0P and 0.2PS werebelow the detection limit (<5 ppb) by HPLC (data notshown).
Bacterial population
The viable bacteria at the end of experiment (300 h) wereenumerated by the direct plating method using 1/10 TSAmedium (Table 1). The number of viable bacteria underconditions 0.2P and 2.0P was the same as that foundunder conditions in which only minerals were supplied.Despite the same level of total phenol added, the numberof viable bacteria under condition 0.2PS was 7.3 timeshigher than that detected under condition 2.0P, andcondition 0.2PS resulted in the highest number of viablebacteria. This suggests that 2.0 mM phenol represses thegrowth of indigenous phenol-degrading bacteria.
A previous study has suggested that the indigenousphenol-degrading bacterial community in aquifer soilconsists of two kinds of phenol-degrading bacteria, one ofwhich exhibits high affinity for both TCE and phenol
Fig. 1A–E The pattern of trichloroethylene (TCE) degradationunder different phenol feeding conditions. A Phenol and nutrientswere not supplied (control conditions). B Nutrients only weresupplied (nutrient conditions). C–E Phenol and nutrients weresupplied. C Initial concentration of phenol in soil solution was
0.2 mM (condition 0.2P). D Initial concentration of phenol in soilsolution was 2.0 mM (condition 2.0P). E Phenol was suppliedperiodically to a concentration of phenol in soil solution of 0.2 mMat each addition (condition 0.2PS). Arrows Phenol addition. Datarepresent the mean € SE of three different cultures
596

(low-Ks group) and the other low affinity for bothsubstrates (high-Ks group) (Futamata et al. 2001b). Thesetwo groups of bacterial populations were quantified usinga competitive PCR method with specific sets of PCRprimers (Table 1). The phenol-feeding manner, i.e., thenumber and interval of additions, and concentration ofphenol, was related to the changing pattern in the groups.The population density of the high-Ks group was 14 and26 times higher than that of the low-Ks group underconditions 0.2P and 2.0P, respectively. The ratio of thehigh-Ks group to the low-Ks group (the competitiveinhibition value) was 0.98 under condition 0.2PS. Thepopulation density of the low-Ks group was between 10and 50 times lower in condition 2.0P than in conditions0.2P and 0.2PS. These results suggest that higherconcentrations of phenol inhibit the growth of theindigenous low-Ks group that play an important role foreffective biostimulation, and that condition 0.2PS is themost useful in obviating competitive inhibition, therebystimulating TCE removal.
Bacterial community analysis
The effect of different phenol-feeding conditions on thebacterial community structure in the aquifer soil micro-cosm was studied by DGGE targeting 16S rRNA andLmPH genes (Fig. 2). The major amplified DGGE bandswere analyzed (Table 2, Fig. 3). Several bands at the samegradient position were excised from profiles from differ-ent conditions and sequenced to confirm their identities.In previous studies, members of the high-Ks (TCE lowdegraders) and low-Ks groups (TCE high degraders) werefound to be affiliated with g- and b-Proteobacteria,respectively (Futamata et al. 2001b). DGGE analysisusing 16S rDNA indicated that the major amplified bandsbelonged to g-Proteobacteria (DGGE bands S6 and S7) incondition 2.0P and to b-Proteobacteria (DGGE bandsS15, S16 and S17) in condition 0.2PS (Fig. 2A). DGGEanalysis using the LmPH gene indicated that some majorbands were observed in condition 0.2PS where TCE wascompletely degraded. Band M11, one of the major LmPHbands detected, was functionally affiliated with theVariovorax strains that have previously been reported toexhibit extremely high TCE-degrading activities (Futa-mata et al. 2001b) (Fig. 3B). One or two of the majorDGGE bands were observed under the other conditions,
and all these bands were assigned to the low-Ks group(Fig. 3B). While the 16S rDNA-targeted DGGE analysisdemonstrated the predominance of the high-Ks group ofbacteria, the LmPH-DGGE analysis could not. The reasonfor this is unknown with certainty, but one can assumethat the PCR primers used are unsuitable for LmPH geneamplification.
Fig. 2A, B Denaturing gradient gel electrophoresis (DGGE) profileof 16S rRNA and large subunit of phenol hydroxylase (LmPH)gene fragments after PCR amplification from soil DNA. A DGGEprofiles (gel gradient 30–50%) of the partial 16S rDNA fragments,showing changes in major bacterial populations. Left panel Gelimage; right panel drawing of DGGE gel, showing the bandsexcised for sequence analysis. B DGGE profiles (gel gradient 40–60%) of the partial gene fragments encoding LmPH, showingchanges in major bacterial populations. Left panel Gel image; rightpanel drawing of DGGE gel, showing the bands excised forsequence analysis. Lanes: 1 Control conditions (not-sterilized), 2nutrient conditions, 3 condition 0.2P, 4 condition 2.0P, 5 condition0.2PS
Table 1 Comparison of bacte-rial cell number under the dif-ferent phenol feedingconditions. Ks Half saturationconstant
Condition Viable cells(cfu/g soil)
Phenol-degrading bacterial copies/g soil Competitiveinhibition valuea
Low-Ks group High-Ks group
Control 6.6€0.2�106 8.0€2.0�104 1.5€0.5�104 1.9Minerals 4.6€0.4�107 2.1€0.7�104 1.6€0.4�105 7.70.2P 3.0€0.2�107 1.5€0.5�106 2.1€0.7�107 14.02.0P 3.3€0.4�107 1.5€1.2�105 3.8€1.7�106 26.00.2PS 2.4€0.3�108 8.0€2.7�106 7.8€2.3�106 0.98
a Population ratio of high-Ks group to low-Ks group
597
Discussion
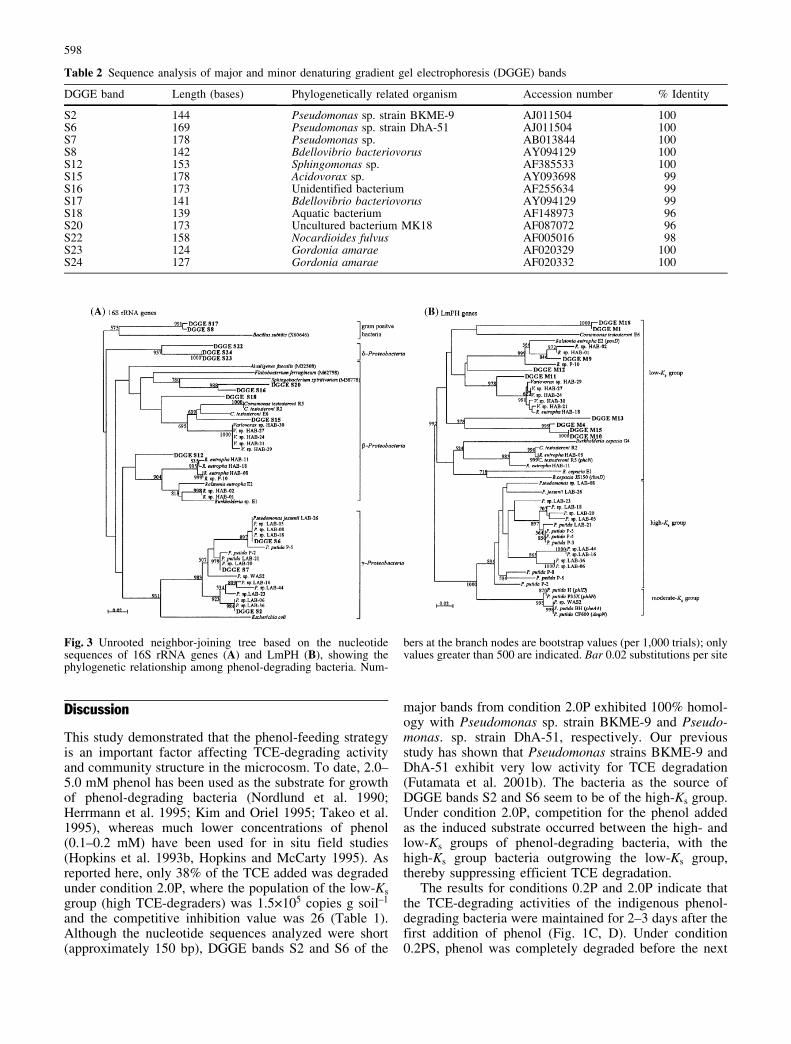
This study demonstrated that the phenol-feeding strategyis an important factor affecting TCE-degrading activityand community structure in the microcosm. To date, 2.0–5.0 mM phenol has been used as the substrate for growthof phenol-degrading bacteria (Nordlund et al. 1990;Herrmann et al. 1995; Kim and Oriel 1995; Takeo et al.1995), whereas much lower concentrations of phenol(0.1–0.2 mM) have been used for in situ field studies(Hopkins et al. 1993b, Hopkins and McCarty 1995). Asreported here, only 38% of the TCE added was degradedunder condition 2.0P, where the population of the low-Ksgroup (high TCE-degraders) was 1.5�105 copies g soil–1
and the competitive inhibition value was 26 (Table 1).Although the nucleotide sequences analyzed were short(approximately 150 bp), DGGE bands S2 and S6 of the
major bands from condition 2.0P exhibited 100% homol-ogy with Pseudomonas sp. strain BKME-9 and Pseudo-monas. sp. strain DhA-51, respectively. Our previousstudy has shown that Pseudomonas strains BKME-9 andDhA-51 exhibit very low activity for TCE degradation(Futamata et al. 2001b). The bacteria as the source ofDGGE bands S2 and S6 seem to be of the high-Ks group.Under condition 2.0P, competition for the phenol addedas the induced substrate occurred between the high- andlow-Ks groups of phenol-degrading bacteria, with thehigh-Ks group bacteria outgrowing the low-Ks group,thereby suppressing efficient TCE degradation.
The results for conditions 0.2P and 2.0P indicate thatthe TCE-degrading activities of the indigenous phenol-degrading bacteria were maintained for 2–3 days after thefirst addition of phenol (Fig. 1C, D). Under condition0.2PS, phenol was completely degraded before the next
Table 2 Sequence analysis of major and minor denaturing gradient gel electrophoresis (DGGE) bands
DGGE band Length (bases) Phylogenetically related organism Accession number % Identity
S2 144 Pseudomonas sp. strain BKME-9 AJ011504 100S6 169 Pseudomonas sp. strain DhA-51 AJ011504 100S7 178 Pseudomonas sp. AB013844 100S8 142 Bdellovibrio bacteriovorus AY094129 100S12 153 Sphingomonas sp. AF385533 100S15 178 Acidovorax sp. AY093698 99S16 173 Unidentified bacterium AF255634 99S17 141 Bdellovibrio bacteriovorus AY094129 99S18 139 Aquatic bacterium AF148973 96S20 173 Uncultured bacterium MK18 AF087072 96S22 158 Nocardioides fulvus AF005016 98S23 124 Gordonia amarae AF020329 100S24 127 Gordonia amarae AF020332 100
Fig. 3 Unrooted neighbor-joining tree based on the nucleotidesequences of 16S rRNA genes (A) and LmPH (B), showing thephylogenetic relationship among phenol-degrading bacteria. Num-
bers at the branch nodes are bootstrap values (per 1,000 trials); onlyvalues greater than 500 are indicated. Bar 0.02 substitutions per site
598
addition of phenol (data not shown). These results suggestthat TCE-degrading activity is always expressed undercondition 0.2PS. Although the population density of thelow-Ks group under condition 0.2PS was only 5.3 timeshigher than that seen under condition 0.2P, the twomicrocosms were significantly different in the efficacy ofTCE-degradation (Fig. 1C, E). These results demonstratethat although the population density of the low-Ks group,which plays a major role in TCE degradation, was lowerthan that of TCE-degraders used in bioaugmentation(Tani et al. 2002), TCE was removed effectively byobviation of competitive inhibition and the maintenanceof TCE-degrading activity.
Interestingly, although the amount of phenol undercondition 2.0P was the same as that found under condition0.2PS, the bacterial community structures under the twoconditions differed (Fig. 2). One of the major amplifiedbands in the 0.2PS microcosm was functionally close toVariovorax sp., which exhibit extremely high TCE-degrading activities (Futamata et al. 2001b). These resultssuggested that the pulse feeding of phenol at lowconcentrations encouraged the growth of specific groups,namely low-Ks groups with extremely high TCE-degrad-ing activity, in diverged indigenous microorganisms.
In conclusion, the pulse feeding of the substrate at alow concentration may obviate competitive inhibition andgrowth inhibition, thereby allowing efficient TCE re-moval. Further study is clearly necessary to investigatechanges in population densities of both total bacteria andthe functional bacteria actually contributing to TCEdegradation under conditions of phenol limitation. Thissubject is currently under investigation in our laboratory.
Acknowledgements We thank Sachiko Kawasaki for technicalassistance. This work was performed under the management of theResearch Institute of Innovative Technology for the Earth as a partof the Research and Development Project on In Situ SoilBioremediation supported by the New Energy and IndustrialTechnology Development Organization (NEDO), and was support-ed in part by a grand-in-aid from the Ministry of the Environment,Japan (no. K1433).
References
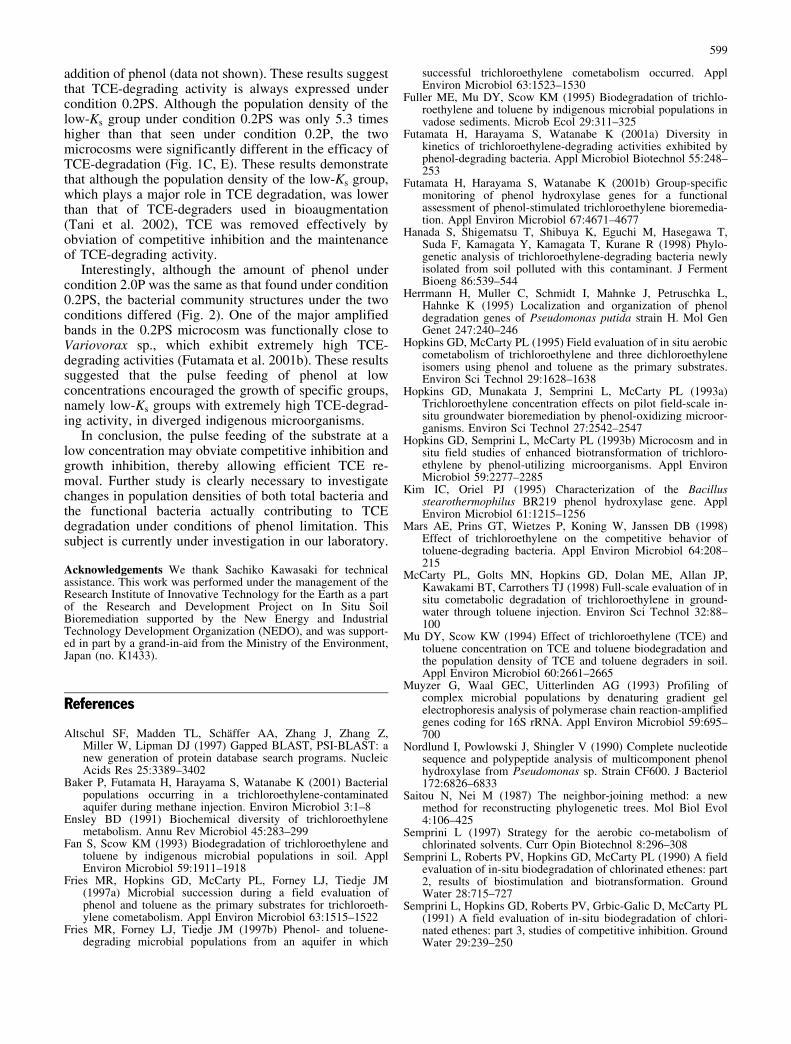
Altschul SF, Madden TL, Sch�ffer AA, Zhang J, Zhang Z,Miller W, Lipman DJ (1997) Gapped BLAST, PSI-BLAST: anew generation of protein database search programs. NucleicAcids Res 25:3389–3402
Baker P, Futamata H, Harayama S, Watanabe K (2001) Bacterialpopulations occurring in a trichloroethylene-contaminatedaquifer during methane injection. Environ Microbiol 3:1–8
Ensley BD (1991) Biochemical diversity of trichloroethylenemetabolism. Annu Rev Microbiol 45:283–299
Fan S, Scow KM (1993) Biodegradation of trichloroethylene andtoluene by indigenous microbial populations in soil. ApplEnviron Microbiol 59:1911–1918
Fries MR, Hopkins GD, McCarty PL, Forney LJ, Tiedje JM(1997a) Microbial succession during a field evaluation ofphenol and toluene as the primary substrates for trichloroeth-ylene cometabolism. Appl Environ Microbiol 63:1515–1522
Fries MR, Forney LJ, Tiedje JM (1997b) Phenol- and toluene-degrading microbial populations from an aquifer in which
successful trichloroethylene cometabolism occurred. ApplEnviron Microbiol 63:1523–1530
Fuller ME, Mu DY, Scow KM (1995) Biodegradation of trichlo-roethylene and toluene by indigenous microbial populations invadose sediments. Microb Ecol 29:311–325
Futamata H, Harayama S, Watanabe K (2001a) Diversity inkinetics of trichloroethylene-degrading activities exhibited byphenol-degrading bacteria. Appl Microbiol Biotechnol 55:248–253
Futamata H, Harayama S, Watanabe K (2001b) Group-specificmonitoring of phenol hydroxylase genes for a functionalassessment of phenol-stimulated trichloroethylene bioremedia-tion. Appl Environ Microbiol 67:4671–4677
Hanada S, Shigematsu T, Shibuya K, Eguchi M, Hasegawa T,Suda F, Kamagata Y, Kamagata T, Kurane R (1998) Phylo-genetic analysis of trichloroethylene-degrading bacteria newlyisolated from soil polluted with this contaminant. J FermentBioeng 86:539–544
Herrmann H, Muller C, Schmidt I, Mahnke J, Petruschka L,Hahnke K (1995) Localization and organization of phenoldegradation genes of Pseudomonas putida strain H. Mol GenGenet 247:240–246
Hopkins GD, McCarty PL (1995) Field evaluation of in situ aerobiccometabolism of trichloroethylene and three dichloroethyleneisomers using phenol and toluene as the primary substrates.Environ Sci Technol 29:1628–1638
Hopkins GD, Munakata J, Semprini L, McCarty PL (1993a)Trichloroethylene concentration effects on pilot field-scale in-situ groundwater bioremediation by phenol-oxidizing microor-ganisms. Environ Sci Technol 27:2542–2547
Hopkins GD, Semprini L, McCarty PL (1993b) Microcosm and insitu field studies of enhanced biotransformation of trichloro-ethylene by phenol-utilizing microorganisms. Appl EnvironMicrobiol 59:2277–2285
Kim IC, Oriel PJ (1995) Characterization of the Bacillusstearothermophilus BR219 phenol hydroxylase gene. ApplEnviron Microbiol 61:1215–1256
Mars AE, Prins GT, Wietzes P, Koning W, Janssen DB (1998)Effect of trichloroethylene on the competitive behavior oftoluene-degrading bacteria. Appl Environ Microbiol 64:208–215
McCarty PL, Golts MN, Hopkins GD, Dolan ME, Allan JP,Kawakami BT, Carrothers TJ (1998) Full-scale evaluation of insitu cometabolic degradation of trichloroethylene in ground-water through toluene injection. Environ Sci Technol 32:88–100
Mu DY, Scow KW (1994) Effect of trichloroethylene (TCE) andtoluene concentration on TCE and toluene biodegradation andthe population density of TCE and toluene degraders in soil.Appl Environ Microbiol 60:2661–2665
Muyzer G, Waal GEC, Uitterlinden AG (1993) Profiling ofcomplex microbial populations by denaturing gradient gelelectrophoresis analysis of polymerase chain reaction-amplifiedgenes coding for 16S rRNA. Appl Environ Microbiol 59:695–700
Nordlund I, Powlowski J, Shingler V (1990) Complete nucleotidesequence and polypeptide analysis of multicomponent phenolhydroxylase from Pseudomonas sp. Strain CF600. J Bacteriol172:6826–6833
Saitou N, Nei M (1987) The neighbor-joining method: a newmethod for reconstructing phylogenetic trees. Mol Biol Evol4:106–425
Semprini L (1997) Strategy for the aerobic co-metabolism ofchlorinated solvents. Curr Opin Biotechnol 8:296–308
Semprini L, Roberts PV, Hopkins GD, McCarty PL (1990) A fieldevaluation of in-situ biodegradation of chlorinated ethenes: part2, results of biostimulation and biotransformation. GroundWater 28:715–727
Semprini L, Hopkins GD, Roberts PV, Grbic-Galic D, McCarty PL(1991) A field evaluation of in-situ biodegradation of chlori-nated ethenes: part 3, studies of competitive inhibition. GroundWater 29:239–250
599

Shifang F, Scow KM (1993) Biodegradation of trichloroethyleneand toluene by indigenous microbial populations in soil. ApplEnviron Microbiol 59:1911–1918
Shih CC, Davey ME, Zhou J, Tiedje JM, Criddle CS (1996) Effectof phenol feeding pattern on microbial community structureand cometabolism of trichloroethylene. Appl Environ Micro-biol 62:2953–2960
Sprott GD, Koval SF, Schnaitman CA (1994) Cell fractionation. In:Gerhardt P, Murray RGE, Wood WA, Krieg NR (eds), Methodsfor general and molecular bacteriology. American Society forMicrobiology, Washington, D.C. p 72–103
Takeo M, Maeda Y, Okada H, Miyama K, Mori K, Ike M, Fujita M(1995) Molecular cloning and sequencing of the phenolhydroxylase gene from Pseudomonas putida BH. J FermentBioeng 79:485–488
Tani K, Muneta M, Nakamura K, Shibuya K, Nasu M (2002)Monitoring of Ralstonia eutropha KT1 in groundwater in anexperimental bioaugmentation field by in situ PCR. ApplEnviron Microbiol 68:412–416
Thompson JD, Higgins DG, Gibson TJ (1994) CLUSTAL W:improving the sensitivity of progressive multiple sequencealignment through sequence weighting, position-specific gappenalties and weight matrix choice. Nucleic Acids Res22:4673–4680
Watanabe K, Teramoto M, Futamata H, Harayama S (1998)Molecular detection, isolation, and physiological characteriza-tion of functionally dominant phenol-degrading bacteria inactivated sludge. Appl Environ Microbiol 64: 4396–4402
Zhou J, Bruns MA, Tiedje JM (1996) DNA recovery from soils ofdiverse composition. Appl Environ Microbiol 62:316–322
600