Embed Size (px)
Citation preview

Fully Automated Real-Time Vehicles Detection and Trackingwith Lanes Analysis
Jakub Sochor∗
Supervised by: Adam Herout†
Faculty of Information TechnologyBrno University of Technology
Brno / Czech Republic
Abstract
This paper presents a fully automated system for trafficsurveillance which is able to count passing cars, deter-mine their direction, and the lane which they are taking.The system works without any manual input whatsoeverand it is able to automatically calibrate the camera by de-tecting vanishing points in the video sequence. The pro-posed system is able to work in real time and therefore itis ready for deployment in real traffic surveillance applica-tions. The system uses motion detection and tracking withthe Kalman filter. The lane detection is based on clusteringof trajectories of vehicles. The main contribution is a setof filters which a track has to pass in order to be treated asa vehicle and the full automation of the system.
Keywords: motion detection, tracking, vehicles, trafficsurveillance camera, direction detection, lanes detection,real-time
1 Introduction
This paper presents a fully automated system for trafficanalysis. These types of analysis systems have a widespectrum of usage. For example, it is possible to moni-tor the traffic or try to predict characteristics of the futuretraffic flow. The presented system is able to count pass-ing cars, determine their direction and lane which they aretaking. The goal is to run the system without any manualcalibration or input whatsoever. The full automatism ofthe system is required if the system should be usable withalready mounted uncalibrated cameras which are spreadover highways. Therefore, the camera is automaticallycalibrated prior to running the traffic surveillance system.Real time processing is another requirement which needsto be satisfied for usage in real traffic surveillance applica-tions.
Some methods for calibration of the camera require userinput [29, 3] and therefore they can not be used in fully au-tomated systems. Approaches for the calibration are usu-
∗[email protected]†[email protected]
Figure 1: Example of video scene processed by the pro-posed traffic analysis system. Information about passingcars and their directions are displayed in output video.
ally focused on detection of vanishing point of the direc-tion parallel to moving vehicles [6, 10, 23, 25]. There areseveral ways how to detect the vanishing point. Detectedlines [25, 6] or lanes [25, 10] can be used for obtaining thisvanishing point. On the other hand, Schoepflin and Dai-ley [23] use motion of vehicles and assume that they havestraight parallel trajectories. Kanhere et al. [16] detect ve-hicles by a boosted detector and observe their movement,and Zhang et al. [30] analyze edges present on the vehi-cles.
A popular approach to detection and tracking of vehi-cles is to use some form of background subtraction andKalman filter [15] to track the vehicles [12, 21, 14, 28,1, 4, 7, 20, 17, 22]. Other approaches are based mainlyon detection of corner features, their tracking and group-ing [2, 13, 5]. Also, Cheng and Hsu [4] use pairing ofheadlights for the detection of vehicles at night.
Two main approaches are used for the detection oflanes. The first one is based on detection of the lane di-viding lines [13, 18]. The other approach is based on mo-tion of vehicles and their trajectories. Tseng et al. [28]use a virtual line perpendicular to vehicles’ motion andcompute intersections of the line with trajectories of ve-hicles. Hsieh et al. [12] use a two-dimensional histogramof accumulated centers of vehicles and Melo et al. [20]approximate the trajectories with low-degree polynomials
Proceedings of CESCG 2014: The 18th Central European Seminar on Computer Graphics (non-peer-reviewed)
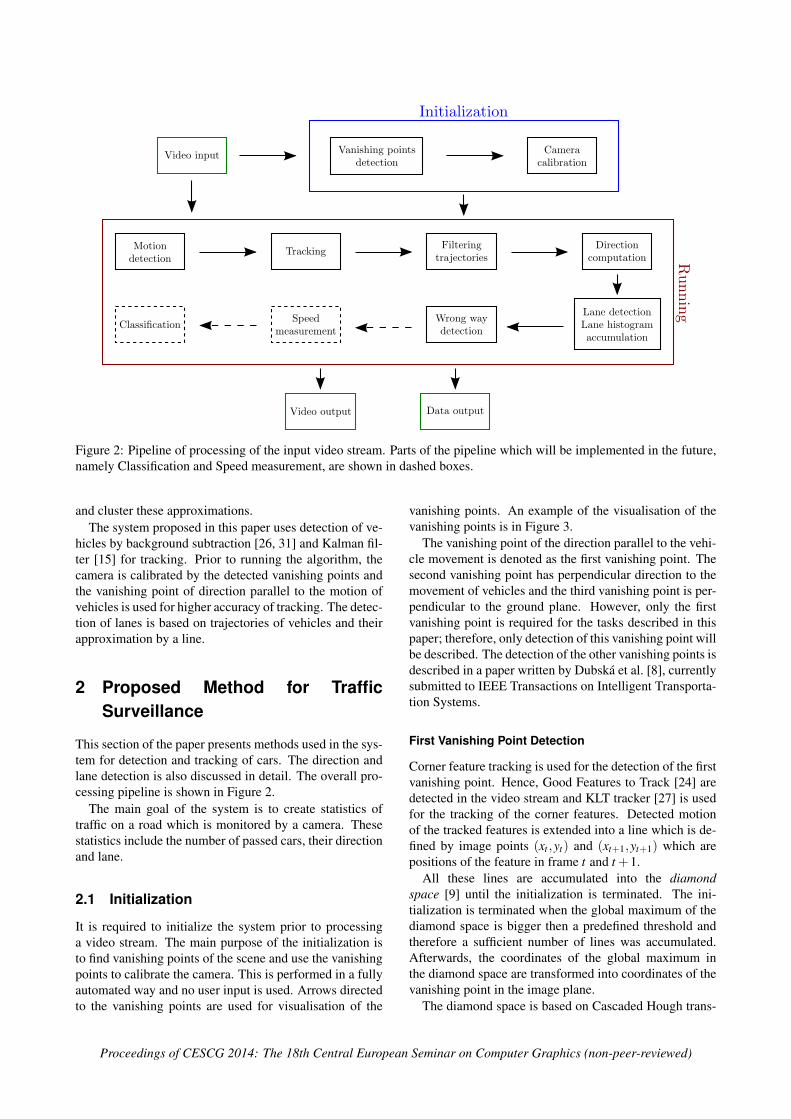
Figure 2: Pipeline of processing of the input video stream. Parts of the pipeline which will be implemented in the future,namely Classification and Speed measurement, are shown in dashed boxes.
and cluster these approximations.The system proposed in this paper uses detection of ve-
hicles by background subtraction [26, 31] and Kalman fil-ter [15] for tracking. Prior to running the algorithm, thecamera is calibrated by the detected vanishing points andthe vanishing point of direction parallel to the motion ofvehicles is used for higher accuracy of tracking. The detec-tion of lanes is based on trajectories of vehicles and theirapproximation by a line.
2 Proposed Method for TrafficSurveillance
This section of the paper presents methods used in the sys-tem for detection and tracking of cars. The direction andlane detection is also discussed in detail. The overall pro-cessing pipeline is shown in Figure 2.
The main goal of the system is to create statistics oftraffic on a road which is monitored by a camera. Thesestatistics include the number of passed cars, their directionand lane.
2.1 Initialization
It is required to initialize the system prior to processinga video stream. The main purpose of the initialization isto find vanishing points of the scene and use the vanishingpoints to calibrate the camera. This is performed in a fullyautomated way and no user input is used. Arrows directedto the vanishing points are used for visualisation of the
vanishing points. An example of the visualisation of thevanishing points is in Figure 3.
The vanishing point of the direction parallel to the vehi-cle movement is denoted as the first vanishing point. Thesecond vanishing point has perpendicular direction to themovement of vehicles and the third vanishing point is per-pendicular to the ground plane. However, only the firstvanishing point is required for the tasks described in thispaper; therefore, only detection of this vanishing point willbe described. The detection of the other vanishing points isdescribed in a paper written by Dubska et al. [8], currentlysubmitted to IEEE Transactions on Intelligent Transporta-tion Systems.
First Vanishing Point Detection
Corner feature tracking is used for the detection of the firstvanishing point. Hence, Good Features to Track [24] aredetected in the video stream and KLT tracker [27] is usedfor the tracking of the corner features. Detected motionof the tracked features is extended into a line which is de-fined by image points (xt ,yt) and (xt+1,yt+1) which arepositions of the feature in frame t and t +1.
All these lines are accumulated into the diamondspace [9] until the initialization is terminated. The ini-tialization is terminated when the global maximum of thediamond space is bigger then a predefined threshold andtherefore a sufficient number of lines was accumulated.Afterwards, the coordinates of the global maximum inthe diamond space are transformed into coordinates of thevanishing point in the image plane.
The diamond space is based on Cascaded Hough trans-
Proceedings of CESCG 2014: The 18th Central European Seminar on Computer Graphics (non-peer-reviewed)
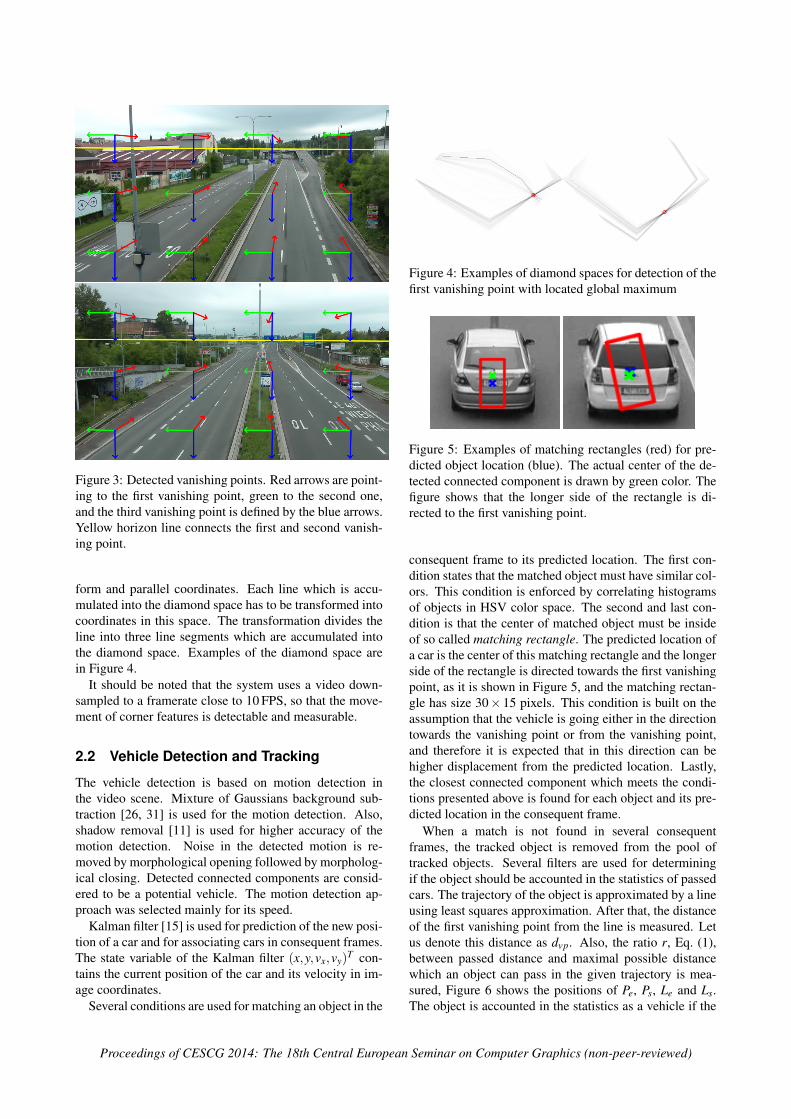
Figure 3: Detected vanishing points. Red arrows are point-ing to the first vanishing point, green to the second one,and the third vanishing point is defined by the blue arrows.Yellow horizon line connects the first and second vanish-ing point.
form and parallel coordinates. Each line which is accu-mulated into the diamond space has to be transformed intocoordinates in this space. The transformation divides theline into three line segments which are accumulated intothe diamond space. Examples of the diamond space arein Figure 4.
It should be noted that the system uses a video down-sampled to a framerate close to 10 FPS, so that the move-ment of corner features is detectable and measurable.
2.2 Vehicle Detection and Tracking
The vehicle detection is based on motion detection inthe video scene. Mixture of Gaussians background sub-traction [26, 31] is used for the motion detection. Also,shadow removal [11] is used for higher accuracy of themotion detection. Noise in the detected motion is re-moved by morphological opening followed by morpholog-ical closing. Detected connected components are consid-ered to be a potential vehicle. The motion detection ap-proach was selected mainly for its speed.
Kalman filter [15] is used for prediction of the new posi-tion of a car and for associating cars in consequent frames.The state variable of the Kalman filter (x,y,vx,vy)
T con-tains the current position of the car and its velocity in im-age coordinates.
Several conditions are used for matching an object in the
Figure 4: Examples of diamond spaces for detection of thefirst vanishing point with located global maximum
Figure 5: Examples of matching rectangles (red) for pre-dicted object location (blue). The actual center of the de-tected connected component is drawn by green color. Thefigure shows that the longer side of the rectangle is di-rected to the first vanishing point.
consequent frame to its predicted location. The first con-dition states that the matched object must have similar col-ors. This condition is enforced by correlating histogramsof objects in HSV color space. The second and last con-dition is that the center of matched object must be insideof so called matching rectangle. The predicted location ofa car is the center of this matching rectangle and the longerside of the rectangle is directed towards the first vanishingpoint, as it is shown in Figure 5, and the matching rectan-gle has size 30× 15 pixels. This condition is built on theassumption that the vehicle is going either in the directiontowards the vanishing point or from the vanishing point,and therefore it is expected that in this direction can behigher displacement from the predicted location. Lastly,the closest connected component which meets the condi-tions presented above is found for each object and its pre-dicted location in the consequent frame.
When a match is not found in several consequentframes, the tracked object is removed from the pool oftracked objects. Several filters are used for determiningif the object should be accounted in the statistics of passedcars. The trajectory of the object is approximated by a lineusing least squares approximation. After that, the distanceof the first vanishing point from the line is measured. Letus denote this distance as dvp. Also, the ratio r, Eq. (1),between passed distance and maximal possible distancewhich an object can pass in the given trajectory is mea-sured, Figure 6 shows the positions of Pe, Ps, Le and Ls.The object is accounted in the statistics as a vehicle if the
Proceedings of CESCG 2014: The 18th Central European Seminar on Computer Graphics (non-peer-reviewed)

acc variable is equal to 1, Equation (2), where tvp and trare predefined thresholds.
r =||Pe−Ps||||Le−Ls||
(1)
acc =
{1 dvp ≤ tvp and r ≥ tr0 otherwise (2)
2.3 Direction Estimation and Lane Detection
For a new vehicle which is about to be added to the statis-tics, the direction of the vehicle and its lane is calculated.Rule (3), which compares the relative positions of the firstvanishing point and the last and first position of the vehi-cle, is used for computing the direction.
dir ={
To VP ||V P1−Pe||< ||V P1−Ps||From VP otherwise (3)
The detection of lanes is based on clustering of thetrajectories of cars. Therefore, the trajectory is also ap-proximated by a line with least squares approximation,see green line in Figure 6. Each cluster of the lines cor-responds to a lane in the monitored traffic surveillancescene and the clustering is performed in a one-dimensionalspace, where the values of the trajectory lines are theirangles with axis x in the image. The clusters itself aresearched as local maxima in the histogram of the angles.Hence, the clusters have to be a local maximum in the his-togram in a predefined surroundings and also the maxi-mum has to have at least a predefined amount of accumu-lated lines. The closest lane is assigned to a new passingvehicle as the lane which the vehicle is using. The closestlane computation is also based on the angles of the trajec-tory line and the lane with axis x.
This clustering is always performed after every 200 tra-jectory lines are accumulated and a unique identificationnumber is assigned to each cluster. Let us denote the setof clusters as CN = {(c1,a1), . . . ,(cn,an)} where N is thenumber of accumulated lines, and pair (ci,ai) denotes onecluster, where ci is its identification number and ai theangle corresponding to the found local maximum. Cor-respondences for clusters CN and CN−200 are searched inorder to obtain the temporal consistency of detected lanesin the scene. The clusters’ identification numbers wouldchange after every 200 accumulated lines if the correspon-dences were not found; and therefore, it would be impos-sible to create long-term statistics for cars passing in thedetected lanes.
The identification number of the found correspondenceis assigned to a cluster if the correspondence is found.A new unique identification number is assigned to the clus-ter otherwise. The correspondence for a cluster (ci,ai) ∈CN is a cluster (c j,a j) ∈ CN−200 for which (4) and (5)hold. The distance function is computed according toEquation (6) which compensates that the angles 0 and 2π
have distance from each other 0.
a j =CN−200
(argmin
c|dist(CN−200 (c) ,ai)|
)(4)
Figure 6: Measured distances for a passed object. Thedistance between approximated line (green) and the firstvanishing point (yellow) is measured. Also, the distancebetween the first and last (Ps, Pe) point of the track of a ve-hicle is measured. The maximal distance which is possibleto pass with a given trajectory is also measured (distanceof Ls and Le).
dist(a j,ai)≤ td (5)
dist(x,y) = min(2π−|x− y|, |x− y|) (6)
The dominant direction is also computed for each clus-ter c of the trajectory lines. The dominant direction dirc iscomputed according to (7), where lV P is the amount of thetrajectories in the cluster which have direction towards thefirst vanishing point and l is the number of all trajectoriesin the cluster. Reasonable value for threshold tdom is 0.1.
dirc =
To VP lV Pl ≥ 1− tdom
From VP lV Pl ≤ tdom
Mixed otherwise(7)
When the dominant direction for a lane is known, it ispossible to detect vehicles which are traveling in wrongway. The detection is based on the detected direction dirof the vehicle and the dominant direction dirc of the lanewhich the vehicle belongs to. The wrong way variable wwis determined by (8).
ww =
True dir = To VP∧dirc = From VPTrue dir = From VP∧dirc = To VPFalse otherwise
(8)
3 Results
This section presents the achieved results and methods ofevaluation of the algorithms, which were presented above.The speed of video processing is also discussed.
The presented traffic analysis system was evaluated onseveral video streams. The processed video streams haveresolution 854× 480 and the video camera was locatedseveral meters above the road. The angle of the video cam-era varies as Figure 8 shows.
Proceedings of CESCG 2014: The 18th Central European Seminar on Computer Graphics (non-peer-reviewed)
0 100 200 300 400 500 600 700
False Positives
0.0
0.1
0.2
0.3
0.4
0.5
0.6
0.7
0.8
0.9
1.0
Tru
eP
osit
ive
rate
(a) ROC curve
0.0 0.1 0.2 0.3 0.4 0.5 0.6 0.7 0.8 0.9 1.0
Recall
0.0
0.1
0.2
0.3
0.4
0.5
0.6
0.7
0.8
0.9
1.0
Pre
cisi
on
(b) Precision-Recall curve
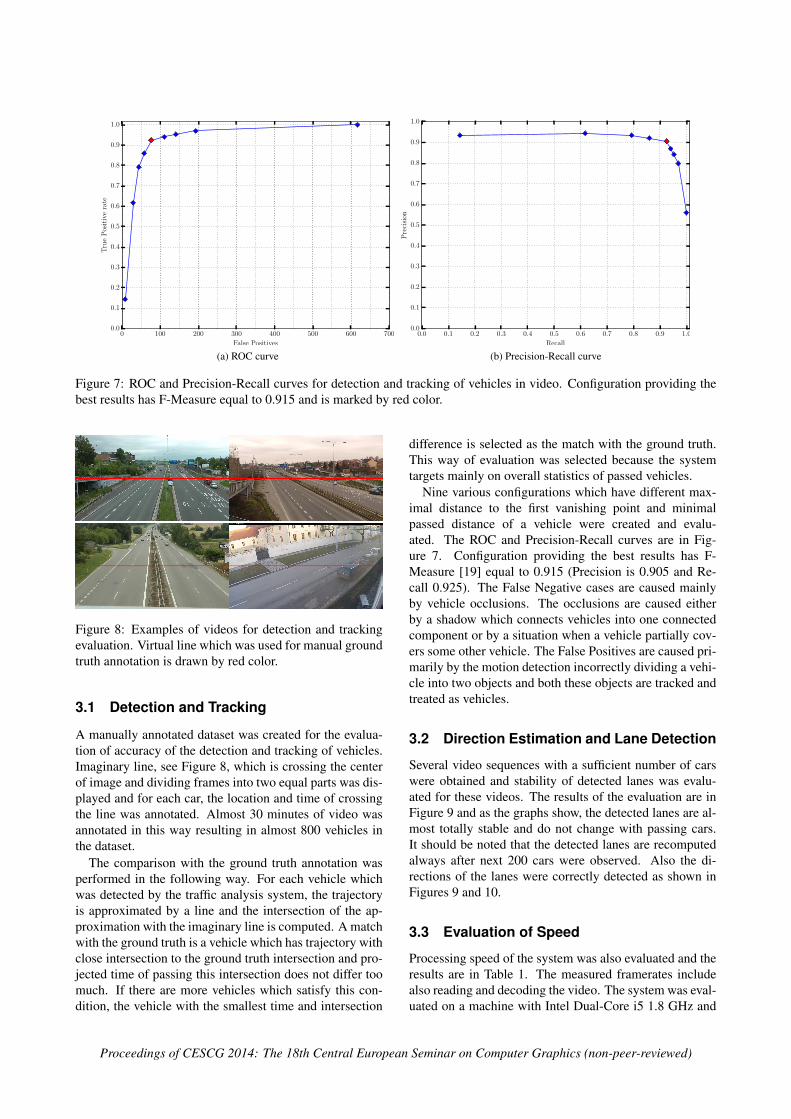
Figure 7: ROC and Precision-Recall curves for detection and tracking of vehicles in video. Configuration providing thebest results has F-Measure equal to 0.915 and is marked by red color.
Figure 8: Examples of videos for detection and trackingevaluation. Virtual line which was used for manual groundtruth annotation is drawn by red color.
3.1 Detection and Tracking
A manually annotated dataset was created for the evalua-tion of accuracy of the detection and tracking of vehicles.Imaginary line, see Figure 8, which is crossing the centerof image and dividing frames into two equal parts was dis-played and for each car, the location and time of crossingthe line was annotated. Almost 30 minutes of video wasannotated in this way resulting in almost 800 vehicles inthe dataset.
The comparison with the ground truth annotation wasperformed in the following way. For each vehicle whichwas detected by the traffic analysis system, the trajectoryis approximated by a line and the intersection of the ap-proximation with the imaginary line is computed. A matchwith the ground truth is a vehicle which has trajectory withclose intersection to the ground truth intersection and pro-jected time of passing this intersection does not differ toomuch. If there are more vehicles which satisfy this con-dition, the vehicle with the smallest time and intersection
difference is selected as the match with the ground truth.This way of evaluation was selected because the systemtargets mainly on overall statistics of passed vehicles.
Nine various configurations which have different max-imal distance to the first vanishing point and minimalpassed distance of a vehicle were created and evalu-ated. The ROC and Precision-Recall curves are in Fig-ure 7. Configuration providing the best results has F-Measure [19] equal to 0.915 (Precision is 0.905 and Re-call 0.925). The False Negative cases are caused mainlyby vehicle occlusions. The occlusions are caused eitherby a shadow which connects vehicles into one connectedcomponent or by a situation when a vehicle partially cov-ers some other vehicle. The False Positives are caused pri-marily by the motion detection incorrectly dividing a vehi-cle into two objects and both these objects are tracked andtreated as vehicles.
3.2 Direction Estimation and Lane Detection
Several video sequences with a sufficient number of carswere obtained and stability of detected lanes was evalu-ated for these videos. The results of the evaluation are inFigure 9 and as the graphs show, the detected lanes are al-most totally stable and do not change with passing cars.It should be noted that the detected lanes are recomputedalways after next 200 cars were observed. Also the di-rections of the lanes were correctly detected as shown inFigures 9 and 10.
3.3 Evaluation of Speed
Processing speed of the system was also evaluated and theresults are in Table 1. The measured framerates includealso reading and decoding the video. The system was eval-uated on a machine with Intel Dual-Core i5 1.8 GHz and
Proceedings of CESCG 2014: The 18th Central European Seminar on Computer Graphics (non-peer-reviewed)
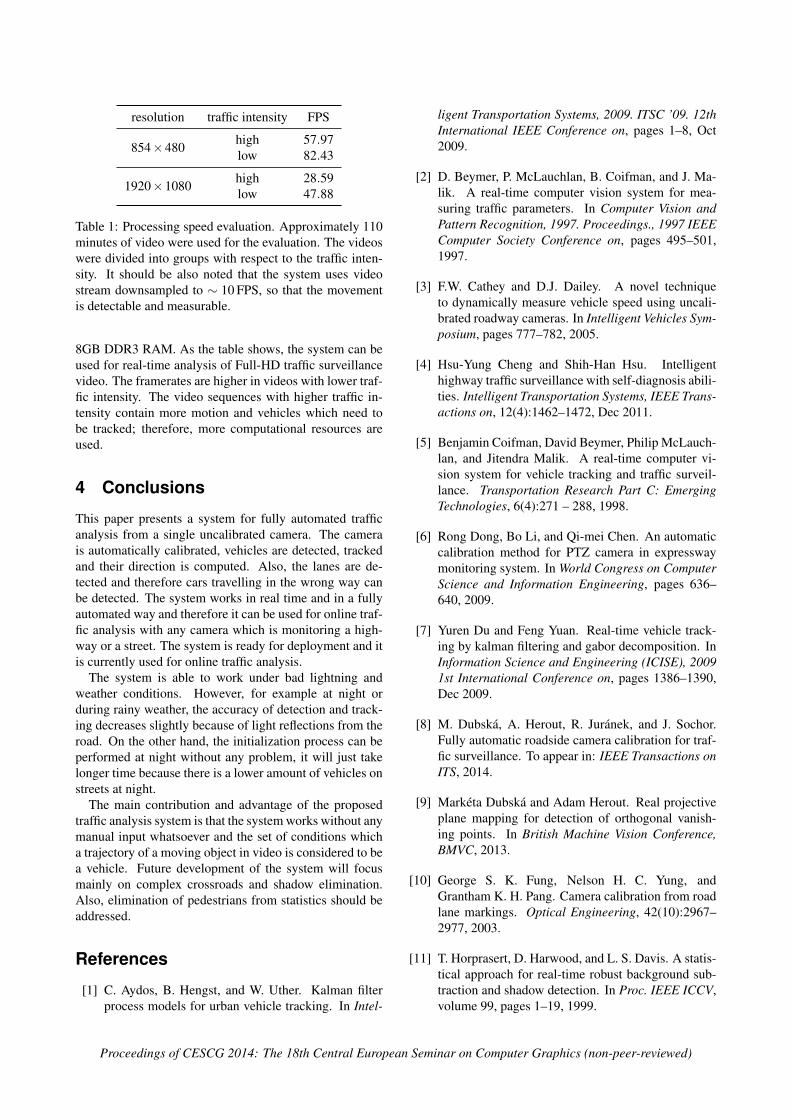
resolution traffic intensity FPS
854×480 high 57.97low 82.43
1920×1080 high 28.59low 47.88
Table 1: Processing speed evaluation. Approximately 110minutes of video were used for the evaluation. The videoswere divided into groups with respect to the traffic inten-sity. It should be also noted that the system uses videostream downsampled to ∼ 10 FPS, so that the movementis detectable and measurable.
8GB DDR3 RAM. As the table shows, the system can beused for real-time analysis of Full-HD traffic surveillancevideo. The framerates are higher in videos with lower traf-fic intensity. The video sequences with higher traffic in-tensity contain more motion and vehicles which need tobe tracked; therefore, more computational resources areused.
4 Conclusions
This paper presents a system for fully automated trafficanalysis from a single uncalibrated camera. The camerais automatically calibrated, vehicles are detected, trackedand their direction is computed. Also, the lanes are de-tected and therefore cars travelling in the wrong way canbe detected. The system works in real time and in a fullyautomated way and therefore it can be used for online traf-fic analysis with any camera which is monitoring a high-way or a street. The system is ready for deployment and itis currently used for online traffic analysis.
The system is able to work under bad lightning andweather conditions. However, for example at night orduring rainy weather, the accuracy of detection and track-ing decreases slightly because of light reflections from theroad. On the other hand, the initialization process can beperformed at night without any problem, it will just takelonger time because there is a lower amount of vehicles onstreets at night.
The main contribution and advantage of the proposedtraffic analysis system is that the system works without anymanual input whatsoever and the set of conditions whicha trajectory of a moving object in video is considered to bea vehicle. Future development of the system will focusmainly on complex crossroads and shadow elimination.Also, elimination of pedestrians from statistics should beaddressed.
References
[1] C. Aydos, B. Hengst, and W. Uther. Kalman filterprocess models for urban vehicle tracking. In Intel-
ligent Transportation Systems, 2009. ITSC ’09. 12thInternational IEEE Conference on, pages 1–8, Oct2009.
[2] D. Beymer, P. McLauchlan, B. Coifman, and J. Ma-lik. A real-time computer vision system for mea-suring traffic parameters. In Computer Vision andPattern Recognition, 1997. Proceedings., 1997 IEEEComputer Society Conference on, pages 495–501,1997.
[3] F.W. Cathey and D.J. Dailey. A novel techniqueto dynamically measure vehicle speed using uncali-brated roadway cameras. In Intelligent Vehicles Sym-posium, pages 777–782, 2005.
[4] Hsu-Yung Cheng and Shih-Han Hsu. Intelligenthighway traffic surveillance with self-diagnosis abili-ties. Intelligent Transportation Systems, IEEE Trans-actions on, 12(4):1462–1472, Dec 2011.
[5] Benjamin Coifman, David Beymer, Philip McLauch-lan, and Jitendra Malik. A real-time computer vi-sion system for vehicle tracking and traffic surveil-lance. Transportation Research Part C: EmergingTechnologies, 6(4):271 – 288, 1998.
[6] Rong Dong, Bo Li, and Qi-mei Chen. An automaticcalibration method for PTZ camera in expresswaymonitoring system. In World Congress on ComputerScience and Information Engineering, pages 636–640, 2009.
[7] Yuren Du and Feng Yuan. Real-time vehicle track-ing by kalman filtering and gabor decomposition. InInformation Science and Engineering (ICISE), 20091st International Conference on, pages 1386–1390,Dec 2009.
[8] M. Dubska, A. Herout, R. Juranek, and J. Sochor.Fully automatic roadside camera calibration for traf-fic surveillance. To appear in: IEEE Transactions onITS, 2014.
[9] Marketa Dubska and Adam Herout. Real projectiveplane mapping for detection of orthogonal vanish-ing points. In British Machine Vision Conference,BMVC, 2013.
[10] George S. K. Fung, Nelson H. C. Yung, andGrantham K. H. Pang. Camera calibration from roadlane markings. Optical Engineering, 42(10):2967–2977, 2003.
[11] T. Horprasert, D. Harwood, and L. S. Davis. A statis-tical approach for real-time robust background sub-traction and shadow detection. In Proc. IEEE ICCV,volume 99, pages 1–19, 1999.
Proceedings of CESCG 2014: The 18th Central European Seminar on Computer Graphics (non-peer-reviewed)

0 200 400 600 800 1000 1200
Passed cars
-90
-70
-50
-30
-10
10
30
50
70
90
An
gle
ofla
nes
[◦]
1
2
3
4
5
6
0 200 400 600 800 1000
Passed cars
-90
-70
-50
-30
-10
10
30
50
70
90
An
gle
ofla
nes
[◦]
1
2
3
4
5
6
7
0 200 400 600 800 1000 1200 1400 1600 1800
Passed cars
-90
-70
-50
-30
-10
10
30
50
70
90
An
gle
ofla
nes
[◦]
1
2
3
4
5
0 5 10 15 20 25 30
Entry time [min]
0
10
20
30
40
50
60
Car
sC
ount
Observed cars
20 30 40 50 60 70 80 90 100
Speed [km/h]
0
20
40
60
80
100
120
Car
sC
ount
Histogram of Speeds
Bus Motorcycle Personal SUV Sedan Truck Unclassified Unknown Van0
100
200
300
400
500
600
700
800
900C
ars
Cou
ntTypes of Cars
1 2 3 4 5 60
50
100
150
200
250
300
350
Car
sC
ount
Statistics of Lanes
To VP From VP0
100
200
300
400
500
600
700
800
Car
sC
ount
Direction of Cars
0 5 10 15 20 25 30
Entry time [min]
0
10
20
30
40
50
60
Car
sC
ount
Observed cars
0 20 40 60 80 100 120 140
Speed [km/h]
0
20
40
60
80
100
120
140
Car
sC
ount
Histogram of Speeds
Bus Motorcycle Personal SUV Sedan Truck Unclassified Unknown Van0
100
200
300
400
500
600
700
800
900
Car
sC
ount
Types of Cars
1 2 3 4 5 6 70
50
100
150
200
250
300
350
Car
sC
ount
Statistics of Lanes
To VP From VP0
100
200
300
400
500
600
700
Car
sC
ount
Direction of Cars
0 5 10 15 20 25 30 35 40 45
Entry time [min]
0
10
20
30
40
50
60
70
Car
sC
ount
Observed cars
20 40 60 80 100 120 140 160
Speed [km/h]
0
50
100
150
200
250
300
350
Car
sC
ount
Histogram of Speeds
Bus Motorcycle Personal SUV Sedan Truck Unclassified Unknown Van0
200
400
600
800
1000
1200
1400
Car
sC
ount
Types of Cars
1 2 3 4 50
100
200
300
400
500
600
700
800
900
Car
sC
ount
Statistics of Lanes
To VP From VP0
200
400
600
800
1000
Car
sC
ount
Direction of Cars
Figure 9: Stability of lanes detection for long video sequences. The top line of images presents the detected lanes. Onlylanes which were valid for the last frame of video are drawn. The middle images show changes in detected lanes over timeas new cars were observed in video. Finally, the bottom line shows the statistics of observed cars in the detected lanes.
[12] Jun-Wei Hsieh, Shih-Hao Yu, Yung-Sheng Chen, andWen-Fong Hu. Automatic traffic surveillance sys-tem for vehicle tracking and classification. Intelli-gent Transportation Systems, IEEE Transactions on,7(2):175–187, 2006.
[13] Lili Huang. Real-time multi-vehicle detection andsub-feature based tracking for traffic surveillancesystems. In Informatics in Control, Automation andRobotics (CAR), 2010 2nd International Asia Con-ference on, volume 2, pages 324–328, March 2010.
[14] Young-Kee Jung and Yo-Sung Ho. Traffic parameterextraction using video-based vehicle tracking. In In-telligent Transportation Systems, 1999. Proceedings.1999 IEEE/IEEJ/JSAI International Conference on,pages 764–769, 1999.
[15] R. E. Kalman. A new approach to linear filteringand prediction problems. Transactions of the ASME– Journal of Basic Engineering, (82 (Series D)):35–45, 1960.
[16] Neeraj K Kanhere, Stanley T Birchfield, andWayne A Sarasua. Automatic camera calibration
using pattern detection for vision-based speed sens-ing. Journal of the Transportation Research Board,2086(1):30–39, 2008.
[17] Dieter Koller, Joseph Weber, and Jitendra Malik. Ro-bust multiple car tracking with occlusion reasoning.pages 189–196. Springer-Verlag, 1993.
[18] A. H S Lai and N. H C Yung. Lane detection byorientation and length discrimination. Systems, Man,and Cybernetics, Part B: Cybernetics, IEEE Trans-actions on, 30(4):539–548, Aug 2000.
[19] Christopher D MANNING, Prabhakar RAGHAVAN,and Hinrich SCHUTZE. Introduction to InformationRetrieval. Cambridge University Press, 2008.
[20] J. Melo, A. Naftel, A. Bernardino, and J. Santos-Victor. Detection and classification of highway lanesusing vehicle motion trajectories. Intelligent Trans-portation Systems, IEEE Transactions on, 7(2):188–200, June 2006.
[21] B. Morris and M. Trivedi. Robust classification andtracking of vehicles in traffic video streams. In In-
Proceedings of CESCG 2014: The 18th Central European Seminar on Computer Graphics (non-peer-reviewed)
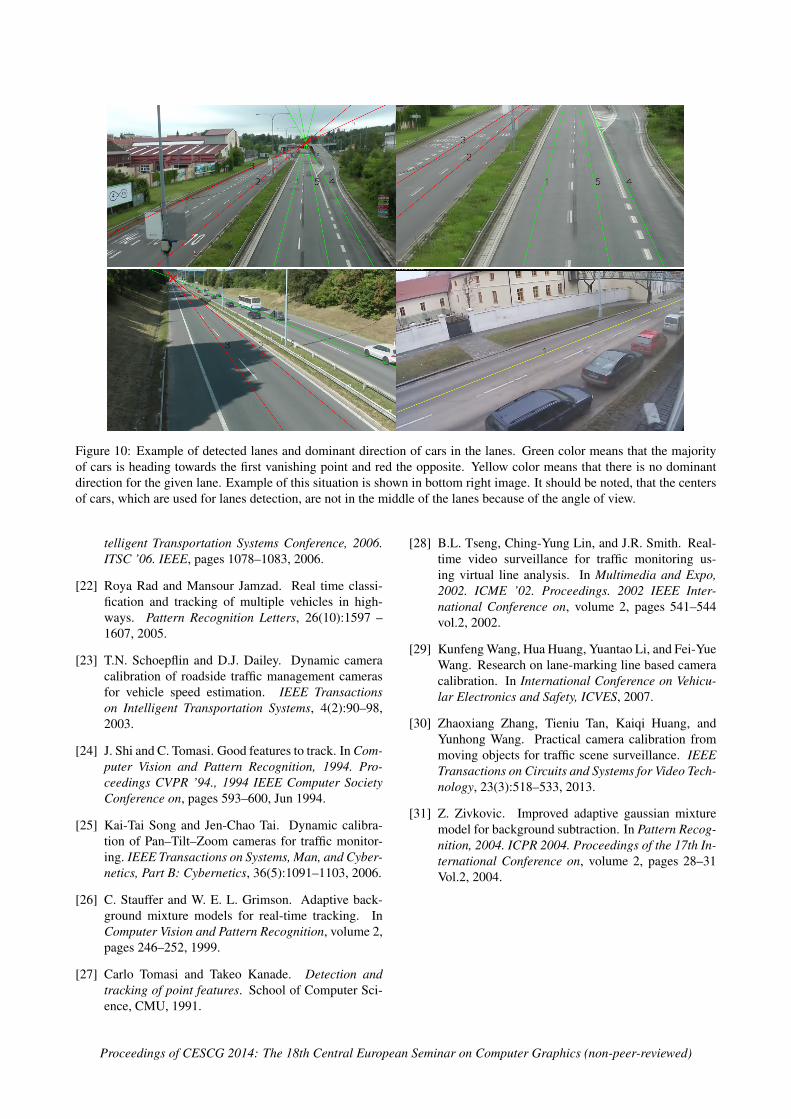
Figure 10: Example of detected lanes and dominant direction of cars in the lanes. Green color means that the majorityof cars is heading towards the first vanishing point and red the opposite. Yellow color means that there is no dominantdirection for the given lane. Example of this situation is shown in bottom right image. It should be noted, that the centersof cars, which are used for lanes detection, are not in the middle of the lanes because of the angle of view.
telligent Transportation Systems Conference, 2006.ITSC ’06. IEEE, pages 1078–1083, 2006.
[22] Roya Rad and Mansour Jamzad. Real time classi-fication and tracking of multiple vehicles in high-ways. Pattern Recognition Letters, 26(10):1597 –1607, 2005.
[23] T.N. Schoepflin and D.J. Dailey. Dynamic cameracalibration of roadside traffic management camerasfor vehicle speed estimation. IEEE Transactionson Intelligent Transportation Systems, 4(2):90–98,2003.
[24] J. Shi and C. Tomasi. Good features to track. In Com-puter Vision and Pattern Recognition, 1994. Pro-ceedings CVPR ’94., 1994 IEEE Computer SocietyConference on, pages 593–600, Jun 1994.
[25] Kai-Tai Song and Jen-Chao Tai. Dynamic calibra-tion of Pan–Tilt–Zoom cameras for traffic monitor-ing. IEEE Transactions on Systems, Man, and Cyber-netics, Part B: Cybernetics, 36(5):1091–1103, 2006.
[26] C. Stauffer and W. E. L. Grimson. Adaptive back-ground mixture models for real-time tracking. InComputer Vision and Pattern Recognition, volume 2,pages 246–252, 1999.
[27] Carlo Tomasi and Takeo Kanade. Detection andtracking of point features. School of Computer Sci-ence, CMU, 1991.
[28] B.L. Tseng, Ching-Yung Lin, and J.R. Smith. Real-time video surveillance for traffic monitoring us-ing virtual line analysis. In Multimedia and Expo,2002. ICME ’02. Proceedings. 2002 IEEE Inter-national Conference on, volume 2, pages 541–544vol.2, 2002.
[29] Kunfeng Wang, Hua Huang, Yuantao Li, and Fei-YueWang. Research on lane-marking line based cameracalibration. In International Conference on Vehicu-lar Electronics and Safety, ICVES, 2007.
[30] Zhaoxiang Zhang, Tieniu Tan, Kaiqi Huang, andYunhong Wang. Practical camera calibration frommoving objects for traffic scene surveillance. IEEETransactions on Circuits and Systems for Video Tech-nology, 23(3):518–533, 2013.
[31] Z. Zivkovic. Improved adaptive gaussian mixturemodel for background subtraction. In Pattern Recog-nition, 2004. ICPR 2004. Proceedings of the 17th In-ternational Conference on, volume 2, pages 28–31Vol.2, 2004.
Proceedings of CESCG 2014: The 18th Central European Seminar on Computer Graphics (non-peer-reviewed)