Embed Size (px)
Citation preview

FULL YEAR RESULTSPRESENTATIONYEAR ENDED 30 JUNE 2019

DISCLAIMER AND NON-IFRS INFORMATION
Disclaimer
The material in this presentation has been
prepared by carsales.com Limited (ASX:
CAR) ABN 91 074 444 018 (“carsales") and
is general background information about
carsales’ activities current as at the date of
this presentation. The information is given
in summary form and does not purport to
be complete. In particular you are
cautioned not to place undue reliance on
any forward looking statements regarding
our belief, intent or expectations with
respect to carsales’ businesses, market
conditions and/or results of operations, as
although due care has been used in the
preparation of such statements, actual
results may vary in a material manner.
Information in this presentation, including
forecast financial information, should not
be considered advice or a
recommendation to investors or potential
investors in relation to holding, purchasing
or selling securities. Before acting on any
information you should consider the
appropriateness of the information having
regard to these matters, any relevant offer
document and in particular, you should
seek independent financial advice.
Non-IFRS Financial Information
carsales' results are reported under
International Financial Reporting
Standards (IFRS). This presentation also
includes certain non-IFRS measures
including “adjusted”, “underlying”
“proforma” and “look through”. These
measures are used internally by
management to assess the performance
of our business and our associates, make
decisions on the allocation of resources
and assess operational management.
Non-IFRS measures have not been subject
to audit or review. All numbers listed as
reported comply with IFRS.
2

CONTENTS
Key Highlights
Financial Review
carsales Australia
carsales International
Strategy Update
Outlook
Appendix
4 – 6
7 – 13
14 – 19
20 – 26
27 – 32
33 – 34
35 – 41
3

FY19 HIGHLIGHTS
* Adjusted EBITDA and NPAT stated above is on a continuing operations basis, post non-controlling interests and excludes certain non-recurring or non-cash items relating to restructuring, bad debts, financing, investments and acquired intangible amortisation. See slide 36 regarding the disclosure of non-IFRS Information and slides 37-38 for a reconciliation of Adjusted NPAT to Reported NPAT. ** pcp refers to prior corresponding period and relates to FY18 unless otherwise stated.
Domestic highlights
• Robust revenue performance in core Dealer (+7% on pcp**) and Private (+4%) advertising segments.
• Pleasing growth in audience and vehicle enquiry metrics in our Dealer business.
• Good growth in depth penetration and usage.
• Impressive performance for our private customers reflected in the considerable reduction in time to sell.
• Private yield expansion continued through price optimisation and increased premium ad penetration
• Good response from OEMs and dealers to reinvigorated new car offering and enhanced Display proposition.
International highlights
• Strong international growth with look through revenue up 39% and EBITDA up 29% on pcp.
• Double digit underlying local currency revenue growth in all international classifieds businesses.
• Korea performed well in our first year of 100% ownership with underlying local currency revenue and EBITDA both up 13%.
• Brazil delivered a standout performance with rapid expansion of its dealer customer base driving revenue and EBITDA growth of 35% and 54% in local currency respectively.
• Combined revenue in Chile, Mexico and Argentina up 22% on a constant currency basis. Good progress on non-financial KPIs.
Up 11% to $418m
Reported revenue
Up 7% to $210m
Adjusted EBITDA*
Up 3% to $131m
Adjusted NPAT*
Market leadership and diversification continue to deliver growth.
4

AUSTRALIA INTERNATIONAL
ASIA
• #1 online automotive advertising business in Australia – the go-to place to buy and sell vehicles
• Value-add and ancillary services for vehicle owners and sellers
• Powerful data and research service offerings
• Benefiting from first mover advantage and strong network effects
• #1 online automotive classifieds business in South Korea
• Differentiated and market leading offering with strong growth trajectory
• Investment in iCar Asia
• Redbook data and research services
• #1 online automotive classifieds businesses in Brazil, Chile and Argentina
• Significant market opportunity
CARSALES TODAY
carsales is the #1 online automotive advertising business in Australia, with a growing global presence in Asia and Latin America.
LATIN AMERICA
5
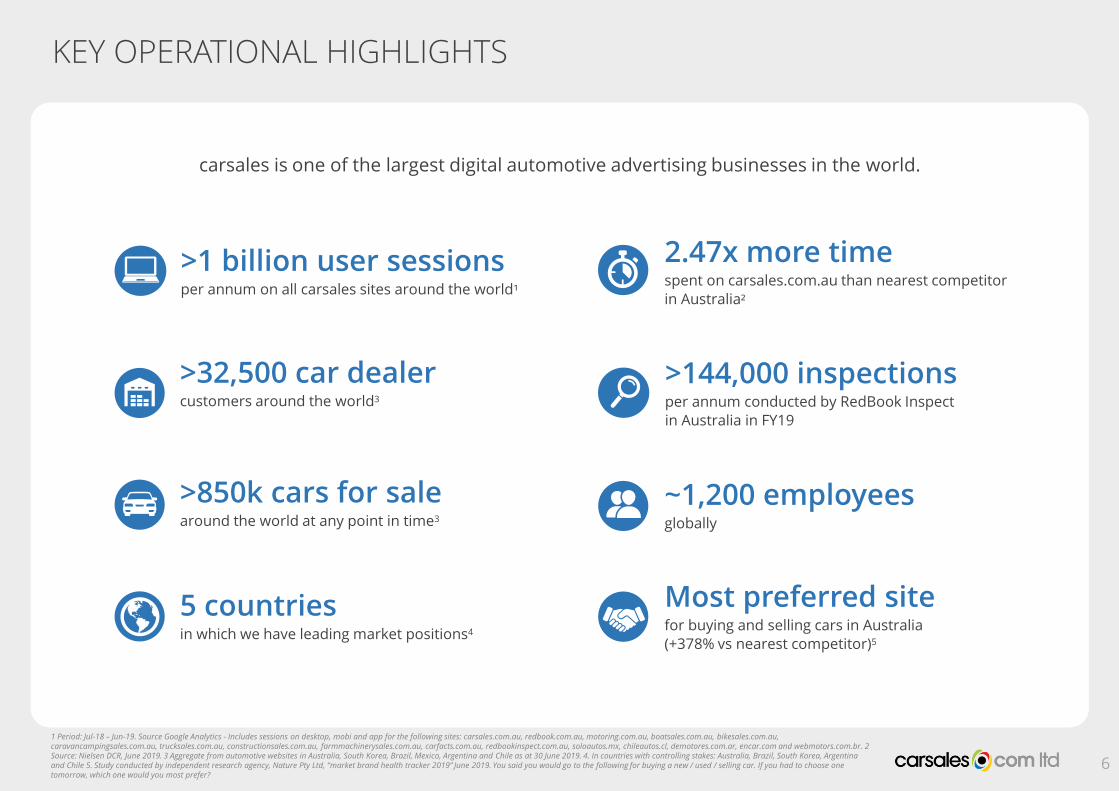
>850k cars for salearound the world at any point in time3
2.47x more timespent on carsales.com.au than nearest competitor
in Australia²
5 countriesin which we have leading market positions4
Most preferred sitefor buying and selling cars in Australia
(+378% vs nearest competitor)5
>32,500 car dealercustomers around the world3
1 Period: Jul-18 – Jun-19. Source Google Analytics - Includes sessions on desktop, mobi and app for the following sites: carsales.com.au, redbook.com.au, motoring.com.au, boatsales.com.au, bikesales.com.au, caravancampingsales.com.au, trucksales.com.au, constructionsales.com.au, farmmachinerysales.com.au, carfacts.com.au, redbookinspect.com.au, soloautos.mx, chileautos.cl, demotores.com.ar, encar.com and webmotors.com.br. 2 Source: Nielsen DCR, June 2019. 3 Aggregate from automotive websites in Australia, South Korea, Brazil, Mexico, Argentina and Chile as at 30 June 2019. 4. In countries with controlling stakes: Australia, Brazil, South Korea, Argentina and Chile 5. Study conducted by independent research agency, Nature Pty Ltd, “market brand health tracker 2019” June 2019. You said you would go to the following for buying a new / used / selling car. If you had to choose one tomorrow, which one would you most prefer?
KEY OPERATIONAL HIGHLIGHTS
carsales is one of the largest digital automotive advertising businesses in the world.
>1 billion user sessionsper annum on all carsales sites around the world¹
>144,000 inspectionsper annum conducted by RedBook Inspect
in Australia in FY19
~1,200 employeesglobally
6

7
GROUP FINANCIAL REVIEW

254.5
283.1
319.0
376.9
417.5
FY15 FY16 FY17 FY18** FY19
STRONG TRACK RECORD OF SUSTAINED GROWTH
* Adjusted EBITDA and NPAT stated above is on a continuing basis, post non-controlling interests and excludes certain non-recurring or non-cash items relating to restructuring, bad debts, financing, investments and acquired intangible amortisation. See slide 36 regarding the disclosure of non-IFRS Information and slides 37-38 for a reconciliation of Adjusted NPAT to Reported NPAT ** FY18 revenue, EBITDA and Adjusted NPAT have been restated to reflect the adoption of AASB15. FY15-FY17 figures have not been restated as the impact would not be material.
Adjusted EBITDA ($m)*Revenue ($m) Adjusted NPAT ($m)*CAGR
8%CAGR
10%CAGR
13%
Well positioned to continue delivering long term shareholder value through world-class capability, exposure to international growth markets and investment in new products and services.
142.7154.5
166.0
196.1
210.1
FY15 FY16 FY17 FY18** FY19
97.9 106.1
116.6
127.8 131.3
FY15 FY16 FY17 FY18** FY19
8

SUMMARY REVENUE & EBITDA PERFORMANCE
• Full year revenue up 11% on pcp.
• Resilient results from our Dealer,
Private and ‘Data, Research &
Services’ segments that continue to
reinforce the strength of the core
business despite external market
conditions.
• Display segment impacted by
challenging market conditions.
Improved Q4 run rate in response to
strengthened go-to-market
proposition.
• Excellent international result, with
look through revenue up 39%, and all
international classifieds businesses
recording double digit revenue
growth in local currency.
EBITDA
• Group Adjusted EBITDA* up 7% to
$210.1m.
• Online Advertising segment impacted
by lower Display revenue which was
partly offset by cost discipline in the
core business.
• Margin expansion in the Data,
Research and Services segment
reflects benefits of continued cost
base leverage and exiting some low
margin products and contracts.
• Strong international result with look
through Adjusted EBITDA* up 29%
underpinned by good look through
performances in Korea and Brazil.
• carsales Asia growth driven by SK
Encar acquisition whilst losses in
carsales Latin America reflects
ongoing investment in Mexico and
Argentina.
Revenue
FY18 FY19 $'s %
Revenue
Online Advertising 296.8 300.1 3.3 1%
Dealer 144.0 153.9 9.9 7%
Private 78.9 82.1 3.2 4%
Display 73.9 64.1 (9.8) (13%)
Data, Research and Services 42.2 43.2 1.0 2%
carsales Asia 29.7 65.1 35.4 119%
carsales Latin America 8.2 9.1 0.9 11%
Total Revenue 376.9 417.5 40.6 11%
Adjusted EBITDA*
Online Advertising 158.3 158.4 0.1 0%
Data, Research and Services 24.6 25.5 0.9 4%
carsales Asia 15.7 32.0 16.3 104%
carsales Latin America (2.6) (5.9) (3.3) (130%)
Adjusted EBITDA 196.1 210.1 14.1 7%
Year Ending
30 June 2019
GrowthFull Year
* Adjusted EBITDA stated above is on a continuing basis, post non-controlling interests and excludes certain non-recurring or non-cash items relating to restructuring and bad debts. See slide 36 regarding the disclosure of non-IFRS Information and slides 37-38 for a reconciliation of Adjusted EBITDA to Reported EBITDA. FY18 revenue and EBITDA have been restated to reflect the adoption of AASB15.
9

ADJUSTED EBITDA MARGIN PERFORMANCE
• Adjusted EBITDA* margins moved from 52.0% in FY18 to 50.3% in FY19, with domestic core business margin increases offset by an increasing contribution from early stage businesses (tyresales, Redbook Inspect and carsales Latin America).
• Domestic core business margin expanded from 60% to 61% in FY19, reflecting strong discipline on cost control, operating leverage improvement.
• Investments in our tyresales and Redbook Inspect businesses reduced EBITDA margins by 1.3%.
• carsales Asia had a small negative impact on overall margins, reflecting investment in the expansion of the Guarantee Inspection service in Korea.
• carsales Latin America impacted Group margins by -1.0%, reflecting the impact of ongoing investment in Mexico and Argentina.
50.3%
carsales Latin
America
FY18 EBITDA Margin
(1.3%)52.0%
Domestic Core
Business
1.0%
Other Domestic
Investments
(0.4%)
carsales Asia
(1.0%)
FY19 EBITDA Margin
* Adjusted EBITDA stated above is on a continuing basis, post non-controlling interests and excludes certain non-recurring or non-cash items relating to restructuring and bad debts. See slide 36 regarding the disclosure of non-IFRS Information and slides 37-38 for a reconciliation of Adjusted EBITDA to Reported EBITDA. FY18 revenue and EBITDA have been restated to reflect the adoption of AASB15.
Core Adjusted EBITDA margins expanded but were offset by investments in early stage domestic and high growth international investments.
10

140.6 152.9 162.6179.3 181.6
9.611.4
14.8
26.9 34.6
150.2164.4
177.4
206.2216.2
FY15 FY16 FY17 FY18 FY19
carsales Domestic carsales International
244.6 266.1 290.6326.9 331.2
29.534.1
44.0
67.293.6
274.1300.2
334.5
394.1
424.7
FY15 FY16 FY17 FY18 FY19
carsales Domestic carsales International
LOOK THROUGH SUMMARY
NOTE: Refer to slide 39 for carsales “Look Through” methodology
Look Through Revenue ($m) Look Through Adjusted EBITDA ($m)CAGR
12%
CAGR
10%
FY18 revenue and adjusted EBITDA have been restated to reflect the adoption of AASB15. FY15-FY17 figures have not been restated as the impact would not be material.
Increasingly significant contribution from International portfolio. International now contributes more than 22% of look through revenue and 16% of look through EBITDA.
International look through revenue and EBITDA grew 39% and 29% respectively in FY19.
11

ADJUSTED NET PROFIT AFTER TAX SUMMARY
• D&A increased by $4.5m reflecting full year impact of
acquired underlying D&A from SK Encar ($1.9m) and the
impact of increased depreciation of capitalised labour, other
growth capex and intangibles. This investment supports
Group wide integration and globalisation projects.
• Net finance costs growth reflects full year impact of
additional interest incurred on funding the SK Encar
acquisition.
• Profits from associates down reflecting reclassification of SK
Encar from an associate to a consolidated subsidiary from
January 2018.
• Strong underlying local currency NPAT growth of 36% from
Webmotors.
• Refer slides 37-38 for breakdown of Adjustments.
• Final dividend of 25.0 cents per share declared up 5% on pcp.
* Adjusted EBITDA and NPAT stated above is on a continuing operations basis, post non-controlling interests and excludes certain non-recurring or non-cash items relating to restructuring, bad debts, financing, investments and acquired intangible amortisation. See slide 36 regarding the disclosure of non-IFRS Information and slides 37-38 for a reconciliation of Adjusted NPAT to Reported NPAT ** FY18 revenue, EBITDA and Adjusted NPAT have been restated to reflect the adoption of AASB15.
The analysis above reflects the Adjusted net profit after tax results of the business
for FY19. Details of the reconciliation between Adjusted and Reported results are
shown on slides 37-38. The analysis focuses on results below EBITDA after
adjustments to better reflect the underlying trading performance of the Group.
12
FY18 FY19 %
Total revenue 376.9 417.5 11%
Total operating expenses 180.8 207.4 (15%)
Adjusted EBITDA* 196.1 210.1 7%
EBITDA margin 52.0% 50.3%
Depreciation & amortisation 11.7 16.2 (38%)
EBIT 184.4 193.9 5%
Net finance costs 9.7 13.4 (39%)
Profit Before Tax 174.7 180.5 3%
Income Tax Expense 52.5 53.3 (1%)
Profits from associates 6.6 3.7 (44%)
Non-controlling interests (NCI) (1.0) 0.4 n/a
Adjusted NPAT* (continuing operations) 127.8 131.3 3%
Adjusted Earnings per Share (cents) 52.7 53.9 2%
Summary of Reported Results
Reported EBITDA 196.1 205.2 5%
Reported NPAT (continuing operations) 182.3 133.3 (27%)
Reported Earnings per Share (cents) 75.2 54.7 (27%)
Year Ending
30 June 2019
$A Millions Growth
DEBT AND CASH FLOW
See slide 36 regarding the disclosure of non-IFRS Information | *Net debt includes total borrowings and cross currency interest swaps less total cash as at 30 June 2019 as per published balance sheet, excluding Stratton. Ratios above are based on reported financial outcomes and may vary with bank covenant definitions. | **Pre-tax cash flow is Reported Operating Cash Flow excluding tax and capitalised labour. | *** FY18, EBITDA has been restated to reflect the adoption of AASB15. FY15-FY17 figures have not been restated as the impact would not be material.
All amounts shown above exclude Stratton.
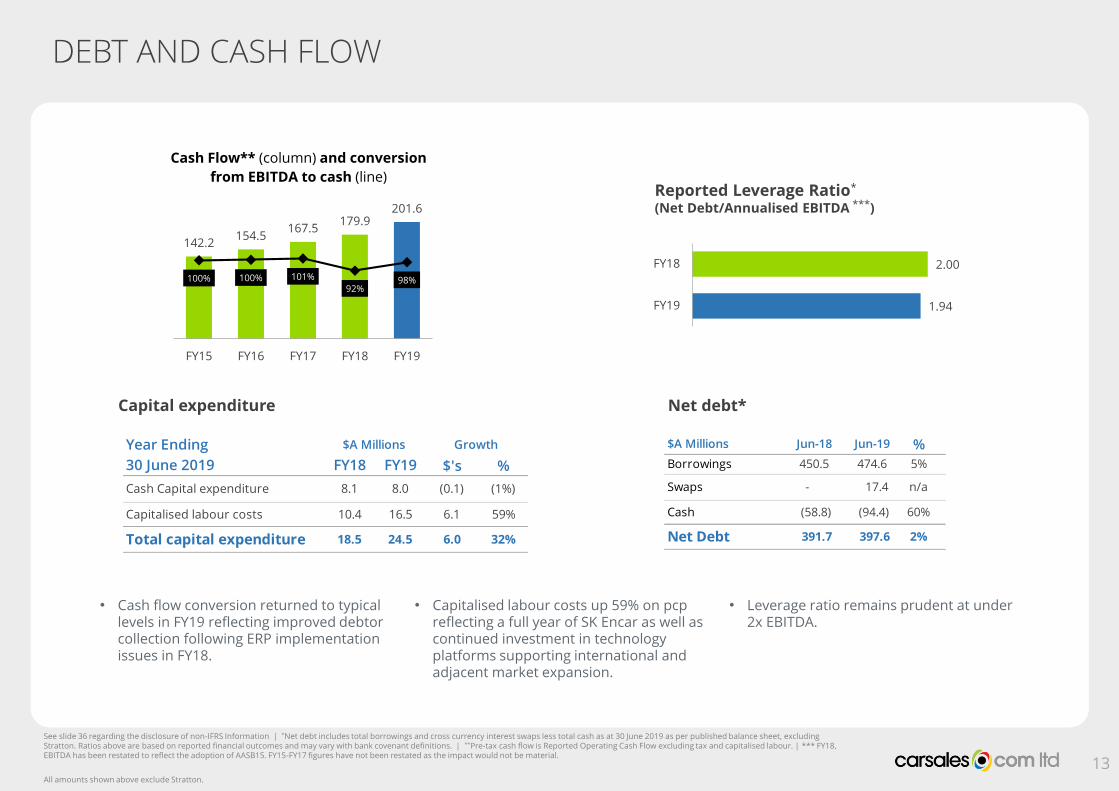
2.00
1.94
FY18
FY19
Reported Leverage Ratio*
(Net Debt/Annualised EBITDA ***)
Net debt*
• Cash flow conversion returned to typical levels in FY19 reflecting improved debtor collection following ERP implementation issues in FY18.
• Capitalised labour costs up 59% on pcp reflecting a full year of SK Encar as well as continued investment in technology platforms supporting international and adjacent market expansion.
• Leverage ratio remains prudent at under 2x EBITDA.
142.2154.5
167.5179.9
201.6
100% 100% 101%
92%98%
40%
60%
80%
100%
120%
140%
0.0
50.0
100.0
150.0
200.0
250.0
FY15 FY16 FY17 FY18 FY19
Cash Flow** (column) and conversion
from EBITDA to cash (line)
$A Millions Jun-18 Jun-19 %
Borrowings 450.5 474.6 5%
Swaps - 17.4 n/a
Cash (58.8) (94.4) 60%
Net Debt 391.7 397.6 2%
Capital expenditure
13
Year Ending
30 June 2019 FY18 FY19 $'s %
Cash Capital expenditure 8.1 8.0 (0.1) (1%)
Capitalised labour costs 10.4 16.5 6.1 59%
Total capital expenditure 18.5 24.5 6.0 32%
$A Millions Growth

14
CARSALES AUSTRALIA

Q4 FY18 Q1 FY19 Q2 FY19 Q3 FY19 Q4 FY19
Average Daily Unique Audience Market Share*
carsales Competitor 1 Competitor 2 Competitor 3
EXTENDING OUR AUSTRALIAN MARKET LEADERSHIP
+ 1.51x + 1.55x + 1.67x + 1.75x + 1.78x
*Nielsen Ratings average daily unique audience per quarter
15

$112.9$123.8
$133.5$144.0
$153.9
FY15 FY16 FY17 FY18 FY19
($m)
• Solid growth in core Dealer advertising revenue
driven by higher used car leads volumes.
• Reflected the ongoing strength of the used car
market and 7% growth in carsales’ unique audience.
• Yield improvements and increased depth
penetration also contributed to revenue growth
across FY19.
Dealer revenue up 7% to $153.9m
Improved reporting a key driver of increase in customer
penetration and usage of depth products.
Depth Reporting
FY18 revenue has been restated to reflect the adoption of AASB15. FY15-FY17 figures have not been restated as the impact would not be material.
DEALER PERFORMANCE SUMMARY
16
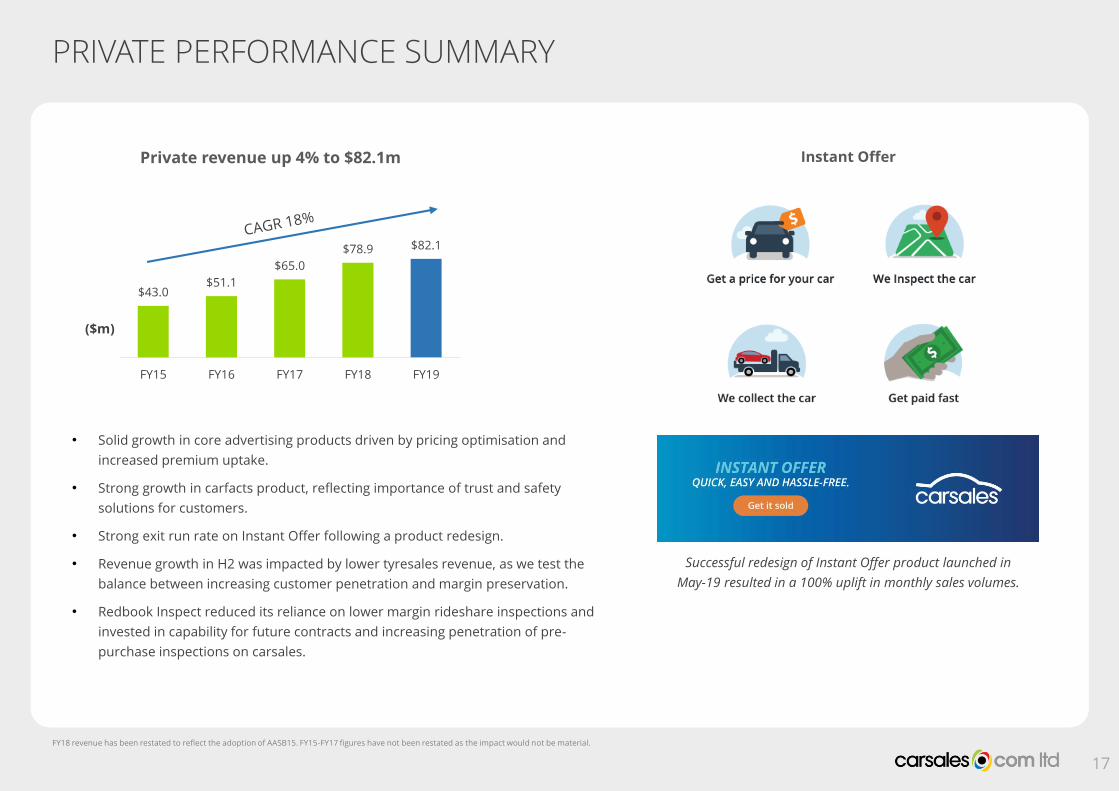
$43.0$51.1
$65.0
$78.9 $82.1
FY15 FY16 FY17 FY18 FY19
($m)
• Solid growth in core advertising products driven by pricing optimisation and
increased premium uptake.
• Strong growth in carfacts product, reflecting importance of trust and safety
solutions for customers.
• Strong exit run rate on Instant Offer following a product redesign.
• Revenue growth in H2 was impacted by lower tyresales revenue, as we test the
balance between increasing customer penetration and margin preservation.
• Redbook Inspect reduced its reliance on lower margin rideshare inspections and
invested in capability for future contracts and increasing penetration of pre-
purchase inspections on carsales.
Private revenue up 4% to $82.1m
Successful redesign of Instant Offer product launched in
May-19 resulted in a 100% uplift in monthly sales volumes.
Instant Offer
FY18 revenue has been restated to reflect the adoption of AASB15. FY15-FY17 figures have not been restated as the impact would not be material.
PRIVATE PERFORMANCE SUMMARY
17

$62.8$67.9
$72.9 $73.9
$64.1
FY15 FY16 FY17 FY18 FY19
• Display advertising revenue down 13%, albeit with a much
improved run rate in Q4.
• Reflects challenging advertising environment as a result of
subdued new car market.
• Changes made to new car offering and products including video
and native placements are well received by our OEM customers.
Display revenue down 13% to $64.1m
CAGR 1%
($m)
Positive response from OEMs with new car listings up 22%
between Dec-18 and Jun-19.
Refreshed new car offering
FY18 revenue has been restated to reflect the adoption of AASB15. FY15-FY17 figures have not been restated as the impact would not be material.
DISPLAY PERFORMANCE SUMMARY
18

$33.0$35.8
$39.3$42.2 $43.2
FY15 FY16 FY17 FY18 FY19
• H2 revenue growth impacted by intentional exit of low margin
products and contracts. Underlying revenue growth of ~9% in
FY19 excluding this impact.
• Strong demand for our proprietary data and research products.
• Good growth in vehicle appraisals product as dealers seek to
grow their used car inventory supply.
• RedBook business continues to record pleasing revenue growth,
consolidating its position as a market leading source of vehicle
specification, valuation and pricing data.
DR&S revenue up 2% on pcp to $43.2m Vehicle Appraisal Solutions
Strong demand for our new appraisals product.
FY18 revenue has been restated to reflect the adoption of AASB15. FY15-FY17 figures have not been restated as the impact would not be material.
DATA, RESEARCH & SERVICES PERFORMANCE SUMMARY
19

CARSALES INTERNATIONAL

Associate Entity
INTERNATIONAL SUMMARY
*Revenue and EBITDA stated is 100% of the revenue and EBITDA for the business.** Reflects growth in local currency, excluding the impact of FX.
Consolidated Entities
Summary
• Excellent progress in our international expansion strategy translating into an increasingly significant revenue and earnings contribution.
Revenue
• Strong reported revenue growth, largely reflecting the acquisition of SK Encar.
• Double digit constant currency growth in all international classifieds businesses.
EBITDA
• Excellent international look through EBITDA growth of 29%, reflecting strength in Korea and Brazil.
• Losses incurred in Argentina and Mexico in our aggressive pursuit of clear market leadership.
Associate Entity
• Webmotors (Brazil) continued to perform very strongly and make excellent progress in extending its market leading position.
FY18 FY19 $'s %
Revenue 53.8 67.8 14.0 26% 35%
EBITDA 20.4 29.3 8.9 44% 54%
Webmotors - underlying results*$A Millions Growth
Constant
Currency
(%)**
FY18 FY19 $'s %
Revenue
SK Encar 26.0 61.0 35.0 135% n/a
RedBook Asia and New Zealand 3.7 4.1 0.4 9% 8%
carsales Asia 29.7 65.1 35.4 119% n/a
Carsales Mexico 1.1 1.9 0.8 69% 64%
Carsales Chile 5.0 5.9 0.9 17% 17%
Demotores Argentina 2.1 1.3 (0.8) (37%) 13%
carsales Latin America 8.2 9.1 0.9 11% n/a
Total International revenue 37.9 74.2 36.3 96% n/a
EBITDA
SK Encar 13.8 29.9 16.1 117% n/a
RedBook Asia and New Zealand 1.9 2.1 0.2 8% 1%
carsales Asia 15.7 32.0 16.3 (104%) n/a
Carsales Mexico (2.3) (5.3) (3.0) n/a n/a
Carsales Chile 1.8 1.8 0.0 0% 1%
Demotores Argentina (2.1) (2.4) (0.3) n/a n/a
carsales Latin America (2.6) (5.9) (3.3) n/a n/a
Total International EBITDA 13.2 26.1 12.9 98% n/a
International - reported results$A Millions Growth
Constant
Currency
(%)**
21

FY18 FY19
Leads 1
FY18 FY19
Page Views 1
CARSALES ASIA – SK ENCAR (KOREA)
+6%
+13%
84%
3%
12%1%
FY19 Revenue by Category
Dealer Private Display Other
* Revenue and EBITDA is 100% of the revenue and EBITDA of the business
1 Page views and leads generated for the period Jul-18 to Jul-19 compared with Jun-17 to Jun-18
Pro-Forma (100%)* FY18 FY19 PCP
KRWb KRWb %
Reported revenue 43.8 49.5 13%
Reported EBITDA 21.4 24.3 13%
Financial commentary:
• Good performance in first full year of ownership.
• Good growth across all key revenue channels of Dealer, Private and Display.
• Key revenue growth drivers:
• Increased uptake of premium listing dealer products, particularly the SK Encar Guarantee vehicle inspection service, which has been fuelled by geographic expansion into new branches outside of the key major cities.
• Attaining additional share of media spend from key OEM, finance and insurance clients through a more targeted sales approach, as well as pleasing adoption of the new native display mobile advertising product.
• H2 revenue growth impacted by a softer Korean economy, partly as a consequence of the recent trade dispute with Japan.
• Significant upside remains via:
• Additional value added services, particularly the SK Encar Guarantee service; and
• Dealer yield and volume growth into FY20 and beyond. Implemented a price rise on Guarantee product in August 2019.
22
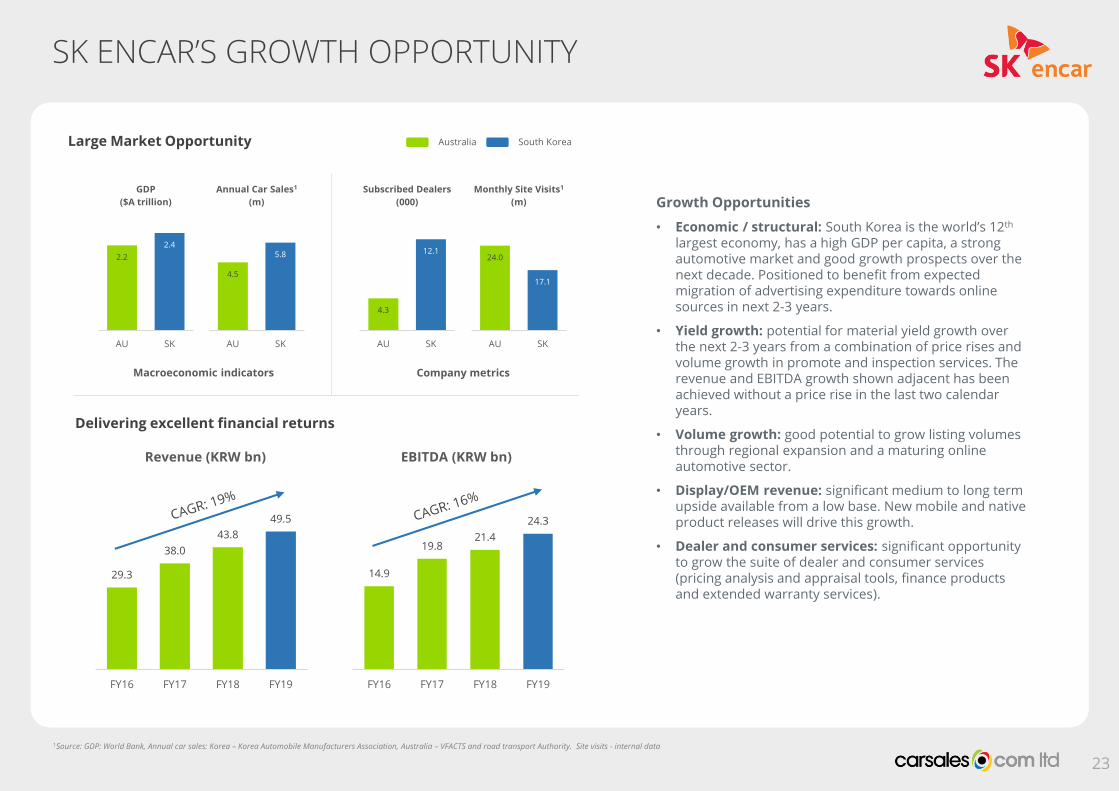
29.3
38.0
43.8
49.5
FY16 FY17 FY18 FY19
Growth Opportunities
• Economic / structural: South Korea is the world’s 12th
largest economy, has a high GDP per capita, a strong automotive market and good growth prospects over the next decade. Positioned to benefit from expected migration of advertising expenditure towards online sources in next 2-3 years.
• Yield growth: potential for material yield growth over the next 2-3 years from a combination of price rises and volume growth in promote and inspection services. The revenue and EBITDA growth shown adjacent has been achieved without a price rise in the last two calendar years.
• Volume growth: good potential to grow listing volumes through regional expansion and a maturing online automotive sector.
• Display/OEM revenue: significant medium to long term upside available from a low base. New mobile and native product releases will drive this growth.
• Dealer and consumer services: significant opportunity to grow the suite of dealer and consumer services (pricing analysis and appraisal tools, finance productsand extended warranty services).
SK ENCAR’S GROWTH OPPORTUNITY
1Source: GDP: World Bank, Annual car sales: Korea – Korea Automobile Manufacturers Association, Australia – VFACTS and road transport Authority. Site visits - internal data
Delivering excellent financial returns
Australia
Macroeconomic indicators Company metrics
South KoreaLarge Market Opportunity
Revenue (KRW bn)
14.9
19.821.4
24.3
FY16 FY17 FY18 FY19
EBITDA (KRW bn)
2.2
2.4
AU SK
GDP
($A trillion)
4.5
5.8
AU SK
Annual Car Sales1
(m)
4.3
12.1
AU SK
Subscribed Dealers
(000)
24.0
17.1
AU SK
Monthly Site Visits1
(m)
23

FY18 FY19
Dealers 1
FY18 FY19
Inventory 1
CARSALES LATIN AMERICA – WEBMOTORS (BRAZIL)
*Revenue and EBITDA stated is 100% of the revenue and EBITDA for the business. The carsales share of earnings is based on owning the percentage set out above. Adjusted NPAT stated above excludes intangible amortisation. See slide 36 regarding the disclosure of non-IFRS Information and slides 37-38 for a reconciliation of Adjusted NPAT to Reported NPAT.
1Inventory and dealer volume counts as at 30 June 2019 compared with 30 June 2018.
+38% +14%
carsales Share of Earnings (30% owned – equity accounted)
Pro-Forma (100%) FY18 FY19 PCP
BRLm BRLm %
Underlying revenue* 138.5 186.8 35%
Underlying EBITDA* 52.6 80.8 54%
FY18 FY19 PCP
AUDm AUDm %
Reported NPAT 3.6 5.1 42%
Adjusted NPAT* 4.2 5.7 36%
Financial commentary:
• Outstanding financial performance in FY19 as Webmotors consolidates its position as the clear no.1 automotive vertical classified site in Brazil.
• 25% growth in dealer revenue as a result of a large increase in dealer numbers and improved yield per dealership. The new ‘Cockpit’ platform for dealers has been well received and is a key growth driver.
• Significant growth in finance and insurance revenue, primarily driven by the Santander bank integration, which allows seamless credit assessment, including approval into Cockpit.
• Good operating leverage, supported EBITDA margin expansion from 38% to 43%.
• Outstanding growth in key operational metrics:
• Inventory up 38%; and
• Dealer customer numbers up 14%.
24
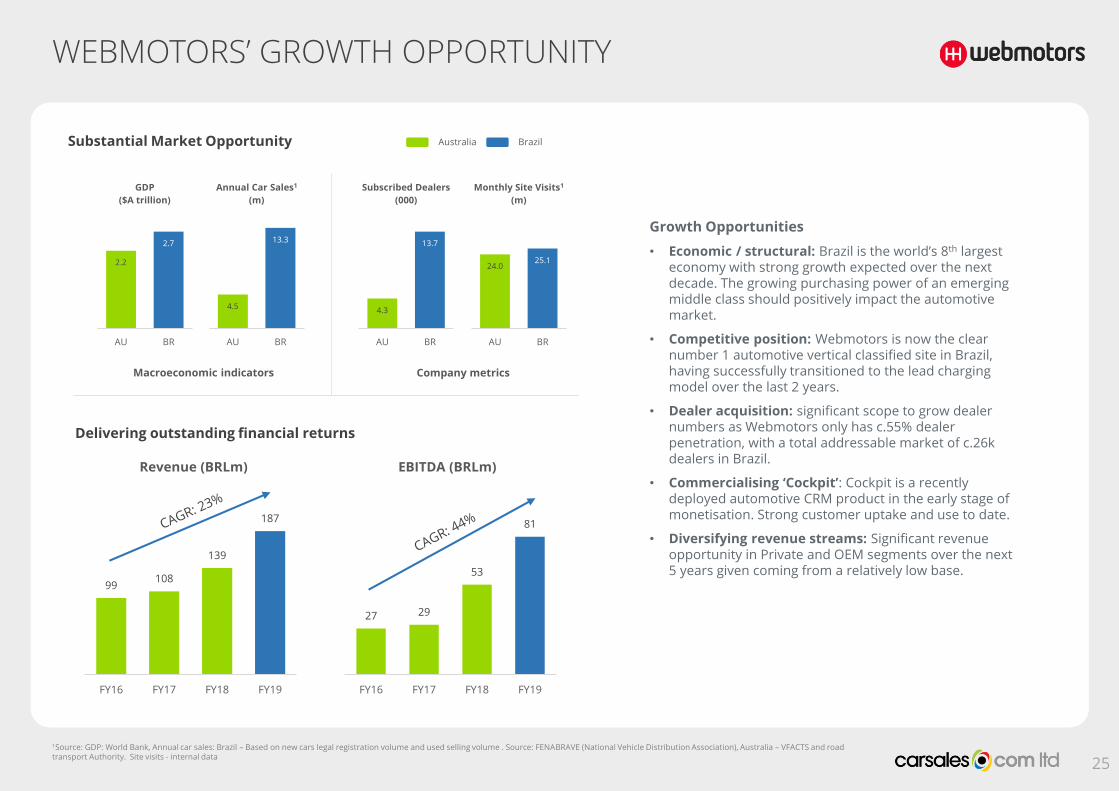
WEBMOTORS’ GROWTH OPPORTUNITY
1Source: GDP: World Bank, Annual car sales: Brazil – Based on new cars legal registration volume and used selling volume . Source: FENABRAVE (National Vehicle Distribution Association), Australia – VFACTS and road transport Authority. Site visits - internal data
Growth Opportunities
• Economic / structural: Brazil is the world’s 8th largest economy with strong growth expected over the next decade. The growing purchasing power of an emerging middle class should positively impact the automotive market.
• Competitive position: Webmotors is now the clear number 1 automotive vertical classified site in Brazil, having successfully transitioned to the lead charging model over the last 2 years.
• Dealer acquisition: significant scope to grow dealer numbers as Webmotors only has c.55% dealer penetration, with a total addressable market of c.26k dealers in Brazil.
• Commercialising ‘Cockpit’: Cockpit is a recently deployed automotive CRM product in the early stage of monetisation. Strong customer uptake and use to date.
• Diversifying revenue streams: Significant revenue opportunity in Private and OEM segments over the next 5 years given coming from a relatively low base.
Delivering outstanding financial returns
99108
139
187
FY16 FY17 FY18 FY19
27 29
53
81
FY16 FY17 FY18 FY19
Revenue (BRLm) EBITDA (BRLm)
Australia
Macroeconomic indicators Company metrics
BrazilSubstantial Market Opportunity
2.2
2.7
AU BR
GDP
($A trillion)
4.5
13.3
AU BR
Annual Car Sales1
(m)
4.3
13.7
AU BR
Subscribed Dealers
(000)
24.025.1
AU BR
Monthly Site Visits1
(m)
25

CH
ILE
AR
GE
NT
INA
ME
XIC
O
FY18 FY19
Inventory 1
CARSALES LATIN AMERICA
FY18 FY19
Inventory 1
FY18 FY19
Page Views 2
FY18 FY19
Leads 2
FY18 FY19
Inventory 1
FY18 FY19
Leads 2
+27% +65%
+23% +48%
+1%+8% • Revenue growth primarily driven by dealer volume growth and yield expansion.
• EBITDA margin impacted by investment in marketing, talent and product innovation.
• Pleasing growth in traffic and inventory metrics, reflecting marketing investment as well as upside from the continued deployment of our global platform.
• Strong revenue growth primarily driven by dealer acquisition and increased dealer yield.
• Resilient revenue result reflecting good growth in dealer and display revenue.
• Continuing to invest in our marketing, people and products in a difficult economic environment to strengthen our no.1 position in the market and grow key performance metrics.
FY18 FY19 PCP
ARS $'000 ARS $'000 %
Reported revenue 30,736 34,594 13%
Reported EBITDA (28,189) (64,591) n/a
FY18 FY19 PCP
CLPm CLPm %
Reported revenue 2,416 2,821 17%
Reported EBITDA 858 865 1%
1Inventory and dealer volume counts as at 30 June 2019 compared with 30 June 2018.
2Page views and leads generated for the period Jul-18 to Jul-19 compared with Jun-17 to Jun-18
FY18 FY19 PCP
MXN $'000 MXN $'000 %
Reported revenue 16,531.7 27,072.9 64%
Reported EBITDA (33,217) (71,732) n/a
26

STRATEGY UPDATE

Digital marketplacesTo grow our global leadership in digital automotive classified
solutions for consumer and commercial customers
We are focused on three strategic
priorities…
Value added servicesTo build a compelling ecosystem of services that support dealers,
OEMs, corporate and private consumers through the buying,
selling and ownership of vehicles
Future horizonsLeveraging consumer insights and
industry trends to explore new opportunities in core and adjacent
markets, and beyond
Data | To become a ‘best-in-class’ data-driven company, with unrivalled data and analytics to help customers understand their audience and commercial clients to grow their businesses
… supported by three enablers…
People | to be an employer of choice and destination for talent by continuously evolving our culture of inclusion, learning, leadership, performance and passion
Technology | To build best-in-class global platform-based software services that exceed the expectations of our customers and drive continued growth in the carsales business
… and underpinned by our unique
culture
Our DNA
Innovation | Simplicity | Customer focus
Our Values
Enjoyment | Respect | Integrity | Communication | Honesty
CARSALES STRATEGY
OUR PURPOSE: We empower people to move freely through our world-leading marketplaces
28

AUSTRALIA KEY FOCUS AREAS
AU
STR
ALI
A
Dealer
• Grow ROI for dealers on core transactions
products
• Increase penetration and usage of listing
depth products
• Create new revenue streams
• Marketing and site optimisation to drive increase in traffic, leads and
yield
• Increased adoption of promote automation and education of
dealers on depth ROI
• Enable dealers to integrate finance offerings with their car listings
Private
• Yield optimisation on core private revenue
• Diversify revenue through value added
services
• Explore dynamic pricing options
• Add new wholesale Instant Offer partners and increase brand
awareness
• Expand inspection and tyresales breadth and scale
• Increased take up of buyer products such as carfacts
Display
• Reinvigorate new car offering for consumers
• Diversify traditional display revenues with
new products
• Introduce targeted programmatic offering
• Increase new car listings with OEMs and launch redeveloped new
car showroom
• Grow penetration of new video products through in house content
solutions agency
• Monetise long tail inventory through in-house programmatic
capability
Data, Research & Services
• Expand product portfolio to address gaps in
the market
• Grow penetration of trust and safety
products
• Build and enhance engagement with
members
• Expand carfacts and Redbook Warranty penetration
• Execute fuel program with Shell to drive member engagement with
carsales
• Drive yield and volume for Redbook
FY20 Focus AreasKey Strategic Objectives
29

4.5
13.3
5.8
5
2.8
1.5
Australia International
Australia Brazil Korea Mexico Argentina Chile
Site
carsales position #1 #1 #1 #1 #1 #2
GDP (AUD trillion)1 2.20 2.38 0.76 2.76 0.44 1.81
Population (m)1 25 51 44 209 18 129
Annual car sales (m)2 4.5 5.8 2.8 13.3 1.5 5.0
Implied market opportunity (A$m)3 388 124 446 72 293
Potential revenue opportunity vs FY19
7 x 56 x 9 x 15 x 266 x
1 Source: World Bank 2 Source: New Car: MarkLines Automotive Portal (TSE: 3901) Used car: management estimates. 3 International revenue opportunity based on replicating core carsales’ Australian share of Australian GDP.
33m cars sold per year
6.5x
INTERNATIONAL OPPORTUNITY IN CONTEXT
The international opportunity is significant for carsales. We have market-leading websites in countries with large addressable markets.
30

INT
ER
NA
TIO
NA
L
Korea
• Increase dealer penetration and yield
• Increase penetration and usage of listing depth
products
• Diversify revenue through new products and services
• Grow dealer penetration and expand guarantee product
volume through launch of c.8 new branch complexes
• Execute price rise on guarantee products
• Launch new native products to drive growth in display revenue
Brazil
• Increase dealer penetration
• Increase dealer yield
• Expand display offering
• Grow dealer penetration by leveraging Santander’s existing and
growing customer base
• Increase dealer leads through optimised mobile site and
improved take up of CRM tool Cockpit
• New site optimised for display advertising
Other LATAM
• Overall – invest in global platform and marketing to
drive #1 positions in all markets
• Chile – execute multiple dealer growth opportunities
• Mexico and Argentina – grow key customer, audience
and inventory metrics to achieve #1 market positions
• Chile – roll out new dealer packages with additional products
and increased yield
• Mexico – expedite growth in dealer numbers through improved
product offering
• Argentina – roll out inventory and lead management tools to
drive dealer engagement and growth
FY20 Focus AreasKey Strategic Objectives
INTERNATIONAL KEY FOCUS AREAS
31

LATAM Tech Hub(Santiago)
Melbourne HQ
carsales continues to invest in its global technology platform to drive future international growth.A global technology platform that operates across verticals and geographies will facilitate speed to market for new product, ongoing cost synergies and reduced duplication of effort.
Trade Platforms Consumer Platforms
• Inventory management• Lead management• CallConnect• LiveMarket• Promote • Data Analytics
• Private Seller• Membership features• Privacy Protect• iOS/Android apps• Retail Platform• Ryvuss Search & Image
GLOBAL PLATFORM
• Significant upside from building a standardised platform of products that subsidiaries are able to utilise as required.
• Global platform is primarily being developed by technology teams in Santiago and Melbourne, but with input from all our technology teams across the world.
• Key trade and consumer products being transitioned to our global platform include but aren’t limited to the following platforms:
32

FY20 OUTLOOK

PERFORMANCE OUTLOOK
Group Outlook
We assume a gradual recovery in Australian automotive market conditions across the year, supported by lower interest rates, an improved lending environment, a recovering property sector and recent tax changes.
We have seen a solid start to the year in our Core Australian Dealer, Private and Data businesses. In Display, we are anticipating an improving trajectory across FY20, albeit market conditions remain challenging in this segment. We also expect our domestic adjacent businesses of tyresales and Redbook Inspect to show good growth in FY20.
In Brazil and Korea, we expect our growth rates to be similar to FY19. We do not anticipate a further deterioration in the South Korean economy as a result of the ongoing trade dispute with Japan.
We expect improving profitability in our Chilean business and a similar level of investment in our Mexican and Argentinian businesses compared with FY19.
Overall, we anticipate Group Revenue, Adjusted EBITDA and Adjusted NPAT growth to be solid in FY20*.
* Growth from ‘AASB 16 – Leases’ restated FY19 result.
34
APPENDIX
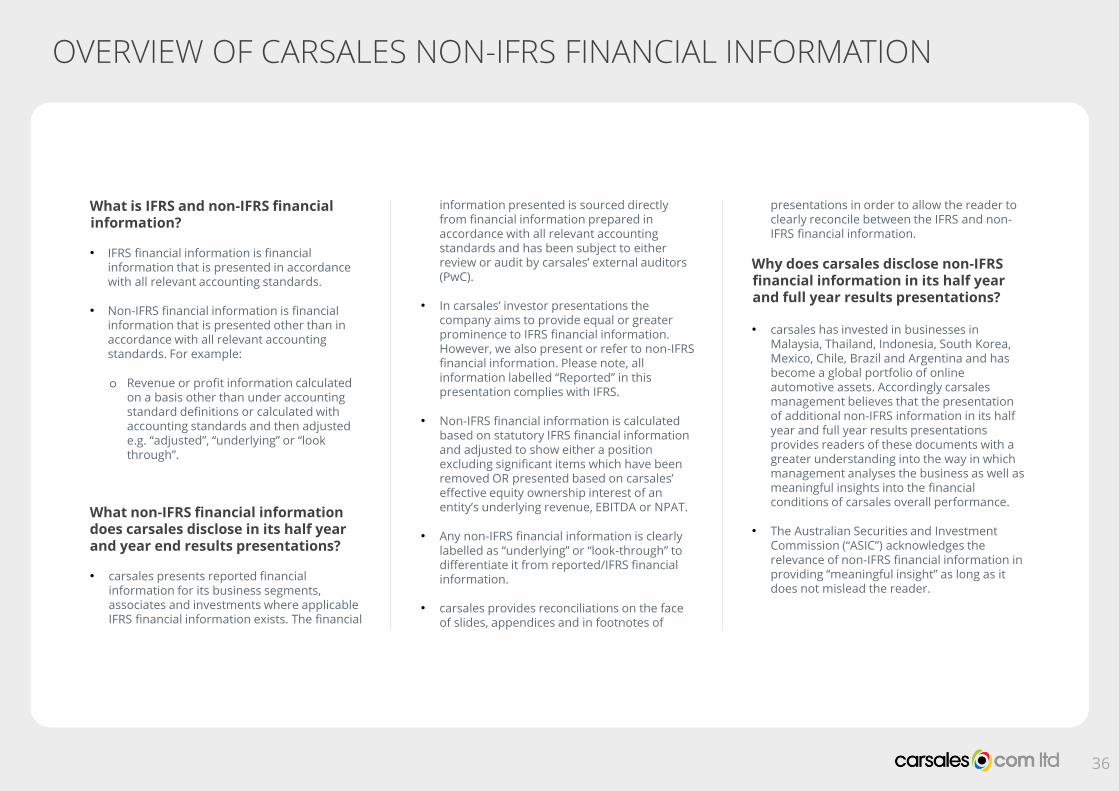
OVERVIEW OF CARSALES NON-IFRS FINANCIAL INFORMATION
What is IFRS and non-IFRS financial information?
• IFRS financial information is financial information that is presented in accordance with all relevant accounting standards.
• Non-IFRS financial information is financial information that is presented other than in accordance with all relevant accounting standards. For example:
o Revenue or profit information calculated on a basis other than under accounting standard definitions or calculated with accounting standards and then adjusted e.g. “adjusted”, “underlying” or “look through”.
What non-IFRS financial information does carsales disclose in its half year and year end results presentations?
• carsales presents reported financial information for its business segments, associates and investments where applicable IFRS financial information exists. The financial
information presented is sourced directly from financial information prepared in accordance with all relevant accounting standards and has been subject to either review or audit by carsales’ external auditors (PwC).
• In carsales’ investor presentations the company aims to provide equal or greater prominence to IFRS financial information. However, we also present or refer to non-IFRS financial information. Please note, all information labelled “Reported” in this presentation complies with IFRS.
• Non-IFRS financial information is calculated based on statutory IFRS financial information and adjusted to show either a position excluding significant items which have been removed OR presented based on carsales’ effective equity ownership interest of an entity’s underlying revenue, EBITDA or NPAT.
• Any non-IFRS financial information is clearly labelled as “underlying” or “look-through” to differentiate it from reported/IFRS financial information.
• carsales provides reconciliations on the face of slides, appendices and in footnotes of
presentations in order to allow the reader to clearly reconcile between the IFRS and non-IFRS financial information.
Why does carsales disclose non-IFRS financial information in its half year and full year results presentations?
• carsales has invested in businesses in Malaysia, Thailand, Indonesia, South Korea, Mexico, Chile, Brazil and Argentina and has become a global portfolio of online automotive assets. Accordingly carsales management believes that the presentation of additional non-IFRS information in its half year and full year results presentations provides readers of these documents with a greater understanding into the way in which management analyses the business as well as meaningful insights into the financial conditions of carsales overall performance.
• The Australian Securities and Investment Commission (“ASIC”) acknowledges the relevance of non-IFRS financial information in providing “meaningful insight” as long as it does not mislead the reader.
36

RECONCILIATION OF REPORTED TO ADJUSTED NPAT
* Tax effected
FY18 FY19 $'s %
182.3 133.2 (49.1) (27%)
Expense Adjustments
- 1.3
- 2.2
Interest Adjustments
0.3 0.4
(4.0) (11.3)
0.4 -
Investment Adjustments
2.1 -
(1.3) (2.1)
0.3 0.5
(57.0) -
123.1 124.3 1.2 1%
Acquired intangible amortisation*
Webmotors 0.6 0.5
SK Encar 3.4 5.8
Soloautos 0.1 0.1
Chileautos 0.5 0.5
Demotores 0.1 0.1
4.7 7.0 2.3 50%
127.8 131.3 3.5 3%
Growth
SK Encar one-off tax adjustment
Restructure cost*
Reported NPAT (continuing operations)
Year Ending
30 June 2019
FY18 Bad Debt Write-off*
Fair value revaluation
Finance Cost Write-off
Option Discounting Unwind
Option Movement in Fair Value
Gain on associate dilution
Non controlling interest
Full Year
NPAT before one-off items
Total acquired intangible amortisation
Adjusted NPAT (continuing operations)
37

ADJUSTED FINANCIALS
Year Ending 30 June 2019 Reported Adjustments Adjusted Reported Adjustments Adjusted Reported Adjusted
Total revenue 376.9 - 376.9 417.5 - 417.5 11% 11%
180.8 - 180.8 212.3 (4.9) 207.4 (17%) (15%)
EBITDA 196.1 - 196.1 205.2 4.9 210.1 5% 7%
EBITDA margin 52% 52% 49% 50%
Depreciation & amortisation 15.6 (3.9) 11.7 24.3 (8.1) 16.2 (55%) (38%)
EBIT 180.5 3.9 184.4 180.9 13.0 193.9 0% 5%
Net financing cost 6.4 3.3 9.7 2.6 10.8 13.4 59% (39%)
Profit Before Tax 174.1 0.7 174.7 178.3 2.2 180.6 2% 3%
Income Tax Expense 53.9 (1.3) 52.5 50.2 3.1 53.3 7% (1%)
Profits from associates 5.1 1.5 6.6 3.1 0.5 3.7 (39%) (44%)
Fair value revaluation 57.0 (57.0) - - - - (100%) -
1.3 (0.9) 0.3 2.1 (1.6) 0.5 65% 66%
Non-controlling interest (NCI) (1.3) - (1.3) (0.1) - (0.1) 94% 94%
Net profit after tax (continuing) 182.3 (54.5) 127.8 133.3 (1.9) 131.4 (27%) 3%
Total profit from discontinued operations 2.2 (48.0)
Net profit after tax (total) 184.6 85.3
Gain on associate investment dilution
FY18 FY19 Growth %
Total operating expenses
$A Millions
38
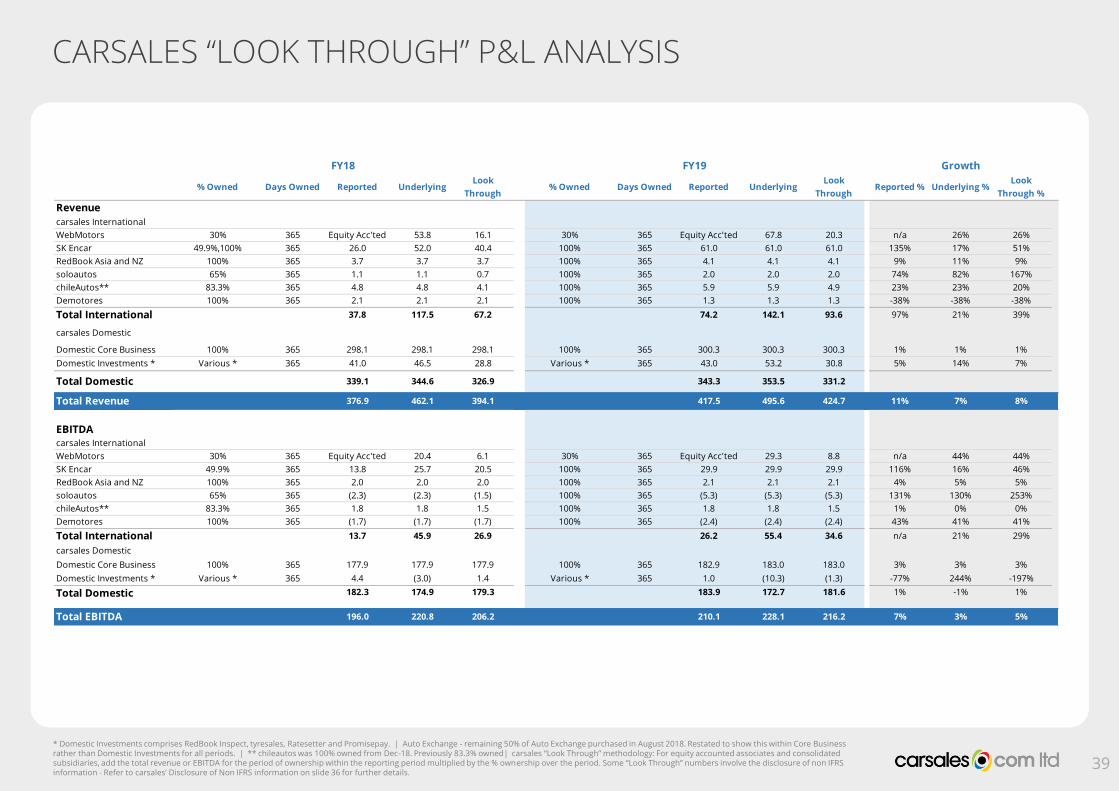
CARSALES “LOOK THROUGH” P&L ANALYSIS
* Domestic Investments comprises RedBook Inspect, tyresales, Ratesetter and Promisepay. | Auto Exchange - remaining 50% of Auto Exchange purchased in August 2018. Restated to show this within Core Business rather than Domestic Investments for all periods. | ** chileautos was 100% owned from Dec-18. Previously 83.3% owned| carsales “Look Through” methodology: For equity accounted associates and consolidated subsidiaries, add the total revenue or EBITDA for the period of ownership within the reporting period multiplied by the % ownership over the period. Some “Look Through” numbers involve the disclosure of non IFRS information - Refer to carsales’ Disclosure of Non IFRS information on slide 36 for further details.
% Owned Days Owned Reported UnderlyingLook
Through% Owned Days Owned Reported Underlying
Look
ThroughReported % Underlying %
Look
Through %
Revenue
carsales International
WebMotors 30% 365 Equity Acc'ted 53.8 16.1 30% 365 Equity Acc'ted 67.8 20.3 n/a 26% 26%
SK Encar 49.9%,100% 365 26.0 52.0 40.4 100% 365 61.0 61.0 61.0 135% 17% 51%
RedBook Asia and NZ 100% 365 3.7 3.7 3.7 100% 365 4.1 4.1 4.1 9% 11% 9%
soloautos 65% 365 1.1 1.1 0.7 100% 365 2.0 2.0 2.0 74% 82% 167%
chileAutos** 83.3% 365 4.8 4.8 4.1 100% 365 5.9 5.9 4.9 23% 23% 20%
Demotores 100% 365 2.1 2.1 2.1 100% 365 1.3 1.3 1.3 -38% -38% -38%
Total International 37.8 117.5 67.2 74.2 142.1 93.6 97% 21% 39%
carsales Domestic
Domestic Core Business 100% 365 298.1 298.1 298.1 100% 365 300.3 300.3 300.3 1% 1% 1%
Domestic Investments * Various * 365 41.0 46.5 28.8 Various * 365 43.0 53.2 30.8 5% 14% 7%
Total Domestic 339.1 344.6 326.9 343.3 353.5 331.2
Total Revenue 376.9 462.1 394.1 417.5 495.6 424.7 11% 7% 8%
EBITDA
carsales International
WebMotors 30% 365 Equity Acc'ted 20.4 6.1 30% 365 Equity Acc'ted 29.3 8.8 n/a 44% 44%
SK Encar 49.9% 365 13.8 25.7 20.5 100% 365 29.9 29.9 29.9 116% 16% 46%
RedBook Asia and NZ 100% 365 2.0 2.0 2.0 100% 365 2.1 2.1 2.1 4% 5% 5%
soloautos 65% 365 (2.3) (2.3) (1.5) 100% 365 (5.3) (5.3) (5.3) 131% 130% 253%
chileAutos** 83.3% 365 1.8 1.8 1.5 100% 365 1.8 1.8 1.5 1% 0% 0%
Demotores 100% 365 (1.7) (1.7) (1.7) 100% 365 (2.4) (2.4) (2.4) 43% 41% 41%
Total International 13.7 45.9 26.9 26.2 55.4 34.6 n/a 21% 29%
carsales Domestic
Domestic Core Business 100% 365 177.9 177.9 177.9 100% 365 182.9 183.0 183.0 3% 3% 3%
Domestic Investments * Various * 365 4.4 (3.0) 1.4 Various * 365 1.0 (10.3) (1.3) -77% 244% -197%
Total Domestic 182.3 174.9 179.3 183.9 172.7 181.6 1% -1% 1%
Total EBITDA 196.0 220.8 206.2 210.1 228.1 216.2 7% 3% 5%
GrowthFY18 FY19
39

AASB 16 LEASES ADOPTION
FY19AASB16
Adjustments
FY19
Re-stated
Total revenue 417.5 - 417.5
Adjusted EBITDA
Online Advertising 158.4 4.8 163.3
Data, Research and Services 25.5 - 25.5
carsales Asia 32.0 2.4 34.5
carsales Latin America (5.9) 0.5 (5.4)
Total Adjusted EBITDA 210.1 7.7 217.9
Depreciation & amortisation 16.2 7.2 23.4
EBIT 193.9 0.6 194.5
Net finance costs 13.4 2.1 15.5
Profit Before Tax 180.6 (1.5) 179.1
Income Tax Expense 53.3 - 53.3
Profits from associates 3.7 - 3.7
Non-controlling interests (NCI) 0.4 - 0.4
Adjusted NPAT (continuing operations) 131.4 (1.5) 129.9
Adjustments 1.9 - 1.9
133.3 (1.5) 131.8Reported net profit after tax (continuing operations)
Year Ending
30 June 2019
$A Millions
The carsales Group is required to adopt AASB16 leases from 1 July 2019. We have assessed the estimated impact that the application of IFRS
16 will have on our FY19 results in the table adjacent as a guide to the future impact. The leasing standard will be applied retrospectively.
40

STRATTON FINANCE – DISCONTINUED OPERATIONS
In June 2019, the Group announced its intention to divest the 50.1% stake in Stratton Finance Pty Ltd. Stratton has been treated as a
held for sale asset and a discontinued operation at 30 June 2019. All numbers in this presentation exclude Stratton Finance for all
period presented unless otherwise stated.
FY18 FY19 $'s %
Core Finance 46.5 37.1 (9.4) (20%)
Other products 22.0 19.9 (2.1) (10%)
Total Revenue 68.5 57.0 (11.5) (17%)
Cost of sales 18.5 16.6 1.9 10%
Gross Profit 50.0 40.4 (9.6) (19%)
Operating Expenses 41.8 38.0 3.8 9%
8.2 2.4 (5.9) (71%)
Depreciation & Amortisation 1.1 1.3 (0.3) (24%)
Net Interest expense 0.2 0.2 - -
Income Tax expense 2.2 0.5 1.7 77%
Non controlling interest (NCI)* (2.1) (0.2) 1.9 90%
2.7 0.1 (2.6) (96%)
Adjustments (0.5) (48.1) (47.6) n/a
2.2 (48.0) (50.2) n/a
Variance$A MillionsYear Ending
30 June 2019
EBITDA
carsales share of Adjusted NPAT
carsales share of Reported NPAT
41

42