Embed Size (px)
Citation preview

Presented by
Paul Fineman, CEO and Giles Willits, CFO
Full Year Results Presentation 2019

ANOTHER YEAR OF SIGNIFICANT PROGRESSSuccess delivered through:
Innovationdriving sales of over 50,000 SKUs in the year
Growthorganic growth across all regions
Acquisitionof Impact Innovations, Inc. in August 2018 and a successful initial phase of integration
Investmentin capital, equipment, processes and people
Financialrecord revenues, profits, EPS and cash generation
IG Design Group plc FULL YEAR RESULTS PRESENTATION 2019 2

OUR CUSTOMER FOCUSED BUSINESS
SourcedManufactured in-house
30% 70%
Source
EverydayMinor seasonsChristmas
56% 39% 5%
Season
Stationery(a) NFR(b)GiftingCelebrations
77% 11% 8% 4%
Product
Europe AUS ROWUKUSA
53% 22% 15% 8% 2%
Customer destination
Revenues by:
(a) Stationery and creative play.
(b) 'Not-for-resale' consumables.
Customers
Being their Partnerof choice
Product design& development
& sou
rcin
g
M
anufa
ctur
ing&
fulfilment
Distribution
IG Design Group plc FULL YEAR RESULTS PRESENTATION 2019 3
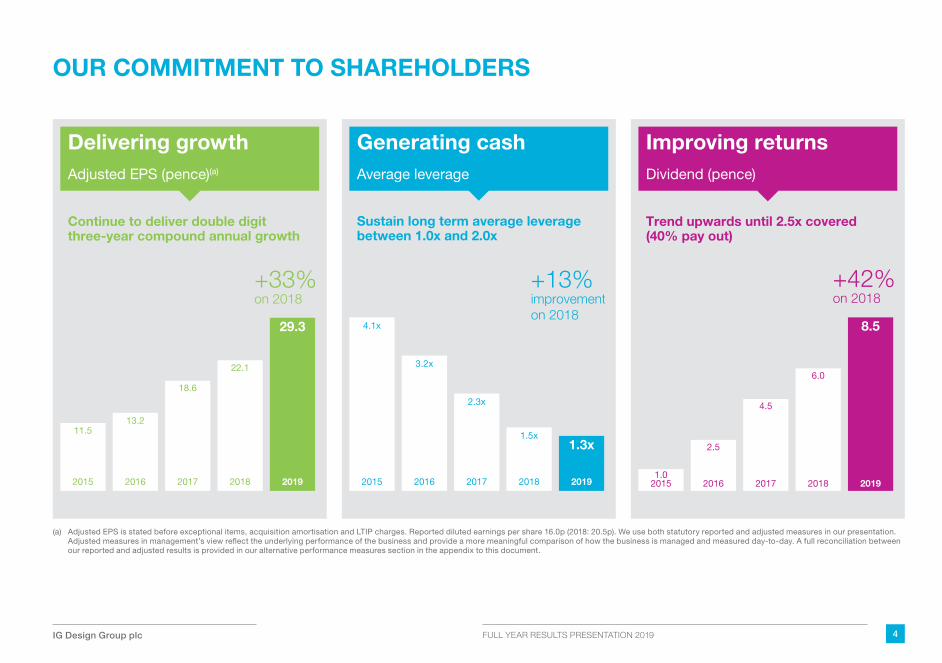
OUR COMMITMENT TO SHAREHOLDERS
Continue to deliver double digit three-year compound annual growth
Delivering growthAdjusted EPS (pence)(a)
(a) Adjusted EPS is stated before exceptional items, acquisition amortisation and LTIP charges. Reported diluted earnings per share 16.0p (2018: 20.5p). We use both statutory reported and adjusted measures in our presentation. Adjusted measures in management’s view reflect the underlying performance of the business and provide a more meaningful comparison of how the business is managed and measured day-to-day. A full reconciliation between our reported and adjusted results is provided in our alternative performance measures section in the appendix to this document.
Sustain long term average leverage between 1.0x and 2.0x
Generating cashAverage leverage
Improving returnsDividend (pence)
Trend upwards until 2.5x covered (40% pay out)
+33%on 2018
2015 2016 2017 2018 2019
11.513.2
18.6
22.1
29.3
+33%on 2018
2015 2016 2017 2018 2019
11.513.2
18.6
22.1
29.3
2015 2016 2017 2018 2019
4.1x
3.2x
2.3x
1.5x1.3x
+13%improvementon 2018
2015 2016 2017 2018 2019
4.1x
3.2x
2.3x
1.5x1.3x
+13%improvementon 2018
2015 2016 2017 2018 20191.0
2.5
4.5
6.0
8.5 +42%on 2018
2015 2016 2017 2018 20191.0
2.5
4.5
6.0
8.5 +42%on 2018
IG Design Group plc FULL YEAR RESULTS PRESENTATION 2019 4

Financial overview
IG Design Group plc FULL YEAR RESULTS PRESENTATION 2019 5

Revenue (£m)
(a) Adjusted profit is stated before tax, exceptional items, acquisition amortisation and LTIP charges. Profit before tax stated after exceptional charge of £8.4 million (2018: £0.5 million gain), acquisition amortisation of £1.6 million (2018: £0.4 million) and LTIP charges of £3.0 million (2018: £2.2 million) is £17.3 million (2018: £19.7 million).
237.0229.0
311.0327.5
448.4
2015 2016 2017 2018 2019
+37% on 2018
Adjusted profit(£m)(a)
10.89.2
16.6
21.8
30.3
2015 2016 2017 2018 2019
+39% on 2018
Net cash/(debt) (£m)
+£12.7m on 2018
(17.5)
17.1
4.4
(29.4)
3.0
2015 2016 2017 2018 2019
FINANCIAL HIGHLIGHTS
IG Design Group plc FULL YEAR RESULTS PRESENTATION 2019 6

31 March 31 March 2019 2018 % £m £m change
Revenue 448.4 327.5 37
Gross profit 84.6 70.0 21
Overheads (52.0) (46.8) 11
Adjusted operating profit 32.6 23.2 41
Adjusted operating margin % 7.3% 7.1%
Finance charge (2.3) (1.4) 67
Adjusted profit before tax 30.3 21.8 39
Exceptional items (8.4) 0.5
Acquisition amortisation (1.6) (0.4)
LTIP charges (3.0) (2.2)
Profit before tax 17.3 19.7 (12)
Tax (4.0) (5.4)
Profit after tax 13.3 14.3 (8)
SUMMARY OF FULL YEAR RESULTS
• Revenue increased 37% of which 9.8% organic growth, balance (27%) relating to Impact acquisition
• Adjusted operating margin increased to 7.3% (2018: 7.1%) driven by:
• gross profit margin at 18.9% (2018: 21.4%) down year-on-year reflecting Impact acquisition and product mix
• improved overheads to revenue ratio, at 11.7% compared to 14.4% in the prior year
• Adjusted profit before tax is stated before the amortisation charge associated with acquisition intangibles reflecting the significance of the Impact transaction in the year
• Effective tax rate at 23.4% was lower than prior year reflecting the full year effect of the reduction in US federal tax rate
• Exceptional costs at £8.4 million primarily reflect the costs associated with the Impact acquisition and subsequent restructuring in the US in line with guidance. Breakdown of costs are acquisition costs £2.4 million, US restructuring £5.6 million and UK unification £0.4 million
• Net cash outflow of exceptional costs equal to £0.3 million which includes £4.8 million relating to the sale of Midway
IG Design Group plc FULL YEAR RESULTS PRESENTATION 2019 7

Sales Adjusted operating profit Adjusted margin Group revenue 2019 2018 Growth 2019 2018 Growth 2019 2018
50% Americas $m 289.9 158.8 83% 20.0 12.7 57% 6.9% 8.0%
28% UK £m 127.1 123.3 3% 8.1 7.9 3% 6.4% 6.4%
14% Europe €m 73.0 58.5 25% 10.0 7.5 33% 13.7% 12.9%
9% Australia AU$m 70.3 63.1 11% 7.7 5.0 54% 10.9% 7.9%
(1%) Elims/central costs £m (5.5) (4.8) (4.1) (4.0)
100% Total £m 448.4 327.5 37% 32.6 23.2 41% 7.3% 7.1%
• Adjusted operating profit increased 41% to £32.6 million driven by progress across all regions
• Adjusted margin up 0.2 percentage points to 7.3% reflecting product mix weighted toward higher margin product categories
• Americas revenues and profit boosted by Impact acquisition on 31 August 2018. Impact revenues of $114.9 million, along with organic revenue growth of 10% with significant progress from Creative Play product category
• UK delivered growth in a challenging market, benefiting from ‘Not-for-resale’ bags growth and UK business unification
• Europe increased adjusted margin to 13.7% with strong revenue growth and well executed efficiency gains
• Australia benefited from full integration of the Biscay business acquired in 2018. Current market challenges will impact on 2020 performance
ON TRACK TO DELIVER GROUP MARGIN TARGETS
IG Design Group plc FULL YEAR RESULTS PRESENTATION 2019 8

Year ended Year ended 31 March 2019 31 March 2018 £m £m
Adjusted EBITDA 38.7 28.0Change in trade and other receivables 25.6 (9.1)Change in inventory 4.3 0.4Change in creditors, provisions and accruals (18.1) 3.3
Adjusted cash generated from operations 50.5 22.6Exceptional items from operations (5.0) (0.5)LTIP (0.7) (0.4)
Cash generated from operations 44.8 21.7Proceeds from sale of property, plant and equipment 5.3 2.6Net capital expenditure (7.9) (9.4)Business acquired (66.8) (5.1)Cash acquired with acquisition 1.2 —Tax paid (3.7) (3.1)Interest paid (including exceptional items) (2.1) (1.5)Dividends paid to non-controlling interests (1.1) (0.6)Equity dividends paid (4.6) (3.0)Proceeds from issue of share capital 48.3 0.1Other (0.7) (0.3)
Movement in net cash 12.7 1.4Opening net cash 4.4 3.0
Closing net cash 17.1 4.4
Net cash reconciliation 2019
STRONG CASH CONVERSION FUNDING GROWTH INVESTMENT
£17.1m
Net cash 31 March
2019Net cash 31 March
2018
£4.4m
(£0.2m)
Other reasons
(£0.9m)
Exceptionals and LTIP
£38.7m
EBITDA
(£4.6m)
Equity dividend paid
Acquisitions
(£65.6m)
(£7.9m)
Capex
£11.8m
Working capital
Tax, interest, NCI
(£6.9m)
Proceeds from issue of
shares
£48.3m
130.5% driven by working capital inflows from Impact acquisition
£m
Impact Innovations 24.8
Inventory/growth (13.0)
11.8
Cash conversion
Working capital
IG Design Group plc FULL YEAR RESULTS PRESENTATION 2019 9

As at As at 31 March 2019 31 March 2018 £m £m
Intangibles 83.7 36.5
Fixed assets 39.8 35.5
Stock 69.6 49.3
Trade and other receivables 45.5 37.5
Net cash 17.1 4.4
Trade and other payables (75.0) (59.2)
Deferred income and provisions (4.6) (2.4)
Taxation (0.5) (1.1)
Net assets 175.6 100.5
Attributable to shareholders 171.5 96.9
• The Group adopted IFRS 16 from 1 April 2019 on a modified retrospective basis
• Estimated reduction of adjusted profit is up to £1 million – EBITDA increase up to c.£6 million offset by increased depreciation c.£5 million and finance charges c.£2 million
• Estimated impact on net assets is up to £4 million reduction with non-current assets expected to increase by £31 million and gross liabilities by £35 million
BALANCE SHEET
IFRS 16
(a) Return on capital employed is calculated as adjusted operating profit divided by monthly average net capital employed (excluding cash and intangibles).
Return on capital employed(a)
17.2%15.0%
12.8%
22.5%24.3%
20162015 2017 2018 2019
IG Design Group plc FULL YEAR RESULTS PRESENTATION 2019 10

Average leverage/interest cover Average net debt (£m) Adjusted EBITDA (£m)
16.317.4
22.4
28.0
38.7
2015 2016 2017 2018 2019
NEW FACILITIES TO SUPPORT ORGANIC AND M&A GROWTH
Lender Renewal Facility Margin Covenant
Club facilities Corporate revolving credit facility and overdraft 2022 $80m 1.05% Leverage Working capital revolving credit facility 2022 £85m 1.05% Stock and unfunded debtorsHSBC Asia receivables financing 2022 $18m 1.30% ReceivablesWestpac Biscay loan 2023 AU$9m 1.80% Capital ratio Overdraft Annual AU$10m 1.95% Capital ratio
3.2x
4.9
4.1x
4.4
2.3x
14.5
1.5x
16.7
1.3x
14.1
2015
Interest cover
2016 2017 2018 2019
66.3
55.151.1
41.9
48.8
2015 2016 2017 2018 2019
IG Design Group plc FULL YEAR RESULTS PRESENTATION 2019 11

FUTURE TARGETS
Working with the winners
EPSThree-year CAGR
double digit growth
Leverage1-2x average debt
DividendTrending to 2.5x cover
Design & innovation
Efficiency & scale
Financial KPI targets
Strategic drivers Shareholder commitmentsAnnual organic revenue growth 3-5%
Operating cash conversion in excess
of 75%
EBITDAGrowth of 8-10%
ROCETarget 24% and above
IG Design Group plc FULL YEAR RESULTS PRESENTATION 2019 12

Strategy and outlook
IG Design Group plc FULL YEAR RESULTS PRESENTATION 2019 13

Top 10 customers Sales by channel(%)
Growing revenue through organic growth with both existing and new customers, suppliers and product areas.
STRATEGY IN ACTIONWorking with the winners
• The top 10 customers represent 48% of overall sales, up from 39% in the prior year, and sell our products in over 60,000 out of the more than 210,000 stores selling our product around the world
• In 2019, organic revenue growth with our top 10 customers averaged 17%
• Our focus on working with mass and discount retailers such as Action, Aldi, Costco, Dollar Tree, Lidl, Tesco and Walmart has delivered significant growth with sales up 71% to £277 million, representing 62% of the Group's revenues
Mass and discount retailers Other
2019
2018
38%
50%
62%
50%
Working with the winners
Design & innovation
Efficiency & scale
IG Design Group plc FULL YEAR RESULTS PRESENTATION 2019 14

Develop opportunities in new channels and adjacent product categories while expanding our presence in the growing market for celebration events throughout the year
STRATEGY IN ACTIONDesign & innovation
• A near doubling of revenues of ‘Not-for-resale’ consumables to nearly £20 million including over 10 million 100% biodegradable bags
• A 67% revenue growth in Creative Play products in US with plans to extend to other regions in 2020
Environmental focus: creating competitive advantage from sustainable sourcing
Working with the winners
Design & innovation
Efficiency & scale
IG Design Group plc FULL YEAR RESULTS PRESENTATION 2019 15

Increasing margins through investments in process, people and accretive M&A. We are focused on unlocking synergies and strengthening our ‘one-stop-shop’ position with customers
STRATEGY IN ACTIONEfficiency & scale
• The acquisition of Impact in August 2018 not only doubled the scale of our business in the USA but was transformational for the overall Group
• Investing in our fifth high speed ‘state-of-the-art’ printing press to become operational in early 2020
Design & innovation
Efficiency & scale
Working with the winners
IG Design Group plc FULL YEAR RESULTS PRESENTATION 2019 16

IMPACT INNOVATIONS – ON SCHEDULE TO DELIVER $5M OPERATIONAL SYNERGY
• In December 2018, we consolidated the manufacturing operations of the combined US business into one facility in Memphis
• We closed our production facility and sold the freehold property in Midway
• A new ‘state-of-the-art’ high speed printing press is on track for delivery in winter 2019 (operational early 2020)
• We are fully engaged with our customers and suppliers in identifying opportunities to leverage the combined expertise of our US businesses, including cross-selling opportunities
Synergy driver Synergy timings Comment Status
2019
Sell Midway, Georgia facility
Completed December 2018
✔
2020 2021Combine manufacturing in Memphis
Consolidation to Memphis announced on time in Q3 of 2019 financial year✔ ✔ ✔
Catalogue business relocation
As part of Midway sale, lease back portion of site at lower relocation costs✔ ✔ ✔
Headcount reduction
On track to deliver planned back-office and management savings✔ ✔ ✔
Operating efficiencies
Est. synergy (cumulative $m) 0.5 2.5 5.0
New press ordered in time for delivery Q4 2019 to support 2020/21 manufacturing requirements
✔ ✔
IG Design Group plc FULL YEAR RESULTS PRESENTATION 2019 17

MANAGING OUR CHALLENGES
• No significant trading flows with European customers or suppliers
• Mitigating potential impact through:
• moving to UK-based suppliers
• re-routing imports to western ports
• limited inventory build of raw material paper supplies
• Negotiating terms with suppliers and customers
• Redirecting the supply of goods from other countries, such as Vietnam, Indonesia and India
• Re-engineering products with customers to reduce costs
• Moving production to the US
Brexit US-China tariffs
IG Design Group plc FULL YEAR RESULTS PRESENTATION 2019 18

2020 OUTLOOK
Working with the winners • Growth opportunities to expand across territories and regions with long established customers
• Mass and discount retailers also growing through diversifying Channels including e-commerce and convenience stores
Design & innovation • 2020 will see increased investment in design resource and the establishment of an Innovations Hub in US
• Sustainable sourcing and environmental responsibility will continue to be a focus of attention
Efficiency & scale • We shall benefit from investment in all our manufacturing sites including the second production line for ‘Not-for-resale’ bags and the new state-of-the-art printing press in the USA
• In Asia, we have invested to further leverage our overall purchasing activities from third-party suppliers
• We continue to focus on our active pipeline of M&A opportunities
IG Design Group plc FULL YEAR RESULTS PRESENTATION 2019 19

WHY INVEST?
We will continue to drive organic growth, through our diversified business operating across regions, categories, channels, seasons and brands
We will continue to drive innovation, deliver excellent service and remain our customers’ ‘Partner of Choice’
We will enhance net margins through investment – driving efficiency, streamlining processes and attracting best talent
We will discerningly pursue M&A opportunities supported by our strong balance sheet to deliver incremental growth
We will continue to convert profit into cash and deliver dividend growth through earnings progression
IG Design Group plc FULL YEAR RESULTS PRESENTATION 2019 20

Appendix
IG Design Group plc FULL YEAR RESULTS PRESENTATION 2019 21

MAJOR INVESTMENTS
2012 2013 2014 2015 2016 2017 2018
6.7pAdjusted EPS 7.8p 8.4p 11.5p 13.2p 18.6p 22.1p
2019
29.3p
March 2012Printing press Netherlands
March 2014Major investment in Wales completed
July 2016Acquisition of Lang
June 2016Anker Play Products
established, USA
September 2017Investment bag
machine, UK
April 2015Paper conversion
machine, USA
Capital expenditure
M&A
July 2014Acquisition
of Enper, Holland
August 2018Acquisition of
Impact Innovations, USA
January 2018Acquisition ofBiscay, Australia
March 20182nd printing press operational Netherlands
IG Design Group plc FULL YEAR RESULTS PRESENTATION 2019 22

LARGEST SHAREHOLDERS(C)
Hedlund family(a)
27.97%Octopus Investments
8.15%
Close Brothers AM
3.97%
Miton Group
5.05%
BlackRock
3.99%Paul Fineman(b)
3.25%Polar Capital
3.37%
Schroders Plc
4.52%
(a) In addition to the Hedlund family’s beneficial interest set out above, the Hedlund family is also interested in a further 1,150,790 ordinary shares, representing a further 1.47% of the current issued share capital of the Company. These ordinary shares are held by West Coast Trust, a trust for the benefit of Anders Hedlund’s adult children, which holds 900,790 ordinary shares. In total the Hedlund family is interested in 22,818,994 ordinary shares, representing 29.12% of the current issued share capital of the Company.
(b) This includes a non-beneficial interest in 174,608 ordinary shares at 5p each.(c) Shareholdings as at 31 March 2019.
IG Design Group plc FULL YEAR RESULTS PRESENTATION 2019 23

Customers
Being their Partnerof choice
& sourcingManufacturing
Dis
trib
utio
n&
fulfi
lmen
tProduct design
& development
Working withthe winners
inno
vatio
n
Desig
n &
& scale
Efficiency
Our strategy is built on leveraging our core strengths and focusing on market opportunities
STRATEGY
• Developing in new channels and adjacent product categories
• Expanding in the growing number of events celebrated throughout the year
• Driving margins through investment in process and people
• Accretive M&A opportunities to unlock synergies and strengthening our ‘one-stop-shop’ position with customers
Design & innovation
Efficiency & scale
Working with the winners
• Increasing revenue through organic growth with both existing and new customers, suppliers and product areas
Strategic drivers
IG Design Group plc FULL YEAR RESULTS PRESENTATION 2019 24

MANAGING OUR CHALLENGES
Supply chain
integrity
Customer and
competition
Economic uncertainty
Margin headwinds
Currency and
liquidity
Leadership and
people
• Clear procedures and policies to maintain continuity of supply
• Carefully selected suppliers where performance is monitored
• Regular supply chain audits
• Leveraging our global scale and sourcing expertise in Asia
• Ongoing development of supplier network
• Focus on design, product quality and service
• Maintain diversified product portfolio across customer base
• Ongoing investment in key customer relations
• Continued investment in efficiency to maintain competitiveness
• Close management of costs and margin by product and customer
• Focus on resilient product categories
• Balance business across multiple categories
• Regular monitoring and appropriate action in response to changing circumstances
• Development of impact response plans as required
• Operating in local currencies
• Natural dollar hedging• Active hedging policy• Rolling cash
forecasting and monitoring
• Working with banking partners to deliver necessary funding to support business cash cycle and capacity for new investment requirements
• A portfolio of responses:• leverage overall scale• innovation• re-engineering
products• product mix• negotiation (suppliers
and customers)• selling category
solutions• channel diversity• selective price
increases albeit on a phased basis
• Give our people the knowledge and tools they need
• Build teams to support growth opportunities adding strength and depth where needed
• Maintain appropriate policies and packages to attract and retain top talent
• Develop cross learning programmes to enhance experience for individuals across the Group
Challenge
Response
Current status – our view
IG Design Group plc FULL YEAR RESULTS PRESENTATION 2019 25

ALTERNATIVE PERFORMANCE MEASURES
A full reconciliation between our adjusted and reported results is provided below: 31 March 2019 31 March 2018 £m £m
Adjusted EBITDA 38.7 28.0
Exceptional items (8.3) 0.5
LTIP charges (3.0) (2.2)
EBITDA 27.4 26.3
£m £m
Adjusted profit before tax 30.3 21.8
Exceptional items (8.4) 0.5
Acquisition amortisation (1.6) (0.4)
LTIP charges (3.0) (2.2)
Reported profit before tax 17.3 19.7
£m £m
Adjusted profit after tax 23.2 15.6
Exceptional items (6.4) 0.8
Acquisition amortisation (0.7) (0.3)
LTIP charges (2.8) (1.8)
Reported profit after tax 13.3 14.3
pence pence
Adjusted EPS 29.3 22.1
Exceptional items (including tax effect) (8.6) 1.4
Acquisition amortisation (including tax effect) (0.9) (0.3)
LTIP charges (including tax effect) (3.8) (2.7)
Reported diluted EPS 16.0 20.5
IG Design Group plc FULL YEAR RESULTS PRESENTATION 2019 26

IG Design Group plcNo 7 Water End Barns
Water EndEversholt MK17 9EA
T +44 (0)1525 887 310
thedesigngroup.com