Embed Size (px)
Citation preview

Full wwPDB X-ray Structure Validation Report i○
Mar 8, 2018 – 06:54 pm GMT
PDB ID : 1XTGTitle : Crystal structure of NEUROTOXIN BONT/A complexed with Synaptosoma
l-associated protein 25Authors : Breidenbach, M.A.; Brunger, A.T.
Deposited on : 2004-10-21Resolution : 2.10 Å(reported)
This is a Full wwPDB X-ray Structure Validation Report for a publicly released PDB entry.
We welcome your comments at [email protected] user guide is available at
https://www.wwpdb.org/validation/2017/XrayValidationReportHelpwith specific help available everywhere you see the i○ symbol.
The following versions of software and data (see references i○) were used in the production of this report:
MolProbity : 4.02b-467Xtriage (Phenix) : 1.13
EDS : trunk30967Percentile statistics : 20171227.v01 (using entries in the PDB archive December 27th 2017)
Refmac : 5.8.0158CCP4 : 7.0 (Gargrove)
Ideal geometry (proteins) : Engh & Huber (2001)Ideal geometry (DNA, RNA) : Parkinson et al. (1996)
Validation Pipeline (wwPDB-VP) : trunk30967
Page 2 Full wwPDB X-ray Structure Validation Report 1XTG
1 Overall quality at a glance i○
The following experimental techniques were used to determine the structure:X-RAY DIFFRACTION
The reported resolution of this entry is 2.10 Å.
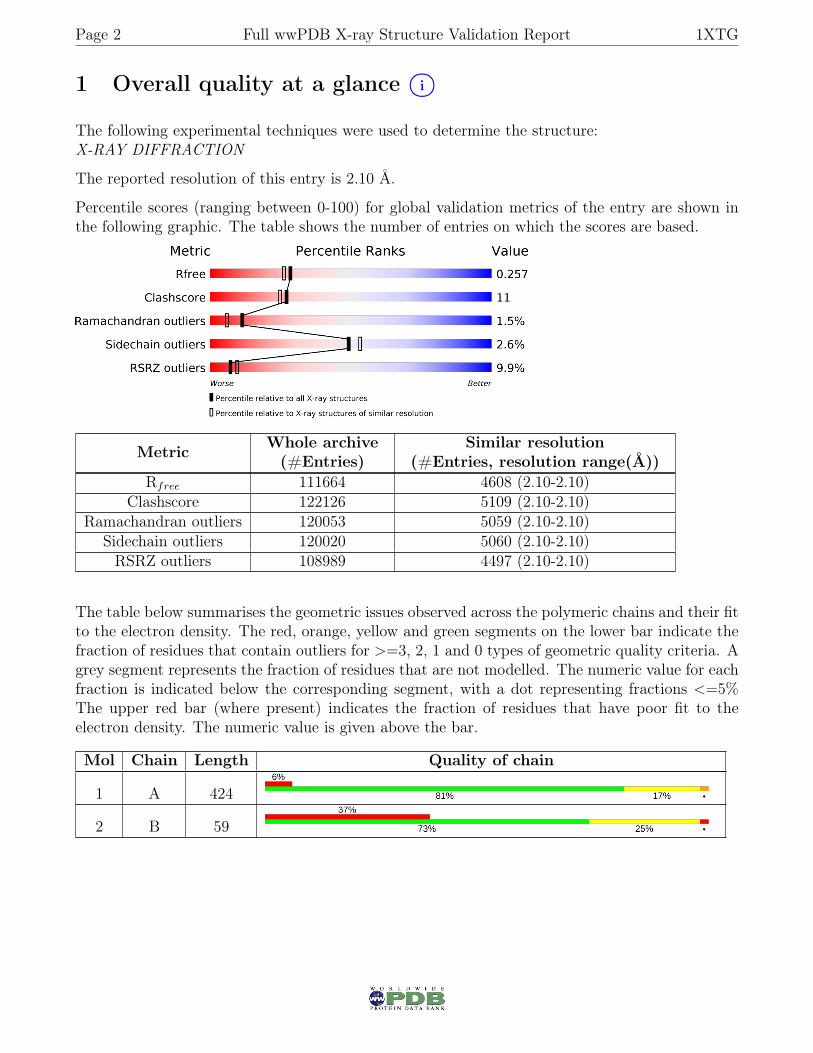
Percentile scores (ranging between 0-100) for global validation metrics of the entry are shown inthe following graphic. The table shows the number of entries on which the scores are based.
Metric Whole archive(#Entries)
Similar resolution(#Entries, resolution range(Å))
Rfree 111664 4608 (2.10-2.10)Clashscore 122126 5109 (2.10-2.10)
Ramachandran outliers 120053 5059 (2.10-2.10)Sidechain outliers 120020 5060 (2.10-2.10)RSRZ outliers 108989 4497 (2.10-2.10)
The table below summarises the geometric issues observed across the polymeric chains and their fitto the electron density. The red, orange, yellow and green segments on the lower bar indicate thefraction of residues that contain outliers for >=3, 2, 1 and 0 types of geometric quality criteria. Agrey segment represents the fraction of residues that are not modelled. The numeric value for eachfraction is indicated below the corresponding segment, with a dot representing fractions <=5%The upper red bar (where present) indicates the fraction of residues that have poor fit to theelectron density. The numeric value is given above the bar.
Mol Chain Length Quality of chain
1 A 424
2 B 59
Page 3 Full wwPDB X-ray Structure Validation Report 1XTG
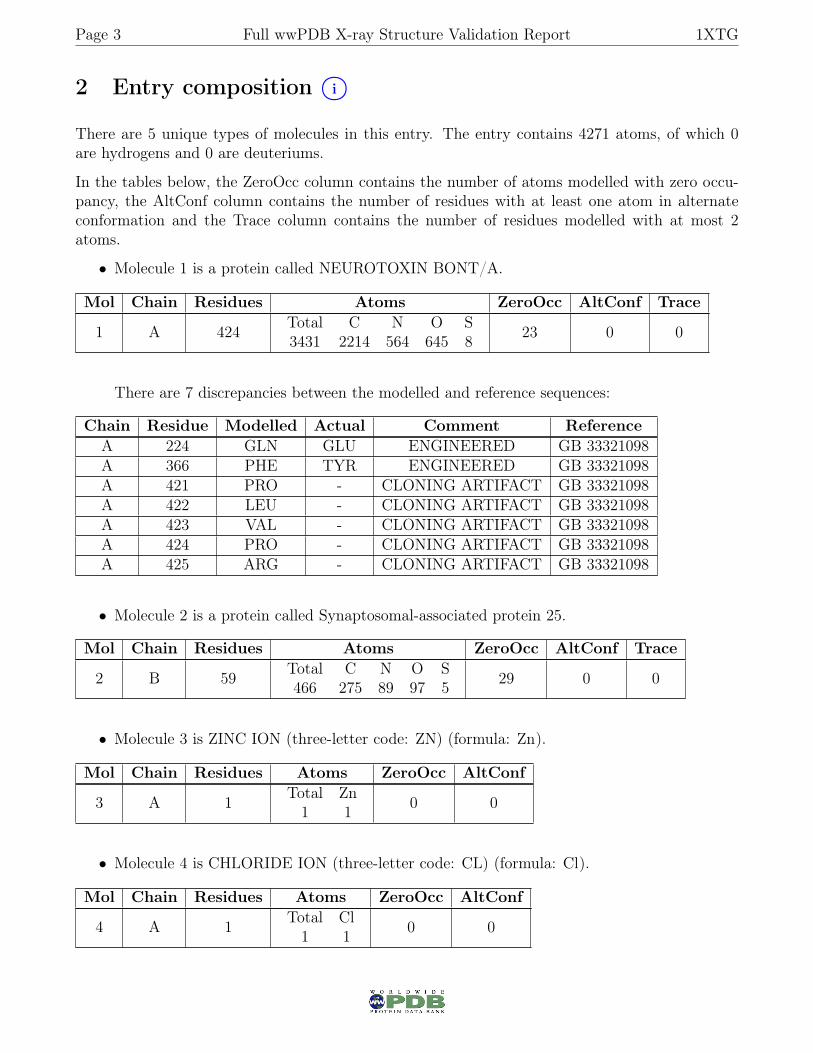
2 Entry composition i○
There are 5 unique types of molecules in this entry. The entry contains 4271 atoms, of which 0are hydrogens and 0 are deuteriums.
In the tables below, the ZeroOcc column contains the number of atoms modelled with zero occu-pancy, the AltConf column contains the number of residues with at least one atom in alternateconformation and the Trace column contains the number of residues modelled with at most 2atoms.
• Molecule 1 is a protein called NEUROTOXIN BONT/A.
Mol Chain Residues Atoms ZeroOcc AltConf Trace
1 A 424 Total C N O S3431 2214 564 645 8 23 0 0
There are 7 discrepancies between the modelled and reference sequences:
Chain Residue Modelled Actual Comment ReferenceA 224 GLN GLU ENGINEERED GB 33321098A 366 PHE TYR ENGINEERED GB 33321098A 421 PRO - CLONING ARTIFACT GB 33321098A 422 LEU - CLONING ARTIFACT GB 33321098A 423 VAL - CLONING ARTIFACT GB 33321098A 424 PRO - CLONING ARTIFACT GB 33321098A 425 ARG - CLONING ARTIFACT GB 33321098
• Molecule 2 is a protein called Synaptosomal-associated protein 25.
Mol Chain Residues Atoms ZeroOcc AltConf Trace
2 B 59 Total C N O S466 275 89 97 5 29 0 0
• Molecule 3 is ZINC ION (three-letter code: ZN) (formula: Zn).
Mol Chain Residues Atoms ZeroOcc AltConf
3 A 1 Total Zn1 1 0 0
• Molecule 4 is CHLORIDE ION (three-letter code: CL) (formula: Cl).
Mol Chain Residues Atoms ZeroOcc AltConf
4 A 1 Total Cl1 1 0 0
Page 4 Full wwPDB X-ray Structure Validation Report 1XTG
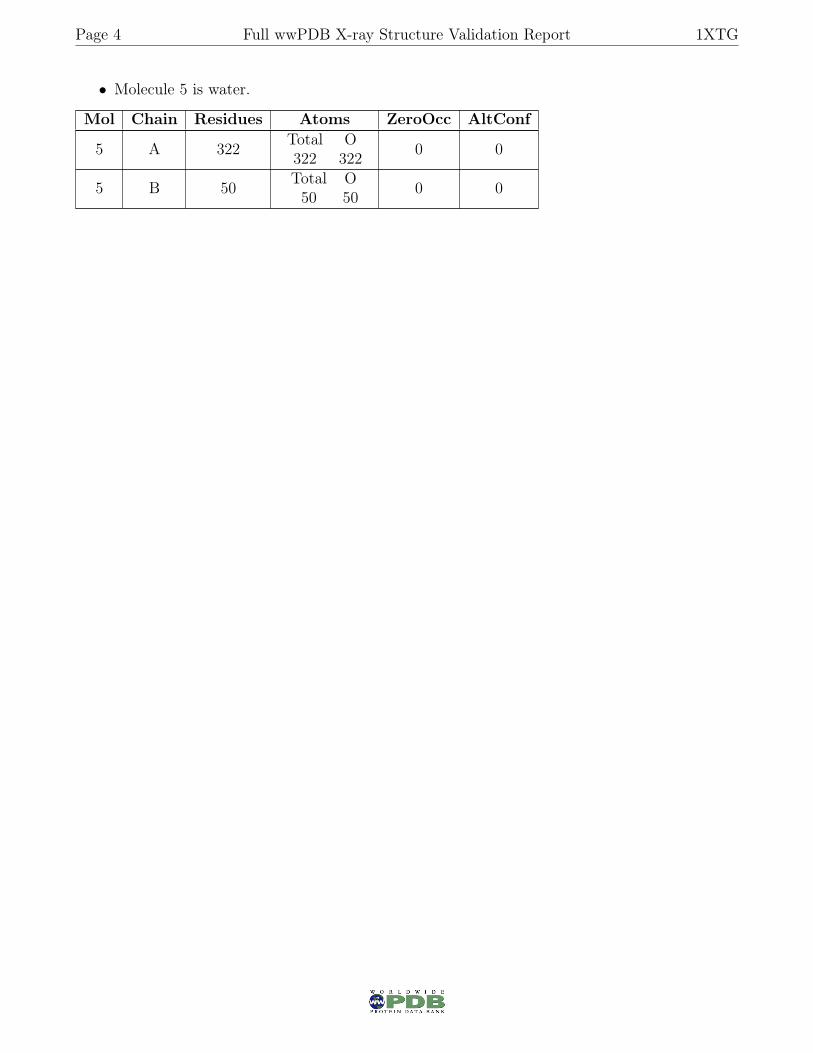
• Molecule 5 is water.
Mol Chain Residues Atoms ZeroOcc AltConf
5 A 322 Total O322 322 0 0
5 B 50 Total O50 50 0 0
Page 5 Full wwPDB X-ray Structure Validation Report 1XTG
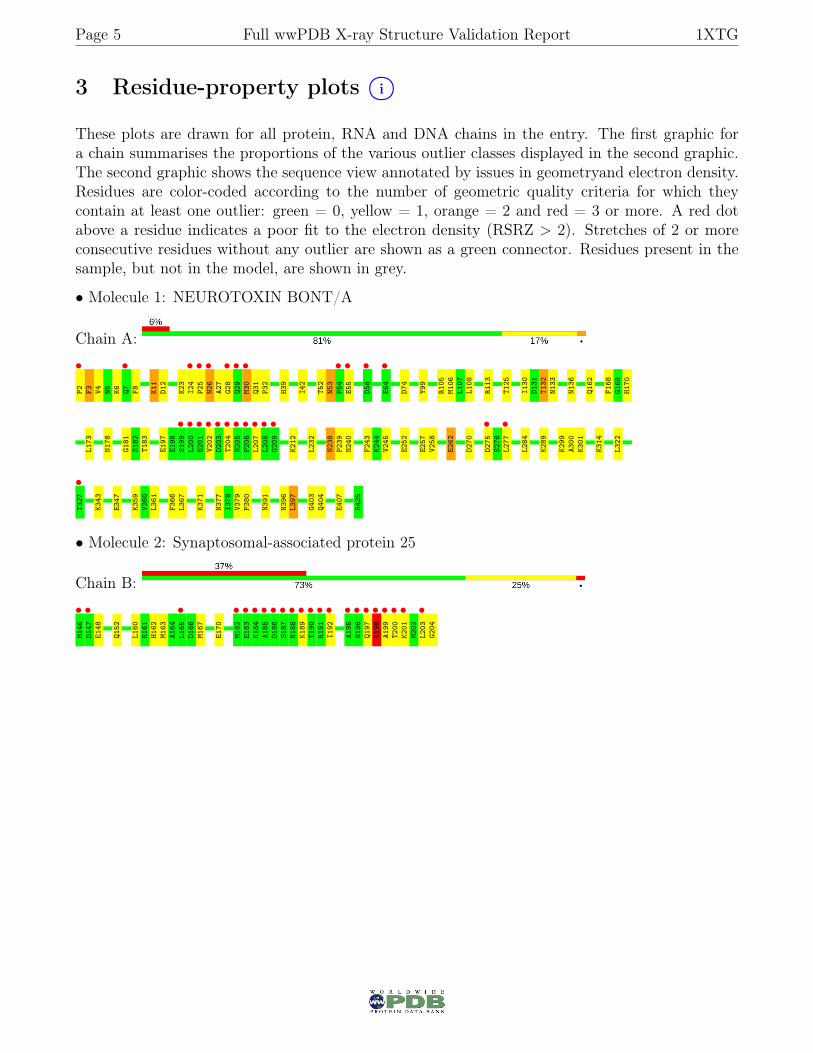
3 Residue-property plots i○
These plots are drawn for all protein, RNA and DNA chains in the entry. The first graphic fora chain summarises the proportions of the various outlier classes displayed in the second graphic.The second graphic shows the sequence view annotated by issues in geometryand electron density.Residues are color-coded according to the number of geometric quality criteria for which theycontain at least one outlier: green = 0, yellow = 1, orange = 2 and red = 3 or more. A red dotabove a residue indicates a poor fit to the electron density (RSRZ > 2). Stretches of 2 or moreconsecutive residues without any outlier are shown as a green connector. Residues present in thesample, but not in the model, are shown in grey.
• Molecule 1: NEUROTOXIN BONT/A
Chain A:
P2•
F3 V4 N5 K6 Q7•
F8 K11
D12
K23
I24•
P25•
N26•
A27
G28•
Q29•
M30•
Q31
P32
H39
I42
T52
N53
P54•
E55•
D58•
E64•
D74
Y99
R105
M106
L107
L108
R113
T125
I130
D131
T132
N133
N136
Q162
F168
G169
H170
L173
N178
G181
S182
T183
E197
E198
S199•
L200•
E201•
V202•
D203•
T204•
N205•
P206•
L207•
L208•
G209•
K212
L232
N238
P239
N240
F243
K244
V245
E252
E257
V258
E262
D270
D275•
S276
L277•
L284
K289
K299
A300
K301
K314
L322
T327•
K343
E347
K359
V360
L361
F366
L367
K371
N377
I378
V379
P380
N391
N396
L397
G403
Q404
E407
R425
• Molecule 2: Synaptosomal-associated protein 25
Chain B:
M146•
D147•
E148
Q152
L160
R161
H162
M163
A164
L165•
D166
M167
E170
M182•
E183•
K184•
A185•
D186•
S187•
N188•
K189•
T190•
R191•
I192•
A195•
N196•
Q197•
R198•
A199•
T200•
K201•
M202
L203•
G204
Page 6 Full wwPDB X-ray Structure Validation Report 1XTG
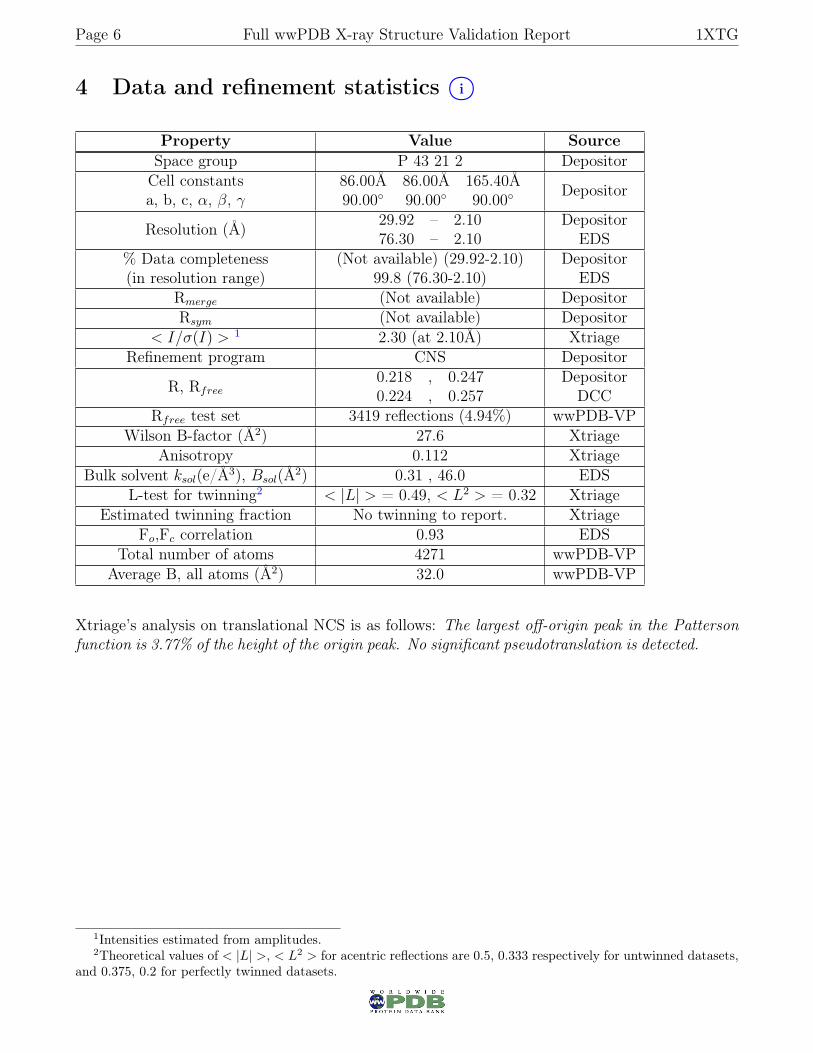
4 Data and refinement statistics i○
Property Value SourceSpace group P 43 21 2 DepositorCell constantsa, b, c, α, β, γ
86.00Å 86.00Å 165.40Å90.00◦ 90.00◦ 90.00◦ Depositor
Resolution (Å) 29.92 – 2.1076.30 – 2.10
DepositorEDS
% Data completeness(in resolution range)
(Not available) (29.92-2.10)99.8 (76.30-2.10)
DepositorEDS
Rmerge (Not available) DepositorRsym (Not available) Depositor
< I/σ(I) > 1 2.30 (at 2.10Å) XtriageRefinement program CNS Depositor
R, Rfree0.218 , 0.2470.224 , 0.257
DepositorDCC
Rfree test set 3419 reflections (4.94%) wwPDB-VPWilson B-factor (Å2) 27.6 Xtriage
Anisotropy 0.112 XtriageBulk solvent ksol(e/Å3), Bsol(Å2) 0.31 , 46.0 EDS
L-test for twinning2 < |L| > = 0.49, < L2 > = 0.32 XtriageEstimated twinning fraction No twinning to report. Xtriage
Fo,Fc correlation 0.93 EDSTotal number of atoms 4271 wwPDB-VP
Average B, all atoms (Å2) 32.0 wwPDB-VP
Xtriage’s analysis on translational NCS is as follows: The largest off-origin peak in the Pattersonfunction is 3.77% of the height of the origin peak. No significant pseudotranslation is detected.
1Intensities estimated from amplitudes.2Theoretical values of < |L| >, < L2 > for acentric reflections are 0.5, 0.333 respectively for untwinned datasets,
and 0.375, 0.2 for perfectly twinned datasets.
Page 7 Full wwPDB X-ray Structure Validation Report 1XTG
5 Model quality i○
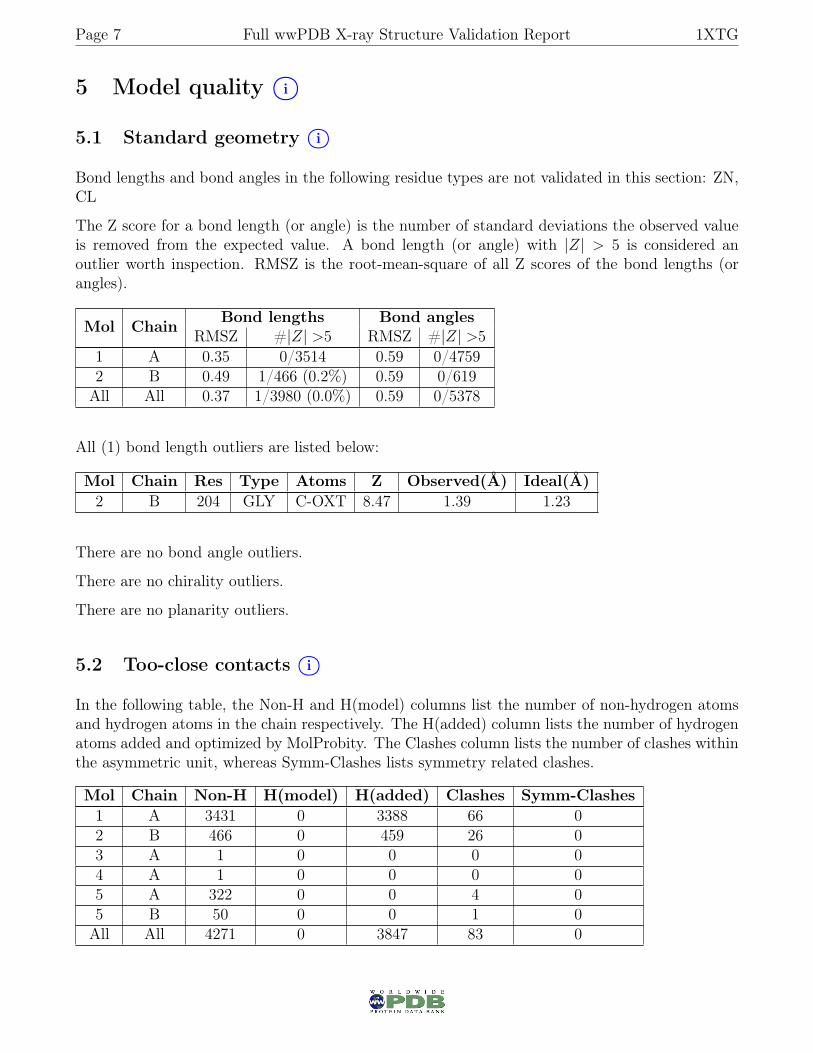
5.1 Standard geometry i○
Bond lengths and bond angles in the following residue types are not validated in this section: ZN,CL
The Z score for a bond length (or angle) is the number of standard deviations the observed valueis removed from the expected value. A bond length (or angle) with |Z| > 5 is considered anoutlier worth inspection. RMSZ is the root-mean-square of all Z scores of the bond lengths (orangles).
Mol Chain Bond lengths Bond anglesRMSZ #|Z| >5 RMSZ #|Z| >5
1 A 0.35 0/3514 0.59 0/47592 B 0.49 1/466 (0.2%) 0.59 0/619All All 0.37 1/3980 (0.0%) 0.59 0/5378
All (1) bond length outliers are listed below:
Mol Chain Res Type Atoms Z Observed(Å) Ideal(Å)2 B 204 GLY C-OXT 8.47 1.39 1.23
There are no bond angle outliers.
There are no chirality outliers.
There are no planarity outliers.
5.2 Too-close contacts i○
In the following table, the Non-H and H(model) columns list the number of non-hydrogen atomsand hydrogen atoms in the chain respectively. The H(added) column lists the number of hydrogenatoms added and optimized by MolProbity. The Clashes column lists the number of clashes withinthe asymmetric unit, whereas Symm-Clashes lists symmetry related clashes.
Mol Chain Non-H H(model) H(added) Clashes Symm-Clashes1 A 3431 0 3388 66 02 B 466 0 459 26 03 A 1 0 0 0 04 A 1 0 0 0 05 A 322 0 0 4 05 B 50 0 0 1 0All All 4271 0 3847 83 0
Page 8 Full wwPDB X-ray Structure Validation Report 1XTG
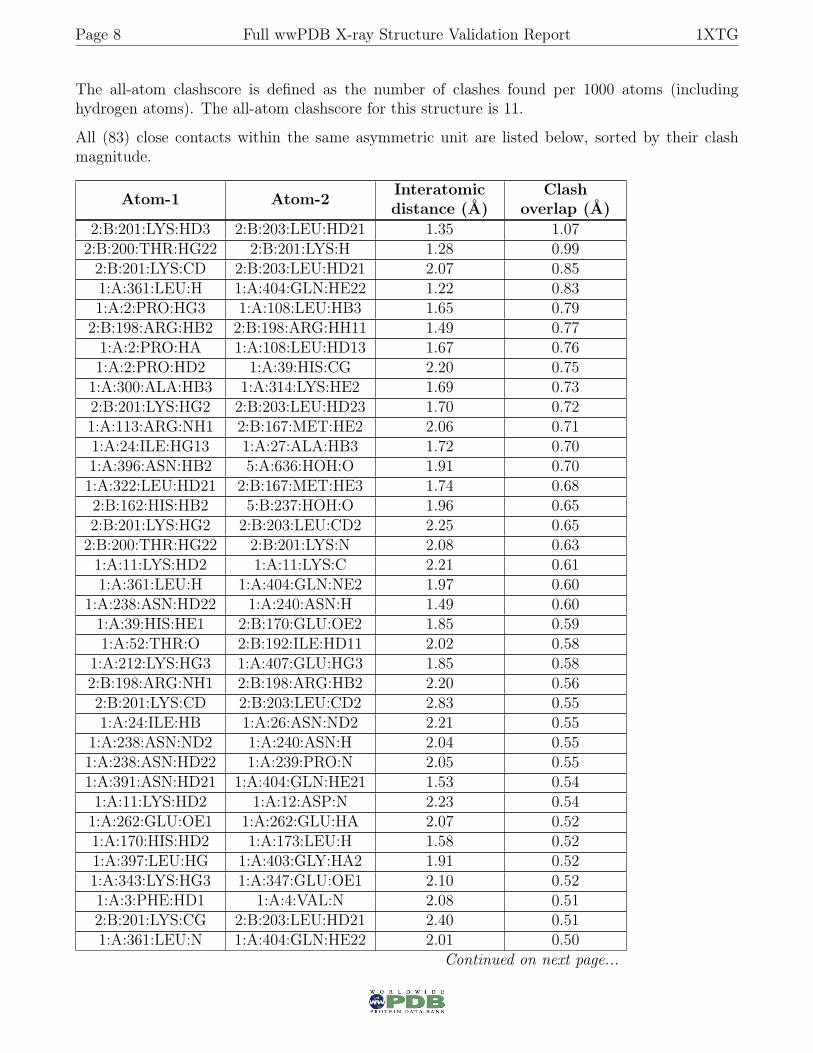
The all-atom clashscore is defined as the number of clashes found per 1000 atoms (includinghydrogen atoms). The all-atom clashscore for this structure is 11.
All (83) close contacts within the same asymmetric unit are listed below, sorted by their clashmagnitude.
Atom-1 Atom-2 Interatomicdistance (Å)
Clashoverlap (Å)
2:B:201:LYS:HD3 2:B:203:LEU:HD21 1.35 1.072:B:200:THR:HG22 2:B:201:LYS:H 1.28 0.992:B:201:LYS:CD 2:B:203:LEU:HD21 2.07 0.851:A:361:LEU:H 1:A:404:GLN:HE22 1.22 0.831:A:2:PRO:HG3 1:A:108:LEU:HB3 1.65 0.792:B:198:ARG:HB2 2:B:198:ARG:HH11 1.49 0.771:A:2:PRO:HA 1:A:108:LEU:HD13 1.67 0.761:A:2:PRO:HD2 1:A:39:HIS:CG 2.20 0.751:A:300:ALA:HB3 1:A:314:LYS:HE2 1.69 0.732:B:201:LYS:HG2 2:B:203:LEU:HD23 1.70 0.721:A:113:ARG:NH1 2:B:167:MET:HE2 2.06 0.711:A:24:ILE:HG13 1:A:27:ALA:HB3 1.72 0.701:A:396:ASN:HB2 5:A:636:HOH:O 1.91 0.701:A:322:LEU:HD21 2:B:167:MET:HE3 1.74 0.682:B:162:HIS:HB2 5:B:237:HOH:O 1.96 0.652:B:201:LYS:HG2 2:B:203:LEU:CD2 2.25 0.652:B:200:THR:HG22 2:B:201:LYS:N 2.08 0.631:A:11:LYS:HD2 1:A:11:LYS:C 2.21 0.611:A:361:LEU:H 1:A:404:GLN:NE2 1.97 0.60
1:A:238:ASN:HD22 1:A:240:ASN:H 1.49 0.601:A:39:HIS:HE1 2:B:170:GLU:OE2 1.85 0.591:A:52:THR:O 2:B:192:ILE:HD11 2.02 0.58
1:A:212:LYS:HG3 1:A:407:GLU:HG3 1.85 0.582:B:198:ARG:NH1 2:B:198:ARG:HB2 2.20 0.562:B:201:LYS:CD 2:B:203:LEU:CD2 2.83 0.551:A:24:ILE:HB 1:A:26:ASN:ND2 2.21 0.55
1:A:238:ASN:ND2 1:A:240:ASN:H 2.04 0.551:A:238:ASN:HD22 1:A:239:PRO:N 2.05 0.551:A:391:ASN:HD21 1:A:404:GLN:HE21 1.53 0.541:A:11:LYS:HD2 1:A:12:ASP:N 2.23 0.541:A:262:GLU:OE1 1:A:262:GLU:HA 2.07 0.521:A:170:HIS:HD2 1:A:173:LEU:H 1.58 0.521:A:397:LEU:HG 1:A:403:GLY:HA2 1.91 0.521:A:343:LYS:HG3 1:A:347:GLU:OE1 2.10 0.521:A:3:PHE:HD1 1:A:4:VAL:N 2.08 0.512:B:201:LYS:CG 2:B:203:LEU:HD21 2.40 0.511:A:361:LEU:N 1:A:404:GLN:HE22 2.01 0.50
Continued on next page...
Page 9 Full wwPDB X-ray Structure Validation Report 1XTG
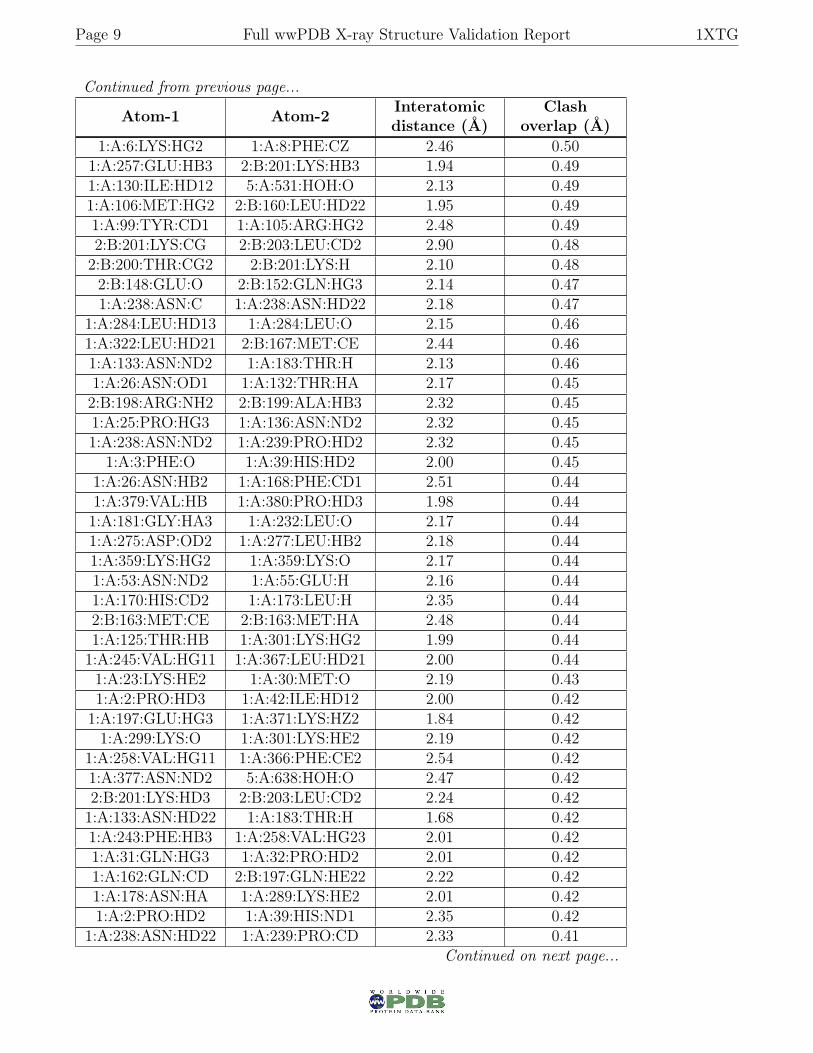
Continued from previous page...
Atom-1 Atom-2 Interatomicdistance (Å)
Clashoverlap (Å)
1:A:6:LYS:HG2 1:A:8:PHE:CZ 2.46 0.501:A:257:GLU:HB3 2:B:201:LYS:HB3 1.94 0.491:A:130:ILE:HD12 5:A:531:HOH:O 2.13 0.491:A:106:MET:HG2 2:B:160:LEU:HD22 1.95 0.491:A:99:TYR:CD1 1:A:105:ARG:HG2 2.48 0.492:B:201:LYS:CG 2:B:203:LEU:CD2 2.90 0.482:B:200:THR:CG2 2:B:201:LYS:H 2.10 0.482:B:148:GLU:O 2:B:152:GLN:HG3 2.14 0.471:A:238:ASN:C 1:A:238:ASN:HD22 2.18 0.47
1:A:284:LEU:HD13 1:A:284:LEU:O 2.15 0.461:A:322:LEU:HD21 2:B:167:MET:CE 2.44 0.461:A:133:ASN:ND2 1:A:183:THR:H 2.13 0.461:A:26:ASN:OD1 1:A:132:THR:HA 2.17 0.452:B:198:ARG:NH2 2:B:199:ALA:HB3 2.32 0.451:A:25:PRO:HG3 1:A:136:ASN:ND2 2.32 0.451:A:238:ASN:ND2 1:A:239:PRO:HD2 2.32 0.45
1:A:3:PHE:O 1:A:39:HIS:HD2 2.00 0.451:A:26:ASN:HB2 1:A:168:PHE:CD1 2.51 0.441:A:379:VAL:HB 1:A:380:PRO:HD3 1.98 0.441:A:181:GLY:HA3 1:A:232:LEU:O 2.17 0.441:A:275:ASP:OD2 1:A:277:LEU:HB2 2.18 0.441:A:359:LYS:HG2 1:A:359:LYS:O 2.17 0.441:A:53:ASN:ND2 1:A:55:GLU:H 2.16 0.441:A:170:HIS:CD2 1:A:173:LEU:H 2.35 0.442:B:163:MET:CE 2:B:163:MET:HA 2.48 0.441:A:125:THR:HB 1:A:301:LYS:HG2 1.99 0.441:A:245:VAL:HG11 1:A:367:LEU:HD21 2.00 0.441:A:23:LYS:HE2 1:A:30:MET:O 2.19 0.431:A:2:PRO:HD3 1:A:42:ILE:HD12 2.00 0.42
1:A:197:GLU:HG3 1:A:371:LYS:HZ2 1.84 0.421:A:299:LYS:O 1:A:301:LYS:HE2 2.19 0.42
1:A:258:VAL:HG11 1:A:366:PHE:CE2 2.54 0.421:A:377:ASN:ND2 5:A:638:HOH:O 2.47 0.422:B:201:LYS:HD3 2:B:203:LEU:CD2 2.24 0.421:A:133:ASN:HD22 1:A:183:THR:H 1.68 0.421:A:243:PHE:HB3 1:A:258:VAL:HG23 2.01 0.421:A:31:GLN:HG3 1:A:32:PRO:HD2 2.01 0.421:A:162:GLN:CD 2:B:197:GLN:HE22 2.22 0.421:A:178:ASN:HA 1:A:289:LYS:HE2 2.01 0.421:A:2:PRO:HD2 1:A:39:HIS:ND1 2.35 0.42
1:A:238:ASN:HD22 1:A:239:PRO:CD 2.33 0.41Continued on next page...

Page 10 Full wwPDB X-ray Structure Validation Report 1XTG
Continued from previous page...
Atom-1 Atom-2 Interatomicdistance (Å)
Clashoverlap (Å)
1:A:284:LEU:HD12 5:A:658:HOH:O 2.20 0.411:A:270:ASP:OD2 1:A:366:PHE:HD1 2.03 0.411:A:31:GLN:HE21 1:A:32:PRO:HD2 1.84 0.411:A:258:VAL:HG12 2:B:199:ALA:O 2.20 0.411:A:31:GLN:NE2 1:A:32:PRO:HD2 2.37 0.40
There are no symmetry-related clashes.
5.3 Torsion angles i○
5.3.1 Protein backbone i○
In the following table, the Percentiles column shows the percent Ramachandran outliers of thechain as a percentile score with respect to all X-ray entries followed by that with respect to entriesof similar resolution.
The Analysed column shows the number of residues for which the backbone conformation wasanalysed, and the total number of residues.
Mol Chain Analysed Favoured Allowed Outliers Percentiles
1 A 422/424 (100%) 393 (93%) 24 (6%) 5 (1%) 14 9
2 B 57/59 (97%) 47 (82%) 8 (14%) 2 (4%) 4 1
All All 479/483 (99%) 440 (92%) 32 (7%) 7 (2%) 11 6
All (7) Ramachandran outliers are listed below:
Mol Chain Res Type2 B 189 LYS1 A 28 GLY2 B 198 ARG1 A 207 LEU1 A 204 THR1 A 74 ASP1 A 202 VAL
5.3.2 Protein sidechains i○
In the following table, the Percentiles column shows the percent sidechain outliers of the chain as apercentile score with respect to all X-ray entries followed by that with respect to entries of similarresolution.
Page 11 Full wwPDB X-ray Structure Validation Report 1XTG
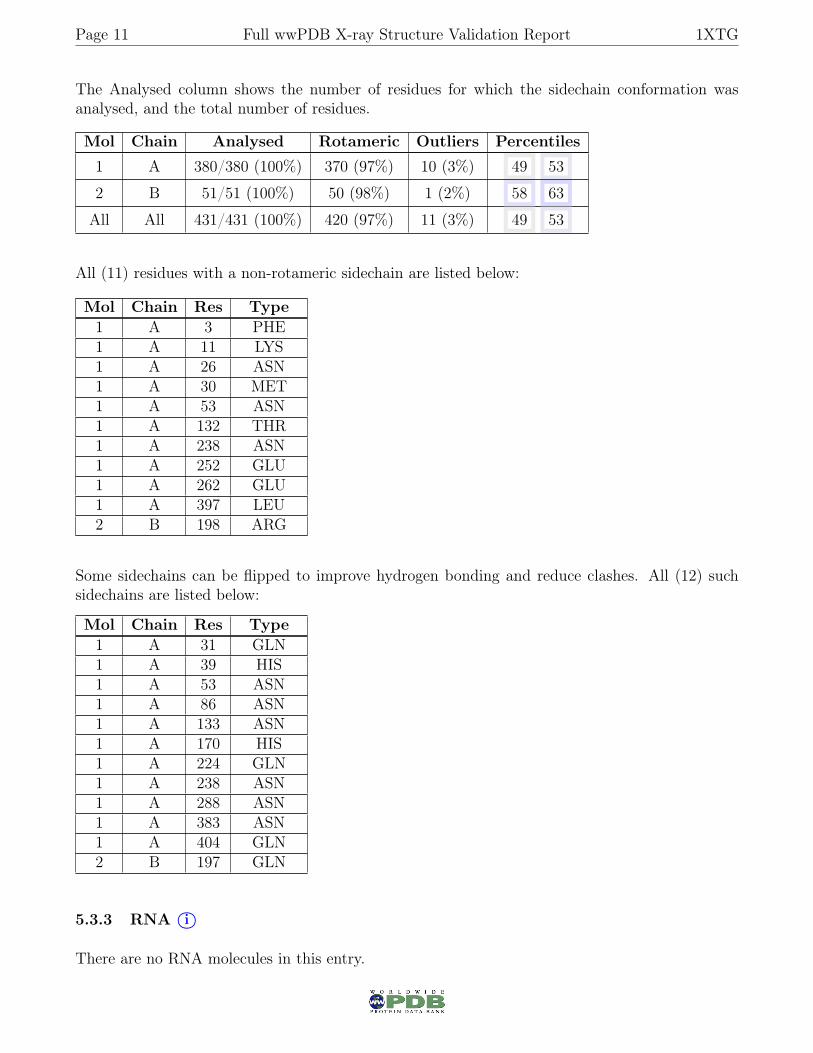
The Analysed column shows the number of residues for which the sidechain conformation wasanalysed, and the total number of residues.
Mol Chain Analysed Rotameric Outliers Percentiles
1 A 380/380 (100%) 370 (97%) 10 (3%) 49 53
2 B 51/51 (100%) 50 (98%) 1 (2%) 58 63
All All 431/431 (100%) 420 (97%) 11 (3%) 49 53
All (11) residues with a non-rotameric sidechain are listed below:
Mol Chain Res Type1 A 3 PHE1 A 11 LYS1 A 26 ASN1 A 30 MET1 A 53 ASN1 A 132 THR1 A 238 ASN1 A 252 GLU1 A 262 GLU1 A 397 LEU2 B 198 ARG
Some sidechains can be flipped to improve hydrogen bonding and reduce clashes. All (12) suchsidechains are listed below:
Mol Chain Res Type1 A 31 GLN1 A 39 HIS1 A 53 ASN1 A 86 ASN1 A 133 ASN1 A 170 HIS1 A 224 GLN1 A 238 ASN1 A 288 ASN1 A 383 ASN1 A 404 GLN2 B 197 GLN
5.3.3 RNA i○
There are no RNA molecules in this entry.
Page 12 Full wwPDB X-ray Structure Validation Report 1XTG
5.4 Non-standard residues in protein, DNA, RNA chains i○
There are no non-standard protein/DNA/RNA residues in this entry.
5.5 Carbohydrates i○
There are no carbohydrates in this entry.
5.6 Ligand geometry i○
Of 2 ligands modelled in this entry, 2 are monoatomic - leaving 0 for Mogul analysis.
There are no bond length outliers.
There are no bond angle outliers.
There are no chirality outliers.
There are no torsion outliers.
There are no ring outliers.
No monomer is involved in short contacts.
5.7 Other polymers i○
There are no such residues in this entry.
5.8 Polymer linkage issues i○
There are no chain breaks in this entry.

Page 13 Full wwPDB X-ray Structure Validation Report 1XTG
6 Fit of model and data i○
6.1 Protein, DNA and RNA chains i○
In the following table, the column labelled ‘#RSRZ> 2’ contains the number (and percentage)of RSRZ outliers, followed by percent RSRZ outliers for the chain as percentile scores relative toall X-ray entries and entries of similar resolution. The OWAB column contains the minimum,median, 95th percentile and maximum values of the occupancy-weighted average B-factor perresidue. The column labelled ‘Q< 0.9’ lists the number of (and percentage) of residues with anaverage occupancy less than 0.9.
Mol Chain Analysed <RSRZ> #RSRZ>2 OWAB(Å2) Q<0.9
1 A 424/424 (100%) 0.30 26 (6%) 21 26 14, 26, 56, 83 6 (1%)
2 B 59/59 (100%) 2.18 22 (37%) 0 0 21, 45, 81, 83 8 (13%)
All All 483/483 (100%) 0.52 48 (9%) 7 10 14, 27, 68, 83 14 (2%)
All (48) RSRZ outliers are listed below:
Mol Chain Res Type RSRZ1 A 203 ASP 13.02 B 187 SER 9.72 B 197 GLN 9.62 B 199 ALA 9.31 A 204 THR 8.52 B 185 ALA 8.41 A 207 LEU 8.21 A 202 VAL 8.21 A 200 LEU 8.02 B 196 ASN 7.82 B 186 ASP 7.41 A 209 GLY 7.12 B 190 THR 7.02 B 198 ARG 7.02 B 184 LYS 6.72 B 188 ASN 6.31 A 28 GLY 5.31 A 26 ASN 5.21 A 327 THR 4.81 A 206 PRO 4.62 B 200 THR 4.62 B 147 ASP 4.31 A 54 PRO 4.22 B 189 LYS 4.2
Continued on next page...
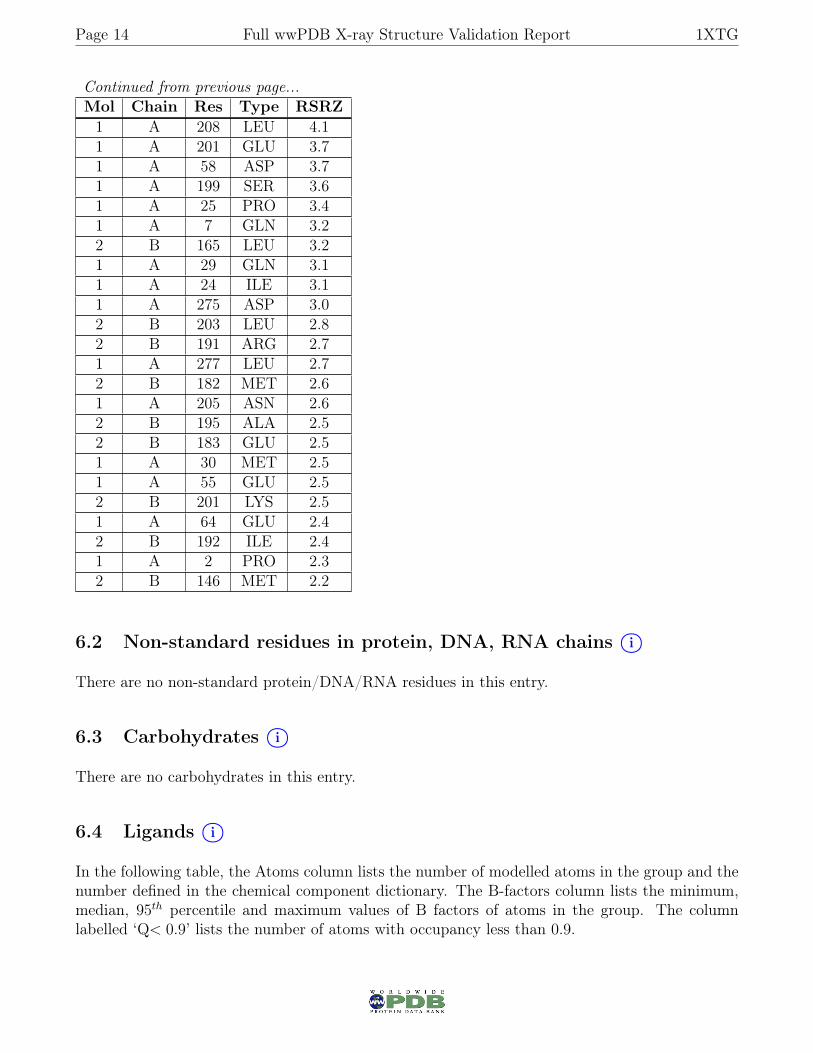
Page 14 Full wwPDB X-ray Structure Validation Report 1XTG
Continued from previous page...Mol Chain Res Type RSRZ1 A 208 LEU 4.11 A 201 GLU 3.71 A 58 ASP 3.71 A 199 SER 3.61 A 25 PRO 3.41 A 7 GLN 3.22 B 165 LEU 3.21 A 29 GLN 3.11 A 24 ILE 3.11 A 275 ASP 3.02 B 203 LEU 2.82 B 191 ARG 2.71 A 277 LEU 2.72 B 182 MET 2.61 A 205 ASN 2.62 B 195 ALA 2.52 B 183 GLU 2.51 A 30 MET 2.51 A 55 GLU 2.52 B 201 LYS 2.51 A 64 GLU 2.42 B 192 ILE 2.41 A 2 PRO 2.32 B 146 MET 2.2
6.2 Non-standard residues in protein, DNA, RNA chains i○
There are no non-standard protein/DNA/RNA residues in this entry.
6.3 Carbohydrates i○
There are no carbohydrates in this entry.
6.4 Ligands i○
In the following table, the Atoms column lists the number of modelled atoms in the group and thenumber defined in the chemical component dictionary. The B-factors column lists the minimum,median, 95th percentile and maximum values of B factors of atoms in the group. The columnlabelled ‘Q< 0.9’ lists the number of atoms with occupancy less than 0.9.

Page 15 Full wwPDB X-ray Structure Validation Report 1XTG
Mol Type Chain Res Atoms RSCC RSR B-factors(Å2) Q<0.94 CL A 427 1/1 0.98 0.08 36,36,36,36 03 ZN A 426 1/1 0.99 0.07 33,33,33,33 0
6.5 Other polymers i○
There are no such residues in this entry.