Embed Size (px)
Citation preview

Full-Scale Permanganate Remediation Full-Scale Permanganate Remediation of a Solvent DNAPL Source Zoneof a Solvent DNAPL Source Zone
in a Sand Aquiferin a Sand Aquifer
Beth L. Parker, Ph.D.Beth L. Parker, Ph.D.University of Waterloo
Presented at the EPA Seminar:
In Situ Treatment of Groundwater Contaminated
With Non-Aqueous Phase Liquids
Chicago
December 11, 20021

2
CollaboratorsCollaborators
• Tom Al, University of New Brunswick– Inorganic Geochemistry
• Ramon Aravena, University of Waterloo– Isotope Geochemistry
• John Cherry, University of Waterloo

3
This Case Study Will Show:This Case Study Will Show:
• Density driven distribution of KMnO4 in sand
• Performance assessment with minimal uncertainty
• Nearly complete destruction of TCE and 1,1,1-TCA

4
Two General ApproachesTwo General Approachesfor In Situ Oxidationfor In Situ Oxidation
• Inject-and-withdraw (active)
Flushing
• Inject-and-leave (passive)
Episodic Injection
5
Injection
Addition of Treatment Chemicals
Withdrawal
The Active ApproachThe Active Approach
B.L.Parker

6
The Waterloo Passive ApproachThe Waterloo Passive Approach
• Use density and dispersion effects to distribute permanganate solution
• Inject in a manner that minimizes groundwater displacement

7
The Waterloo Passive ApproachThe Waterloo Passive Approach
2
3
1
Sandaquifer
4KMnO ( high density )
Relies on density and dispersion effects
B.L.Parker, 1997

1
2
3
4
tim
e
C once ntrationand D ensity
De creas e
no lateral ground water flow
Evolution of a Single Disc in a Sand AquiferEvolution of a Single Disc in a Sand Aquifer
B.L. Parker, 19978

Initial Proof - of - ConceptInitial Proof - of - Concept
Inject-and-Leave Field Trial in Borden Aquifer
Matthew Nelson M.Sc. Thesis (1999)
Supervisors: Drs. Beth Parker and John Cherry
University of Waterloo
9

Borden 9x9 m Sheet Pile Enclosure
10

System Set-up at 9m CellBorden Site
11

12
Density of Dissolved KMnODensity of Dissolved KMnO44 in Water in Water
sea water
0 20 40 60
1.05
1.04
1.03
1.02
1.01
1
rela
tive
d
ensi
ty
grams per liter KMnO4
Typical Range Used
20 Co
10 Co
solubility

13
sand
SETTINGSETTING
clay12 ft
0 ft1 ft

Evidence for Density Induced FlowEvidence for Density Induced Flow
Day 1
Day 3
Day 8Day 23
Day 65
3.4
Dep
th (
m.b
.g.s
.)
ML-1 First Injection
0 5 10
KMnO 4 (g/l)
2.2
2.4
2.6
2.8
3.0
3.2
(Nelson, 1999)14

15
The Waterloo Passive ApproachThe Waterloo Passive Approach
• Use density and dispersion effects to distribute permanganate solution
• Inject in a manner that minimizes groundwater displacement

16
contaminatedwater
displaced byinjected fluid
dispersionzone
KMnO 4
KMnO4
Long-Screen Injection Causes Large Long-Screen Injection Causes Large Displacement of Contaminated WaterDisplacement of Contaminated Water
Parker, 1997

17
displacedcontam inated
w ater
1
2
3
K MnO 4
gap
gap
zone tre ated by density flo w
zone treated by density flow
Injection of Discs Leaving Gaps Minimizes Injection of Discs Leaving Gaps Minimizes Displacement of Contaminated WaterDisplacement of Contaminated Water
Parker, 1997

18
KMnO4
Stage 1
Sand aquifer
Initial disc
Injection of Multiple Discs Injection of Multiple Discs Using Direct Push DeviceUsing Direct Push Device
Parker, 1997

19
Injection of Multiple Discs Using Injection of Multiple Discs Using Direct Push DeviceDirect Push Device
KMnO 4
Injection 1
Injection 2
Stage 2
Parker, 1997

20
Stage 1: Inject Disc Above DNAPL on Aquitard
KMnO 4
aquitard
Stage 1
sand aquifer
Initial disc
Parker, 1997
DNAPL

21
Disc Sinks and Spreads
Parker, 1997
12
aquitard
DNAPL
Injector withdrawn
Time
3

Site
TCE and TCA source zone
Case Study in FloridaCase Study in Florida
22

23
Ft. Lauderdale SiteFt. Lauderdale Site

24
Contamination Occurred RecentlyContamination Occurred Recentlylate 1996 to early 1997late 1996 to early 1997
• TCA used: 1995-96• Switch from TCA to TCE: Nov 1996 - April 1997• Conventional monitoring wells installed: 1997• Fenton’s treatment pilot study: 1998-1999• UW bundle multi-levels installed: 1999
– Fenton’s performance assessment• Permanganate selected as source removal action
for permanent remedy
25
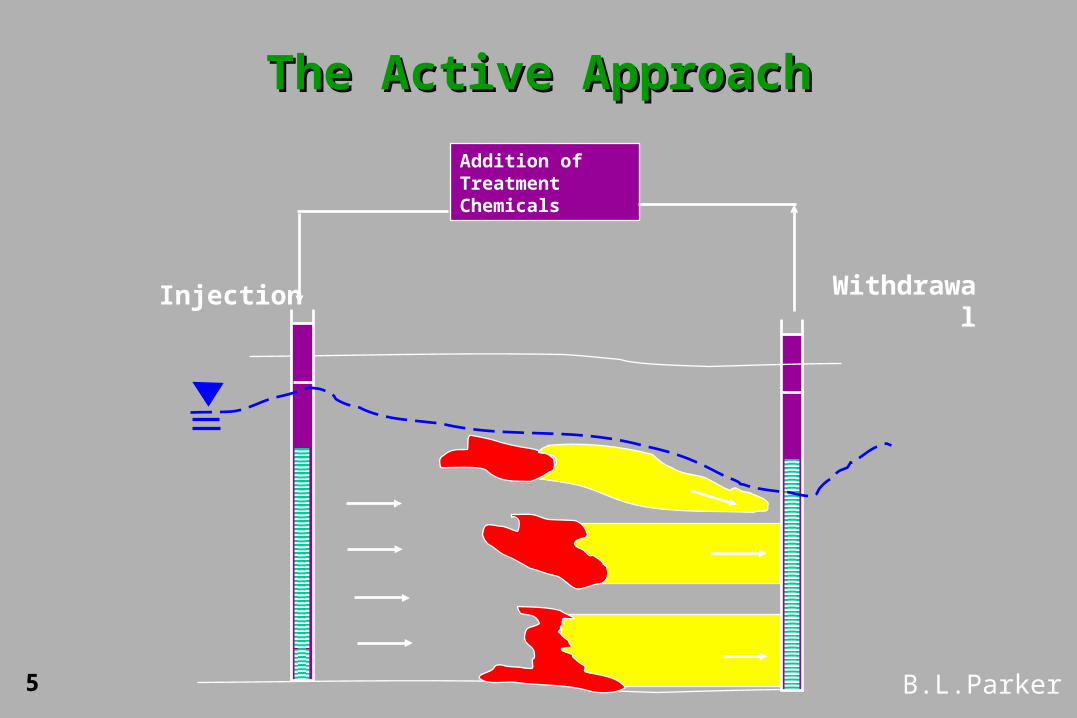
Site GeologySite Geology
10
20
30
40
50
60
70
80
90
Water table
8-inch coarse sand layer57 ft bgs
Fine and medium grainedbeach sand withno visible layering
Increased frequency of gravel size carbonate rockfragments
Carbonate bedrock 85 ft bgs

26
Monitoring MethodsMonitoring Methods
• Continuous Cores• Bundle tube samplers • Waterloo Profiler• Conventional Monitoring Wells • Micro-monitoring Wells
Focus on depth-discrete methods
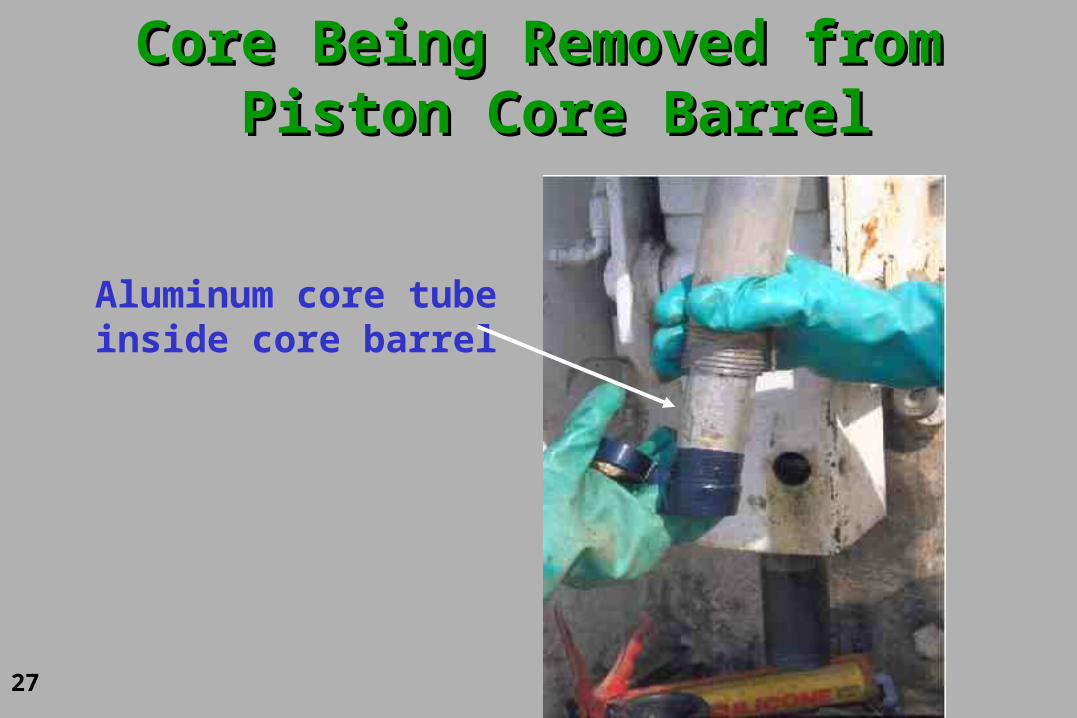
27
Aluminum core tubeinside core barrel
Core Being Removed fromCore Being Removed from Piston Core Barrel Piston Core Barrel

28
Cutting the Aluminum Core TubeCutting the Aluminum Core Tube
29
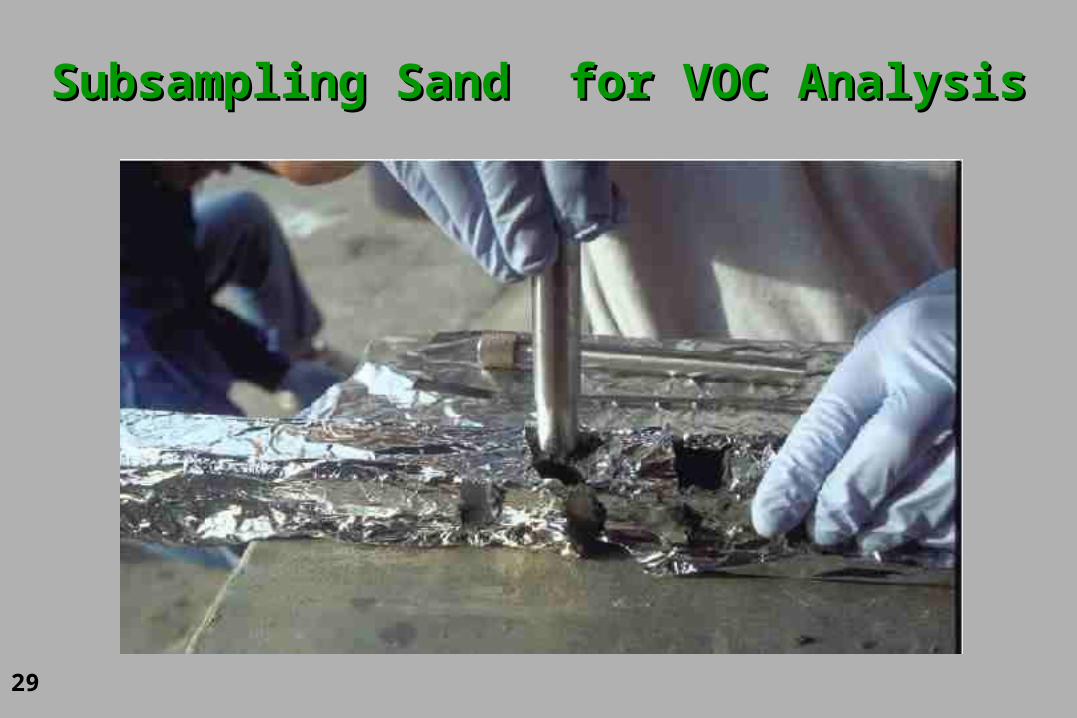
Subsampling Sand for VOC AnalysisSubsampling Sand for VOC Analysis

30
Installation of Bundle Tube Sampler: 1999Installation of Bundle Tube Sampler: 1999

31
Bundle Tube SamplerBundle Tube Sampler
SET IN NATURAL
FORMATIONNO SAND PACK
¾” ID SCH 40 PVC PIPE CENTER
STOCK
1/2” OD POLYETHYLENE or
1/4” OD TEFLON TUBING
6-8” NITEX SCREEN OVER PIPE
PERFORATIONS
2-4” NITEX SCREENS
CONCRETE PAD
1/4” OD TEFLON TUBING IN 1/2” OD POLYETHYLENE
TUBING
STEEL WELL COVER w/CONCRETE PAD

32
TCE Concentration Profile CW-LTCE Concentration Profile CW-L 0
10
20
30
40
50
60
70
80
6000000 100000 200000 300000 400000 500000 700000
TCE Concentration (g/L)
Dep
th (
ft) Before InjectionBefore Injection
(February 2000)
625,500 g/L

33
TCE Concentration Profile CW-KTCE Concentration Profile CW-K0
10
20
30
40
50
60
70
80
250000 5000 10000 15000 20000
TCE Concentration (g/L)
Dep
th (
ft) Before InjectionBefore Injection
(February 2000)
21,574 ug/L
34
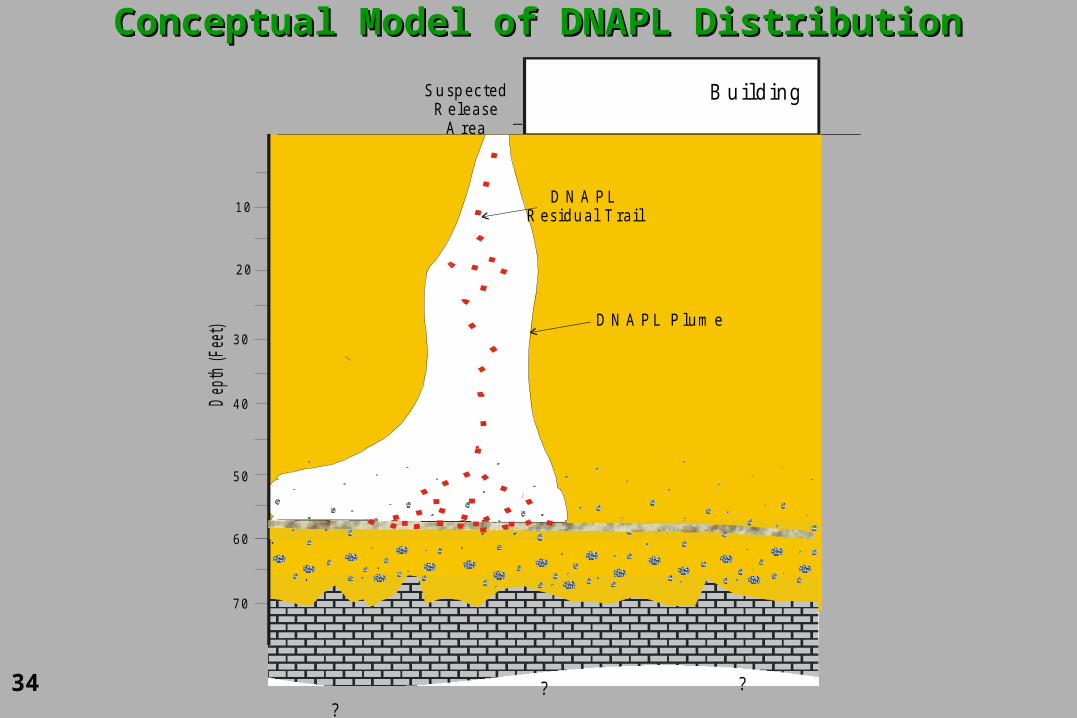
Conceptual Model of DNAPL DistributionConceptual Model of DNAPL Distribution
B u ild in g
DNAPL Zo ne
?
?
?
2 0
1 0
3 0
4 0
5 0
6 0
Dep
th (
Fee
t)D N A P L
R e s id u a l T ra il
7 0
???
S u sp ec ted R e le a s e
A rea
D N A P L P lu m e

35
100
100Monitoring wellMultilevel systemGeoProbe sampling
Building
CW-LTCE Source Zone
>10,000 µg/L
Before RemediationBefore Remediation
TCE Plume
> 100 µg/L
0 10 ftN

36
The Waterloo Passive ApproachThe Waterloo Passive Approachfor Permanganatefor Permanganate
1. Pre-injection delineation
2. Permanganate injection in targeted zones
3. Monitor results and design subsequent injection
4. Repeat steps until attain desired endpoint

37
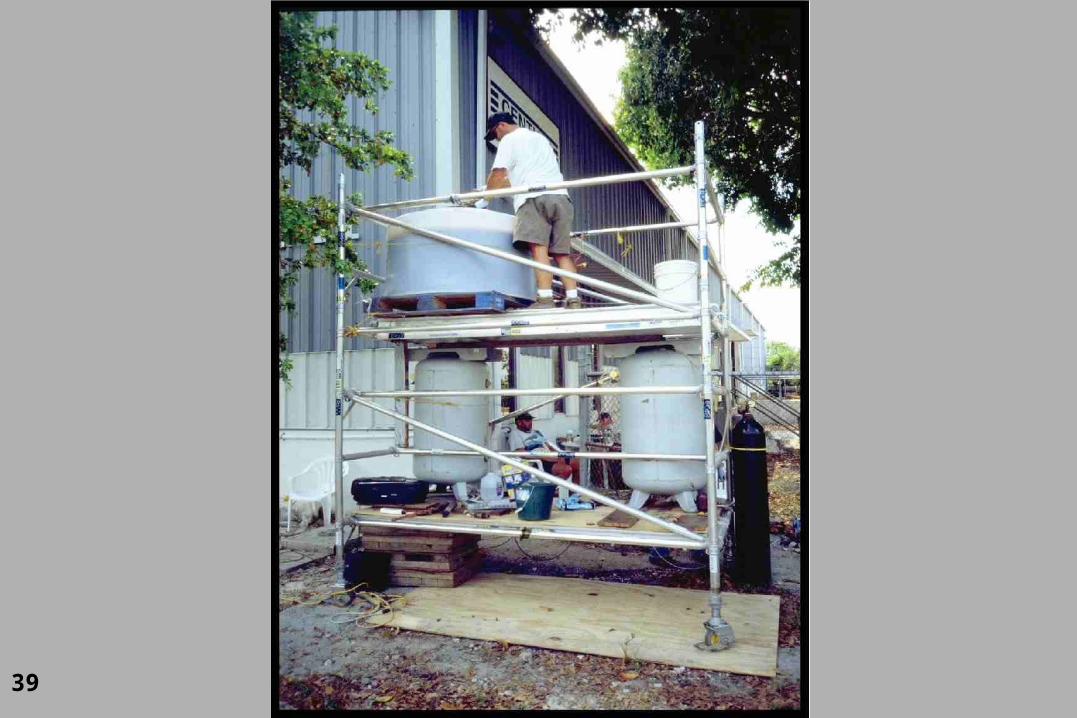
Full-Scale Permanganate Remediation in Ft. Lauderdale, FL
37

38
KMnO4 Mixing Tank
38
39

40
Asphalt Ground Surface
Sand Aquifer
Direct Push Drill RigScaffolding
NO2
Tank
PressureTank
#2
PressureTank
#1
KMnO4
Feed Tank
Stage 1: KMnO4 Injection at Several Depths
DrillRods
Parker, 2000

41
Asphalt Ground Surface
Sand Aquifer
Direct Push Drill RigScaffolding
NO2
Tank
PressureTank
#2
PressureTank
#1
KMnO4
Feed Tank
Stage 2: Spreading and Sinking by Density
Parker, 2000

42
Conceptual Model of DNAPL DistributionConceptual Model of DNAPL Distribution
B u ild in g
DNAPL Zo ne
?
?
?
2 0
1 0
3 0
4 0
5 0
6 0
Dep
th (
Fee
t)D N A P L
R e s id u a l T ra il
7 0
???
S u sp ec ted R e le a s e
A rea
D N A P L P lu m e
Parker, 2000
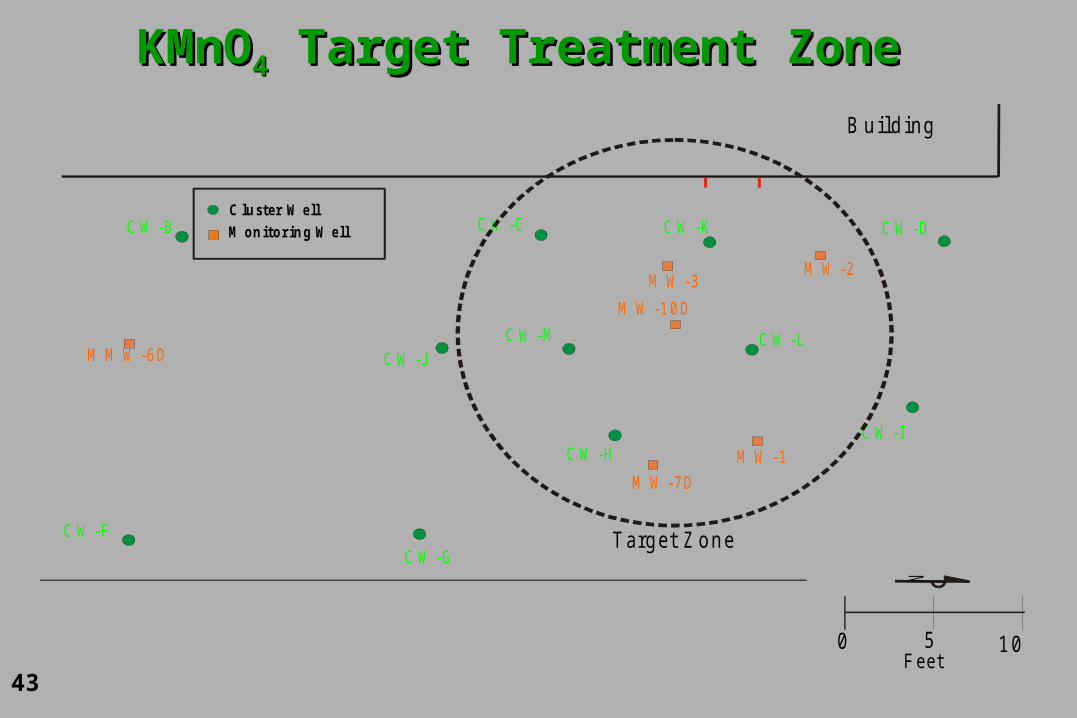
43
KMnOKMnO44 Target Treatment Zone Target Treatment Zone
N
B u ild ing
50 1 0F eet
M o n ito r in g W e ll
M M W -6 D
M W -2M W -3
M W -1
M W -7 D
M W -1 0 D
C lu ste r W e llC W -C C W -D
C W -IC W -H
C W -G
C W -B
C W -F
C W -K
C W -JC W -M C W -L
Targ e t Z on e

44
Source Zone WellsSource Zone Wells

45
N
B u ild in g
50 1 0F eet
M in im u m In je c tio n R a d iu s E s tim a te d f ro m
In je c tio n Vo lu m e s b a s e d o n a n e ll ip s o id w ith 3 :1
sp h e ric a l s h a p e
E stim a te d C o v e ra g e
D e te rm in e d fro m S a m p lin g
M o n ito r in g W e ll
M M W -6 D
M W -2M W -3
M W -1
M W -7 D
C lu ste r W e ll
C W -C C W -D
C W -IC W -H
C W -G
C W -B
C W -F
K M n O I n je c tio n L o c a t io n4
U W -4
U W -2
U W -5
U W -3
U W -1
U W -6
C W -K
C W -JC W -M C W -L
N e w C lu ste r W e ll L o c a t io n
KMnOKMnO44 Injection Coverage Injection Coverage Episode 1Episode 1

46
G ro und
10
50
20
30
40
60
Dep
th (
feet
)
H o r iz o n ta l E x a g g e ra tio n 2 xE llip so id s iz e b a s e d o n 3 0 % p o ro s ity a n d a h e ig h t to w id th ra t io o f 3 :1 .
UW
-4
UW
-5
UW
-1
7 .5 ' 6 .5 '
KMnOKMnO44 Injection at Multiple Depths Injection at Multiple Depths

47
Passive Crew
47

48
G ro und
10
50
20
30
40
60
Dep
th (
feet
)
H o r iz o n ta l E x a g g e ra tio n 2 xE llip so id s iz e b a s e d o n 3 0 % p o ro s ity a n d a h e ig h t to w id th ra t io o f 3 :1 .
UW
-4
UW
-5
UW
-1
7 .5 ' 6 .5 '
Effects of Density and Diffusion on Injected KMnOEffects of Density and Diffusion on Injected KMnO44 Ellipsoids Ellipsoids

49
Project TimelineProject Timeline
Time (months)
0
UW Site Pre-DesignCharacterization
1st Injection Episode
1
2nd Injection Episode
3
3rd InjectionEpisode
7
1st Post-Treatment Monitoring
10
2nd Post-Treatment Monitoring
13
February 2000
32
4th Injection Episode
3rd Post-Treatment Monitoring
October 2002

50
Site Map – X SectionsSite Map – X Sections
N
B u ild in g50 10 15
F e e t
Fe nce
M M W -6D
M W -8 D
M W -5 D
M onito ring Well (M W, M M W )
M W -7 DM W -1
M W -3 M W -2
M W -4 D
M M W -12 DM M W -13 D
M W -1 0 D
M M W -9D
M M W -11 D
C W -CC W -D
C W -I
C W -H
C W -B
C W -GC W -F
C W -A
C W -E
C W -K
C W -JC W -M
C W -L
C luste r Well (C W )
C
C ’B ’
D ’
D
B
K M n O T rea tm e n t Z o n e4
Spigo ts
U W P 2
U W P 1
Profiles
U W P 3

51
TCE Distribution on B-B’ – Feb 2000TCE Distribution on B-B’ – Feb 2000
1 6
1 2
11
1 5
2 2
5 9
5 8
2 6
5 3
1 5 2
1 0 7
7 7
5
2 4 9
3 1 0 1
3 1 7 7 5
1 3 5 3 0 0
2 5 2 9 0 0
1 0 0 0
3 7
1 9
11
2 6
1 2
3 111
11 8
2 2
1 9
7 9 4
1 4 1 3
5 3 3
2 7 4 6
111 6 1
1 7 0 7 9
5 1 8 1
1 0 2 6 2
1 7 6 9
1 9 3 4
5 5 9 5
2 1 5 7 4
2 8
1 8
1 93 .4 (M a y, 0 0 )1 (Ju ly, 0 0 )
T C E u g /L
50 000
0
100
1000
10 000
100 000
G ro u n d
1 0
5 0
2 0
3 0
4 0
6 0
Dep
th (
feet
)
CW
-B
20.5 '
CW
-C
7 0
B
S o u t h N o r t h
B ’
CW
-D
CW
-K
4.0’2 .5’
MW
-3
7.5’
MW
-2
7.5’
K M n O T rea tm e n t Z o n e4
Parker et al., 2000

52
TCE Distribution on B-B’ – Oct 2002TCE Distribution on B-B’ – Oct 2002
2
< 1
< 1
< 1
< 1
2
< 1 .5
< 1
< 1
< 1
< 1
< 1
< 1
< 1
< 1
3 3
1 8 6
2 1 4
2
< 1
< 1
< 1 .5
< 1
< 1
< 1
< 1
< 1
1 7
< 1
< 1
< 1
< 1
< 1
< 1
< 1
< 1
< 1
< 1
2
< 1
< 1
< 1 .5
< 1511 6 5
T C E u g /L
< 1 .5
< 1
< 1< 1
< 1
< 1
< 1
UW
P3
3 (M C L )
50 000
0
100
1000
10 000
100 000
G ro u n d
10
50
20
30
40
60
Dep
th (
feet
)
CW
-B
20.5 '
CW
-C
70
B
S o u t h N o r t h
B ’
CW
-D
CW
-K
4.0’2 .5’
MW
-3
7.5’
MW
-2
7.5’
K M n O T rea tm e n t Z o n e4
Parker et al., 2002

53
0
10
20
30
40
50
60
70
80
1 10 100 1000 10000 100000 1000000
Concentration (ug/L)
Dep
th (
ft)
Feb 20000
10
20
30
40
50
60
70
80
1 10 100 1000 10000 100000 1000000
Concentration (ug/L)
Dep
th (
ft)
May 2000
0
10
20
30
40
50
60
70
80
1 10 100 1000 10000 100000 1000000
Concentration (ug/L)
Dep
th (
ft)
Jul 2000
0
10
20
30
40
50
60
70
80
1 10 100 1000 10000 100000 1000000
Concentration (ug/L)
Dep
th (
ft)
Dec 2000
0
10
20
30
40
50
60
70
80
1 10 100 1000 10000 100000 1000000
Concentration (ug/L)
Dep
th (
ft)
Oct 2002
TCE Concentration Profile CW-K
54
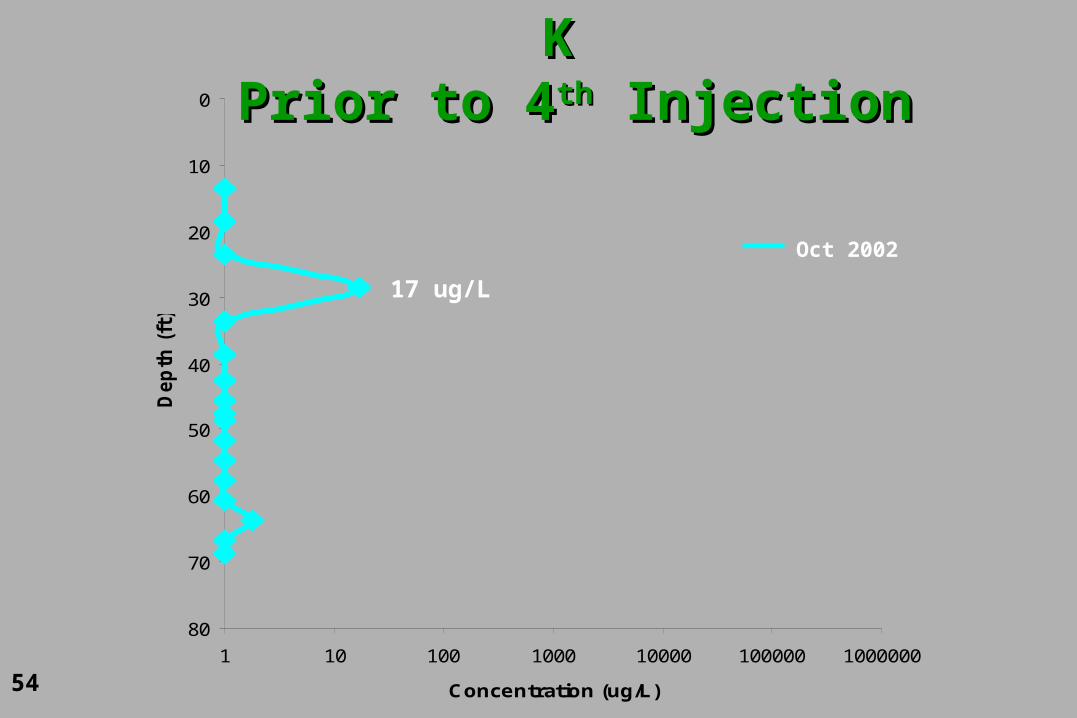
0
10
20
30
40
50
60
70
80
1 10 100 1000 10000 100000 1000000
Concentration (ug/L)
Dep
th (
ft)
Oct 2002
TCE Concentration Profile CW-KTCE Concentration Profile CW-K Prior to 4 Prior to 4thth Injection Injection
17 ug/L

55
TCE Distribution on C-C’ – Feb 2000TCE Distribution on C-C’ – Feb 2000
< 1 .5
2
2 5
1 0 3
11 5
1 6 1
2 6 1
8 1 3
8 6 0
2 6 3 1
3 5 0 5
1 7 9 0
9 4 6
1 2 4 5 3
1 2 3 5 2
1 5 11 0
1 9 1 6 0
1 6 2
1 3 5
1 3 3
1 4 2
9 1 8
6 5 8
2 8 2
9 1 4
11 7 11 0
1 8 6 6 3 8
1 0 4 0
6 9 2 9 6
5 1 8 1
1 0 4 9 4
4 8 0 3 6
6 2 5 5 0 0
5 8
3 8
3 6
3 1
2 5
3 3
3 5
1 4 0
9 4
9 5
1 7 2
3 2 1
1 9 0
1 0 1
1 0 2
< 1 .5
< 1 .5
< 1 .5
< 1 .5
< 1 .5
< 1 .5
< 1 .5
3 3 (M a y, 0 0 )
2 1
5 8
3 2
11
< 1 .5
< 1 .5
< 1 .5
< 1 .5
< 1 .5
8
6 .4 (M a y, 0 0 )
3 9
3 1
3 8
3 6
4 2
5 1
2 9
4 0
6 (M a y, 0 0 )
T C E u g /LT C E u g /L0
1 0 0
1 0 0 0
1 0 0 0 0
1 0 0 0 0 0
5 0 0 0 0
G roundSurface
1 0
5 0
2 0
3 0
4 0
6 0
Dep
th (
feet
)
CW
-E
12.5 '7 .3 '
CW
-I
CW
-M
CW
-A
CW
-J
CW
-L
19.4 ' 6’
7 0
C C ’
MM
W-6
D
MW
-4
D
16.8 ' 7 .6 ' 35 .9 '9 .9 '
S o u th N orth
MW
-5D
K M n O T rea tm e n t Z o n e4
MW
-10D
5.3’
Parker et al., 2000

56
TCE Distribution on C-C’ – Oct 2002TCE Distribution on C-C’ – Oct 2002
< 1 .5
6
< 1
< 1
< 1
< 1
< 1
< 1
< 1
< 1
< 1
< 1
1 8
2 2
1 0 8
2
2
2
< 1
< 1
< 1
< 1
< 1
< 1
< 1
6 1
< 1
< 1
4
3 8
1 4 8 0
1 4 7
< 1
< 1
< 1
< 1
< 1
< 1
< 1
< 1
< 1
< 1
< 1
< 1
< 1
< 1
< 1
< 1 .5
< 1
< 1
4
< 1
< 1
9
< 1
< 1
2 1
< 1
< 1
< 1
< 1
< 1
< 1
< 1
< 1
< 1 .5
< 1 .5
< 1 .5
< 1
< 1 .5
< 1
< 1
< 1
T C E u g /L< 1
< 1
< 1
< 1
0
1 0 0
1 0 0 0
1 0 0 0 0
1 0 0 0 0 0
5 0 0 0 0
1 5
3 (M C L )
G roundSurface
1 0
5 0
2 0
3 0
4 0
6 0
Dep
th (
feet
)
CW
-E
12.5 '7 .3 '
CW
-I
CW
-M
CW
-A
CW
-J
CW
-L
19.4 ' 6’
7 0
C C ’
MM
W-6
D
MW
-4
D
16.8 ' 7 .6 ' 35 .9 '9 .9 '
S o u th N orth
MW
-5D
K M n O T rea tm e n t Z o n e4
MW
-10D
5.3’
Parker et al., 2002

57
0
10
20
30
40
50
60
70
80
1 10 100 1000 10000 100000 1000000
Concentration (ug/L)
Dep
th (
ft)
Feb 20000
10
20
30
40
50
60
70
80
1 10 100 1000 10000 100000 1000000
Concentration (ug/L)
Dep
th (
ft)
May 2000
0
10
20
30
40
50
60
70
80
1 10 100 1000 10000 100000 1000000
Concentration (ug/L)
Dep
th (
ft)
Jul 2000
0
10
20
30
40
50
60
70
80
1 10 100 1000 10000 100000 1000000
Concentration (ug/L)
Dep
th (
ft)
Dec 2000
0
10
20
30
40
50
60
70
80
1 10 100 1000 10000 100000 1000000
Concentration (ug/L)
Dep
th (
ft)
Oct 2002
TCE Concentration Profile CW-L

58
0
10
20
30
40
50
60
70
80
1 10 100 1000 10000 100000 1000000
Concentration (ug/L)
Dep
th (
ft)
TCE Concentration Profile CW-LTCE Concentration Profile CW-L Prior to 4 Prior to 4thth Injection Injection
1, 480 ug/L
Oct 2002

59
TCE Distribution on D-D’ – Feb 2000TCE Distribution on D-D’ – Feb 2000
1 0 2 (M arc h , 0 0 )
6
1 0
1 6 5
1 0
9
8
8
9
2 1 4 1
2 6 0 6
4 4 0
1 3 6
1 5 2
2 3 9
9 6
7 9 6
1 .5 ( Ju ly, 0 0 )
3 9
3 1
3 8
3 6
4 2
5 0
2 9
4 0
7 4 2
3 8 1
9 4 0
3 0 2
1 2
1 0
9
1 0
1 0
1 6
1 2
1 8
2 4 5
3 0 9 1
3 5 6 0 (M arc h , 0 0 )
6 (M a y, 0 0 )
T C E u g /L0
1 0 0
1 0 0 0
1 0 0 0 0
1 0 0 0 0 0
5 0 0 0 0
MW
-8D
G roundSurface
1 0
5 0
2 0
3 0
4 0
6 0
Dep
th (
feet
)
11.5 '
CW
-H
CW
-F
16 '
7 0
D D ’
6’13 '
CW
-G
MW
-1
9.2 '
CW
-I
S ou th N orth
MW
-7D
K M n O T re a tm e n t Z o n e4N orth
2.6’
MW
-4
D
35.9’
Parker et al., 2000

60
TCE Distribution on D-D’ – Oct 2002TCE Distribution on D-D’ – Oct 2002
3 8
< 1
< 1 .5
< 1
< 1 .5
< 1 .5
< 1
< 1
< 1
< 1
< 1
< 1
< 1
< 1
< 1
3 5
< 1
< 1
< 1
< 1 .5
< 1 .5
< 1 .5
< 1
< 1 .5
< 1
< 1
< 1
1 .5
< 1
< 1
< 1
< 1
< 1
< 1
< 1
< 1 .5
< 1
< 1
< 1
< 1
< 1 .5
< 1
0
1 0 0
1 0 0 0
1 0 00 0
1 0 0 0 00
5 0 00 0
T C E u g /L
< 1
< 1
< 1
< 1
< 1
4 6
1 6
8 2
1 0 8
UW
P2
3 (M C L )
MW
-8D
G roundSurface
1 0
5 0
2 0
3 0
4 0
6 0
Dep
th (
feet
)
11.5 '
CW
-H
CW
-F
16 '
7 0
D D ’
6’13 '
CW
-G
MW
-1
9.2 '
CW
-I
S o u th N orth
MW
-7D
K M n O T rea tm e n t Z o n e4N orth
2.6’
MW
-4
D
35.9’
Parker et al., 2002

61
TCA Distribution on C-C’ – Feb 2000TCA Distribution on C-C’ – Feb 2000
< 1 .5
< 1 .5
< 1 .5
< 1 .5
< 1 .5
< 1 .5
2 4
1 3 6
1 5 9
9 0
2 5 7
1 4 3
5 6
5 6 6
5 5 9
7 7 6
1 7 4 2
< 1 .5
< 1 .5
< 1 .5
< 1 .5
3 5
4 5
8
2 0
3 5 3 5
8 1 4 1
111
1 2 6 3
2 9 4
4 9 4
2 2 0 7
9 9 0 8
< 1 .5
< 1 .5
< 1 .5
< 1 .5
< 1 .5
< 1 .5
< 1 .5
< 1 .5
< 1 .5
< 1 .5
< 1 .5
< 1 .5
< 1 .5
< 1 .5
< 1 .5
< 1 .5
< 1 .5
< 1 .5
< 1 .5
< 1 .5
< 1 .5
< 1 .5
< 1 .5 (M a y, 0 0 )
< 1 .5
< 1 .5
< 1 .5
< 1 .5
< 1 .5
< 1 .5
< 1 .5
< 1 .5
< 1 .5
< 1 .5
< 1 .5 (M a y, 0 0 )
< 1 .5
< 1 .5
< 1 .5
< 1 .5
< 1 .5
< 1 .5
< 1 .5
< 1 .5
< 1 .5 (M a y, 0 0 )
1 ,1 ,1 -T C A u g /L0
1 0 0
1 0 0 0
1 0 0 0 0
1 0 0 0 0 0
5 0 0 0 0
G roundSurface
1 0
5 0
2 0
3 0
4 0
6 0
Dep
th (
feet
)
CW
-E
12.5 '7 .3 '
CW
-I
CW
-M
CW
-A
CW
-J
CW
-L
19.4 ' 6’
7 0
C C ’
MM
W-6
D
MW
-4
D
16.8 ' 7 .6 ' 35 .9 '9 .9 '
S o u th N orth
MW
-5D
K M n O T rea tm e n t Z o n e4
MW
-10D
5.3’
Parker et al., 2000

62
TCA Distribution on C-C’ – Oct 2002TCA Distribution on C-C’ – Oct 2002
< 1
< 1
< 1
< 1
< 1
< 1
< 1
< 1
< 1
< 1
< 1
< 1
< 1
< 1
6
< 1 .5
< 1
< 1
< 1
< 1
< 1
< 1
< 1
< 1 .5
1 3
3 0
3
6
4
6
1 3 5
5 6
< 1
< 1
< 1
< 1
< 1
< 1
< 1
< 1
< 1
< 1
< 1
< 1
< 1
< 1
< 1
< 1
< 1
< 1
< 1
< 1
< 1
< 1
< 1
< 1
< 1
< 1
< 1
< 1
< 1
< 1
< 1
< 1
< 1
< 1
< 1
< 1
< 1
< 1
< 1
< 1
< 1
T C A u g /L< 1
< 1
< 1
< 1
0
1 0 0
1 0 0 0
1 0 0 0 0
1 0 0 0 0 0
5 0 0 0 0
6 4
G roundSurface
1 0
5 0
2 0
3 0
4 0
6 0
Dep
th (
feet
)
CW
-E
12.5 '7 .3 '
CW
-I
CW
-M
CW
-A
CW
-J
CW
-L
19.4 ' 6’
7 0
C C ’
MM
W-6
D
MW
-4
D
16.8 ' 7 .6 ' 35 .9 '9 .9 '
S o u th N orth
MW
-5D
K M n O T rea tm e n t Z o n e4
MW
-10D
5.3’
Parker et al., 2002

63
100
100
Monitoring wellMultilevel systemGeoProbe sampling
Building
CW-L
TCE source zone>10,000
Before Remediation – February 2000Before Remediation – February 2000
Plume
TCE µg/L
0 10 ftN
Parker, 2002

64
Monitoring wellMultilevel systemGeoProbe sampling
TCE µg/LAfter Remediation – December 2000After Remediation – December 2000
TCE source zones>10,000Building
0 10 ftN
100
100
Parker, 2002

65
Monitoring wellMultilevel systemGeoProbe sampling
TCE µg/LAfter Remediation – October 2002After Remediation – October 2002
Building
0 10 ftN
100
214
1,480
108
Parker, 2002

66
Specific ConclusionsSpecific Conclusions• 99% reduction in contaminated volume
• Displacement avoided by limiting injection to <8% of treatment zone pore volume for each episode
• 1,1,1-TCA also disappeared
• No TCE or TCA rebound

67
General ConclusionGeneral Conclusion
This case study showed that
permanganate can be successful for
complete remediation of the source if :
• The site conditions are suitable
• The remedial design is tailored to the site

68
Final StageFinal Stage
• Fourth injection occurred October 2002 to complete source zone remediation
• Performance assessment monitoring planned for February 2003

69
AcknowledgementsAcknowledgementsFunding:• University Consortium Solvents-in-Groundwater Research Program • Canadian Natural Sciences and Engineering Research Council• Sun Belt Interplex, Inc.
Staff:• Matthew Nelson, MSc Hydrogeologist: Project Manager• Colin Meldrum, BASc: Field Activities and Data Display• Bob Ingleton, Paul Johnson, BSc: Injection System Design and Field Technical
Assistance• Martin Guilbeault, MSc, Matthew Whitney, BASc: Field Assistance• Maria Gorecka, MSc: Lab Analysis of VOC

70
For information on this case study:For information on this case study:
Parker, B.L., J. A. Cherry and T. A. Al (2002).
Passive permanganate remediation of a solvent DNAPL source zone.
In proceedings for “The Third International Conference on Remediation of Chlorinated and Recalcitrant Compounds,” Monterey, California.
Battelle 2002 Monterey Conference Proceedings