Embed Size (px)
Citation preview

WATER-RESOURCES INVESTIGATIONS REPORT 82-4002
PRELIMINARY DELINEATION AND DESCRIPTION OF THE REGIONAL AQUIFERS
OF TENNESSEE-- THE CENTRAL BASIN AQUIFER SYSTEM
Prepared by U.S. GEOLOGICAL SURVEY
in cooperation with the U.S. ENVIRONMENTAL PROTECTION
AGENCY
PRELIMINARY DELINEATION AND DESCRIPTION OF THE REGIONAL AQUIFERS
OF TENNESSEE--THE CENTRAL BASIN AQUIFER SYSTEM
J.V. Brahana and Michael W. Bradley
U.S. GEOLOGICAL SURVEY
Water-Resources Investigations Report 82-4002
Prepared in cooperation with the
U.S. ENVIRONMENTAL PROTECTION AGENCY
Nashville, Tennessee 1986

UNITED STATES DEPARTMENT OF THE INTERIOR
JAMES G. WATT, Secretary
GEOLOGICAL SURVEY
Dallas L. Peck, Director
For additional information Copies of this report can be write to: purchased from:
District Chief U.S. Geological Survey A-41 3 Federal Building U.S. Courthouse Nashville, Tennessee 37203
Open-File Services Section U.S. Geological Survey Box 25425, Federal Center Lakewood, CO 80225

CONTENTS
Abstract 1 Introduction 1 Geology 2 Hydrology 3 Water quality 4 Drinking-water supplies 6 Contamination 5 Hydrocarbon, mineral, and geothermal resource use Summary 6 Selected references 34
5
ILLUSTRATIONS
Figure l-3. Maps showing: 1. Area1 extent of the Central Basin aquifer
system and physiographic provinces in Tennessee 7 2. Structure contours on the base of the Chattanooga
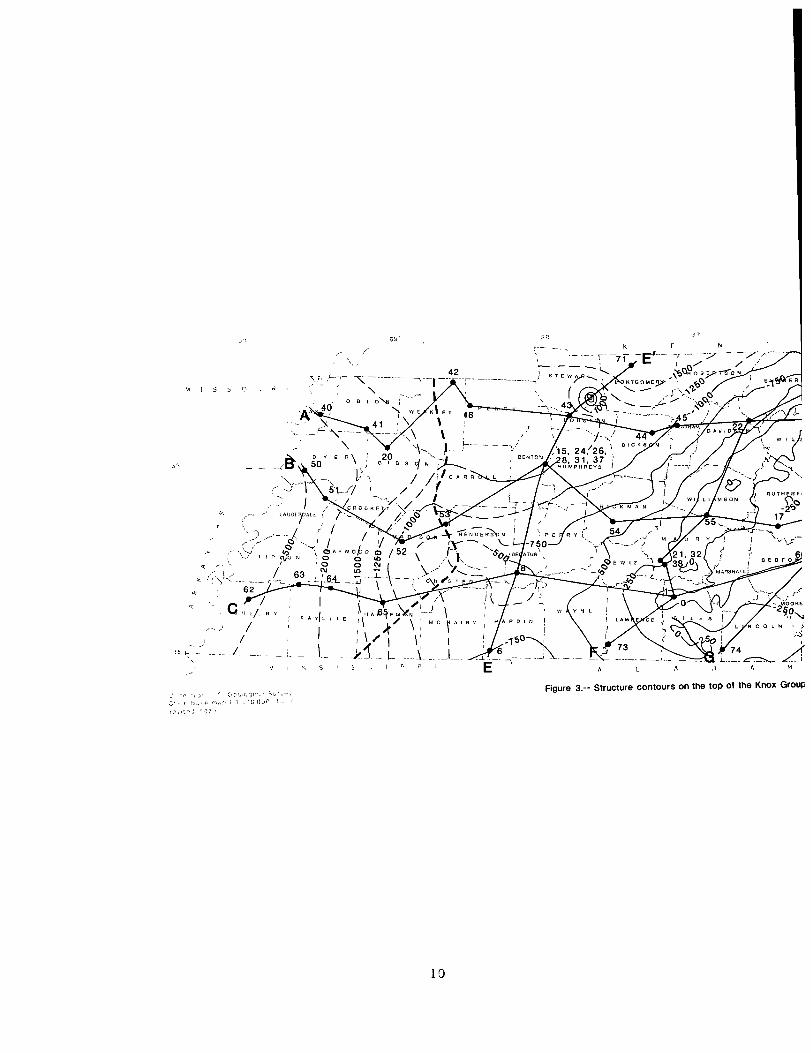
Shale, the top of the Central Basin aquifer system 8 3. Structure contours on the top of the Knox G roup,
the base of the Central Basin aquifer system 10 4-l 0. Geohydrologic sections showing water quality in the Central
Basin aquifer system: 4. Along line A-A’ 12 5. Along line B-B’ 12 6. Along line C-C’ 14 7. Along line E-E’ 8. Along line F-F’ :45 9. Along line G-G’ 16
10. Along line H-H’ 16 11. Sketch showing conceptual model of ground-water
occurrence in the Central Basin aquifer system 17 12-l 5. Maps showing:
12. Concentrations of dissolved solids in the Central Basin aquifer system 26
13. Areas of use and potential use of the Central Basin aquifer system as a source of drinking water 28
14. Contamination sites in the Central Basin aquifer system 30 15. Location of potential mineral and hydrocarbon
resources in the Central Basin aquifer system 32
TABLES
Table 1. Geohydrology of the formations comprising the Central Basin aquifer system, and confining units 18
2. Dissolved-solids concentrations in water from selected wells in the Central Basin aquifer system 22
3. Summary of public drinking-water supplies derived from the Central Basin aquifer system 25
4. Description of contamination sites in the Central Basin aquifer system 3 1
. . . 111

FACTORS FOR CONVERTING INCH-POUND UNITS TO INTERNATIONAL SYSTEM OF UNITS (SI)
For the convenience of readers who may want to use the International System of Units (SI), the data may be converted by using the following factors:
Multiply Ilr
inch (in.) 25.4
To obtain
millimeters (mm 1
feet (ftl 0.3048 meters (ml
feet per mile (ft/mi) 0.1894 meters per kilometer (m/km)
mile (mil 1.609 kilometers (km)
square miles (m i2) 2.590 square kilometers (km21
gallons per minute (gal/m in) 0.06309 liters per second (L/s)
National Geodetic Vertical Datum of 1929 (NGVD of 1929): A geodetic datum derived from a general adjustment of the first-order level nets of both the United States and Canada, formerly called mean sea level. NGVD of 1929 is referred to as sea level in this report.
iv

PRELIMINARY DELINEATION AND DESCRIPTION OF THE REGIONAL AQUIFERS
OF TENNESSEE--THE CENTRAL BASIN AQUIFER SYSTEM
By J.V. Brahana and Michael W. Bradley
ABSTRACT
The Central Basin aquifer system is composed of Devonian and Ordovician carbonate and shale rocks. This aquifer occurs west of the Valley and Ridge province and crops out in the Central Basin and the Sequatchie Valley of Tennessee. Ground water in the Central Basin aquifer occurs primarily in solution openings and fractures, and the flow system is generally limited to 300 feet or less below land surface. However, some fracture and minor faults may allow vertical recharge to the underlying Knox Group, which marks the lower boundary of the Central Basin aquifer system. Away from the Central Basin, the upper limit of the Central Basin aquifer system is the Chattanooga Shale, an effective con- fining unit.
The Central Basin aquifer system, an important source of drinking water, supplies most of the rural domestic and many public supplies of drinking water in the Central Basin and the Sequatchie Valley. Dissolved-solids concentrations often are less than 500 milli- grams per liter where the aquifer is part of a dynamic flow system. Dissolved-solids con- centrations may reach thousands or tens of thousands of milligrams per liter below the zone of dynamic flow.
INTRODUCTION
The Safe Drinking Water Act (Public Law 93-523) includes provisions for the protec- tion of underground sources of drinking water. Specifically, Part C of the Act authorizes the U.S. Environmental Protection Agency (EPA) to establish regulations to assure that underground injection of contaminants will not endanger existing or potential sources of drinking water. As developed by EPA, the regulations require that all underground sources of ground water with less than 10,000 milligrams per liter (mg/L) dissolved solids that do not contain hydrocarbon, mineral, or geothermal resources, be designated for protection whether or not they are currently being used as a source of drinking water.
Within a format of hydrogeologic atlases, the geologic formations of Tennessee (Miller, 1974) have been combined into eight major regional aquifer systems having a broad area1 extent. Each aquifer is characterized by a unique set of hydrologic conditions and water quality.

The purpose of this report is to describe the formations that comprise the Central Basin aquifer system and to delineate zones within this aquifer that are actual or potential drinking water sources. This report on the Central Basin aquifer system provides general- ized information on (1) the area1 and stratigraphic occurrence, (2) dissolved-solids concen- tration of the ground water, (3) area of use and potential use based on best available data, (4) the hydraulic character, (5) the areas of known ground-water contamination, and (6) the known locations of current and potential hydrocarbon, mineral, and geothermal resources in the sequence of geologic formations that occur in the stratigraphic interval between the bottom of the Chattanooga Shale of Devonian age and the top of the Knox Group of Ordovician and Cambrian age.
G EOLOG Y
The geology of the Central Basin aquifer system is relatively well defined on a regional scale. The rocks, which range in age from Devonian to Ordovician, are almost all carbonates, primarily limestones. Some shaly zones exist in the section, as well as phos- phatic-rich layers and several thin bentonite beds, which strongly influence the hydrology. Chert is generally restricted to Devonian formations. Rocks comprising this aquifer sys- tem are summarized in table 1. The generalized area of occurrence of the Central Basin aquifer system is shown in figure 1.
The Devonian to Ordovician formations are overlain by Mississippian rocks in the area of the Highland Rim and Cumberland Plateau. Devonian to Ordovician rocks of the Cen- tral Basin aquifer system are exposed on the east side of the Sequatchie Valley. The cen- tral and western side of the valley are underlain by the Knox Group and the Mississippian formations, respectively. West of the western limit of occurrence of Mississippian rocks, where these rocks have been eroded away, the formations of the Central Basin aquifer system are overlain by Cretaceous formations.
The base of the Chattanooga Shale is defined as the top of the Central Basin aquifer system. The generalized configuration of this surface is shown in figure 2. The base of the Central Basin aquifer system is shown as the top of the Knox Group of Ordovician and Cambrian age. The altitude of this surface is shown in figure 3.
Structurally, the rocks of the Central Basin aquifer system are relatively undeformed with the exception of the nearly vertically dipping rocks on the flanks of the anticline in which the Sequatchie Valley is eroded. Dips are gentle throughout most of the area, aver- aging less than one degree, although locally, dips of more than three degrees may be observed. The Nashville Dome is the dominant structural feature; it is a low dome whose crest is in southern Rutherford County (fig. 2). The Central Basin was formed by the ero- sion of this dome. During the upwarping and doming of the Nashville Dome, the rocks at the crest were stretched, resulting in the formation of the systematic joints, parallel sets of almost vertical fractures along which relatively little displacement has occurred.
The location where lines of cross section have been constructed for this report are shown in figures 2 and 3. The cross sections are shown in figures 4 through 10. These fig- ures include the generalized structural and stratigraphic configuration of the formations that make up this aquifer system and the dissolved-solids concentrations of the water within the formations. Minor folding of the rocks is not unusual throughout the area, but it is commonly attributed to dissolution of the carbonate rocks, and is generally only local.
2

The detailed geology of the component formations have been described in a number of published reports. The following were used to compile this atlas: Bassler (1932); Piper (1932); Theis (1936); Wilson (1948); Wilson (1949); Freeman (1953); Hass (1956); Newcome (1958); Conant and Swanson (1961); Hardeman (1966); Milici (1969); Miller (1974); and Wiethe and Sitterly (1978).
HYDROLOGY
Nearly all the ground water in the outcrop area of the Central Basin aquifer system is contained in a shallow flow system of solution channels. These channels are highly irreg- ular in their distribution throughout the solid rock mass and generally occur within 300 feet of the land surface. The solution channels are openings along joints and bedding planes that have been enlarged by solution of the limestones. These channels represent zones of secondary porosity and permeability in an otherwise nonporous, impermeable rock mass. Bedding planes are thought to be the major control in the formation of solution cavities. Zurawski (1978) reported that most of these cavities are elongated as horizontal sheetlike openings. A conceptual model of ground-water occurrence in the Central Basin is shown in figure 11.
The bentonite zones in the upper part of the Carters Limestone (table 1) also play a significant role in the hydrology of the Central Basin aquifer system. In areas where the bentonite layers are unbreached, the downward movement of ground water is restricted (Burchett, 1977). Th is isolates the ground water below the bentonite from the shallow, dynamic flow system within the Central Basin aquifer system. Where the bentonite zones are breached by open joints or stream valleys, solution openings can form in the underlying limestone. Ground water in these openings can receive recharge from precipitation and is part of the dynamic flow system.
Dissolved-solids concentrations in the ground water (table 2; fig. 12) indicate that flow in the upper part of the Central Basin aquifer system is made up of many isolated cells. Locally, relatively fresh water can be obtained frorn wells within several hundred feet of wells with water that contains more than 10,000 mg/L dissolved solids. This fresher water represents a much more dynamic flow system, with significant recharge from precipitation and ground-water discharge to streams and springs. The saline water identifies zones in the aquifer system that are hydrologically isolated and separate from the fresher zones. The isolated zones are not recharged, and under steady-state condi- tions, flow rates are negligible.
Where present, the Chattanooga Shale separates the Central Basin aquifer system from the overlying Highland Rim aquifer system and is important to the hydrology of both of these aquifer systems. The shale is commonly less than 50 feet thick but is a very effective barrier to vertical movement of ground-water into or out of the aquifer system. In the rocks underlying the Chattanooga Shale, flow is restricted and water generally contains a much higher concentration of dissolved solids.
The hydrologic boundaries of the Central Basin aquifer system play a significant, if incompletely defined, role in the development of the aquifer as a drinking-water source. The Tennessee River acts as a constant-head hydrologic boundary to the west, where the Mississippian siliceous limestones overlie Devonian to Ordovician rocks of the Central
3

Basin aquifer system. Beyond the western limit of Mississipian formations, slightly west of the river, Cretaceous deposits overlie the Central Basin aquifer system. The Creta- ceous deposits are highly variable in lithology, ranging from clays to gravels, and the hydraulic connection between them and the Devonian to Ordovician rocks of the Central Basin aquifer system varies considerably also.
A zone of faulting along the eastern escarpment of the Cumberland Plateau marks the eastern extent of the Central Basin aquifer system. In the Valley and Ridge province, the formations have been subjected to the intense faulting and deformation, which makes this area hydrologically distinct. The nature and extent of ground-water flow across this zone of faulti;g has not been documented.
Outside the Central basin, the basal confining unit between the Central Basin aqui- fer system and the Knox Group includes the Pierce Limestone and the Pond Spring Forma- tion. At some locations, particularly in the Central Basin, the Knox probably receives recharge by leakage through joints in these formations. At other locations, it appears the Ordovician limestones and the Knox Group are hydrologically distinct and separate.
WATER QUALITY
Water of the Central Basin aquifer system is often suitable for drinking-water sup- plies (dissolved-solids concentrations generally less than 500 mg/L), but a wide range of water-quality conditions occurs in the system. Consequently, many wells have been drilled that are not suitable for drinking-water supplies. For example, water having dissolved- solids concentrations greater than 10,000 mg/L is found in the same formation within sev- eral miles of water with dissolved-solids concentrations less than 500 mg/L. The area1 distribution of dissolved-solids concentrations in the aquifer system is shown in figure 12, and the variation by depth and formation is presented in table 2. Table 2 and figure 12 do not contain all available data, but do include all extremes and those data that are con- sidered representative for each formation.
Several factors seem to be responsible for the area1 and stratigraphic variability of water quality. Most important, the aquifer system is highly anisotropic, and flow within formations commonly is localized. Recharge from leakage, particularly near the Highland Rim escarpment, may account for the introduction of significant quantities of water with high dissolved solids into the Central Basin aquifer system (C.R. Burchett, USGS, written commun., 1981). The source of these high dissolved solids is thought to be water that has been in contact with evaporite beds in the overlying Fort Payne Formation of Mississippian age. Near the escarpment, the confining bed of Chattanooga Shale has been breached, and the more mineralized waters of the Fort Payne Formation recharge the Central Basin aquifer system. Likewise, recharge from the underlying, more mineralized Knox Group through abandoned exploration holes may have locally altered the water quality (Luke Ewing and Terry Brashears, Tennessee Division of Water Resources, oral commun., 1981).
In the shallow flow zone, water from half of the wells sampled had dissolved-solids concentrations exceeding 500 mg/L. In addition to the area1 and stratigraphic variability in dissolved solids, ground water in the Central Basin is commonly hard and contains hydro- gen sulfide gas. More than two-thirds of the wells sampled had hardness in the range of 200 to 500 mg/L, and about 20 percent contained detectable amounts of hydrogen sulfide.
4

DRINKING-WATER SUPPLIES
The Central Basin aquifer system is used extensively in its outcrop area as a source of drinking water (table 3; fig. 13). This aquifer system is also an important local source of drinking water for domestic use in most of the Central Basin, in the Sequatchie Valley, and in the Highland Rim where it occurs at shallow depths.
Area of potential use defined as the area where water contains less than 10,000 mg/L dissolved solids and is not now being used, is shown in figure 13. inasmuch as very few data to delineate this boundary exist, it is estimated on the map. Several drinking- water supplies shown are not currently using this resource but did use the aquifer system previously.
CONTAMINATION
Contamination at five sites in the Central Basin aquifer system is documented (fig. 14; table 4). One contaminated area is associated with a shallow municipal landfill in Davidson County. Contaminated water from formations of the Nashville Group has high dissolved-solids concentrations, is hard, and has high biochemical oxygen demand, as well as a petroliferous odor (Residual Waste Study, Tennessee Division of Water Quality Con- trol). The extent of this contamination is not known.
Effluent from septic tanks has caused the contamination of ground water at Hender- sonville, LaVergne, and Mt. Juliet (Tennessee Division of Water Quality Control, written commun., 1981). Near Williamsport, in Maury County, the ground-water was contaminated when the bottom of a phosphate tailings pond collapsed; after the collapse,phosphatic mud appeared in springs about a mile away.
Another area of contamination delineated on the basis of well driller’s reports only, includes parts of Smith and Wilson Counties (Luke Ewing and Terry Breshears, Tennessee Division of Water Resources, oral commun., 1981). This was a general area of extensive zinc exploration with exploratory test holes drilled into the Knox. In this area, dissolved- solids concentrations in water from many wells in the overlying Devonian-Ordovician aquifer system reportedly increased after the zinc exploration program. Also, many Ordovician wells that were at one time a source of drinking water became too salty for use and were abandoned. The underlying Knox Group in this vicinity has dissolved-solids concentrations in the range of several thousand milligrams per liter and has hydraulic heads greater than those in overlying Ordovician aquifer systems. The cause of the change in water quality has been attributed to recharge of the Ordovician formations from the underlying Knox through unplugged exploration drill holes.
HYDROCARBON, MINERAL, AND GEOTHERMAL RESOURCE USE
At the present time (19821, some of the Ordovician formations in the western part of the Central Basin are mined for phosphate (fig. 15). This is the only known present usage of mineral or geothermal resources from the aquifer. Flourite was once mined from the Ordovician rocks in the northern part of the Central Basin. Hydrocarbon resource explo- ration is being actively pursued throughout the State. The formations of the Central Basin aquifer system have produced oil and gas in the Cumberland Plateau and in the Highland Rim. Actual and potential petroleum and gas resources are also located in figure 15.
5

SUMMARY
The Central Basin aquifer system is an important source of drinking water throughout its area of outcrop in the Central Basin and the Sequatchie Valley as well as parts of the western Highland Rim and western Valley of the Tennessee River. The aquifer is not used as a drinking-water source beneath the northern, eastern, and southern Highland Rim or beneath the Cum berland Plateau. Ground-water is highly variable both in quantity and quality. Most water occurs within 300 feet of the land surface along joints, fractures, bed- ding planes, and weathered zones within the solid rock mass.
Where the aquifer system is part of a dynamic flow system, dissolved-solids concen- trations are generally less than 500 mg/L. Below the zone of dynamic flow, dissolved- solids concentrations may reach thousands or tens of thousands of milligrams per liter. Water from areas near the northwestern and southeastern escarpments of the Highland Rim has concentrations of dissolved solids that can exceed tens of thousands of milligrams per liter.
6

:.:.I ::. 0
\ . . . . . ::. ::. ::. . . \
7

5: hi’
N 1 9
r- --.-- --- -.- 7
.,
Figure 2.-- Structure contours on the base of the Chattanooga Shale.
8

1 4 __- ., ‘,i ’ ,,’
EXPLANATION STRUCTURE CONTOUW- Shows altitude on base of the Chattanooga Shale, the top of the Central Basin aquifer system. Dashed where approximate. Contour Interval 250 and 500 feet
----- Fault-- Approximately located
l B’J Well location and number
A-A’ Cross section fine and letter
7 , l,O, ;,O , 30 4,0 5,O MI
0 IO 20 30 40 50 KILOMETERS NATIONAL GEODETIC VERTICAL DATUM OF
LES
1929
the top of the Central Basin aquifer system.
,I . . ..i
_. .i :i c - .- .
Figure !J.-- Structure contours on the top of the Knox Grow

EXPLANATION ^__.. -- ..-- . .
?-- ” LOllO‘,N ; B ’ 0 ” N ’ :i .- ’ - -500 -- S I HUCI URE CONTOlJF Pl.^...^ ^,.:._.a_ -- . UIIVVVD cltattuue on rop of the I,__.. ^ nrlvx uroup Central Bas
8.’ the base of the m--L_> . . ..~ In aquifer system. ~dbr,e(~ wnere approximate.
‘val 250 and Contour intal 500 feet
l 6O Well locatlon and number
A-A’ CrOSS section llne and letter
- - - Extent of the Central Bascn aquifer system. Dashed where approximate
0 10 20 30 40 50 MILES I , I’,‘, ’
0 10 20 30 40 50 KILOMETERS NATIONAL GEODETIC VERTICAL DATUM OF ,919 the base of the Central Basin aql,lfer system.
11

SEA I
A
2000’ -
.‘, - ,w $tLl cc Highland Rim
Chattanoogg
iOOO’- 40 41 20
-EVEL r I
I Knox Group
Figure 4.-- Geohydrologic section showing water qUalitY
Knox Group
Figure 5 -- Geohydrologic section showing water quality
EXPLANATION
50
I well and number
l Fault I
DISSOLVED-SOLIDS CONCENTRATIONS, IN MILLIGRAMS PER LITER
q 0 to 1000. Isolated pockets greater than 1000 may occur
q Few analyses, estimated greater than 1000. May be greater than 10,000 with depth
12

2000’
Chattanooga Shale, _ 1000’
c Cumberlkd Plateau
SEA 1
1000’
2000’
3000’
In the Cantral Basin aquifer system along line A-A’. Vertical scale greatly exaggerated
4000’
.EVEL
.E - XI B’
Cumberland Plateau aquifer 2
3000’
Pennington FormatIon c 2000’
‘I, 1 7 \\;y ( 1 SEA LEVEL
l’l ’ i \ ” I
- 2000’
\-i - 3000’
Vertical scale greatly exaggerated 4000’
..,- --.... -. ---... l_l” ..-. “,.,.“.., u.-,.m ..,.” ” -.
p ( 1p, fll , 30 4; 5p MILES
0 10 20 30 40 50 KILOMETERS NATIONAL GEODETIC VERTICAL
DATUM OF 1929
13

C
Hiahtand Rtm
SEA LEVEL -I
Figure 6.- Geohydrologic section showing water
1000’ 1000’
SEA LEVE SEA LEVEL
1000’ 1000’
2000’ 2000’
Figure 7.-- Geohydrologic section showing water quality in the Central Sastn aqurfer system along hne E-E’.
EXPLANATION 65 DISSOLVED-SOLIDS CONCENTRATIONS,
Well and number IN MILLIGRAMS PER LITER
I Fault q 0 to 1000. Isolated pockets
greater than 1000 may occur I q Few analyses, estimated great,er than 1000
May be greater than 10.000 wrth depth
14

2000’
1000’
SEA LEVEL
1000’
quality in the Central Basin aquifer system along line C-C’. Vertical scale greatly exaggerated 2000’
1000’
SEA LEVEL
1000’
2000’
1000’
SEA LEVEL
1000’
Vertical scale greatly exaggerated 2000’
Figure 8.-- Geohydrologlc sectlon showing water quality in the Central Basin aauifer system along line F-F’.
y , 1p, ;p , 3p, 4p 5p MILES
0 10 20 30 40 50KlLOMETWS NATIONAL QEODETIC VERTICAL DATUM OF 1029
1 .5

.E - C-l Pi G’ ul Highland Rim
1000’ 1000’
SEA LEVEL SEA LEVEL
1000’ 1000’
2000’ 2000’
Figure 9.-- Geohydrologic section showing water quality in the Central Basin aquifer System along line G-G’.
SEA
U’ rt i
I I
6Y rn
3000’ ^ ~-L--.--
2000’
1000’
.- ^-. .z-- LEVEL
1000’
2000’ CentralSa$+j;4
Vertical scale greatly exaggerated ----
Figure to.-- Geohydrologic section showing water quality in the Central Basin aquifer System along line H-H’.
EXPLANATION
DISSOLVED-SOLIDS CONCENTRATIONS. IN MILLIGRAMS PER LITER
0 to 1000. Isolated pockets H greater than 1000 may occur
29 Well and number
: Fault I
El Few analyses, estimated greater than 1000. May be greater than 0 10 2p 30 MILES 10.000 with depth I I’, I’
o 10 20 30 KILOMETERS NATIONAL GEODETIC VERTICAL
DATUM OF 1929
16

I 133zl ooz 1noav --
17

.taddn I
alPPIW
NW INOtClCI
18

NWIHllIS
19

sddn I
W31SAS NWI3IAootio I
20

JlPPlW
NWI3IAOOUo
21

Table 2 .--Dissolved-solids concentrations in water from selected wells in the Central Basin aquifer system
[Data source codes: 1, Piper (1932); 2, Wells (1933); 3, Theis (1936); 4, Newcome (1958); 5, Rima and Goddard (1979); 6, Smith (1962)]
County Location Dissolved
Depth Water- solids Data (feet) bearing (milligrams source
unit per liter)
Bedford Bell Buckle 1.5 mi S Haley Shelbyville 11 mi N Shelbyville Wartrace
36 Carters 10,813 155 Lebanon 30,830 102 Ridley -384 120 Lebanon 476 185 Lebanon 1,103
Benton Big Sandy 11 Camden 128 2 Camden 5.1 mi E 22 Devonian rocks 106 2
Carroll
Cheatham
Davidson
Bruceton 298 Devonian rocks 276 2
Pegram 0.5 mi N 79 Silurian rocks 70 1
Ashland City 8 mi SE Spring Silurian rocks 178 1 Bellevue 1.25 mi W 144 Catheys 6,474 1 Nashville 4.25 mi NW 1491 Hermitage,Lebanon 979 1 Nashville 4.5 mi S 125 Carters 469 1 Whites Creek 2 mi S 63 Leipers 412 1 Brentwood 0.5 mi N 90 Bigby and Cannon 1960 4
Decatur Bath Springs 60 Decatur 276 Decaturville 0.5 mi SE 107 Decatur 516 Decaturville 30 Harriman 224 Perryville 72 Decatur 609
Franklin
Giles
Winchester 5 mi W Spring Silurian rocks 141 3
Aspen Hill Campbellsville 3 mi N Lynnville Minor Hill Tarpley 1 mi E
185 Spring
37 619
Spring
Lebanon 286 3 Catheys 152 3 Carters 424 3 Ordovician rocks 130 6 Hermitage 190 3
Hardin
Hickman
Savannah 128 Hermitage 98
Centerville 1.5 mi SE Spring Leipers 56 Coble 2.5 mi NW Spring Brownsport 97 Pinewood 100 Leipers 1,614
Humphreys Denver 4.25 mi S Spring Silurian rocks 160
22

Table 2 .--Dissolved-solids concentrations in water from selected wells in the Central Basin aquifer system--Continued
County Location Dissolved
Depth Water- solids Data (feet) bearing (milligrams source
unit per liter)
Lewis
Lincoln
Marshall
Macon
Maury
Moore
Perry
Gordonsburg 5.5 mi NE 84 Catheys 19,160 Gordonsburg 6.5 mi NE 50 Leipers 257
Belleville 66 Hermitage 7,724 Delrose 0.5 mi NE Spring Fernvale 110 Fayetteville 4 mi S Spring Bigby and Cannon 106 Howell Spring Fernvale 193 Petersburg 40 Carters 434
Chapel Hill 2.5 mi S 96 Lebanon 270 Chapel Hill 540 Murfreesboro 236 Lewisburg 2 mi SE 21 Carters 609
Lafayette 3.5 mi SW Lafayette 6 mi S
Leipers 435 Bigby and Cannon 310
Carters Creek 1 mi E Columbia 3.5 mi SW Kettle Mills Mt. Pleasant 6 mi SE Springhill 4 mi SE Match 5 mi E
7”: 8853 73 75
Hermitage 200 Hermitage 311 Bigby and Cannon 1,300 Lebanon 290 Lebanon 955 Lebanon 3,283
Lynchburg 2 mi NE Spring Bigby and Cannon 138 Lynchburg 1 mi W 25 Bigby and Cannon 280
Beardstown 137 Brownsport 3,121 Beardstown 3 mi E Spring Ross 79 Linden Spring Ross 118 Linden 0.5 mi S 202 Silurian rocks 185 Pope 9 mi SE Spring Brownsport 108
Rutherford Christiana 9 mi W Eagleville 2 mi E Halls Hill Murfreesboro 2.5 mi W
Spring Spring
115 175
Lebanon Lebanon Ridley Murfreesboro
Murfreesboro 0.75 mi NW 217 Murfreesboro Murfreesboro 1.5 mi N 1930 Murfreesboro Murfreesboro 6 mi SE 253 Ridley Rucker Ridley Rocky Ford 0.25 mi W 112 Lebanon
300 256 357
1,240 356 322 282 297 367
i
3
z 3 3
3 4 3
4 4
3 3
4 3 3
3 4
3
;
i
1 1 5 1 1 1 5
z
23

Table 2.-- Dissolved-solids concentrations in water from selected wells in the Central Basin aquifer system--Continued
County Location Dissolved
Depth Water- solids Data (feet) bearing (milligrams source
unit per liter)
Smith
Sumner
Wayne
Williamson
Wilson
Kempville 123 Bigby and Cannon 300
Castalian Springs Spring
Cottontown Gallatin Hendersonville Millersville 2 mi S Saundersville
60 300 315
53:
Clifton 3 mi NE 42 Collinwood 5 mi NW Spring Riverside 5 mi SW Spring
Boston 5 mi E Boston 4.75 mi SE Franklin Franklin 1 mi S Nolensville Fairview 5 mi SE
45 Bigby and Cannon 10,920 105 Catheys 2,296 150 Carters 216
Spring Hermitage 192 160 Ridley 342
Spring Fernvale 241
Gladeville 0.75 mi E Hornsprings Lebanon 9 mi NE Lebanon Mt. Juliet Norene 5.5 mi S Watertown 0.5 mi W Woods Ferry
28 Lebanon 1,152 Spring Hermitage 3,880
118 Lebanon 382 205 Ridley 379 47 Carters 312
152 Lebanon 26,410 251 Ridley 319
60 Lebanon 261
Bigby and Cannon, Hermitage 3,497
Leipers 292 Bigby and Cannon 262 Bigby and Cannon 262 Bigby and Cannon 377 Leipers 628
Silurian rocks 481 Brownsport 170 Silurian rocks 78
4
3 3 3
24

Table 3 .--Summary of public drinking-water supplies derived from the Central Basin aquifer system
LData source codes: 1, Tennessee comprehensive joint water and related land resources planning, Tennessee Division of Water Resources; 2, Tennessee Division of Water Quality Control; 3, Tennessee Division of Water Resources]
System County Data source
Chapel Hill College Grove Dowelltown-Liberty Eagleville Lynnville
Mt. Pleasant Murfreesboro Nolensville Petersburg Pikeville
Sequatchie Wartrace Watertown Woodbury
Marshall Williamson DeKalb Rutherford Giles
Maury Rutherford Williamson Marshall Bledsoe
Marion Bedford Wilson Cannon
1, 2 1, 2, 3 1, 2, 3 1, 2, 3
1, 3
1 1, 2, 3 1, 2, 3 1, 2, 3 1, 2, 3
1, 2, 3 1, 2, 3 1, 2, 3
2, 3

\ ’ i.- ( -..i I
‘- I -. _ ( ~ ’ .’ - = ” R : ’
Ls ,_.- c
i : \.. )
<I_ ‘_. ,.,.- ^,

‘\ c-.~-,.fl: \ h/‘.C \ ‘\. ,, s c I’ t E R J
EXPLANATION
! ,/’ .&SOLVED SOLIDS CONCENTRATIONS, ir- IN MILLIGRAMS PER LITER
,, f a Less than 1000
&j 1000 to 5000
m 5000 to 10,000 m Greater than 10.000
“i’ Sample location and dissolved-sollds concentration, in milligrams per liter
--- Limit of the Central Basin aquifer system. Dashed where approxtmate
NATIONAL GEODETIC VERTICAL DATUM OF ,929 - - -- . - - -. . -. I --. __I -..-. _,_._....
27

+? &,
Watertown l i
c f DobJFown-Libe
Figure 13.-- Areas of use and potenhal use Of the
28

~-, ,.-’ EXPLANATION
q ,44sa& ;zes a source of
fig Area where the Central Basin aquifer system is no! used as a source of drinking water
College Grove Public water system which uses
. water from the Central Basin aquifer system (See table 21
--- Limit of the Central Basin aquifer system. Dashed
0 10 20 30 40 50 MILES I I’, /‘,I, ’ . _. - lj lb 2’0 3’0 40 50 KILOMETERS
NATIONAL GEODETIC VERTICAL DATUM OF 1929
Central Basin aquifer system as a source of drinking water.
29

_I c-t- --___ 2 _____ S---j -____ ~~..1$C!L..-.L~
87” 0
EXPLANATION I KENTUCKY I 5, Contamination site and -- -- -- --:e-‘-- --~-- -T ._- __ -_
identification number / ---.r. ~_ /, I RORlzHT’;OP’ I i r :
36
A L”; R i 1
h’ c E i
Glirs I >~,
‘4 , I I PI c 0 L N : j
i 0
F R $4 ‘4 ,c
” , , IF, :p , “,O, 4: ’ 5: MILES
I 0 10 20 30 40 50 KILOMETERS NATIONAL GEODETIC VERTICAL DATUM OF 1929
Figure 14.-- Contamination sites in the Central Basin aquifer system.
30

.
31

:: i - . .
Figure 15.-- Potential mineral and hydrocart
32

\r J EXPLANATION
resources in the Central Basin aquifer system.
, ;-\ . /’
q Potential phosphate areas
m Potential hydrocarbon areas - --- Extent of the Central Basin
aquifer system. Dashed where approximate
50 MILES
O’p 0 10 20 30 40 50 KILOMETERS
NATlDNAL GEODETIC VERTICAL DATUM OF 1929
33

SELECTED REFEREN
Bassler, R.S., 1932, The stratigraphy of the Central Basin of Tennessee: Tennessee Division of Geology Bulletin 38, 268 p.
Bingham, R.H., 1963, Summary of ground-water levels in Tennessee, 1952-61: Tennessee Academy of Science Journal, v. 38, no. 4, p. 126-l 32.
Bloyd, R.M., Jr., 1974, Summary appraisals of the Nation’s ground-water resources - Ohio Region: U.S. Geological Survey Professional Paper 813-A, 41 p.
Burchett, C.R., 1977, Water resources of the upper Duck River Basin, central Tennessee: Tennessee Division of Water Resources, Water Resources Series no. 12, 103 p.
Conant, L.C., and Swanson, V.E., 1961, Chattanooga shale and related rocks of central Tennessee and nearby areas: U.S. Geological Survey Professional Paper 357, 91 p.
Feth; J.H., and others, 1965, Preliminary map of conterminous United States showing depth to and quality of shallowest ground water containing more than 1,000 parts per mil- l ion dissolved solids: U.S. Geological Survey Hydrologic Investigations Atlas HA-l 99, scale 1:3,168,000.
Freeman, L.B., 1953, Regional subsurface stratigraphy of the Cambrian and Ordovician in Kentucky and vicinity: Kentucky Geological Society Series IX, plates for Bulletin 12.
Galloway, J. J., 1919, Geology and natural resources of Rutherford County, Tennessee: Tennessee Division of Geology Bulletin 22, 81 p.
Glenn, L.C., 1903, [Notes on the ground-water resources of] Tennessee: U.S. Geological Survey Water-Supply Paper 102, pp. 358-367.
Hardeman, W.D., 1966, Geologic map of Tennessee, west, west-central and east-central sheets: Tennessee Division of Geology, scale 1:250,000.
Hardeman, W.D., and Miller, R.A., 1959, iMineral resources and mineral industries of Ten- Tennessee: Tennessee Division of Geology, scale 1:500,000, 1 sheet.
Hass, W.H., 1956, Age and correlation of the Chattanooga Shale and the Maury Formation: U.S. Geological Survey Professional Paper 286, 47 p.
Krieger, R.A., Hatchett, J.L., and Poole, J.L., 1957, Preliminary Survey of the saline- water resources of the United States: U.S. Geological Survey Water-Supply Paper 1374, 172 p.
Milhous, H.C., 1959, Well logs in Tennessee: Tennessee Division of Geology Bulletin 62, 606 p.
Milici, R.C., 1970, Middle Ordovician stratigraphy in central Sequatchie Valley, Tennessee: Reprinted from Southeastern Geology, V. 11, no. 2, pp. 11 l-127, Tennessee Division of Geology, Report of Investigations no. 30.
Miller, R.A., 1974, The Geologic History of Tennessee: Tennessee Division of Geology Bulletin 74, 63 p.
Miller, R.A., Fagan, J.M., Hale, R.C,, Hardernan, W.D., and Johnson, R.W., 1970, Mineral resources of the Tennessee Valley region: Tennessee Valley Authority.
Miller, R.A., and Maher, S.W., 1972, Geologic evaluation of sanitary landfill sites in Ten- nessee: Tennessee Division of Geology, Environmental Geology Series No. 1, 38 p.
Moore, G.K., Burchett, C.R., and Bingham, R.H., 1969, Limestone hydrology in the upper Stones River basin, central Tennessee: Tennessee Division of Water Resources Ke- search Series 1, 58 p.
Moore, G.K., and Wilson, J.M., 1972, Water Resources of the Center Hill Lake Region, Tennessee: Tennessee Division of Water Resources, Water Resources Series no. 9, 77 p.
Newcome, Roy, Jr., 1958, Ground water in the Central Basin of Tennessee: Tennessee Division of Geology Report, Inv. 4, 80 p.
34

Piper, A.M., 1932, Ground water in north-central Tennessee: U.S. Geological Survey Water-Supply Paper 640, 238 p.
Reesman, A.L., and Godfrey, A.E., 1970a, Chemical erosion and denudation rates in middle Tennessee: Tennessee Division of Water Resources, Water Resources Research 4, 35 p.
-- 1970, Chemical quality of streams draining the Central Basin of Tennessee: Tennessee Division of Water Resources, Water Resources Research 2, 72 p.
Rima, D.R., and Goddard, P.L., 1979, Ground-water resources in the Metropolitan Region of Nashville, Tennessee: U.S. Army Corps of Engineers, Nashville District, 44 p.
Rima, D.R., Moran, M.S., and Woods, E.J., 1977, Ground-water supplies in the Murfreesboro area, Tennessee: U.S. Geological Survey Water-Resources Investigations Report 77-86, 76 p.
Schlumberger Well Surveying Corp, 1958, Introduction to Schlumberger well logging: Schlumberger Document No. 8, 176 p.
Smith, Ollie, Jr., 1962, Ground-water resources and municipal water supplies of the High- land Rim in Tennessee: Tennessee Division of Water Resources, Water Resources Series no. 3, 257 p.
Statler, A.T., Bloss, P., and Zurawski, R.P., 1975, Subsurface information catalog of Ten- nessee 1866-1974: Tennessee Division of Geology Bulletin 76, 146 p.
Stearns, R.G., 1974, Porosity and hydrology of jointed Middle Ordovician Limestones in , the J. Percy Priest Dam area of central Tennessee: Tennessee Water Resources Research Center Report no. 33, 86 p.
Theis, C.V., 1936, Ground water in south-central Tennessee, U.S. Geological Survey Water- Supply Paper 677, 182 p.
U.S. Department of the Interior, Bureau of Mines, 1978, Minerals in the economy of Ten- nessee: U.S. Department of the Interior, Bureau of Mines, 18 p.
Wells, F.G., 1933, Ground-water resources of western Tennessee: U.S. Geological Survey Water-Supply Paper 656, 319 p.
Wiethe, J.D., and Sitterly, P.D., 1978, Recently discovered Upper Ordovician-Lower Mis- sissippian stratigraphic section in which the Chattanooga Shale is absent: Tennessee Academy Science Journal, v. 53, no. 1, p. 12-13.
Wilson, C.W., Jr., 1948, The geology of Nashville, Tennessee: Tennessee Division of Geol- ogy Bulletin 53, 172 p.
1949, Pre-Chattanooga stratigraphy in central Tennessee: Tennessee Division of Geology Bulletin 56, 407 p.
Zurawski, Ann, 1978, Summary appraisals of the nation’s ground-water resources--Tennes- see region: U.S. Geological Survey Professional Paper 813-L, 35 p.
35
AUS. GOVERNMENT PRINTING OFFICE 1986-631-262/40018