Embed Size (px)
Citation preview

FULL PAPER
Ethanol to 1,3-butadiene conversion using ZrZn-containing MgO-
SiO2 systems prepared by co-precipitation and effect of catalyst
acidity modification
Simoní Da Ros, [a,b] Matthew D. Jones, *[b] Davide Mattia, [c] Jose C. Pinto,*[a] Marcio Schwaab, [d] Fabio
B. Noronha, [e] Simon A. Kondrat, [f] Tomos C. Clarke, [f] and Stuart H. Taylor [f]
Abstract: The conversion of ethanol to 1,3-butadiene (1,3-BD) has
been investigated over ZrO2 and ZnO containing magnesia silica
oxides prepared by co-precipitation method at different Mg-to-Si molar
ratios. The effect of reaction temperature and ethanol flow rate was
investigated. The catalyst acidity was modified through the addition of
alkali metals (Na, K and Li) to the final materials. Catalysts were
characterised by nitrogen physisorption analysis, X-ray diffraction,
scanning electron microscopy with energy dispersive X-ray,
temperature programmed desorption of ammonia, infrared
spectroscopy and 29Si/(7Li) NMR spectroscopy. The catalytic results
showed that the controlled reduction of catalyst acidity allows
suppressing of ethanol dehydration, whilst increasing 1,3-BD
selectivity. The best catalytic performance achieved 72 mol % for the
combined 1,3-BD and acetaldehyde selectivity.
Introduction
1,3-butadiene (1,3-BD) is an important starting material
used as a monomer for the production of a variety of synthetic
polymers.[1] The polymerisation of 1,3-BD with itself and with other
olefin monomers represents its largest commercial use, examples
include the production of styrene-butadiene-rubber (SBR),
polybutadiene (PB), styrene-butadiene latex (SBL), acrylonitrile-
butadiene-styrene (ABS), adiponitrile, nitrile rubber (NBR),
chloroprene, styrene-butadiene block copolymers (SBS and
SEBS).[2] 1,3-BD is currently produced from naphtha steam
crackers, as a co-product of ethene manufacturing.[3,4] Besides
environmental concerns as a result of the use of petroleum-
derived hydrocarbons, the need for a new route to 1,3-BD is
further exacerbated due to the possible future shortfall in supply
due to the changes of feedstock from naphtha to ethane in the
U.S.[5,6] The catalytic conversion of ethanol into 1,3-BD is an
attractive alternative, due to the availability of bioethanol which is
expected to significantly increase over the next few years from
fermentation of sugar rich waste materials (second generation
bioethanol).[1,5,7,8] For example in Brazil alone, 23.4 billion litres of
bioethanol were produced in 2014.[9]
The route most widely accepted to account for 1,3-BD
production from ethanol involves five consecutive reactions.[10-16]
Initially, ethanol is dehydrogenated to acetaldehyde. Then, 3-
hydroxybutanal is formed from acetaldehyde self-aldolisation.
Next, 3-hydroxybutanal dehydrates to crotonaldehyde, which is
reduced (Meerwein-Ponndorf-Verley (MPV) reduction) with
ethanol to produce crotyl alcohol and acetaldehyde. Finally, crotyl
alcohol is dehydrated to afford 1,3-BD. This mechanism was
initially suggested and experimentally supported by Quattlebaum
et al.,[17] who verified that higher 1,3-BD yields were achieved
when crotonaldehyde and ethanol were used compared to a feed
comprising acetaldehyde and ethanol, with either a SiO2 based
system or Ta2O5/SiO2 catalyst. With the latter catalyst, the authors
also observed that a feed comprising of only acetaldehyde was
converted into crotonaldehyde, which was not observed in
significant quantities when ethanol and acetaldehyde were
passed over the catalyst. This suggests that crotonaldehyde was
rapidly converted into crotyl alcohol (presumably by an MPV
process) and subsequently to 1,3-BD. However, some reports
have recently ruled out the aldol condensation as the main path,
suggesting instead that crotyl alcohol is produced through the
reaction between an activated form of ethanol and
acetaldehyde.[18,19]
Due to the specific features of the catalyst that are required
for this cascade reaction, materials with multifunctional properties
have been studied, especially MgO-SiO2 systems.[2,5] This is
related to the fact that Mg-O pairs might act as Lewis acid-
Brønsted basic sites and the silanol functionality as a Brønsted
acid which are necessary for ethanol dehydrogenation,[20]
acetaldehyde condensation,[21] crotonaldehyde reduction and the
further crotyl alcohol dehydration to 1,3-BD. However, due to the
presence of acid sites in these systems, ethanol dehydration to
ethene and diethyl ether are significant competitive reactions.
Efforts have been dedicated to the design of catalysts able to
[a] S. Da Ros, Dr. J. C. Pinto
Programa de Engenharia Química/COPPE
Universidade Federal do Rio de Janeiro
Cidade Universitária-CP: 68502, 21941-972, Rio de Janeiro (Brazil)
E-mail: [email protected]
[b] Dr. M. D. Jones
Department of Chemistry
University of Bath
Claverton Down, Bath BA2 7AY (UK)
E-mail: [email protected]
[c] Dr. D. Mattia
Department of Chemical Engineering
University of Bath
Claverton Down, Bath BA2 7AY (UK)
[d] Dr. M. Schwaab
Departamento de Engenharia Química
Universidade Federal do Rio Grande do Sul, 90040040, Porto
Alegre (Brazil)
[e] Dr. F. B. Noronha
Catalysis Division
National Institute of Technology
Av. Venezuela 82, 20081-312, Rio de Janeiro (Brazil)
[f] S. A. Kondrat, Dr. T. C. Clarke, Dr. S. H. Taylor
School of Chemistry, Cardiff Catalysis Inst.
Cardiff University
CF10 3AT, Cardiff (Wales)
Supporting information for this article is given via a link at the end of
the document.

FULL PAPER
suppress these undesirable parallel reactions. For instance, the
addition of metals and/or metal oxides based on Cu, Zr, Zn and
Ag to the MgO-SiO2 system has been shown to be beneficial to
1,3-BD yield.[13,21-23,28] In particular, a synergic effect between
ZrO2 and ZnO has been demonstrated.[12,23] ZnO may support
ethanol dehydrogenation and ZrO2 is expected to assist aldol
condensation and crotonaldehyde reduction.[12,14,23,28-30]
Conversely, besides catalyst composition, the catalyst
preparation method is of paramount importance for 1,3-BD
formation, since different acid-basic features may be obtained
depending on synthesis conditions.[18,22,23,31] Due to this, it has
been reported different optimum Mg-to-Si molar ratios for 1,3-BD
formation, depending on the synthesis procedure
employed.[13,18,23]
Among the catalyst preparation procedures, different
methods have been investigated such as physical mixtures of
MgO and SiO2,[11,13] wet-kneading,[10-13,22,23] sol-gel,[18,24]
impregnation[13] and co-precipitation.[22,25,26] Whereas it has been
proven that a physical mixture between precursor oxides is not
suitable for 1,3-BD formation, since resultant catalysts show
similar features to single MgO and SiO2 phases, wet-kneading
methods have been the most widely discussed in the literature
with less attention being dedicated to sol-gel and co-precipitation
methods.[5]
In the wet-kneading preparation procedure, MgO and SiO2
are usually mixed at the desired molar ratio in the presence of
water, dried and calcined. Besides the specific features of the
MgO and SiO2 precursors employed and their molar ratio, the
amount of water, time, ageing temperature, drying and calcination
procedure represent some of the preparation steps that might
alter the catalysts behaviour.[5] As observed by EDX and TEM
analyses, materials prepared by wet-kneading are usually
inhomogeneous in their composition and morphology.[11,22,27]
They are generally constituted by ¨islands¨ of MgO and SiO2, and
a limited amount of amorphous magnesia hydrosilicate
phase.[22,27] These unique characteristics are described as the key
factor for the conversion of ethanol into 1,3-BD, since an intrinsic
basic-acid sites distribution is obtained on these materials.[22,27]
Using a sol-gel method, Ochoa et al.[18] observed that the
Mg:Si molar ratio affected the number, strength and distribution of
basic-acid sites, the surface area and the crystalline structure of
the catalysts, impacting on product distribution. A comparison
between wet-kneading and a co-precipitation method, at the
same Mg:Si ratio, has pointed to the former as more suitable for
ethanol conversion into 1,3-BD.[22,27] However, the co-
precipitation method may be an efficient preparation procedure in
order to produce catalysts with homogeneous properties
throughout their surface, therefore increasing the potential of
controlling the physical and chemical properties of the catalyst
and facilitating the determination of structure-activity-relationships.
Despite that, a rigorous study using the co-precipitation method
has not been reported.
Herein, we report for the first time an extensive investigation
using the co-precipitation method for the synthesis of magnesium
silica oxide catalysts with different Mg-to-Si (Mg:Si) molar ratios
for ethanol conversion into 1,3-BD. The materials were used as
supports for ZnO and ZrO2 doping and the Mg:Si molar ratio effect
of materials containing ZrO2 and ZnO was also evaluated. The
effect of reaction temperature and ethanol flow rate was also
studied. In particular, the ethanol flow rate was investigated in
order to assess catalyst performance regarding 1,3-BD
productivity (in gBD/gcat.h), a variable usually neglected [18,22,32,33]
that is important for industrial applications. Since it is well-known
that the acidic-basic features play a key role for this process, we
have modified the catalyst acidity through the addition alkali
metals (Na, K and Li) to the final materials. The catalyst
preparation method was further optimized by the modification of
the number of calcination steps. As a result, it is shown that the
co-precipitation method is suitable to prepare MgO-SiO2 systems
that, after ZrO2 and ZnO addition, produce 1,3-BD productivities
as high as the obtained using expensive Ag containing
systems.[2,14] Besides this, the catalyst acidity modification
through the alkali metal doping was successful for the
suppression of ethanol dehydration , allowing the combined 1,3-
BD and acetaldehyde selectivity to be increased up to 72 %.
Catalysts were characterised by nitrogen physisorption, X-ray
diffraction, scanning electron microscopy with energy
dispersive X-ray, temperature programmed desorption of
ammonia, infrared spectroscopy and 29Si/(7Li) NMR
spectroscopy.
Results and Discussion
The effect of the Mg:Si molar ratio
Magnesium silica oxide catalysts prepared at different Mg:Si
molar ratios were evaluated at 325 C, using an ethanol
weight hourly space velocity (WHSV) of 0.62 h-1. At this
condition, ethanol conversion was typically lower than 20 %,
allowing a clear observation of the different catalytic
properties among the catalysts samples.
Figure 1 shows the selectivity profile of the main carbon
containing products, obtained after 3 h of time on stream
(TOS), as a function of the Mg:Si molar ratio for (a) MgO-
SiO2 systems and (b) MgO-SiO2 systems containing a fixed
amount of ZrO2 and ZnO, which has previously shown to be
optimum for SiO2 and acts as a comparison to our previous
work.[12,23] Profiles observed for ethene, diethyl ether (DEE)
and acetaldehyde (AcH) show the same general trend as a
function of the Mg:Si molar ratio. Whereas ethene and DEE
selectivities decreased as the Mg:Si molar ratio was
increased, AcH selectivity showed a sharp increase, from
less than 10 % with the 1:1 species to over 40 % with higher
amounts of MgO. The decrease in the ethanol dehydration
along with the increase in the ethanol dehydrogenation as
the Mg:Si molar ratio was increased is in agreement with a
reduction in the catalyst acidity, as expected when the Mg:Si
increases.[10,18]
On the other hand, interestingly, the effect of the Mg:Si
molar ratio on 1,3-BD selectivity was different between MgO-
SiO2 systems and MgO-SiO2 systems containing ZrO2 and
ZnO. While a smooth rise in 1,3-BD selectivity was verified
as the Mg:Si molar ratio increased for pure MgO-SiO2
samples, Figure 1 (a), the same trend was not observed for

FULL PAPER
catalysts containing ZrO2 and ZnO, Figure 1(b). Instead, a
maximum in the 1,3-BD selectivity was obtained for the
catalyst with the Mg:Si molar ratio equal to one.
Figure 1. Mg:Si molar ratio effect on main carbon containing reaction products
for (a) MgO-SiO2 systems and (b) MgO-SiO2 systems containing ZrO2 and ZnO
(T = 325 ºC, TOS = 3 h, WHSV = 0.62 h-1, contact time = 4 s).
We have previously studied the effect of the Mg:Si
molar ratio for Zn(II) and Zr(IV) containing MgO-SiO2
systems, using the wet-kneading method in the MgO-SiO2
preparation.[12] In line with results presented in Figure 1,
MgO-SiO2 systems prepared by the wet-kneading method
have shown a different 1,3-BD selectivity behaviour upon the
addition of ZrO2:ZnO to the catalyst. However, while a
maximum in the 1,3-BD selectivity was observed at the Mg:Si
molar ratio equal to 3:1 for the pure MgO-SiO2 systems, an
increase in 1,3-BD selectivity was observed as the Mg:Si
molar ratio was increased for the systems prepared by
incipient wetness.[12] These results are in contrast with those
reported here, in Figure 1, emphasising that the co-
precipitation preparation procedure has dramatically
changed the physicochemical properties of the catalyst
compared to the wet-kneading procedure.
Regarding textural properties, samples with higher
Mg:Si molar ratio showed lower surface areas compared to
the 1:1 and 25:75 ratios, which may indicate the formation of
MgO particles in the pores of the samples, Table S1 in the
supporting information.[13,23] Diffraction patterns indicated
samples with amorphous features, the MgO periclase phase
being observed only in the MgO-SiO2-(95:5) sample (peaks
at Bragg angles of 37.0º, 43.0º, 62.4º),[2] Figure S1. In
particular, the ZrZn/MgO-SiO2-1 system presented broad
peaks (at 25-30, 33-39 and 58-62) characteristic of
magnesium silicate hydrates.[34,35] Since samples containing
ZrO2 and ZnO have shown similar pXRD patterns compared
to the initial MgO-SiO2 support, ZrO2 and ZnO should be
dispersed into the -Mg-O-Si- network or their small loading
was undetectable by pXRD. These results highlight the effect
of preparation method on catalyst properties, since MgO
phase was observed even for Mg:Si molar ratio equal to 1,
using a sol-gel technique.[18]
A clear modification of silicon environments as a
function of the Mg:Si molar ratio was suggested by 29Si{1H}
CP MAS NMR experiments, Figure S2. Catalysts with higher
amount of MgO, MgO-SiO2-(95:5) and MgO-SiO2-(75:25)
samples, presented a single resonance with maxima around
-71 ppm, indicating a high concentration of Q1 species.
Conversely, as the Mg:Si molar ratio was decreased, MgO-
SiO2-(1:1) and MgO-SiO2-(25:75) samples, resonances
maxima were shifted down field, to ca. -87 and -94 ppm,
indicating an increase in Q2 and Q3 species [2,34,36]. In
comparison with the wet-kneading method,[23] Q2 and Q3
species were observed at the Mg:Si molar ratio equal to
75:25, and Q2, Q3 and Q4 species were observed at the Mg:Si
molar ratio equal to 1. Thus, the co-precipitation method
used in this work seems to be more efficient in the formation
of Mg-O-Si linkages. These results are in agreement with a
general uniform distribution of elements inside catalyst
particles as verified for the ZrZn/MgO-SiO2-1 sample by
scanning electron microscopy with energy dispersive X-ray,
Figure S3. Even though a residual amount of Na was
observed, from catalyst preparation, as it will be more
detailed in the catalyst characterisation section, these Na
traces did not significantly affect catalyst activity.
Since the synergistic effect of ZrO2 and ZnO on the
MgO-SiO2 system was more beneficial to 1,3-BD formation
at the Mg:Si molar equal to one, this catalytic system,
labelled as ZrZn/MgO-SiO2-1, was selected for further
investigation.
Reaction temperature and WHSV effect
Initially, reaction temperature and the WHSV effect were
investigated in order to evaluate catalyst performance and afford
more insights to the kinetic mechanism. Mass transfer limitations
were excluded by the apparent activation energy estimation,[37]
Fig. S4.
The effect of reaction temperature and WHSV on ethanol
dehydration products is shown in Figure 2. It should be noted that,
in this work, higher WHSV conditions correspond to higher
ethanol molar fraction in gas phase and lower contact times.
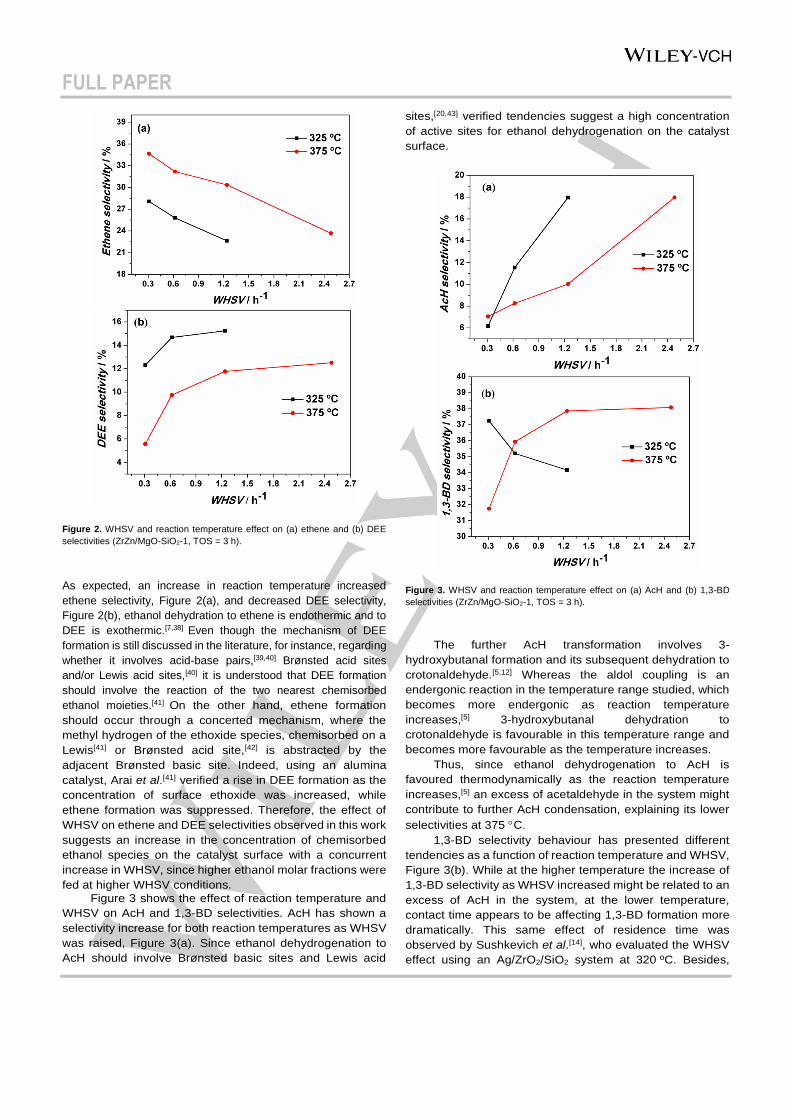
FULL PAPER
Figure 2. WHSV and reaction temperature effect on (a) ethene and (b) DEE
selectivities (ZrZn/MgO-SiO2-1, TOS = 3 h).
As expected, an increase in reaction temperature increased
ethene selectivity, Figure 2(a), and decreased DEE selectivity,
Figure 2(b), ethanol dehydration to ethene is endothermic and to
DEE is exothermic.[7,38] Even though the mechanism of DEE
formation is still discussed in the literature, for instance, regarding
whether it involves acid-base pairs,[39,40] Brønsted acid sites
and/or Lewis acid sites,[40] it is understood that DEE formation
should involve the reaction of the two nearest chemisorbed
ethanol moieties.[41] On the other hand, ethene formation
should occur through a concerted mechanism, where the
methyl hydrogen of the ethoxide species, chemisorbed on a
Lewis[41] or Brønsted acid site,[42] is abstracted by the
adjacent Brønsted basic site. Indeed, using an alumina
catalyst, Arai et al.[41] verified a rise in DEE formation as the
concentration of surface ethoxide was increased, while
ethene formation was suppressed. Therefore, the effect of
WHSV on ethene and DEE selectivities observed in this work
suggests an increase in the concentration of chemisorbed
ethanol species on the catalyst surface with a concurrent
increase in WHSV, since higher ethanol molar fractions were
fed at higher WHSV conditions.
Figure 3 shows the effect of reaction temperature and
WHSV on AcH and 1,3-BD selectivities. AcH has shown a
selectivity increase for both reaction temperatures as WHSV
was raised, Figure 3(a). Since ethanol dehydrogenation to
AcH should involve Brønsted basic sites and Lewis acid
sites,[20,43] verified tendencies suggest a high concentration
of active sites for ethanol dehydrogenation on the catalyst
surface.
Figure 3. WHSV and reaction temperature effect on (a) AcH and (b) 1,3-BD
selectivities (ZrZn/MgO-SiO2-1, TOS = 3 h).
The further AcH transformation involves 3-
hydroxybutanal formation and its subsequent dehydration to
crotonaldehyde.[5,12] Whereas the aldol coupling is an
endergonic reaction in the temperature range studied, which
becomes more endergonic as reaction temperature
increases,[5] 3-hydroxybutanal dehydration to
crotonaldehyde is favourable in this temperature range and
becomes more favourable as the temperature increases.
Thus, since ethanol dehydrogenation to AcH is
favoured thermodynamically as the reaction temperature
increases,[5] an excess of acetaldehyde in the system might
contribute to further AcH condensation, explaining its lower
selectivities at 375 C.
1,3-BD selectivity behaviour has presented different
tendencies as a function of reaction temperature and WHSV,
Figure 3(b). While at the higher temperature the increase of
1,3-BD selectivity as WHSV increased might be related to an
excess of AcH in the system, at the lower temperature,
contact time appears to be affecting 1,3-BD formation more
dramatically. This same effect of residence time was
observed by Sushkevich et al.[14], who evaluated the WHSV
effect using an Ag/ZrO2/SiO2 system at 320 ºC. Besides,

FULL PAPER
additional experiments varying the WHSV at 375ºC and
using the same ethanol molar fraction (the amount of catalyst
remained constant and the gas flow and ethanol feed rate
were both varied), indicated the same general tendency
observed at 325 ºC, Figure S4(c). This implies that the extra
ethanol present in the higher WHSV processes facilitates the
full conversion to 1,3-BD, as observed previously.[12]
Butene selectivity (1-butene, cis- and trans-2-butene)
decreased smoothly as the WHSV was increased at both
reaction temperatures, Figure 4. The formation of butene
from ethanol is thought to occur through deoxygenation of
butanal produced from crotyl alcohol isomerisation.[5] Other
studies suggest butene as a butanol dehydration product,
butanol being produced from the hydrogenation of butanal,
which in turn, might be obtained from the hydrogenation of
the C=C double bond of crotonaldehyde.[16,25] However, no
traces of butanal, or butanol were observed in this work and
butene may be a product of 1,3-BD hydrogenation. Thus, the
reduction in butene selectivity with WHSV can be explained
by a reduction of contact time of 1,3-BD in the reactor.
Figure 4. WHSV and reaction temperature effect on butene selectivity
(ZrZn/MgO-SiO2-1, TOS = 3 h).
Other minor products observed were ethane, acetone,
propene and propane, their combined selectivities have not
achieved more than 7 % in all experiments. Traces of ethyl
acetate, C5 (pentadienes and its isomers) and C6
(hexadienes) compounds were also identified in the output
stream.
Regarding ethanol conversion, an increase was
observed as reaction temperature increased, whereas an
ethanol conversion drop was observed as WHSV was raised,
Figure 5. The higher WHSV increases the ethanol molar
fraction in the gas stream, at the same time shortening
contact time, factors that might help to explain the reduced
conversion.
Figure 5. WHSV and reaction temperature effect on ethanol conversion
(ZrZn/MgO-SiO2-1, TOS = 3 h).
Figure 6 shows the effect of reaction temperature and
WHSV on the yield of the main carbon containing reaction
products. Firstly, it is worth noting that the ethanol conversion
increase resulted from the temperature rise has boosted 1,3-
BD yield from 9-16 % at 325 C to 27-30 % at 375 C, within
the same range of WHSV between 0.3 and 1.2 h-1.
Figure 6. Effect of WHSV on yield of the main carbon containing products at (a)
325 C and (b) 375 C. (ZrZn/MgO-SiO2-1, TOS = 3 h).
Moreover, even though the increase in WHSV has reduced
ethanol conversion, Figure 5, 1,3-BD yield has only reduced

FULL PAPER
slightly. Thus, a linear increase on BD productivity (in
gBD/gcat·h) was obtained with WHSV, Figure 7.
Figure 7. Effect of WHSV and reaction temperature on 1,3-BD productivity
(gBD/gcat·h) on ZrZn/MgO-SiO2-1 catalyst (TOS = 3 h).
As discussed by Makshina et al.,[13] catalytic data is
usually reported at low ethanol concentrations and 1,3-BD
productivities are usually too low to be industrially relevant.
1,3-BD productivity values achieved in this work suggest that
the ZrZn/MgO-SiO2-1 material prepared by co-precipitation
is a promising catalyst for 1,3-BD production, as it presents
high productivity with reasonable 1,3-BD selectivity, when
compared to other catalytic systems.[13,30] For instance,
Janssens et al.[2] has reported productivity equal to 0.15
gBD/gcat·h over a catalyst based on Ag/MgO-SiO2, at 400 ºC
and WHSV = 1.2 h-1. Using a lower temperature (320 ºC), but
much higher WHSV (10.3 h-1), Sushchevich et al.[14]
observed 0.23 gBD/gcat·h over a Ag/ZrO2/SiO2 system.
Based on these results, we conclude that our
ZrZn/MgO-SiO2-1 catalyst has shown suitable performance
for ethanol to 1,3-BD conversion. However, ethanol
dehydration was present in significant quantities and, thus,
we aimed to modify the acidic features of this system through
the addition of the alkali metals Na, K and Li.
Catalyst acidity modification
The effect of added Na2O content on selectivity for the main
carbon containing products is shown in Figure 8(a). The increase
in Na2O content decreased the selectivities to ethene and diethyl
ether, while increasing the selectivities to 1,3-BD and AcH.
Conversely, no significant change was observed to butene
selectivity, which fluctuated around 10 %.
A positive linear relation was verified when 1,3-BD and AcH
selectivities were considered as a function of Na2O content,
Figure 8(b), achieving 66 % to the combined 1,3-BD and AcH
selectivities for the sample with the highest Na content. Also, a
negative linear relation was obtained when ethene and DEE
selectivities were considered as a function of catalyst Na2O
content, Figure 8(b).
Figure 8. (a) Effect of catalyst Na content on the selectivity of the main
carbonaceous products and (b) selectivities comparison with ethanol
conversion. (T = 375 C, WHSV = 0.62 h-1, TOS = 3 h).
Moreover, a reduction in ethanol conversion was observed
as a function of Na content, Figure 8(b), resulting in lower 1,3-BD
yields and productivities, Table 1, entries 1-4. These tendencies
were confirmed using a lower WHSV equal to 0.3 h-1, entries 5-7,
Table 1. However, it should be emphasised that avoiding ethanol
dehydration is the most important step to attain high 1,3-BD
yields, since ethene is the most thermodynamically stable
product.[5] The thermodynamics of the reaction mixture in the case
where ethanol dehydration occurs together with ethanol to 1,3-BD
conversion was discussed by Makshina et al.,[5] who have shown
that the thermodynamic yield of 1,3-BD is considerably lower
when ethanol dehydration is present.
The suppression of acid sites through Na doping was
recently studied on ZnxZryOz mixed metal oxides in the
ethanol to 1,3-BD conversion.[30] An increase in the AcH and
1,3-BD selectivity and a decrease in ethene selectivity were
observed for Na2O containing samples. The catalytic results
were rationalised through a reduction in the number of strong
acid sites due to Na doping, which was verified by
temperature programmed desorption of ammonia (NH3-
TPD).
.

FULL PAPER
Table 1. Catalytic results for 3 h of time on stream and reaction temperature equal to 375 C.
Entry Catalyst WHSV X (%)
Selectivity (mol%) 1,3-BD yield[d]
(mol%)
1,3-BD productivity (gBD/gcat·h) 1,3-BD AcH Ethene DEE Butene
1 ZrZn/MgO-SiO2-1 0.62 40 35.9 8.3 32.2 9.8 9.2 30.4 0.13
2 0.8-Na/ZrZn/MgO-SiO2-1 0.62 26 39.1 14.2 22.9 5.1 11.5 18.1 0.08
3 1.2-Na/ZrZn/MgO-SiO2-1 0.62 24 46.5 13.1 18.7 4.6 10.9 17.3 0.07
4 2-Na/ZrZn/MgO-SiO2-1 0.62 24 48.5 17.3 15.5 3.6 9.8 13.7 0.06
5 ZrZn/MgO-SiO2-1 0.31 52 31.8 7.0 34.7 5.6 14.6 27.6 0.06
6 1.2-Na/ZrZn/MgO-SiO2-1 0.31 35 49.3 11.8 16.3 4.4 12.4 25.4 0.05
7 2-Na/ZrZn/MgO-SiO2-1 0.31 36 50.6 16.9 13.8 3.4 9.9 17.4 0.03
8 Water/ZrZn/MgO-SiO2-1 0.62 46 32.5 6.6 34.9 10.4 10.6 26.8 0.11
9[a] 1.2-Na/ZrZn/MgO-SiO2-1 0.62 28 52.2 20.0 10.5 2.7 10.2 19.6 0.09
10[b] ZrZn/MgO-SiO2-1 0.62 32[c] 44.6 8.2 24.2 6.6 10.8 41.4 0.17
11[a,b] 1.2-Na/ZrZn/MgO-SiO2-1 0.62 6.9[c] 44.7 34.1 5.8 1.2 9.9 25.4 0.10
12 1.2-K/ZrZn/MgO-SiO2-1 0.62 22 51.6 13.7 17.4 5.2 7.5 21.1 0.09
13 1.2-Li/ZrZn/MgO-SiO2-1 0.62 18 44.3 20.5 16.2 4.4 8.7 11.4 0.05
14[d] ZrZn/MgO-SiO2-1 0.62 44 26.2 6.3 43.6 12.7 7.5 24.6 0.11
15[a,e] 1.2-Na/ZrZn/MgO-SiO2-1 0.62 19 49.5 22.8 11.3 3.2 9.0 22.2 0.10
16[a,e] 1.2-K/ZrZn/MgO-SiO2-1 0.62 26 55.1 17.1 12.2 3.5 7.9 27.1 0.12
17[a,e] 1.2-Li/ZrZn/MgO-SiO2-1 0.62 19 47.7 17.0 13.4 2.6 13.7 15.9 0.07
18[a,e]* 1.2-K/ZrZn/MgO-SiO2-1 0.31* 44 57.8 12.9 10.3 2.5 10.3 37.2 0.07
19[a,e]* 1.2-K/ZrZn/MgO-SiO2-1 0.62* 35 55.9 19.2 10.2 2.78 7.5 20.1 0.09
20[a,e]* 1.2-K/ZrZn/MgO-SiO2-1 1.24* 26 44.6 30.9 7.5 2.36 5.0 13.1 0.12
[a] No calcination after alkali metal doping. [b] Acetaldehyde in the feed (8:2 ethanol to AcH feed ratio). [c] Acetaldehyde conversion was not calculated. [d] Calculated with Equation 3. [e] No calcination before Zr and Zn addition. *Ethanol molar fraction was kept equal to 0.4.
In this work, catalysts acidity of samples was investigated
through ammonia adsorption followed by TPD experiments
and IR measurements. Gases released during TPD
experiments were monitored by MS, Figure S5. A dramatic
reduction in the m/z signal attributed to NH3, from the
ZrZn/MgO-SiO2-1 system to samples impregnated with
sodium, was verified, indicating a large reduction in the
number of acidic sites. A minor reduction in the number of
acidic sites as the quantity of sodium was increased in the
samples was also indicated by NH3-TPD experiments, Table
S2. Furthermore, sodium containing samples presented
peaks with maximum intensity at temperature around 380 ºC,
Figure S5(b), whilst the ZrZn/MgO-SiO2-1 system exhibited
peak maximum intensity around 520 ºC. Therefore, the
addition of sodium resulted in a reduction on the
concentration and strength of the acid sites.
IR measurements after NH3 adsorption supported NH3-
TPD conclusions, presenting a clear reduction in the NH3
stretching intensity as Na content was increased in the
samples, Figure S6. In particular, a weaker NH3 signal was
observed for the precursor MgO-SiO2-1 material, indicating
that the ZrO2 and ZnO addition increased the acidity from the
MgO-SiO2-1 to the ZrZn/MgO-SiO2-1 system. Thus, the
sodium addition should have deactivated Lewis acid sites
associated to ZrO2 and ZnO, as it will be more discussed
later, contributing to the reduction of the ethanol dehydrated
fraction and ethanol conversion.
As expected, however, besides acidity, the sodium
addition modified samples textural properties as well. While
no significant change on pore structure was indicated by N2
adsorption-desorption isotherms, Figure S7, surface area
reduced with Na content, Table S3, probably due to Na2O
particles formation in the catalyst pores.[13,23] Thus, the
ethanol conversion reduction should be associated, mainly,
to the deactivation of acid sites and to the smaller access to
active sites as a result of surface area reduction.
The Na2O effect on the catalytic properties was
confirmed by an additional experiment where the process of
Na addition was imitated using only water, entry 8, Table 1.
The catalytic performance was similar to the obtained for the
ZrZn/MgO-SiO2-1 (entry 1, Table 1) system. Thus, the
additional calcination step involved in the Na addition
process, which is illustrated in the Figure S8 as Calcination
3, did not appear to have affected catalyst activity, and
therefore, the effect of removal of this calcination step was
investigated, entry 9, Table 1. A slight increase in the 1,3-BD
selectivity, yield and productivity (compare entries 3 and 9)
was obtained. However, there is a difference in the surface

FULL PAPER
area, (219 vs 333 m²/g) of the two materials, which may
contribute to the difference in performance.
In an attempt to further improve the catalytic data, the
effect of acetaldehyde in the feed was evaluated using an
ethanol-to-acetaldehyde feed ratio equal to 8:2, since this
condition has resulted in better catalytic performances in
previous literature.[12] Catalytic data is shown in Table 1
(entries 10-11). As expected, the addition of AcH in the feed
increased the amount of 1,3-BD produced (compare yields
and productivities between entries 1 and 10, and between
entries 9 and 11, Table 1). Moreover, ethanol dehydration to
ethene and DEE was further suppressed upon AcH addition,
this suppression being more pronounced for the catalyst
containing Na2O.
The acidity modification of the ZrZn/MgO-SiO2-1
system was also investigated using two other alkali metals,
K and Li, entries 12 and 13, Table 1. Both systems were
effective in the suppression of ethanol dehydration,
presenting lower selectivities to ethene and DEE compared
to the starting ZrZn/MgO-SiO2-1 material. A similar catalytic
performance was observed between samples doped with Na
and K (compare entry 3 and 12). Conversely, 1.2-
Li/ZrZn/MgO-SiO2-1 sample presented a lower 1,3-BD yield
and productivity, which is in line with its lower BET surface
area, equal to 81 m²/g, compared to the surface area of 1.2-
Na/ZrZn/MgO-SiO2-1 and 1.2-K/ZrZn/MgO-SiO2-1 samples,
equal to 219 and 243 m²/g, respectively.
Finally, the effect of calcination step removal before Zr
and Zn addition was investigated, entries 14-17. The
removed calcination step is illustrated in the Figure S8 as
Calcination 1. Regarding the ZrZn/MgO-SiO2-1 system, a
slight enhancement of ethene and diethyl ether selectivities
was observed upon the removal of the calcination step
(compare entry 1 and 14, Table 1), suggesting an increase
in the acidity of the catalyst and/or an improvement in the
access to active acid sites, since the BET surface area
changed from 323 to 416 m²/g for the ZrZn/MgO-SiO2-1
system prepared with and without the calcination step before
Zr and Zn addition, respectively. For samples containing
Na2O, K2O and Li2O, the removal of calcination step was
beneficial to 1,3-BD yield and productivity (compare entries
3 and 15 for Na2O, entries 12 and 16 for K2O, and 13 and 17
for Li2O containing samples). As observed for the ZrZn/MgO-
SiO2-1 system, 1.2-K/ZrZn/MgO-SiO2-1 and 1.2-
Li/ZrZn/MgO-SiO2-1 samples also presented an increase on
surface area as a result of initial calcination step removal,
Table S4.
These results suggest a clear relationship among 1,3-
BD formation, acidic-basic concentration and its distribution
on catalyst surface, since 1,3-BD yield and productivity were
strongly correlated with catalyst surface area for samples
containing alkali metals, Figure 9.
The effect of calcination steps removal was further
investigated through 7Li MAS NMR spectroscopy. Figure
S9(a) shows spectra for samples 1.2-Li/ZrZn/MgO-SiO2-1
and 1.2-Li/ZrZn/MgO-SiO2-1 prepared with only 1 calcination
step after ZrO2 and ZnO addition. Even though a similar
chemical shift was observed between the samples, the
different lineshape, broader in the half width for the sample
with higher number of calcination steps, Figure S9(b), and
the different intensities of the spinning sideband distribution
indicated a modification in the local environment of the
lithium nuclei. Thus, the reduction of the calcination steps
number, besides largely affecting surface area, in agreement
with other studies,[44] also produces different structural
ordering between samples.
Figure 9. Relationship between surface area, 1,3-BD yield (left) and 1,3-
BD productivity (right) for 1.2-Na/ZrZn/MgO-SiO2-1, 1.2-K/ZrZn/MgO-SiO2-1 and 1.2-Li/ZrZn/MgO-SiO2-1 samples. Reactions performed as entries 3, 12, 13, 15-17, Table 1.
The catalyst 1.2-K/ZrZn/MgO-SiO2-1 was further
investigated regarding WHSV effects, entries 18-20, Table 1.
A similar kinetic behaviour to the ZrZn/MgO-SiO2-1 system
at 325 ºC was observed, since higher contact times (obtained
at lower WHSVs) were beneficial to 1,3-BD selectivity and
yield.
Therefore, the acidity modification of the ZrZn/MgO-
SiO2-1 system prepared by co-precipitation, through the
addition the alkali metals, specially using K2O, seems to be
a promising - and cheap - catalyst preparation method in
order to maximize the 1,3-BD formation from ethanol
conversion. Firstly, ethanol dehydration might be avoided,
which is a thermodynamic requirement to achieve higher 1,3-
BD yield. Besides, unconverted ethanol and acetaldehyde
produced might be recycled in process, overcoming the
lower ethanol conversion obtained with these systems.
Catalyst characterisation
The elemental dispersion of selected samples at specific
locations on the catalyst particles was investigated through
scanning electron microscopy with energy dispersive X-ray
analysis. Table 2 shows average values determined. A
general uniform distribution of Mg, Si, Zr, Zn and Na was
observed.

FULL PAPER
Table 2. Elemental dispersion of catalyst samples in weight %.[a]
Sample Mg Si Zr Zn Na
ZrZn/MgO-SiO2-1 32.1 ± 0.5 59.6 ± 2.2 6.3 ± 2.0 1.4 ± 0.4 0.6 ± 0.2 0.8-Na/ZrZn/MgO-SiO2-1 31.8 ± 1.0 56.7 ± 2.0 7.6 ± 2.5 1.7 ± 0.4 2.2 ± 0.2 1.2-Na/ZrZn/MgO-SiO2-1 31.5 ± 0.9 55.8 ± 0.5 7.2 ± 0.3 1.9 ± 0.6 3.7 ± 0.5 2-Na/ZrZn/MgO-SiO2-1 31.8 ± 0.4 56.7 ± 0.5 6.5 ± 0.7 1.9 ± 0.3 3.2 ± 0.1
[a] Values of Mg, Si, Zr, Zn and Na were normalised to 100 and represent a dispersion measure
only.
However, a higher measurement scattering was observed for
Zr, Zn and Na (compare standard deviations, Table 2), which
may be due to a less uniform distribution of these compounds
and/or related to a lower analysis sensitivity associated to the
smaller concentration of these species. Moreover, the Na
doping was confirmed by analyses, which highlight the
different Na2O content among samples. The residual amount
of Na observed in the ZrZn/MgO-SiO2-1 catalyst might be a
result of an incomplete removal of Na during catalyst
washing.
Element distribution of catalysts surface was further
evaluated through EDX mapping analysis. Figure 10 shows
element distribution for the 1.2-Na/ZrZn/MgO-SiO2-1
catalyst, emphasising the homogeneous chemical
distribution of elements.
Figure 10. Elemental mapping of the 1.2-Na/ZrZn/MgO-SiO2-1 catalyst.
Element distribution for samples 0.8-Na/ZrZn/MgO-
SiO2-1 and 2-Na/ZrZn/MgO-SiO2-1 is shown in the Figures
S10-S11. The dispersion homogeneity was further verified
by an additional analysis using a higher magnification, Figure
S12.
The metal loadings were confirmed by ICP-OES. Na
loadings of 0.98 and 1.96, Zn loadings of 0.39 and 0.37, and
Zr loadings of 1.13 and 1.07 % (wt.) were observed for
samples 1.2-Na/ZrZn/MgO-SiO2-1 and 2-Na/ZrZn/MgO-
SiO2-1, respectively.
Figure S13 shows the pXRD patterns for MgO-SiO2 and
the metal doped variants. Similar pXRD patterns were
observed for K2O and Li2O containing samples, Figure S14,
for the 1.2-Na/ZrZn/MgO-SiO2-1 sample prepared with no
calcination after Na doping, Figure S15, and for samples
prepared with no calcination step before Zr and Zn addition,
Figure S16. Thus, samples presented a common amorphous
structure with the three broad peaks (at 25-30, 33-39 and
58-62) characteristic of magnesium silicate hydrates.[34,35]
The local environment of the silicon atoms on the
catalyst surface was investigated through 29Si MAS NMR
spectroscopy, Figure S17. Figure S17(a) shows spectra for
catalysts i) MgO-SiO2-1, ii) ZrZn/MgO-SiO2-1, iii) 0.8-
Na/ZrZn/MgO-SiO2-1, iv) 1.2-Na/ZrZn/MgO-SiO2-1 and v) 2-
Na/ZrZn/MgO-SiO2-1. Spectra are in agreement with pXRD
patterns, the two broad resonances with maxima around -87
and -95 ppm suggest the presence of -Mg-O-Si- linkages.
Moreover, the lack of signal at -110 indicates the absence of
silica in the catalyst structure, or the presence of an amount
too small to be detected.[34] Similar signals with chemical shift
between -85 and -89 ppm and between -92 and -99 ppm
were already reported for magnesium silicate systems and
they were attributed to Q2 and Q3 species, respectively, as
Si*(OMg)(OSi)2(OH) and Si*(OMg)(OSi)3.[2,34,36] 29Si MAS
spectra were confirmed by cross-polarization (CP)
experiments, Figure S17(b). A shoulder at ca. -80 ppm was
observed for all samples, which might be related to Q1
species. 29Si MAS spectra were fitted by a function containing
two Gaussians in order to compute spectra areas and obtain
the relative proportion of each silicon environment, the data
being summarised in Table 3. Only subtle differences were
Mg Si
Zr Na
Zn

FULL PAPER
observed between the relative proportion of Q2 and Q3
species, which are probably due to the intrinsic experimental
analysis fluctuation. This data indicates that catalytic results
are not explained through the interaction of Na species with
surface Brønsted acidic silanols moieties.
Table 3. Summary of 29Si MAS NMR data. Numbers represent the relative
proportion of each silicon environment.
Catalyst sample Q2
(-87 ppm)
Q3
(-95 ppm)
i) MgO-SiO2-1 21.9 78.1
ii) ZrZn/MgO-SiO2-1 27.4 72.6
iii) 0.8-Na/ZrZn/MgO-SiO2-1 28.6 71.4
iv) 1.2-Na/ZrZn/MgO-SiO2-1 27.0 73.0
v) 2-Na/ZrZn/MgO-SiO2-1 26.3 73.7
Furthermore, basicity features of catalyst samples were
investigated through IR measurements from CHCl3
adsorption,[45,46] Figure S18. Subtle differences in the CHCl3
stretching intensities were observed among samples. A
comparison with MgO suggested that samples containing
higher alkali metal content (1.2 and 2 % (wt.)) may have a
slightly higher basicity compared to the precursor MgO-SiO2
and the ZrZn/MgO-SiO2 system.
Therefore, the main effect of alkali metals doping may be
related to their interaction with Lewis acid sites associated to
ZrO2 and ZnO species, as also suggested by NH3-TPD
experiments and IR measurements from NH3 adsorption.
Conclusions
In this work, the effect of the Mg-to-Si molar ratio was
investigated in the synthesis of magnesia silicate oxides
prepared by co-precipitation for the ethanol to 1,3-butadiene
conversion. Catalysts were used as support for ZrO2 and
ZnO and ethanol conversion was studied in a wide range of
WHSVs using two reaction temperatures. 29Si MAS NMR
data suggested that the co-precipitation method was more
efficient in the formation of Mg-O-Si linkages, compared to
the traditional wet-kneading. The Mg:Si molar ratio equal to
1 was more suitable to 1,3-BD formation, while higher Mg:Si
molar ratios produced more acetaldehyde. High 1,3-BD
productivities (in gBD/gcat·h) were obtained with the
ZrZn/MgO-SiO2-1 system, results that might be associated
to the homogeneity of the catalyst properties. Catalytic
results supported the usual kinetic route of ethanol to 1,3-BD
conversion involving acetaldehyde condensation. The
catalyst acidity was modified through the addition of alkali
metals (Me = Na, Li and K) to the final materials. This process
resulted in a decrease of the fraction of ethanol dehydrated,
boosting 1,3-BD selectivity. A positive linear relation was
obtained for the combined 1,3-BD and acetaldehyde
selectivities as a function of the catalyst Na content. Further
catalyst optimization was performed through the reduction of
calcination steps in the catalyst preparation, resulting in
higher surface areas, 1,3-BD yields and productivities. In
particular, a strong correlation between surface area, 1,3-BD
yield and productivity was observed for 1.2-Me/ZrZn/MgO-
SiO2-1 samples. Thus, efforts should be dedicated in order
to increase surface area of these systems, keeping the acid-
basic distribution constant. The best catalytic results were
obtained with the 1.2-K/ZrZn/MgO-SiO2-1 material,
achieving 72 mol% for the combined selectivity of 1,3-BD
and acetaldehyde, at reasonable 1,3-BD yield and
productivity level. Therefore, since unconverted ethanol and
acetaldehyde may easily be recycled in the process, the x-
K/ZrZn/MgO-SiO2-1 system prepared by co-precipitation is a
promising material that deserves more investigation in order
to maximize 1,3-BD production. Catalyst acidity modification
was further confirmed by NH3-TPD and IR measurements
from NH3 adsorption, but 29Si MAS NMR data indicated that
the role of the alkali metal in the catalyst structure was not
related to its interaction with Brønsted acidic silanols
moieties. Since IR measurements from CHCl3 adsorption
indicated only subtle differences between catalysts basicity,
the main effect of alkali metal doping should be associated
to a selective deactivation of Lewis acid sites related to ZrO2
and ZnO.
Experimental Section
Catalyst preparation
In a typical synthesis, catalysts at the Mg:Si molar ratio equal to
25:75, 50:50, 75:25 and 95:5 were prepared by co-precipitation. For
the 50:50 material, 9.01 g of SiO2 (Sigma-Aldrich (SA), 99.8 %) was
dissolved in 100 mL of 1.2 M NaOH solution (SA, 99 %). The mixture
was heated between 60 and 80 C under vigorous stirring until
complete SiO2 dissolution, the solution was cooled and 42.4 g of
Na2CO3 (SA, 99.9 %) added. A Mg(NO3)2·6H2O solution (SA, 99 %)
was added drop-wise into this mixture whilst stirring at 25 C (38.85
g of Mg(NO3)2·6H2O in 200 mL). The pH was maintained at 10.5 by
adding appropriate quantities of 1.2 M NaOH solution and, at the end
of the process, the solution volume was adjusted to 600 mL with
deionized water. The resultant mixture was stirred for 2 h before
ageing for 22 h at 25 C. Finally, the mixture was filtered and washed
with 7.5 L of hot water. The precipitate was dried in static air at 80 C
for 24 h before grinding. Materials were calcined in air at 500 C for
4 h, using a heating rate of 5 C/min.
In order to produce materials with 1.5 %, 0.5 % weight of Zr(IV)
and Zn(II), respectively, 0.57 g of ZrO(NO3)2·H2O (SA, 99 %) and
0.24 g of Zn(NO3)2·6H2O (SA, 98 %) were dissolved in 50 mL of
water, and the solution was added to 10 g of the MgO-SiO2 system.
This was stirred until the mixture was completely dry. Finally, the solid
was calcined in air at 500 C for 5 h. For the Na doping, the
appropriate volume of 1.2 M NaOH solution was added to the final
catalyst drop-wise. The mixture was kept under stirring during 1 h at
25 C before drying at 80 C for 5.5 h and finally calcined at the same
previous condition. KOH (SA, 90 %) and LiOH·H2O (Alfa Aesar,
99 %) were used instead of NaOH for comparison. The catalyst
preparation procedure is illustrated in the Scheme 1 in the Support

FULL PAPER
Information (SI). Samples were labelled as y-Me/ZrZn/MgO-SiO2-x,
where y denotes the content of the alkali metal Me in weight % and
x represents the Mg:Si molar ratio.
Catalyst Characterisation
SEM images and SEM/EDX mapping were carried out on a
JEOL6480LV at 5-25 kV. Energy-dispersive X-ray spectroscopy
(EDX) was carried out in-situ during SEM analysis. At least 5 different
spots were selected throughout the images, to evaluate the
homogeneity of elements within catalyst particles. Measurements of
static adsorption of N2 at -196 C were obtained using a Micromeritics
3Flex instrument. Samples were degassed at 150 C under vacuum
for 2 h prior to analysis. Powder X-ray diffraction (PXRD) was
performed on a BRUKER D8-Advance diffractometer using CuKα (
= 1.5406 Å) radiation. Intensities were measured with a 0.02 step
size and a measuring time of 0.3 s per point. 29Si solid-state MAS
NMR was performed using a Varian VNMRS 400 MHz spectrometer,
operating at a resonance frequency of 79.44 MHz with a spinning
rate of 6 kHz. 1,000 scans were accumulated with a recycle time of
60 s, the pulse length being 4.5 μs. The 29Si{1H} CP MAS NMR
spectra were recorded on the same spectrometer. 4,000 scans were
accumulated with a recycle time of 1 s. The CP contact time was 3.0
ms. The 29Si chemical shifts are referenced to tetramethylsilane.
Acidity of samples were determined by temperature programmed
desorption of ammonia (NH3-TPD) in a Setsys Evolution TGA
Setaram system coupled with an in-line mass spectrometer,
OmniStar™ Pfeiffer Vacuum Quadrupole, for measurement of the
outgas composition. The release of ammonia (m/z=15) was
monitored. The signal m/z equal to 15 was used in order to avoid
interference by the fragmentation of water molecules. Samples were
exposed to NH3 for 48 h at room temperature before TPD
experiment. Pure argon, 100 mL/min, was used as sweep gas.
Before starting the analysis, the analytical chamber was purged from
ambient air using argon flow at 200 mL/min for 40 min. The NH3-TPD
analyses were started by heating the sample at 10 °C/min from room
temperature to 700 °C and maintaining that temperature for 0.5 h,
under argon. In situ IR spectra were recorded on a PerkinElmer
Frontier spectrometer. Measurements were performed accumulating
15-30 scans at a resolution of 4 cm-1. CHCl3 was used as a molecular
probe for basicity evaluation.[45] Samples were exposed to CHCl3 at
20 ºC. MgO (Sigma-Aldrich) was evaluated for comparison.
Catalytic reactions
The catalytic tests were carried out in a flow quartz packed-bed
reactor at atmospheric pressure. Argon was used as carrier gas (8
ml/min). The ethanol weight hourly space velocity (WHSV) was
varied within 0.3-2.4 h-1 through the modification of ethanol flow rate,
keeping catalyst mass and carrier gas flow rate fixed. The WHSV
range investigated corresponded to ethanol molar fractions between
0.41 and 0.85. The contact time (calculated as the ratio between the
catalyst volume and the total gas flow at the reaction temperature)
ranged from 1.3 to 5.5 sec. Reaction temperature was within 325-
375 C. The exhaust gases were analysed after 3 h of time on stream
(TOS) via GC-MS on an Agilent 7890A instrument with a HP-
PLOT/Q, 30 m long 0.53 mm diameter column equipped with FID/MS
detectors. The GC was calibrated as detailed elsewhere.[13] Carbon
balances were typically better than 80 %. Carbon balances and
reaction conditions are summarized in the Table S5.
Ethanol conversion (X), selectivity (S) and yield were computed
as Equation 1, 2 and 3, respectively, where NEtOH,in and NEtOH,out
represent the number of mols of ethanol that were added and
collected, respectively, Ni denotes the number of mols of the product
i, NP is the total number of products and r is the ratio between the
number of carbons of the product i and of ethanol. For 1,3-BD, for
instance, r is equal to 2.
𝑿(%) =𝐍𝐄𝐭𝐎𝐇,𝐢𝐧− 𝐍𝐄𝐭𝐎𝐇,𝐨𝐮𝐭
𝐍𝐄𝐭𝐎𝐇,𝐢𝐧∙ 𝟏𝟎𝟎 (1)
𝑺𝒊(%) =𝐍𝐢
∑ 𝐍𝐢𝑵𝑷𝒊=𝟏
∙ 𝟏𝟎𝟎 (2)
𝒚𝒊𝒆𝒍𝒅(%) =𝐫∙𝐍𝐢
𝐍𝐄𝐭𝐎𝐇,𝐢𝐧∙ 𝟏𝟎𝟎 (3)
Acknowledgements
The authors thank CNPq (Conselho Nacional de
Desenvolvimento Científico e Tecnológico, Brazil) for
supporting this research and providing scholarships. We
wish to thank the EPSRC Solid-state NMR facility in Durham
(Dr David Apperley). We thank the Universities of Bath and
Cardiff for involvement in the GW4 partnership.
Keywords: green chemistry • heterogeneous catalysis • ethanol •
1,3-butadiene • silica-magnesia catalyst
[1] D. Cespi, F. Passarini, I. Vassura, F. Cavani, Green Chem. 2015, 18,
1625-1638.
[2] W. Janssens, E. V. Makshina, P. Vanelderen, F. De Clippel, K.
Houthoofd, S. Kerkhofs, J. A. Martens, P.A. Jacobs, B. F. Sels,
ChemSusChem 2015, 8, 994-1008.
[3] W. C. White, Chem. Biol. Interact. 2007, 166, 10-14.
[4] G. Odian. Principles of polymerization, fourth ed., John Wiley & Sons,
Inc., New York, 2004, pp. 529-533.
[5] E. V. Makshina, M. Dusselier, W. Janssens, J. Degrève, P. A. Jacobs, B.
F. Sels, Chem. Soc. Rev. 2014, 43, 7917-7953.
[6] P. C. A. Bruijnincx, B. M. Weckhuysen, Angew. Chem. Int. Ed. 2013, 52,
11980-11987.
[7] C. Angelici, B. M. Weckhuysen, P. C. A. Bruijnincx, ChemSusChem 2013,
6, 1595-1614.
[8] J. A. Posada, A. D. Patel, A. Roes, K. Blok, A. P. C. Faaij and M. K. Patel,
Bioresour. Technol. 2013, 135, 490-499.
[9] http://www.afdc.energy.gov/data/10331, 2016.
[10] H. Niiyama, S. Morii, E. Echigoya, Bull. Chem. Soc. Jpn. 1972, 45, 655-
659.
[11] S. Kvisle, A. Aguero, R.P.A. Sneeden, Appl. Catal. 1988, 43, 117-131.
[12] M. D. Jones, C. G. Keir, C. Di Iulio, R. A. M. Robertson, C. V. Williams,
D. C. Apperley, Catal. Sci. Technol. 2011, 1, 267-272.
[13] E. V. Makshina, W. Janssens, B. F. Sels, P. A. Jacobs, Catal. Today.
2012, 198, 338-344.
[14] V. L. Sushkevich, I. I. Ivanova, V. V Ordomsky, E. Taarning,
ChemSusChem 2014, 7, 2527-2536.
[15] M. Gao, Z. Liu, M. Zhang, L. Tong, Catal. Lett., 2014, 144, 2071-2079.
[16] V. L. Sushkevich, I. I. Ivanova, E. Taarning, Green Chem. 2015, 17,
2552-2559.
[17] W. M. Quattlebaum, W. J. Toussaint and J. T. Dunn, J. Am. Chem. Soc.
1947, 69, 593.
[18] J. V. Ochoa, C. Bandinelli, O. Vozniuk, Green Chem. 2015, 18, 1653-
1663.
[19] A. Chieregato, J. Velasquez Ochoa, C. Bandinelli, G. Fornasari, F.
Cavani, M. Mella, ChemSusChem 2015, 8, 377-388.

FULL PAPER
[20] J. I. Di Cosimo, V. K. Diez, M. Xu, E. Iglesia, C.R. Apesteguía, J. Catal.
1998, 178, 499-510.
[21] V. V. Ordomsky, V. L. Sushkevich, I. I. Ivanova, J. Mol. Catal. A: Chem.
2010, 333, 85-93.
[22] C. Angelici, M. E. Z. Velthoen, B. M. Weckhuysen, P. C. A. Bruijnincx,
ChemSusChem 2014, 7, 2505-2515.
[23] M. Lewandowski, G. S. Babu, M. Vezzoli, M. D. Jones, R. E. Owen, D.
Mattia, P. Plucinski, E. Mikolajska, A. Ochenduszko, D. C. Apperley,
Catal. Commun. 2014, 49, 25-28.
[24] Z. Han, X. Li, M. Zhang, Z. Liu, M. Gao, RSC Adv. 2015, 5, 103982-
103988.
[25] M. León, E. Díaz, S. Ordóñez, Catal. Today 2011, 164, 436-442.
[26] M. León, E. Díaz, A. Vega, S. Ordóñez, A. Auroux, Appl. Catal., B 2011,
102, 590-599.
[27] C. Angelici, M. E. Z. Velthoen, B. M. Weckhuysen and P. C. A. Bruijnincx,
Catal. Sci. Technol. 2015, 5, 2869-2879.
[28] O. V. Larina, P. I. Kyriienko and S. O. Soloviev, Catal. Lett. 2015, 145,
1162-1168.
[29] Y. Sekiguchi, S. Akiyama, W. Urakawa, T. Koyama, A. Miyaji, K.
Motokura and T. Baba, Catal. Commun. 2015, 68, 20-24.
[30] R. A. L. Baylon, J. Sun and Y. Wang, Catal. Today 2016, 259, 446-452.
[31] T. D. Baerdemaeker, M. Feyen, U. Müller, B. Yilmaz, F.-S. Xiao, W. Zhang,
T. Yokoi, X. Bao, H. Gies, D. E. De Vos, ACS Catal. 2015, 5, 3392-3397.
[32] A. Klein, K. Keisers, R. Palkovits, Appl. Catal., A 2016, 514, 192-202.
[33] H.-J. Chae, T.-W. Kim, Y.-K. Moon, H.-K. Kim, K.-E. Jeong, C.-U. Kim,
S.-Y. Jeong, Appl. Catal., A 2014, 150-151, 596-604.
[34] D. R. M. Brew and F.P. Glasser, Cem. Concr. Res. 2005, 35, 85-98.
[35] Z. Li, T. Zhang, J. Hu, Y. Tang, Y. Niu, J. Wei and Q. Yu, Constr. Build.
Mater. 2014, 61, 252-259.
[36] J. S. Hartman and R. L. Millard, Phys. Chem. Minerals 1990, 17, 1-8.
[37] C. Perego and S. Peratello, Catal. Today 1999, 52, 133-145.
[38] H. Knözinger and R. Köhne, J. Catal. 1966, 5, 264-270.
[39] J. R. Jain and C. N. Pillai, J. Catal. 1967, 9, 322-330.
[40] B. Shi and B. H. Davis, J. Catal. 1995, 157, 359-367.
[41] H. Arai, J.-I. Take, Y. Saito and Y. Yoneda , J. Catal. 1967, 9, 146-153.
[42] H. Knözinger, H. Bühl and K. Kochloefl, J. Catal. 1972, 24, 57-68.
[43] V. Gruver, A. Sun and J. J. Fripiat, Catal. Lett. 1995, 34, 359-364.
[44] S. Da Ros, E. Barbosa-Coutinho, M. Schwaab, V. Calsavara and N. R.
C. Fernandes-Machado, Mater. Charact. 2013, 80, 50-61.
[45] M. Tamura, K.-I. Shimizu, A. Satsuma, Appl. Catal., A 2012, 433-434,
135-145.
[46] S. Huber, H. Knözinger, J. Mol. Catal. A: Chem. 1999, 141, 117-127.

FULL PAPER
FULL PAPER
Ethanol to 1,3-butadiene: The
catalyst acidity role of ZrZn containing silica magnesia oxides prepared by co-precipitation method has been investigated. Catalyst acidity control is the key step in order to increase butadiene selectivity.
S. Da Ros, M. D. Jones,* D. Mattia, J. C.
Pinto, M. Schwaab, F. B. Noronha, S. A.
Kondrat, T. C. Clarke, S. H. Taylor
Page 1. – Page 12.
Title Ethanol to 1,3-butadiene
conversion using ZrZn-containing
MgO-SiO2 systems prepared by co-
precipitation: effect of catalyst acidity
modification
Key words: Ethanol, butadiene, heterogeneous catalysis