Embed Size (px)
Citation preview
FulFilling AmericA’s P r o m i s e :
ideas to expand opportunity and revitalize our democracy
ADēmos Policy Briefing BookA Network for Ideas & Action
2006-2007

Stephen B. Heintz, Board Chair Rockefeller Brothers Fund
Ben Binswanger The Case Foundation
Christine Chen APIA Vote
Robert Franklin Emory University
Jehmu Greene Project Vote
Amy Hanauer Policy Matters Ohio
Sara Horowitz Working Today
Eric Liu Author and Educator
Clarissa Martinez De Castro National Council of La Raza
Arnie Miller Isaacson Miller
Spencer Overton The George Washington University School of Law
Wendy Puriefoy Public Education Network
Miles Rapoport President, Dēmos
David Skaggs Center for Democracy and Citizenship
Ernest Tollerson Partnership for New York City
Amelia Warren Tyagi Business Talent Group
Ruth Wooden Public Agenda
Charles R. Halpern **Founding Board Chair Emeritus Visiting Scholar, University of California Law School, Berkeley
Affiliations are listed for identification purposes only.
As with all Dēmos publications, the views expressed in this briefing book do not necessarily reflect the views of the Dēmos Board of Trustees.
Dēmos Board of Trustees
About Dēmos
Dēmos: A Network for Ideas & Action is a non-partisan public policy research and advocacy organization committed to building an America that achieves its highest democratic ideals. We believe this requires a democracy that is robust and inclusive, with high levels of electoral participation and civic engagement; an economy where prosperity and opportunity are broadly shared and disparity is reduced; and a strong and effective public sector with the capacity to plan for the future and provide for the common good. Founded in 2000, Dēmos’� work combines research with advocacy—melding the commitment to ideas of a think tank with the organizing strategies of an advocacy group.
Miles S. Rapoport, President
Stuart Comstock-Gay, Director, Democracy Program Tamara Draut, Director, Economic Opportunity Program Timothy Rusch, Director of Communications
Aaron Brown, Layout/Design
DēmosA NETWORK FOR IDEAS & ACTION
For more information, resources or full statistical citations, please contact us:
Tel: (212) 633-1405 Fax: (212) 633-2015 [email protected] www.demos.org
220 Fifth Avenue, 5th Floor New York, NY 10001

FulFilling AmericA’s P r o m i s e :
ideas to expand opportunity and revitalize our democracy
ADēmos Policy Briefing BookA Network for Ideas & Action
2006-2007


Dear Colleague,
As Election Day approaches, with the beginning of the Congressional and state legislative sessions not far behind, the next several months will be a time for serious consideration of how best to effect the well-being of our nation, our states, communities and families. At Dēmos we draw inspiration from a vision of an America that fulfills its highest democratic ideals. This leads to a policy agenda that we believe can help to rekindle the broadly shared belief that together we can create and maintain the public structures that help us achieve common goals, plan for a better future, maintain a strong democracy and ensure prosperity is widely shared.
This policy agenda is by no means exhaustive, or a blueprint on every issue that candidates and elected officials will deal with. It also is deliberately not aimed exclusively at state level policies or federal level policies. Rather, it is more targeted in areas where Dēmos has developed some real expertise and experience. And on these issues, we think we have some useful things to say, and we’d like to present them to you in the form of Fulfilling America’s Promise: Ideas to Expand Opportunity and Revitalize Democracy.
The first section in this briefing book is entitled Building and Sustaining the Future Middle Class. The social contract crafted in America after World War II had as its crowning achievement the creation of a broad and accessible middle class. That contract is eroding in dangerous ways. The middle class is not just shrinking; it is inaccessible to millions, and its continuation into the future is far from certain. This piece contains some sobering statistics about the level and impact of debt on middle class families as well as the poor; an eye-opening look at the challenges young people face as they enter adulthood; and a look ahead at the future contours and challenges of the middle class. We do not just offer hard facts, but also policy proposals we believe candidates and elected officials can use, and ways of framing the issues that we believe can be truly helpful.
In the second section, the Election Reform Agenda, we examine the mechanics of our democracy—various components of our electoral system that are groaning under the weight of problematical laws, administrative confusion and under-investment. These factors discourage rather than encourage voting, and erect new barriers while further entrenching existing ones—preventing far too many eligible voters from casting a ballot. We present an array of research-based examples and statistics that demonstrate this reality, and we also put forward an agenda for reform to make a difference and help create a vibrant and inclusive democracy for the future.
Finally, we have a deep concern about the pervasive public mistrust of the very concept of government. This dangerous cynicism is fueled by ongoing financial and political disinvestment in the very structures that are supposed to keep our families healthy, our communities safe, and provide opportunity for all. For those of us engaged in the public debate more broadly, there is an opportunity, and a responsibility, to address problems and work for constructive solutions in ways that begin to restore a belief that problems can be solved, and that our government—at its best, the collective expression of our values and creativity—can be a force for change and improvement.
We hope that the ideas in this Fulfilling America’s Promise can help you to “do politics” and work in government in that way. We invite you to borrow heavily from this book, copy it and share it with staff and friends. We have many more detailed reports and supporting material, and we invite you to contact us at any point with your questions, for additional resources, or to discuss your policy ideas and point of view.
Yours truly,
Miles S. Rapoport President


Table of Contents
Building and Sustaining the Future Middle Class 1
Guarantee the First Step to the American Dream: Affordable 5 Higher Education
Restore the Promise of Work: Fair Wages, Affordable Healthcare, 9 Building a Career
Address the Debt Crisis in America: Restore Borrower Security 14 and Promote Savings
Next Steps to Create New, Bold Policy 18
Resources and Contact Information 19
Election Reform Agenda 2
Make Electoral Participation Possible and Accessible 24
Modernize Election Procedures 27
Address Challenges to the Right to Vote 33
Enhance Choice in Elections 38
Move Forward with Meaningful Reform 41
Resources and Contact Information 43
I.
II.
III.
IV.
I.
II.
III.
IV.
V.
1


Building & sustAining A Future middle clAssA strong middle class has been America’s
signature strength for decades. Through deliberate public policy measures, the United States created a vast, thriving middle class in the post-World War II era. As our economy and population have undergone drastic changes over the last 30 years, our public policies have not kept up, jeopardizing our ability to build and sustain a future middle class.

� FULFILLING AMERICA’S PROMISE: Ideas to Expand Opportunity and Revitalize Democracy
Building and Sustaining the Future Middle Classi. Guarantee the First Step to the American Dream: Affordable Higher Education
Access and Affordability 5
Fixing the Problem—The Contract for College 7
ii. Restore the Promise of Work: Fair Wages, Affordable Healthcare, Building a Career
The Earnings Decline 9
The Minimum Wage 10
What It Takes to Get Ahead—Variations in Living Standards 11
Career Ladders for Upward Mobility 12
iii. Address the Debt Crisis in America: Restore Borrower Security and Promote Savings
Borrowing to Make Ends Meet 14
Creating a Nation of Savers 15
Ending Abusive Lending Practices 17
iv. Next Steps to Create New, Bold Policy 18
Resources and Contact Information 19

�FULFILLING AMERICA’S PROMISE: Ideas to Expand Opportunity and Revitalize Democracy
Building and Sustaining a Future Middle Class
Today, the American Dream is in trouble. In our volatile economy, too many Americans work full-time and year-round but still cannot climb into the middle class while those already there have less stability than ever before. And at the same time that workers have become more vulner-able, their economic safety net has steadily been eroded. Stagnant incomes no longer keep pace with the rising costs of housing, health care and other basic expenses. As a result, too many Americans are unable to save and are instead falling deeply into debt.
Despite these warning signs, Americans remain optimistic about their economic future. A 2005 New York Times poll found that 38 percent of Americans believe they will reach the American Dream in their lifetimes while another 32 percent believe they have already reached it. This aspiration to middle class prosperity has been central to America’�s economic success. By now it is clear that a vibrant, accessible middle class is essential to the foundation of healthy modern democracy.
In this series of policy briefs, we outline a framework for growing and sustaining the future middle class. In particular, we explore three major areas where we believe there is widely shared support for public policy investments that will help build and maintain a thriving middle class. Rooted in common sense American values, these policy briefs include key facts that demon-strate the need for public policy change and outline bold yet practical policy recommendations to secure the American Dream for generations to come. While we envision many of these policy recommendations as national in scope, many of them can also be implemented at the state level.
HIGHLIGHTS INCLuDE:
First Step to the American Dream: Affordable Higher Education
We must ensure that anyone who wishes to invest in their future through college or vocational training will not be stopped by financial barriers. Because of the high cost of tuition, far too many college-ready young adults are scaling down their dreams of a college education simply because they cannot afford it, and an alarming number of students who do graduate from college be-gin their careers saddled with a debilitating level of student loan debt. We propose creating a Contract for College that would unify the existing strands of federal financial aid—grants, loans and work-study—into one guaranteed financial aid package for students. It would also ensure that families have early knowledge of the financial resources available to their children to attend college.
Restore the Promise of Work
We must ensure that anyone who works full-time will be rewarded with a minimally decent stan-dard of living—one that reflects the true cost of living in different areas of the United States. The belief that hard work guarantees rewards is part of our country’�s longstanding social contract
a

� FULFILLING AMERICA’S PROMISE: Ideas to Expand Opportunity and Revitalize Democracy
between citizen and government. That social contract is in tatters. We must ensure that any-one who works full time does not fall below the poverty line by phasing in an increase in the minimum wage and expanding the Earned Income Tax Credit (EITC) to reflect variations in the cost of living. Additionally, because job openings are expected to swell at both the low and high ends of the nursing and teaching professions, we propose establishing a large-scale career ladder program. Existing programs could be scaled up through increased federal funding and nationalized standards.
Address the Debt Crisis in America: Restoring Borrower Security and Promoting Savings
We must create a society where all Americans have the ability to put away savings for the future. Over the last two decades, low- and middle-income families have been afflicted by rising costs and stagnant wages. The result has been a dramatic increase in consumer debt, along with a decline in savings. Both of these trends must be reversed to ensure the overall stability and long-term health of the economy. Fueled by steady deregulation of the lending industry, credit card issuers increasingly charge excessive interest rates and fees, making it harder for families to get out of debt and back on the path to savings. We propose enacting a Borrower’s Security Act to protect consumers from deceptive terms and exorbitant interest rates and fees. We also propose increasing asset-building and savings-building by establishing matched savings accounts to help all American families save.
�FULFILLING AMERICA’S PROMISE: Ideas to Expand Opportunity and Revitalize Democracy
i. Guarantee the First Step to the American Dream: Affordable Higher Education
The United States has historically been a nation of self-improvers, where those who make the effort to invest in their own future—especially through education—garner rewards for doing so. Yet today, many Americans do not have the opportunity for self-improvement through higher education and, instead, often find themselves stuck in dead-end jobs with dim prospects for wage-growth or asset-building. We must ensure that anyone who wishes to invest in their future through college or vocational training will not be stopped by financial barriers.
In today’�s knowledge-based economy, higher education is a necessary qualification for entry into the middle class. Jobs offering middle-class wages and workplace benefits such as health in-surance and retirement plans increasingly require at least some college. Over a lifetime, a worker with a college degree will earn an average of roughly $1 million more than a worker with only a high school diploma.
Young adults recognize this economic reality, and are enrolling in higher education in record numbers. Because of the high cost of tuition, however, far too many college-ready young adults are scaling down their dreams of a college education and a shot at the middle class—attending community college instead of a 4-year college, enrolling in but not finishing college, or forgoing higher education altogether—simply because they cannot afford it. Of those who do graduate from college, an alarming number begin their careers saddled with a debilitating level of student loan debt.
To build a strong future middle class, America must invest in higher education. Without such an investment, true economic opportunity and mobility cannot be realized, and America’�s mid-dle class will be jeopardized. According to the Advisory Committee on Student Financial Aid Assistance, if current enrollment trends persist, over the next decade 4.4 million college-ready students from households with incomes below $50,000 will not attend a 4-year college and 2 million students will not attend any college at all. We cannot allow this to happen. America needs a bold new effort to increase access to higher education, and we must provide all students who want to attend an institution of higher education the opportunity to do so.
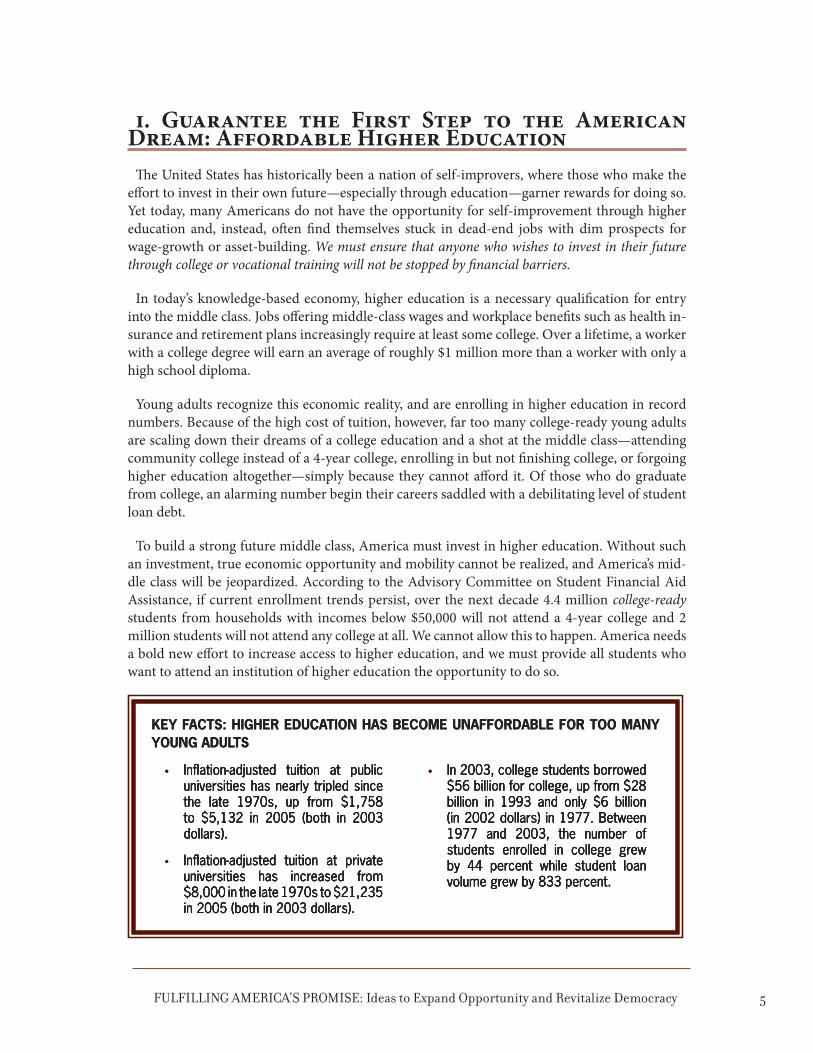
Key Facts: HigHer education Has Become unaFFordaBle For too many young adults
Inflation-adjusted tuition at public universities has nearly tripled since the late 1970s, up from $1,758 to $5,132 in 2005 (both in 2003 dollars).
Inflation-adjusted tuition at private universities has increased from $8,000 in the late 1970s to $21,235 in 2005 (both in 2003 dollars).
•
•
In 2003, college students borrowed $56 billion for college, up from $28 billion in 1993 and only $6 billion (in 2002 dollars) in 1977. Between 1977 and 2003, the number of students enrolled in college grew by 44 percent while student loan volume grew by 833 percent.
•Inflation-adjusted tuition at public universities has nearly tripled since the late 1970s, up from $1,758 to $5,132 in 2005 (both in 2003 dollars).
Inflation-adjusted tuition at private universities has increased from $8,000 in the late 1970s to $21,235 in 2005 (both in 2003 dollars).
•
•
In 2003, college students borrowed $56 billion for college, up from $28 billion in 1993 and only $6 billion (in 2002 dollars) in 1977. Between 1977 and 2003, the number of students enrolled in college grew by 44 percent while student loan volume grew by 833 percent.
•

� FULFILLING AMERICA’S PROMISE: Ideas to Expand Opportunity and Revitalize Democracy
Key Facts: (cont.)
The average cost (tuition, fees, room and board) of attending a private college in 1976-1977 was $12,837 annually, in 2004 dollars. In 2003-2004, the average cost of attending a public university was $11,354. In other words, the burden of affording a state college today is equivalent to that of paying for a private college in the 1970s.
Every year, 410,000 college-qualified students from households with incomes less than $50,000 enroll in community college instead of going to a 4-year college. Another 168,000 college-qualified students don’t enroll in college at all.
The federal government spent $81 billion in financial aid for the 2003-2004 school year. But 70 percent of this aid is in the form of loans, while grant aid only makes up 21 percent.
The maximum Pell Grant award—the nation’s premier program for helping poor students pay for college—covers about one-third of the costs of a 4-year college today. It covered nearly three- quarters in the 1970s. But only 22 percent of Pell grant recipients get the maximum award; the average award in 2003 was $2,421.
•
•
•
•
Student loans and grants are often not enough to cover the cost of higher education. Three-quarters of full-time college students are working and nearly half work 25 hours or more a week.
Within five years of entering college, 40 percent of students from the top socio-economic quartile will earn a 4-year degree as compared to only 6 percent of students in the lowest quartile. Over a quarter of white students who enter college will earn a bachelor’s degree, whereas only about 15 percent of African-American and Latino college students will complete their degree.
Only 11 percent of the Latino population and 17 percent of the African-American population over the age of 25 hold a 4-year degree, as compared to 28 percent of the white population.
Between the years of 2000 and 2015, the college-age population is expected to grow by 16 percent. This generation will be more ethnically diverse, better prepared for college, and more likely to need financial aid. By 2015, 43 percent of the college-age population will be nonwhite, and students from low-income families will represent an increasing proportion of high school students.
•
•
•
•
�FULFILLING AMERICA’S PROMISE: Ideas to Expand Opportunity and Revitalize Democracy
POLICy RECOMMENDATIONS: Make College Affordable and Accessible for Everyone
Create a Contract for College.
A Contract for College would unify the existing strands of federal financial aid—grants, loans and work-study—into one guaranteed financial aid package for students. Grants would make up the bulk of aid for students from low- and moderate- income families. The Contract for College will recognize the important value of reciprocity, so part of each student’�s contract will include some amount of student loan aid and/or work-study requirement. Families should be provided early with information about financial resources available to their children for college. At the start of the program, all students in the 8th grade and above will receive their Contract for College that estimates their aid package using the average cost of attendance at public 4-year institutions. Long before college enrollment or even college application, financial aid awareness can have a large impact on whether families consider college a viable option.
Provide College-Qualified Students with a Comprehensive and Guaranteed Student Aid Package.
Based on the student’�s family income, this package would cover a percentage of the full cost of college attendance—including tuition, fees, books, and room and board. The aid package would be a mixture of grants, loans and work-study with grants providing the bulk of aid for students from low- and moderate-income families. For example, a college student with household income below $25,000 might receive a package that could include a grant for 75 percent of the costs, with the remaining 25 percent to be paid for through a combination of a work-study program and a subsidized loan.
Implement Federal Student Loans through the Direct Student Loan Program (DSLP).
This could be done by phasing out the Federal Family Education Loan Program (FFELP) which relies on private lenders and requires federal subsidies to ensure the lenders’� profitability. Switching to the Direct Loan Program will allow the loan system to offer income-contingent repayment options and eliminates the additional cost of providing subsidies to private lenders. Switching all federal loans to the Direct Loan Program will result in an estimated savings of over $4.5 billion per year for the federal government.
Inform Families of the Financial Resources Available to Their Children to Attend College as Early as Eighth Grade.
Beginning in eighth grade, all students should receive an estimate of their potential college aid package using the average cost of attendance at public 4-year institutions. Educating
� FULFILLING AMERICA’S PROMISE: Ideas to Expand Opportunity and Revitalize Democracy
students and parents about the amount of student aid available will help increase the expectation that attending and completing college is a realistic goal.
Charge In-State Tuition to all Qualifying Students.
In conjunction with supporting more effective financial aid options for eligible students, pass legislation that allows public institutions to charge in-state tuition to all qualifying students, regardless of immigration status.
�FULFILLING AMERICA’S PROMISE: Ideas to Expand Opportunity and Revitalize Democracy
ii. Restore the Promise of Work: Fair Wages, Affordable Healthcare, Building a Career
Few virtues are respected more by Americans than the willingness to work hard to get ahead. Yet today, millions of Americans who work full-time and even overtime find that they cannot cover their basic living expenses or afford to make key investments in their future. We must ensure that anyone who works full-time will be rewarded with a minimally decent standard of living—one that reflects the true cost of living in different areas of the United States.
As the economy has transitioned away from a manufacturing base, the labor market has also changed. Feeling pressure from foreign competition, many companies have slashed manufactur-ing jobs permanently. Many of the high-paying blue-collar jobs that used to be a central compo-nent of our middle class no longer exist. Unions have been weakened and the minimum wage has lost ground against inflation, leaving young workers without college degrees in a serious financial pinch. Union membership has dropped to just 8.6 percent of the private-sector workforce, and benefits are becoming increasingly rare.
Our economy no longer generates widespread opportunity and our public policy is not picking up the slack, much less planning for long-term economic challenges. Rapidly changing, often volatile economic conditions are making it more difficult to enter the middle class and stay there. The most rapidly growing groups in the United States—African Americans and Latinos, who were left out of the post-WWII prosperity until the 1970s and 1980s—face growing obstacles to entering, and staying in, America’�s middle class. As the bar to a middle-class life is raised higher, for many, economic security—and the opportunity to get ahead—are fading.
One of the characteristics that has distinguished the United States from other countries around the world is our promise of upward mobility. The belief that hard work guarantees rewards is part of our country’�s longstanding social contract between citizen and government. That social contract is in tatters. We must act now to address the growing income and opportunity gap in America so that today’�s young people—and the millions in families that are currently struggling for increasingly tenuous middle-class stability—have a real shot at the American Dream. Other-wise, we risk losing the very foundation of our strong and stable democracy.
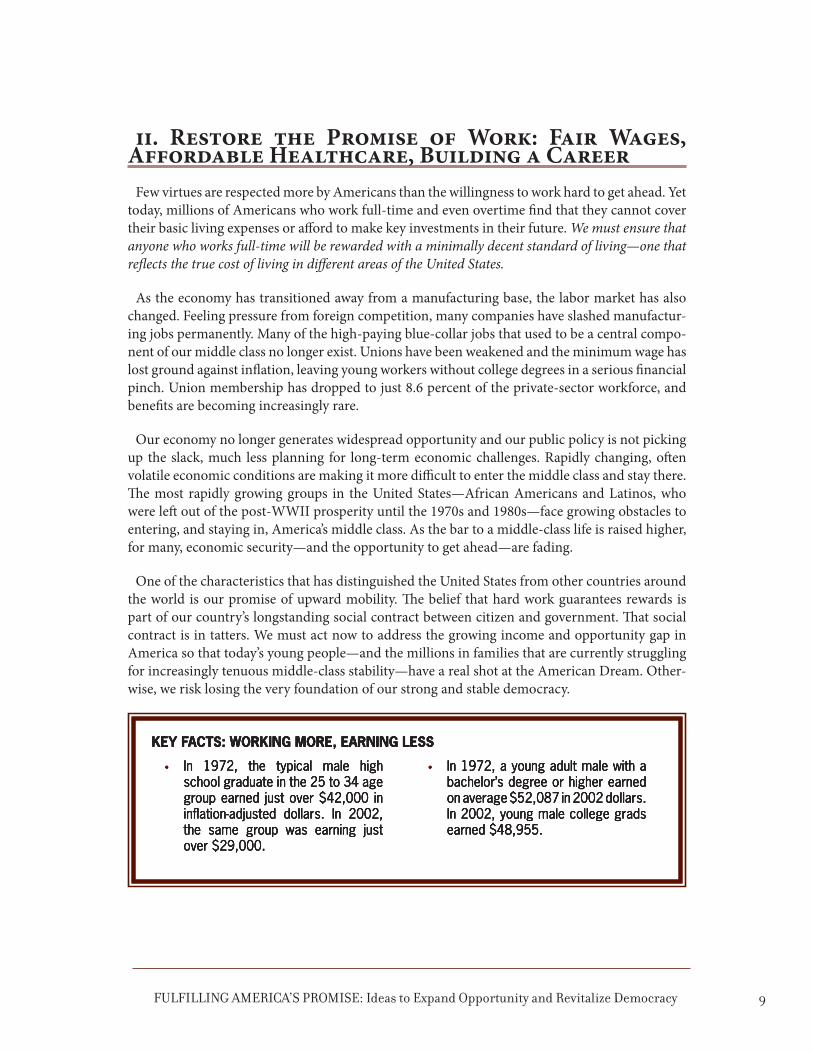
Key Facts: WorKing more, earning lessKey Facts: WorKing more, earning less
In 1972, the typical male high school graduate in the 25 to 34 age group earned just over $42,000 in inflation-adjusted dollars. In 2002, the same group was earning just over $29,000.
• In 1972, a young adult male with a bachelor’s degree or higher earned on average $52,087 in 2002 dollars. In 2002, young male college grads earned $48,955.
•In 1972, the typical male high school graduate in the 25 to 34 age group earned just over $42,000 in inflation-adjusted dollars. In 2002, the same group was earning just over $29,000.
• In 1972, a young adult male with a bachelor’s degree or higher earned on average $52,087 in 2002 dollars. In 2002, young male college grads earned $48,955.
•

�0 FULFILLING AMERICA’S PROMISE: Ideas to Expand Opportunity and Revitalize Democracy
POLICy RECOMMENDATIONS: Good Jobs for the 21st Century
Raise the Minimum Wage.
To ensure that anyone who works full time does not fall below the poverty line, an increase of the minimum wage to $8.40 an hour should be phased in by 2010. Raising the minimum wage to this level will ensure that a full-time working parent with two children will not fall below the projected federal poverty line. Currently, the poverty line for a family of three in the contiguous United States is $16,600. In addition, the new minimum wage should be indexed to inflation so that workers’� wages keep up with the cost of living. Many states have raised their minimum wage above the national level of $5.15 in recent years, and several ballot initiatives in the 2006 election feature minimum wage increases. While we believe an increase in the federal minimum wage is long overdue, states can also take action in this area.
Key Facts: WorKing more, earning lessKey Facts: WorKing more, earning less
While average wages have declined for the last 30 years, some top-paying positions have seen astonishing wage increases—asymmetric growth that has led to increased income inequality. In 1975, the average income of young adults in the top fifth was about five times as great as the average income of young adults in the bottom fifth; in 2003 it was 11 times greater.
In 1974, 44 percent of workers in the private sector were in a defined benefit pension plan. Today, only 17 percent are in such plans. In 2000, just under 50 percent of all private sector workers were covered by any sort of retirement plan, including a 401(k). About 73 percent of those in the top quintile of earners had a pension plan, compared to only 18 percent of those in the bottom quintile.
As companies have shifted their focus from stability to profits in recent years, they have increasingly contracted out services as a way to cut labor costs. During the 1990s, the number of jobs handled by
•
•
•
temp agencies more than doubled, growing from just under 1 million jobs to over 2 million jobs by the end of the century.
Today, contingent workers make up 16 percent of the workforce. These workers earn less than they would if they were doing the same job on a permanent basis. They are also much less likely to have health or pension benefits. Nearly half of all contingent workers would prefer a permanent full- time job.
Nearly all U.S. population growth over the next five decades will be among groups who are not yet solidly established within the middle class and who face significant obstacles in climbing into the middle class in a postindustrial era.
Projections suggest that within 15 years the gaps in opportunity experienced by African Americans and Latinos today will result in declining education and income levels that will affect the overall productivity and economy of the country.
•
•
•

��FULFILLING AMERICA’S PROMISE: Ideas to Expand Opportunity and Revitalize Democracy
Expand the Earned Income Tax Credit (EITC) to Account for Variations in the Cost of Living
In an era where low-wage work is a permanent fate for millions, there should be a more generous subsidy to ensure a minimal basic income for low-wage workers and create more parity in tax expenditure benefits across income groups. The EITC should be expanded in several ways to meet these new challenges.
First, the tax credit would offer a maximum income supplement of up to $15,000 per year to all workers over the age of 18, and under 65, who worked 35 or more hours a week during 44 weeks in a given year (1,540 hours per year). This expanded credit would work much as the current EITC, except that it would be more generous, with payments pegged to local living standards. For example, a single parent with two children in Little Rock with a full-time job paying $8 an hour, or $16,000 a year, would receive a refundable tax credit of roughly $8,000 to enable the family to meet the local cost of living, estimated at $25,000. The same parent living in Nassau/Suffolk County, New York, earning $10.50 an hour, or $21,840 a year, would receive the maximum credit of $15,000 a year; unfortunately this family would still feel a significant shortfall of income given estimated living costs at roughly $46,000 annually. Individual workers without children would be treated in the same way as parents under the expanded EITC, with benefits determined by geographic location and, for married or co-habiting individuals, total household income.
The expanded EITC would also directly encourage full-time work. However, it would acknowledge the difficulty many people have in securing or keeping full-time employment and would reward all work, up to a point. All individuals, with the exclusion of students, would be eligible for a lifetime total of five years of part-time worker credits. In order not to provide any incentives for working less, these credits would be lower than those available for full-time workers, with their generosity reflecting annual hours worked. For example, a parent with two children living in Little Rock who only worked 1,000 hours a year at $9.00 an hour, for a total of $9,000 a year, might get 50 percent of the difference between her earned income and her minimal basic income, or an $8,000 credit. However, if she worked more hours—1,250 in a year, earning $11,250—she might get 75 percent of the difference between her earned income and their minimal basic income, or $10,312.
The size of the EITC an individual receives would be based on the local cost of living, as determined by the Federal Office of Living Standards (see next recommendation).
Create a Federal Office of Living Standards
The Federal poverty threshold is now the dominant measurement of economic well-being among low-income Americans. However, much research has demonstrated that the minimal cost of living is much higher in every part of the United States than the threshold—and, in many cases, dramatically higher. For this reason, the federal poverty threshold is best understood as a crisis-level minimal floor of economic sustenance, as opposed to a measurement of sustainable economic well-being.
�� FULFILLING AMERICA’S PROMISE: Ideas to Expand Opportunity and Revitalize Democracy
In recent years, nongovernmental organizations have developed sophisticated research models that capture the true of cost of living in hundreds of communities across the United States. Some state and local governments have adopted such models to inform social policy and economic planning. The stage is now set for the federal government to develop its own approach to measuring the true cost of living in communities nationwide—with the specific goal of determining credit levels under the expanded EITC.
The federal government should become the authoritative source of information about the true cost of living in America, distilled down to every imaginable household configuration and zip code. This would be done through the following:
Create a bipartisan National Commission on Living Standards that would develop a methodology for measuring the true cost of living in communities across the United States.
Create a Federal Office of Living Standards that uses the methodology, collecting and analyzing a wide range of data to determine the true cost of living for different household types in every zip code in the United States.
Establish a Large-Scale Career Ladder Program.
There is a fundamental tension that exists in the American ideal of college for everyone and the reality that the largest growth in jobs will be in the low-wage sector of the economy. These are the jobs that don’�t demand bachelor’�s degrees and often require little more than a few days of on-the-job training. Some of the fastest growing occupations—those that are growing quickly but not necessarily adding the most number of new jobs—are in technology, such as computer systems analysts and computer software engineers that require some college education and typically pay middle class wages. However, the largest growing occupations—those adding the most number of jobs—are in food service and preparation with 2.9 million new jobs predicted in 2010. These jobs paid on average from $15,000 at the low end to $26,000 at the high end in 2003.
There are at least two career fields, however, that offer real promise for growth at both the low and high ends. Among the largest growing occupations over the next 10 years will be jobs in health services like medical assistants, personal home and health care aides, as well as higher-paying jobs in the field like registered nurses. The same job growth trends are mirrored in the teaching field. Over the next decade, there is robust growth projected in both the low-end—paraprofessionals, also known as teaching assistants or aides—and the high-end, K through 12 teaching positions. The fact that in two major occupational categories—teaching and the health professions—both low- and high-wage job growth is projected over the next decade signals an opportunity to design formal career ladders in these fields. Local and state initiatives that have proven effective in moving people up the professional ladder in these occupations should be scaled up.
Several successful examples of career ladders exist, including programs that help teaching
•
•
��FULFILLING AMERICA’S PROMISE: Ideas to Expand Opportunity and Revitalize Democracy
assistants become teachers and nursing assistants advance to registered nurses. These programs should be scaled up through increased federal funding and nationalized standards. These types of programs would address the reality that many young adults cannot return to school full-time and recognize that many must enter the labor force rather than attend a 4-year college.
Honor Collective Bargaining.
Because not all jobs are ripe for career ladders, such as those in the ever-growing food and retail industry, reforms are needed to remove barriers to unionization. History has shown that unions can play a critical role in improving wages and working conditions. The Employee Free Choice Act, introduced in Congress in 2003, would mandate that employers recognize and authorize the formation of a union when a majority of employees have signed union cards.
Expand Health Insurance Coverage, Access to Quality Early Childhood Education and Care.
Over the last decade, the costs of two critical services, health care and child care, have put tremendous financial burdens on low- and moderate-income families. Both systems have demonstrated market failures in need of much greater intervention by the public sector to control costs and improve quality. These types of reforms can occur at both the national and the state level.

�� FULFILLING AMERICA’S PROMISE: Ideas to Expand Opportunity and Revitalize Democracy
iii. Address the Debt Crisis in America: Restore Borrower Security and Promote Savings
Sacrificing and saving today for a brighter future tomorrow—for example, by stretching to buy a home—has long been a key ingredient in the American formula for middle-class success. Yet today, too many Americans are moving in the opposite direction—struggling with few assets and accumulating high burdens of personal debt. We must create a society where all Americans have the ability to put away savings for the future and where everyone has a chance to own a home.
Several years into the new century, signs abound that American families are struggling to stay afloat in an increasingly volatile economy. At the same time that workers have become more vulnerable, their economic safety net has steadily been eroded. Unemployment insurance ben-efits are less generous than before and harder to come by. Health insurance is no longer a stan-dard employee benefit and public subsidies haven’�t grown to meet new demand. Pensions have changed dramatically from guaranteed retirement benefits offered by employers to an “at your own risk” investment system. Over the last decade, the average household has experienced stag-nant or slow-growing incomes that no longer keep pace with the rising costs of housing, health care and other basic expenses.
It is against this backdrop of economic and policy change that we can best understand the explosive rise in consumer debt that began in the 1980s and intensified in the 1990s. Credit card debt has almost tripled since 1989, and rose 31 percent in the past five years, with Americans now owing close to $800 billion in credit card debt.
To deal with stagnant incomes, prolonged unemployment and higher prices for housing, gaso-line and other essentials, more families are turning to high-cost credit cards to make ends meet. This rising tide of credit card debt threatens the ability of families to manage the costs of day-to-day living, build assets, save for retirement, and support a family. One-quarter to 40 percent of households lack the net worth needed to survive without income for three months at the poverty line, and interest payments drain billions of dollars from U.S. households. These trends must be reversed to ensure the overall stability and long-term health of the economy.
Key Facts: BorroWing to maKe ends meetKey Facts: BorroWing to maKe ends meet
Since 1990, consumer debt has more than tripled—from $214 billion to over $750 billion, and the savings rate has steadily declined and is now below zero.
The number of people filing for bankruptcy jumped 125 percent, with over 1.6 million people filing in 2003. That’s more people filing for bankruptcy than for divorce.
•
•
Demos’ analysis of Federal Reserve data shows dramatic increases in credit card debt among middle- and lower-income households, and among older Americans.
The average 25-to-34-year-old spends about one of every five dollars on debt payments, and by 2001, nearly 12 out of every 1,000 young adults aged 25 to 34 were filing for bankruptcy, a 19 percent rise since 1991.
•
•

��FULFILLING AMERICA’S PROMISE: Ideas to Expand Opportunity and Revitalize Democracy
POLICy RECOMMENDATIONS: Boost Savings and Borrower Security
Establish Matching Savings Accounts.
To begin rebuilding the capacity of American families to save, a system of universal savings accounts should be created that would help low- and middle-income savers with $1 for $1 matches on their savings, up to $1,000 per year. Existing asset-building supports, such as Individual Development Accounts (IDA), should be expanded to help working families weather a reduction in income and plan for the future, and we should provide each
Key Facts: (cont.)Key Facts: (cont.)
Between 1992 and 2001, average credit card debt increased 22 percent among African Americans and 20 percent among Latinos. Eighty-four percent of African American credit card holders carry a balance, and 75 percent of Latinos carry a credit card balance. In contrast, 50 percent of white cardholders carry a balance.
In 2002, the average college senior had six credit cards and an average balance of just over $3,200. One in five students has credit card debt between $3,000 and $7,000, and student credit card debt increases with each successive year, more than doubling between freshman and senior year.
Although credit card companies often offer low introductory rates, they routinely increase these rates to 29 percent or higher and add fees for a late payment. Late is defined as even one minute past the specified time on the due date.
Credit card companies routinely scan their cardholders’ credit scores and raise their interest rates for
•
•
•
•
problems with other creditors, even if the cardholder has never been late or missed a payment. This is known as universal default.
Credit card contracts typically permit the lender to change the terms of the card agreement at any time for any reason. When credit card companies increase the rate on the card, the new APR is applied retroactively to the entire balance, not just to the purchases made after the rate was increased.
Every year the average indebted household pays over $2,175 in interest charges. Even while the prime rate has fallen to an historic level, average credit card rates have continued to climb since 2001, rising from 15.8 percent to 16.4 percent.
Penalty rates now routinely top 29 percent, and late payment fees rose from just over $7 billion in 1996 to $10 billion in 2003. Credit issuer MBNA, for example, raised its late fee to $39 for balances over $1,000.
•
•
•

�� FULFILLING AMERICA’S PROMISE: Ideas to Expand Opportunity and Revitalize Democracy
newborn child with an asset account endowed with $6,000 at birth—money that will ensure that everyone has a better chance of becoming a middle-class asset-holder earlier in life.
Reinvent unemployment Insurance.
The unemployment insurance system was designed to help workers get through a temporary job loss by replacing their lost earnings. Today, however, most workers are ineligible for benefits, and the benefit levels replace only about one-third of an average worker’�s earnings. For example, at the end of the recession in 1975, three-quarters of the unemployed workers were receiving unemployment benefits. By 2001, that number had declined to only 43 percent. States need to modify the rules governing the system to expand coverage to more low-wage workers, those most vulnerable to temporary income losses and most likely to lack savings or wealth to draw on during unemployment.
Boost Homeownership and Savings.
We should create new incentives to increase the rate of homeownership for low-income working families within the next five years. These include matched savings accounts to help low-income families save for a down payment for a first home as well as tax incentives for low-income home buyers. While mortgage interest is currently tax deductible, nearly ninety percent of the mortgage interest deduction benefit accrues to tax filers with adjusted gross income over $50,000. Wealthy homeowners are even able to deduct mortgage interest on a second residence. We propose making mortgage interest refundable, rather than just deductible, for families making under $50,000 a year. Additionally, while homeownership rates among African Americans and Latinos are still significantly lower than among whites, home equity is still the largest part of African-American and Latino wealth. Increasing homeownership among African Americans and Latinos is essential to building wealth for future generations.
Enact a Federal Borrower’s Security Act.
We must protect consumers from deceptive credit card terms and exorbitant interest rates and fees. Fueled by steady deregulation of the industry, credit card companies increasingly charge excessive interest rates and fees, making it harder for families to get out of debt and back on the path to savings. Today there are no legal bounds to the amount of fees and interest credit card companies can charge borrowers. In addition, credit card companies, unlike other lenders, are allowed to change the terms on cards at anytime, for any reason. As a result, cardholders often borrow money under one set of conditions and end up paying it back under a different set of conditions. Legal limits on interest rates and fees have traditionally been established by the states. But because card companies can export interest rates from the state in which they are based, consumers are left unprotected from excessive rates, fees and capricious changes in account terms.
��FULFILLING AMERICA’S PROMISE: Ideas to Expand Opportunity and Revitalize Democracy
A Borrower’�s Security Act would require card companies to provide a late-payment grace period of at least five days before fees or interest rate hikes can be assessed; limit rate increases to 10 percent above the cardmember’�s original rate and to new transactions; require disclosure of the full costs of only paying the minimum payments, including the number of years and total dollars it will take to pay off the debt; raise the minimum payment requirement to 5 percent of the total balance for new cardholders to curtail excessive debt loads and interest payments; require credit cards issued to individuals under 21 to have a co-signer, unless they can prove they have independent means of support; prohibit card companies from raising a cardholder’�s interest rate based solely on payments to other creditors; and limit any rate increase to future activity on the card only.
Stop Discriminatory Lending Practices.
Nonwhite applicants are more likely to be turned down for loans than white applicants. When non-white applicants do receive loans, they frequently suffer from inflated interest rates and abusive terms and conditions. African Americans and Latinos have become special targets for brokers and lenders selling costly sub-prime home financing products, and are more likely to pay higher interest rates and have less favorable loan terms than whites—even when credit scores among the groups are held constant. These types of discriminatory practices must be stopped.

�� FULFILLING AMERICA’S PROMISE: Ideas to Expand Opportunity and Revitalize Democracy
iv. Next Steps to Create New, Bold PolicySome of these policy recommendations would require considerable investment and national
action, while others could be implemented at the state or even the local level. Many could be implemented in an incremental fashion, while others could begin as pilot programs. Regardless, they are all aimed squarely at the goal of building and sustaining America’�s future middle class.
Dēmos has conducted research and published an array of reports that chronicle the widespread economic insecurity in America today, that also offer recommendations for strengthening eco-nomic opportunity and, ultimately, prosperity, for America’�s future. Dēmos is ready to work with lawmakers to advance the policies presented here, and has a wealth of resources, and a network of national-and state-level experts, available to enhance legislative efforts to secure opportunity for America’�s households—today and into the future.

19FULFILLING AMERICA’S PROMISE: Ideas to Expand Opportunity and Revitalize Democracy
Resources from DemosThe Future Middle Class Series
African Americans, Latinos and Economic Opportunity in the 21st Century
Measuring the Middle: Assessing What It Takes to Be Middle Class
Millions to the Middle: Three Strategies to Expand the Middle Class
Young Adult Economics Series
Higher and Higher EducationPaycheck ParalysisGeneration DebtThe High Cost of Putting a Roof Over Your HeadAnd Baby Makes BrokeWithout a Fight: Explaining Young Adults’ Political Retreat
1.2.3.4.5.6.
Borrowing to Make Ends Meet Series
Borrowing to Make Ends Meet: The Growth of Credit Card Debt in the ‘90s
Costly Credit: African Americans and Latinos in Debt
A House of Cards: Refinancing the American Dream
Retiring in the Red: The Growth of Debt Among Older Americans
Generation Broke: The Growth of Debt Among Younger Americans
Home Insecurity: How Widespread Appraisal Fraud Puts Homeowners At Risk
Books
STRAPPED: Why America’s 20- and 30-Some-things Can’t Get Ahead, By Tamara Draut
Inequality Matters: The Growing Econimic Divide in America and Its Poisonous Consequences, Edited By James Lardner & David A. Smith
Other OrganizationsCenter for American Progress, Economic Mobility Program www.americanprogress.org
Center for Economic and Policy Research www.cepr.org
Center for Responsible Lending www.responsiblelending.org
Corporation for Enterprise Development www.cfed.org
Economic Policy Institute www.epinet.org
National Consumer Law Center www.consumerlaw.org
New America Foundation, Asset Building Program www.newamerica.net
The Project on Student Debt www.projectonstudentdebt.org
United for a Fair Economy www.faireconomy.org
Contact
Visit www.demos.org to sign up for our monthly Around the Kitchen Table e-news-journal and download research reports, analysis and commentary from the Economic Opportunity Program.
Tamara Draut, Director Economic Opportunity Program [email protected] 212.633.1405
Cindy Zeldin, Federal Affairs Coordinator Economic Opportunity Program [email protected] 202.956.5144
Center for Policy Alternatives www.cfpa.org


election reForm A g e n dA A healthy democracy should be
characterized by high participation, widespread civic and political engagement, a feeling that everyone can “make a difference,” and elections that ensure every eligible voter can cast a vote that will be counted.

�� FULFILLING AMERICA’S PROMISE: Ideas to Expand Opportunity and Revitalize Democracy
Election Reform Agendai. Make Electoral Participation Possible and Accessible 24
Voter Registration 24
ii. Modernize Election Procedures 27
Voting List Management 27
Modernize Polling Places—Better Planning, Funding and Training 28
Provisional Ballots, Not “Placebo” Ballots 29
Accommodating Language-Minority Voters 30
Accommodating Voters with Disabilities 31
iii. Address Challenges to the Right to Vote 33
Felon Disfranchisement and the Case for Voting Rights Restoration 33
Voter ID: The Myth of Voter Fraud 35
Organized Misinformation and Suppression of Voting Rights 37
iv. Enhance Choice in Elections 38
Redistricting 38
Campaign Finance Reform 39
v. Move Forward with Meaningful Reform 4
Next Steps for Lawmakers and Administrators 4
Resources and Contact Information 43
1
1
��FULFILLING AMERICA’S PROMISE: Ideas to Expand Opportunity and Revitalize Democracy
Institutional barriers keep too many Americans away from participation in our political system. As the first two presidential races of the century have shown, our elections are riddled with problems—cumbersome registration procedures, long lines at the polls, overtly partisan or discriminatory election administration, and large numbers of eligible voters being erroneously disfranchised. These problems have no place in modern America. Voters deserve an electoral system with integrity—one that is fair, robust, and open to every eligible voter. Now is the time to introduce real pro-voter reform, and develop a long-term vision for the democracy we deserve.
A Clarion Call for Reform—the Elections of the 21st Century
The 2000 election debacle in Florida showed that we had to modernize voting machines and improve the management of voting rolls. The federal Help America Vote Act (HAVA), signed into law in October 2002, was a first step toward reforming the system. HAVA allocated $3.9 billion to the states, spread over three years, to pay for improvements in voting equipment and election administration.
But progress has been slow. The federal government dragged its feet in doling out dollars to the states and clarifying how states should implement the new law. The majority of states chose to put off until January 2006 the introduction of new voting technology and improved election administration. Meanwhile, pollworkers and the public alike were confused by changes in registration and voting procedures, resulting in problems at the polls in 2004. Nevertheless, more than 120 million citizens cast ballots that year, a 60 percent turnout of eligible voters—the highest since 1968. It seems clear that, when something important is at stake, voters will brave barriers.
America needs a voting system deserving of its enduring faith in democracy. We must summon the resources and the collective will to advance a large and as-yet unfulfilled agenda aimed at encouraging every eligible American to vote. Only by taking such actions will we able to create a healthy democracy in which all citizens have real choices and a real voice in determining the nature and focus of their government and their future.
�� FULFILLING AMERICA’S PROMISE: Ideas to Expand Opportunity and Revitalize Democracy
i. Make Electoral Participation Possible and Accessible
Participation should not only be simplified, but encouraged. Barriers that prevent eligible voters from voting should be reduced as far as possible. No voter should struggle to register, face a false challenge at the polls, or find polling stations that are inadequately staffed, election officials who are inadequately trained, or voting machines that do not work.
issue: Voter registration
America’�s patchwork of voter registration procedures—including arbitrary deadlines, outdated voter lists and erroneous voter list purges—too often function as barriers to participation in elec-tions. U.S. voter turnout has plummeted to record lows over the last quarter-century, averaging around 53 percent of the population in presidential elections. Meanwhile, almost one in three eligible Americans is not registered to vote. These stark facts are due in no small part to the overly complex and arcane laws and administrative challenges that vary from state to state, and sometimes from county to county.
Facts:Facts:
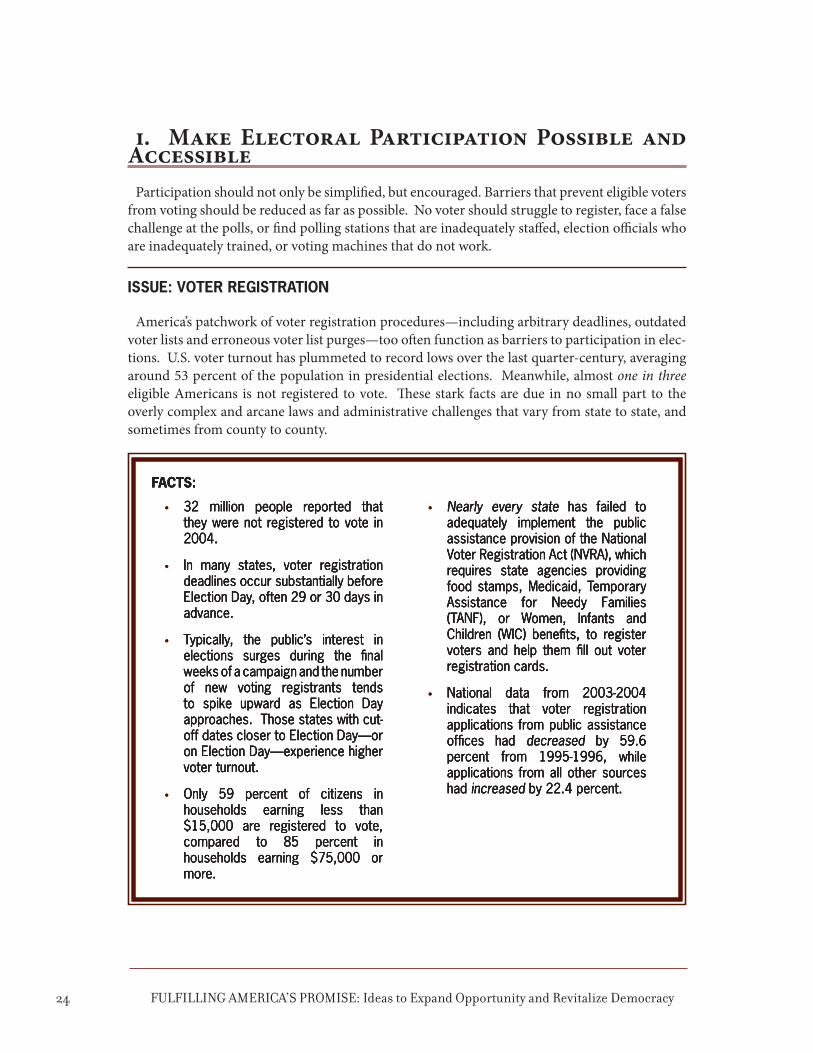
32 million people reported that they were not registered to vote in 2004.
In many states, voter registration deadlines occur substantially before Election Day, often 29 or 30 days in advance.
Typically, the public’s interest in elections surges during the final weeks of a campaign and the number of new voting registrants tends to spike upward as Election Day approaches. Those states with cut-off dates closer to Election Day—or on Election Day—experience higher voter turnout.
Only 59 percent of citizens in households earning less than $15,000 are registered to vote, compared to 85 percent in households earning $75,000 or more.
•
•
•
•
Nearly every state has failed to adequately implement the public assistance provision of the National Voter Registration Act (NVRA), which requires state agencies providing food stamps, Medicaid, Temporary Assistance for Needy Families (TANF), or Women, Infants and Children (WIC) benefits, to register voters and help them fill out voter registration cards.
National data from 2003-2004 indicates that voter registration applications from public assistance offices had decreased by 59.6 percent from 1995-1996, while applications from all other sources had increased by 22.4 percent.
•
•
Facts:Facts:
32 million people reported that they were not registered to vote in 2004.
In many states, voter registration deadlines occur substantially before Election Day, often 29 or 30 days in advance.
Typically, the public’s interest in elections surges during the final weeks of a campaign and the number of new voting registrants tends to spike upward as Election Day approaches. Those states with cut-off dates closer to Election Day—or on Election Day—experience higher voter turnout.
Only 59 percent of citizens in households earning less than $15,000 are registered to vote, compared to 85 percent in households earning $75,000 or more.
•
•
•
•
Nearly every state has failed to adequately implement the public assistance provision of the National Voter Registration Act (NVRA), which requires state agencies providing food stamps, Medicaid, Temporary Assistance for Needy Families (TANF), or Women, Infants and Children (WIC) benefits, to register voters and help them fill out voter registration cards.
National data from 2003-2004 indicates that voter registration applications from public assistance offices had decreased by 59.6 percent from 1995-1996, while applications from all other sources had increased by 22.4 percent.
•
•

��FULFILLING AMERICA’S PROMISE: Ideas to Expand Opportunity and Revitalize Democracy
POLICy RECOMMENDATIONS
Fully Implement the National Voter Registration Act (NVRA) of 1993.
The NVRA has three major elements. The first, “Motor Voter,” requires states to allow people to register to vote at departments of motor vehicles. The second authorizes mail-in voter registration. The third and least widely known provision, Section 7, requires state agencies to offer and assist in voter registration at human services offices. While the motor voter and mail-in mandates of the law have generally been well-used, the social service component has not. The number of voters registered at social service agencies is very low, compared with those registered at driver’�s license offices.
Simple changes in procedure at offices offering food stamps, welfare, Medicaid or disability benefits could help millions of people register over the next four years.
At the state level, we offer the following recommendations:
Encourage public assistance agencies to set up NVRA Improvement Teams to coordinate and monitor voter registration at each agency.
Train agency staff on appropriate implementation of the NVRA.
Offer clients voter registration during all required points of contact— including in waiting rooms and during phone, mail and internet transactions.
Ask clients if they want to register at the start of the interview process. Do not bury this question among other questions about benefit eligibility.
Encourage clients to complete their voter registration forms before leaving the agency.
Incorporate registration forms into materials sent to every client changing his or her address.
Monitor performance by tracking voter registrations generated by each office on a monthly basis.
After implementing many of our recommended procedures, Iowa’�s Department of Human Services (DHS) and their Women, Infants and Children (WIC) program increased voter registrations by 3000 percent over registrations for the same period in the previous year and 700 percent over the same period for the 2000 general election.
•
•
1.
2.
3.
4.
•

�� FULFILLING AMERICA’S PROMISE: Ideas to Expand Opportunity and Revitalize Democracy
Pass Election Day Registration.
Election Day Registration (EDR), also known as “same-day voter registration,” permits eligible citizens to register and vote on Election Day. Six states offer this innovation: Wisconsin, Minnesota, Maine, Wyoming, New Hampshire and Idaho. Inspired by their example, Montana is implementing a modified version of EDR for the first time this year.
Participation rates in EDR states are an astonishing 12 percentage points higher than in states without it. In 2004, the top four states in voter turnout—Minnesota, Maine, Wisconsin and New Hampshire—all had Election Day Registration.
Significantly, provisional ballots are virtually unnecessary in such states. If a person arrives at the polling place and finds that his or her name is not on the rolls, then that person can simply register on the spot and cast a valid ballot.
While some express concerns about implementing Election Day Registration, EDR states have reported few if any fraud-related problems, or problems with costs or administrative complexity. Indeed, the elimination of the need for provisional ballots can make EDR a financial benefit. New citizens, people of color, young people and low-income individuals are more likely to move and thus more likely to have registration problems that could be solved by Election Day Registration. EDR could bring millions of new voters into the system.
Institute Automatic Voter Registration.
The requirement that citizens register before voting can be traced to the Reconstruction era in the South and the period of mass immigration in the North a century ago. The intent was to discourage voting; ours should be to encourage it. Voting need not be a two-step process whose burden falls on the individual citizen.
In many European countries, citizens are automatically registered to vote when they turn 18. Thinking long-term, a system that makes registration automatic without creating an intrusive and intimidating national-identity structure ought to be an achievable goal.

��FULFILLING AMERICA’S PROMISE: Ideas to Expand Opportunity and Revitalize Democracy
ii. Modernize Election ProceduresIf the 2000 debacle in Florida showed that we had to modernize the machines used for voting
and improve the shoddy list management used to qualify voters, the 2004 elections signaled the need for a new set of procedural reforms necessary to restore confidence in our election admin-istration. Our current system discourages the act of voting. The hours-long lines for voting in Ohio, Florida and elsewhere are prima facie evidence. Partisan election officials, engaging in activities that clearly raise questions about conflict of interest, exacerbate the growing sense of a system in crisis. A thorough overhaul of election administration is imperative if we are to move our electoral system into the 21st century.
issue: Voting list management
Without accurate voter lists, we run the risk of repeating some of the most egregious problems witnessed in Florida in 2000. Thousands of eligible voters were impermissibly purged from the voter rolls by state elections officials. And while the new, HAVA-mandated statewide databases should help reduce duplicate registrations, there are no clear procedures, beyond those spelled out in the National Voter Registration Act, for maintaining good voter lists. It falls to the chief election official in each state to create clear standards for maintaining accurate lists and ensuring standards are followed.
POLICy RECOMMENDATIONS
Adopt consistent criteria for voter list maintenance.
Consistent criteria would help bring transparency and consistency to a process that is otherwise erratic and obfuscated. Criteria for purging should be numerous, and matches between felon and other voter-disqualification lists and voter registration records should be required to be exact and double-checked.
Facts:Facts:
Purged, a 2004 survey of 15 states by Demos and the ACLU, found that none required its officials to ensure that an individual with a felony conviction is the same individual being purged from the voter rolls.
• Two-thirds of the states surveyed did not require elections officials to notify voters purged from the voter rolls, denying these voters an opportunity to contest erroneous purges.
•Purged, a 2004 survey of 15 states by Demos and the ACLU, found that none required its officials to ensure that an individual with a felony conviction is the same individual being purged from the voter rolls.
• Two-thirds of the states surveyed did not require elections officials to notify voters purged from the voter rolls, denying these voters an opportunity to contest erroneous purges.
•

�� FULFILLING AMERICA’S PROMISE: Ideas to Expand Opportunity and Revitalize Democracy
Adopt clear rules about voter database list rejections.
States should adopt legislation requiring election officials to notify people, by certified mail, that their voter registration is in jeopardy because their voter registration data has been matched with felon disqualification records. Notices should include reinstatement and/or re-registration information. The notice and challenge process should be completed no later than 90 days preceding an election.
Adopt a process for registration on Election Day.
This would allow voters whose names have been erroneously removed from the voter list to re-register at the polling place and vote. It would also allow voters to self-correct errors on the list without the fear of losing their opportunity to vote in the current election. Such a change would help to insure that the registrar of votes has an updated and accurate voter list while at the same time allowing all eligible voters to cast ballots on Election Day.
issue: modernize Polling Places—Better Planning, Funding and training
Competent, well-trained poll workers are critical components of an efficient, effective and secure electoral system. As DeForest “Buster” Soaries, former Chair of the U.S. Election Assis-tance Commission (EAC) has noted, “If the criminal justice system didn’�t have access to jurors, the criminal justice system wouldn’�t exist. Poll workers are just as important as jurors.” But the U.S. confronts a dire shortage of poll workers.
FactsFacts
Just before the 2004 election, the United States Election Assistance Commission cited a need for 500,000 more poll workers.
According to the EAC, 5.8 percent of polling places and 4 percent of precincts were understaffed in 2000.
The long lines at the polls experienced by many voters during Election 2004 were another indication of understaffed polling places.
•
•
•
In 2004, many poll workers were unfamiliar with the new provisional ballot requirements, sometimes refusing to give them to voters.
In 2004, many poll workers improp-erly asked for identification from language-minority citizens.
Human administrative error contrib-utes substantially to the perception that our elections are “at risk.”
•
•
•

��FULFILLING AMERICA’S PROMISE: Ideas to Expand Opportunity and Revitalize Democracy
POLICy RECOMMENDATION
Provide better training and fair pay for poll workers.
An adequately large pool of willing, informed and capable poll workers—including many bilingual poll workers—is essential for facilitating the right to vote and ensuring smooth election administration. We need to encourage more people to take on this responsibility by allocating adequate resources, paying our poll workers a decent stipend, creating manageable shifts, and providing effective training.
issue: ProVisional Ballots, not “PlaceBo” Ballots
By now it is widely known that, in 2000, thousands of Floridians were simply turned away from the polls on Election Day—as were perhaps hundreds of thousands or more voters across the country. In the aftermath, it was clear that we need to reinvest in our electoral system and transform it into one that allows every eligible voter the opportunity to vote, and to cast a ballot that will be properly counted. The Help America Vote Act mandated provisional ballots (also known as affadavit ballots), intended to provide “fail-safe” voting, in an attempt to prevent the occurrence of another Florida-like scenario. Unfortunately, improper implementation and mis-information about provisional ballots revealed all too many problems in 2004.
Facts:Facts:
In 2004 states distorted the provisional ballot requirement by imposing restrictions on their use—disfranchising voters without ID, penalizing voters who showed up at the “wrong” polling place, and limiting provisional ballot choices to candidates for federal office.
The 2004 election revealed that poll workers were confused about how to use and record provisional ballots. Many voters reported that they were not offered provisional ballots at all, while others reported that they were offered provisional ballots when they should have been given regular ballots.
•
•
Poor provisional ballot procedures and confused poll workers not only limit the effectiveness of “fail-safe” voting, but they may turn out to be “placebo ballots”–ballots legitimately cast but left uncounted and/or thrown in the trash like wastepaper–that cause more damage than offering no provisional ballots at all.
•In 2004 states distorted the provisional ballot requirement by imposing restrictions on their use—disfranchising voters without ID, penalizing voters who showed up at the “wrong” polling place, and limiting provisional ballot choices to candidates for federal office.
The 2004 election revealed that poll workers were confused about how to use and record provisional ballots. Many voters reported that they were not offered provisional ballots at all, while others reported that they were offered provisional ballots when they should have been given regular ballots.
•
•
Poor provisional ballot procedures and confused poll workers not only limit the effectiveness of “fail-safe” voting, but they may turn out to be “placebo ballots”–ballots legitimately cast but left uncounted and/or thrown in the trash like wastepaper–that cause more damage than offering no provisional ballots at all.
•
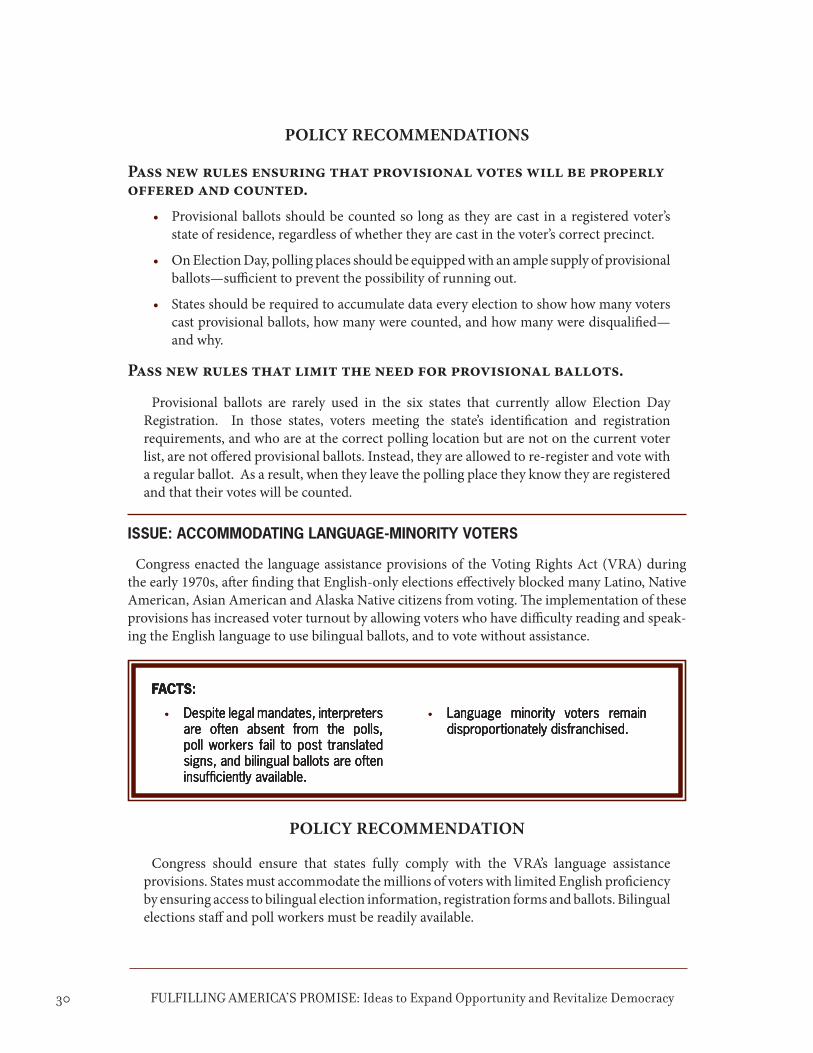
�0 FULFILLING AMERICA’S PROMISE: Ideas to Expand Opportunity and Revitalize Democracy
POLICy RECOMMENDATIONS
Pass new rules ensuring that provisional votes will be properly offered and counted.
Provisional ballots should be counted so long as they are cast in a registered voter’�s state of residence, regardless of whether they are cast in the voter’�s correct precinct.
On Election Day, polling places should be equipped with an ample supply of provisional ballots—sufficient to prevent the possibility of running out.
States should be required to accumulate data every election to show how many voters cast provisional ballots, how many were counted, and how many were disqualified—and why.
Pass new rules that limit the need for provisional ballots.
Provisional ballots are rarely used in the six states that currently allow Election Day Registration. In those states, voters meeting the state’�s identification and registration requirements, and who are at the correct polling location but are not on the current voter list, are not offered provisional ballots. Instead, they are allowed to re-register and vote with a regular ballot. As a result, when they leave the polling place they know they are registered and that their votes will be counted.
issue: accommodating language-minority Voters
Congress enacted the language assistance provisions of the Voting Rights Act (VRA) during the early 1970s, after finding that English-only elections effectively blocked many Latino, Native American, Asian American and Alaska Native citizens from voting. The implementation of these provisions has increased voter turnout by allowing voters who have difficulty reading and speak-ing the English language to use bilingual ballots, and to vote without assistance.
POLICy RECOMMENDATION
Congress should ensure that states fully comply with the VRA’�s language assistance provisions. States must accommodate the millions of voters with limited English proficiency by ensuring access to bilingual election information, registration forms and ballots. Bilingual elections staff and poll workers must be readily available.
•
•
•
Facts:Facts:
Despite legal mandates, interpreters are often absent from the polls, poll workers fail to post translated signs, and bilingual ballots are often insufficiently available.
• Language minority voters remain disproportionately disfranchised.
•Despite legal mandates, interpreters are often absent from the polls, poll workers fail to post translated signs, and bilingual ballots are often insufficiently available.
• Language minority voters remain disproportionately disfranchised.
•

��FULFILLING AMERICA’S PROMISE: Ideas to Expand Opportunity and Revitalize Democracy
issue: accommodating Voters WitH disaBilities
There are more than 56 million American citizens with disabilities, approximately 40 million of whom are of voting age. Many of these individuals have in the past been effectively disfranchised by inaccessible polling places and voting machines. With passage of the Help America Vote Act of 2002 (HAVA), a landmark event for the disability community, voters with disabilities were guaranteed a private and independent vote.
POLICy RECOMMENDATIONS
Ensure fully accessible poll sites, with adequate technology in place.
People with disabilities need fully accessible polling places and voting machines. Ensure that every polling place has the technology in place to allow voters with disabilities to vote on their own, without assistance. This technology is available, and should be used.
Provide adequate information at the polling place.
Ensure that each polling place clearly indicates that people with disabilities can request help from poll workers, if necessary.
Facts:Facts:
HAVA requires that each polling place have accessible voting equipment, i.e., equipment that allows voters with disabilities to vote privately and independently.
The VRA guarantees voters with disabilities who need assistance reading a ballot or going through the voting process assistance from persons of the voters’ choice. Voters with disabilities who need assistance voting but who do not bring an assistant may request assistance from election workers.
•
•
A 2001 GAO study found that only 16 percent of polling places were fully accessible to people with disabilities.
In the 2004 presidential election, many people with disabilities were disfranchised by long lines at the polls, and either inadequate or a total lack of accommodations to their needs.
•
•
�� FULFILLING AMERICA’S PROMISE: Ideas to Expand Opportunity and Revitalize Democracy
Train poll workers thoroughly to work with voters with disabilities.
Poll workers should be thoroughly trained to accommodate people with disabilities; they should also comply with the VRA by enabling people with disabilities to receive assistance from the person of their choice. Poll workers should also comply with the Americans with Disabilities Act (ADA) by enabling people with disabilities to take a reasonable amount of extra time to cast their ballots if they are unable to complete this process within a specified time allotment.
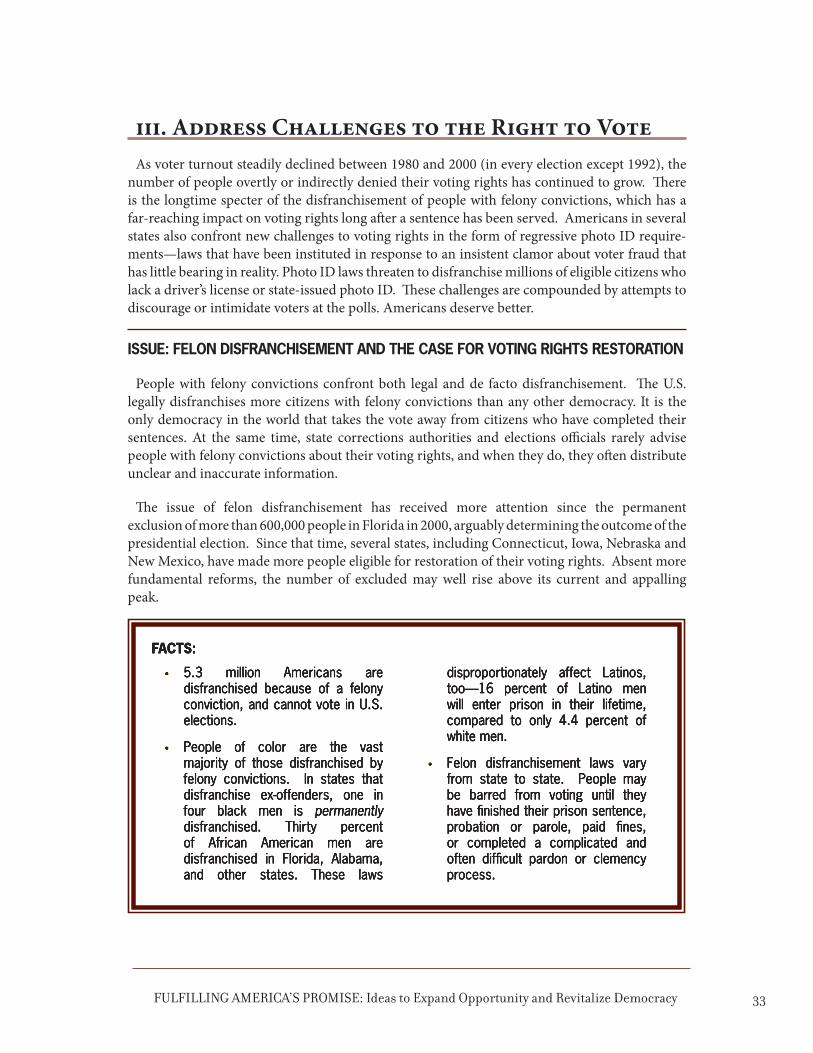
��FULFILLING AMERICA’S PROMISE: Ideas to Expand Opportunity and Revitalize Democracy
iii. Address Challenges to the Right to VoteAs voter turnout steadily declined between 1980 and 2000 (in every election except 1992), the
number of people overtly or indirectly denied their voting rights has continued to grow. There is the longtime specter of the disfranchisement of people with felony convictions, which has a far-reaching impact on voting rights long after a sentence has been served. Americans in several states also confront new challenges to voting rights in the form of regressive photo ID require-ments—laws that have been instituted in response to an insistent clamor about voter fraud that has little bearing in reality. Photo ID laws threaten to disfranchise millions of eligible citizens who lack a driver’�s license or state-issued photo ID. These challenges are compounded by attempts to discourage or intimidate voters at the polls. Americans deserve better.
issue: Felon disFrancHisement and tHe case For Voting rigHts restoration
People with felony convictions confront both legal and de facto disfranchisement. The U.S. legally disfranchises more citizens with felony convictions than any other democracy. It is the only democracy in the world that takes the vote away from citizens who have completed their sentences. At the same time, state corrections authorities and elections officials rarely advise people with felony convictions about their voting rights, and when they do, they often distribute unclear and inaccurate information.
The issue of felon disfranchisement has received more attention since the permanent exclusion of more than 600,000 people in Florida in 2000, arguably determining the outcome of the presidential election. Since that time, several states, including Connecticut, Iowa, Nebraska and New Mexico, have made more people eligible for restoration of their voting rights. Absent more fundamental reforms, the number of excluded may well rise above its current and appalling peak.
Facts:Facts:
5.3 million Americans are disfranchised because of a felony conviction, and cannot vote in U.S. elections.
People of color are the vast majority of those disfranchised by felony convictions. In states that disfranchise ex-offenders, one in four black men is permanently disfranchised. Thirty percent of African American men are disfranchised in Florida, Alabama, and other states. These laws
•
•
disproportionately affect Latinos, too—16 percent of Latino men will enter prison in their lifetime, compared to only 4.4 percent of white men.
Felon disfranchisement laws vary from state to state. People may be barred from voting until they have finished their prison sentence, probation or parole, paid fines, or completed a complicated and often difficult pardon or clemency process.
•

�� FULFILLING AMERICA’S PROMISE: Ideas to Expand Opportunity and Revitalize Democracy
POLICy RECOMMENDATIONS
States have widely varying laws about when voting rights are restored. In Maine, Vermont and Puerto Rico, as well as many other countries, citizens never lose their right to vote as a result of a felony conviction. In most other states, where voting rights are removed, the restoration process varies widely.
All states should examine their laws and bring citizens with felony convictions back into the voting booth expeditiously. To do this, states should:
Restore the right to vote automatically
Once a person’�s period of disfranchisement has lapsed, the right to vote should be automatically restored. Voter registries should be automatically updated to reflect an individual’�s re-enfranchisement.
Notify individuals about voter eligibility
Institute strong notification procedures by government agencies to ensure that people know when their voting eligibility is restored. Combating defacto disfranchisement requires many more legislative and administrative changes as well as federal supervision of purge lists, which have been abused in Florida and elsewhere.
Educate the Public About Voting Rights
Create public education campaigns that inform all Americans, including those with felony convictions, of their rights.
Facts: (cont.)Facts: (cont.)
Fourteen states permanently disfranchise some or all citizens with felony convictions. In these states, even people who have served their prison terms, completed probation and parole, paid all required fines, and have been reincorporated into their communities, may be barred from voting—for life.
Throughout the United States, corrections authorities and elections offices rarely advise convicted
•
•
citizens of their voting rights, and when they do, they often distribute unclear and inaccurate information.
The United States is the only democracy in the world that takes the vote away from citizens who have completed their sentences. Many countries also allow prisoners to vote, including Canada, Denmark, France, Israel, Japan, Kenya, Norway, Peru, South Africa, Sweden and Zimbabwe.
•

��FULFILLING AMERICA’S PROMISE: Ideas to Expand Opportunity and Revitalize Democracy
Improve Database Sharing
Institute better sharing of database information between corrections and election officials to ensure accurate lists and to help reduce disfranchisement.
issue: Voter id: HoW tHe mytH oF Voter Fraud is used to suPPort a rollBacK oF Voting rigHts For millions
Many recent debates on the subject of election reform have been thoroughly pervaded with rhetoric about improving election integrity by alleviating the fear of “voter fraud.” The focus on fraud has often obscured the many problems that occurred in the last two elections. The obsession with voter fraud is particularly remarkable since so little empirical evidence exists to indicate that individuals frequently impersonate others, cast multiple ballots at the polling place, or vote knowing they are ineligible. In a Dēmos report, Securing the Vote: An Analysis of Elec-tion Fraud (2003), Barnard College professor Lori Minnite found that voter fraud is rare, that safeguards to prevent fraud are already in place, and that individual voter fraud rarely if ever has swayed an election.
While little empirical evidence indicates that voter fraud at the polls exists, the American public has been led to believe that our election system is being abused by non-citizens, fictitious voters, the deceased, felons and multiple voters. The ultimate aim of this exercise in misinformation and exaggeration has been the promulgation of stringent new photo ID requirements for voting, often for partisan advantage. Once in place, these measures risk disfranchising millions of otherwise eligible voters who may lack the requisite government-issued identification. People of color, the poor, seniors, people who move frequently, and people with disabilities are at greatest risk.
•Facts:Facts:
The Coalition on Homelessness and Housing in Ohio and the League of Women Voters Coalition found that, while more than 9,078,728 votes were cast in Ohio during the 2002 and 2004 elections, there were only four instances of ineligible people voting or attempting to vote in the state—approximately 0.000044 percent of the total number of votes cast.
• An intensive federal probe into alle-gations of fraud in Wisconsin uncov-ered no evidence of a conspiracy to influence the 2004 election. Instead, 10 formerly incarcerated individuals were charged for voting illegally; four others were cited for voting twice. Of the latter, three cases have been dispensed with without conviction; the fourth prosecution is still pending. Of these few cases, it is likely that those charged simply didn’t know they were ineligible.
•The Coalition on Homelessness and Housing in Ohio and the League of Women Voters Coalition found that, while more than 9,078,728 votes were cast in Ohio during the 2002 and 2004 elections, there were only four instances of ineligible people voting or attempting to vote in the state—approximately 0.000044 percent of the total number of votes cast.
• An intensive federal probe into alle-gations of fraud in Wisconsin uncov-ered no evidence of a conspiracy to influence the 2004 election. Instead, 10 formerly incarcerated individuals were charged for voting illegally; four others were cited for voting twice. Of the latter, three cases have been dispensed with without conviction; the fourth prosecution is still pending. Of these few cases, it is likely that those charged simply didn’t know they were ineligible.
•

�� FULFILLING AMERICA’S PROMISE: Ideas to Expand Opportunity and Revitalize Democracy
POLICy RECOMMENDATION
Modernize and secure elections by correcting existing problems, rather than creating new barriers.
Spread awareness of the potentially devastating impact of photo ID requirements at the polls. These new laws are at times rushed through legislatures without due diligence, and premised on misconceptions about the incidence of voter fraud. Halt movement of restrictive voter ID requirements, and vote to repeal the ones that exist. These laws degrade the integrity of our elections by systematically excluding large numbers of eligible Americans, as well as diverting attention from the persistent problems in U.S. elections.
•Facts:Facts:
Data from the U.S. Department of Justice shows that while 196,139,871 votes have been cast in federal elections since October 2002, only 52 individuals have been convicted of federal voter fraud. Most of these convictions were for vote buying or for voter registration fraud—neither of which would be prevented by restrictive ID requirements at the polls.
The American Association of People with Disabilities estimates that more than 3 million Americans with disabilities do not possess a driver’s license or state-issued photo ID, the most commonly-accepted forms of identification.
A University of Milwaukee study found that approximately 23 percent of Wisconsin residents aged 65 and older do not have driver’s licenses or photo identification, while fewer than 3 percent of Wisconsin students have driver’s licenses showing their current address. The study also revealed that less than half of all African-American and Latino adults (47 percent and 43 percent, respectively) living in Milwaukee County have valid driver’s licenses.
•
•
•
AARP of Georgia estimates that about 153,000 Georgia seniors who voted in 2004 do not possess a government-issued photo ID. These Georgians could not have voted had the 2005 ID law been in effect.
The 2001 Commission on Federal Election Reform estimated that 6 to 10 percent of voting age Americans do not have a driver’s license or state-issued photo ID—totaling perhaps 20 million eligible voters. The same report found that those who lack photo ID are disproportionately poor and urban.
In 1994, the U.S. Department of Justice found that African Americans living in Louisiana were four to five times less likely to have government-issued photo ID than whites. These numbers are likely to have grown in the wake of Hurricane Katrina. A large percentage of those victimized by the storm have lost birth certificates, social security cards and all other government-issued documentation.
•
•
•
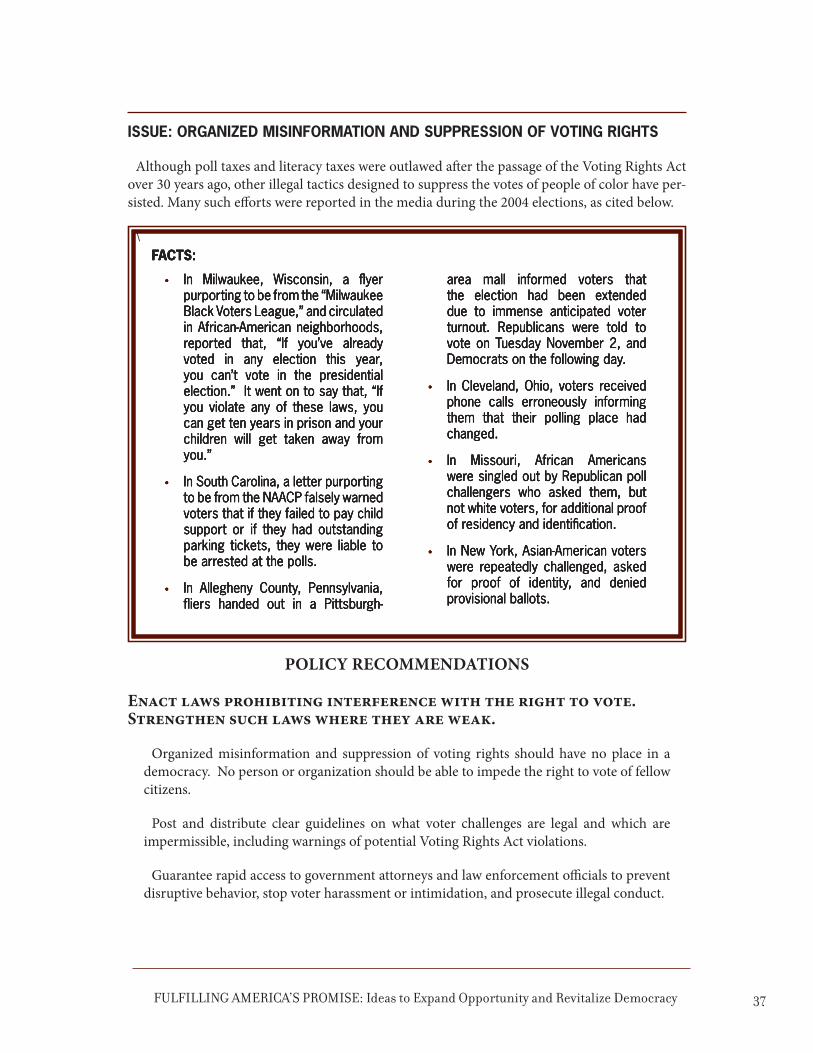
��FULFILLING AMERICA’S PROMISE: Ideas to Expand Opportunity and Revitalize Democracy
issue: organized misinFormation and suPPression oF Voting rigHts
Although poll taxes and literacy taxes were outlawed after the passage of the Voting Rights Act over 30 years ago, other illegal tactics designed to suppress the votes of people of color have per-sisted. Many such efforts were reported in the media during the 2004 elections, as cited below.
\
POLICy RECOMMENDATIONS
Enact laws prohibiting interference with the right to vote. Strengthen such laws where they are weak.
Organized misinformation and suppression of voting rights should have no place in a democracy. No person or organization should be able to impede the right to vote of fellow citizens.
Post and distribute clear guidelines on what voter challenges are legal and which are impermissible, including warnings of potential Voting Rights Act violations.
Guarantee rapid access to government attorneys and law enforcement officials to prevent disruptive behavior, stop voter harassment or intimidation, and prosecute illegal conduct.
Facts:Facts:
In Milwaukee, Wisconsin, a flyer purporting to be from the “Milwaukee Black Voters League,” and circulated in African-American neighborhoods, reported that, “If you’ve already voted in any election this year, you can’t vote in the presidential election.” It went on to say that, “If you violate any of these laws, you can get ten years in prison and your children will get taken away from you.”
In South Carolina, a letter purporting to be from the NAACP falsely warned voters that if they failed to pay child support or if they had outstanding parking tickets, they were liable to be arrested at the polls.
In Allegheny County, Pennsylvania, fliers handed out in a Pittsburgh-
•
•
•
area mall informed voters that the election had been extended due to immense anticipated voter turnout. Republicans were told to vote on Tuesday November 2, and Democrats on the following day.
In Cleveland, Ohio, voters received phone calls erroneously informing them that their polling place had changed.
In Missouri, African Americans were singled out by Republican poll challengers who asked them, but not white voters, for additional proof of residency and identification.
In New York, Asian-American voters were repeatedly challenged, asked for proof of identity, and denied provisional ballots.
•
•
•

�� FULFILLING AMERICA’S PROMISE: Ideas to Expand Opportunity and Revitalize Democracy
iv. Enhance Choice in Elections Among the problems besetting elections in America today are two that profoundly limit the
types of candidates we can vote for, and the types of candidates who have a realistic chance of winning elections—redistricting, on the one hand, and campaign finance laws, on the other. Our state and Congressional redistricting systems have become captives of partisan power struggles, with incumbents and parties who do their best to protect seats, rather than create meaningful elections. And the campaign financing system in this country ensures that only the wealthy and those supported by the wealthy have a real chance of winning high-level office. We must make changes in both areas.
issue: redistricting
The boundaries of elective offices are too often engineered by partisan operatives and designed to prevent competition, protect incumbents and diminish voter choice. Because electoral competition is an important tool through which voters can hold elected officials accountable, redistricting plans that thwart competition may undermine the goal of a government that is responsive to its constituents. In addition, the current redistricting process often produces plans in which minority communities are fractured among or overly concentrated in districts in ways that frustrate their ability to elect candidates of choice.
A rising and justifiable call for redistricting reform has emerged over the past several years. Reformers have proposed that power to draw district boundaries be taken away from state legislators and be vested in independent redistricting commissions.
FactsFacts
In the House of Representatives, only 30 seats nationally were considered competitive in 2006.
Democrats and Republicans at times collude in bi-partisan gerrymanders to protect incumbents in both parties. Not one of the 53 congressional seats up for re-election was seriously contested in California in 2002. One-quarter of state legislators ran unopposed in New York in the last state legislative elections.
•
•
More than 40 years after the Voting Rights Act of 1965 was enacted, state and local officials continue to enact racially discriminatory redistricting plans. In Massachusetts, the legislature tried to reduce the number of majority-minority legislative districts in Boston after the 2000 Census, even though the minority population had greatly increased. A federal court threw out the plan. In Texas, the Supreme Court recently found that the state’s congressional redistricting plan was gerrymandered to reduce Latino voting strength.
•In the House of Representatives, only 30 seats nationally were considered competitive in 2006.
Democrats and Republicans at times collude in bi-partisan gerrymanders to protect incumbents in both parties. Not one of the 53 congressional seats up for re-election was seriously contested in California in 2002. One-quarter of state legislators ran unopposed in New York in the last state legislative elections.
•
•
More than 40 years after the Voting Rights Act of 1965 was enacted, state and local officials continue to enact racially discriminatory redistricting plans. In Massachusetts, the legislature tried to reduce the number of majority-minority legislative districts in Boston after the 2000 Census, even though the minority population had greatly increased. A federal court threw out the plan. In Texas, the Supreme Court recently found that the state’s congressional redistricting plan was gerrymandered to reduce Latino voting strength.
•
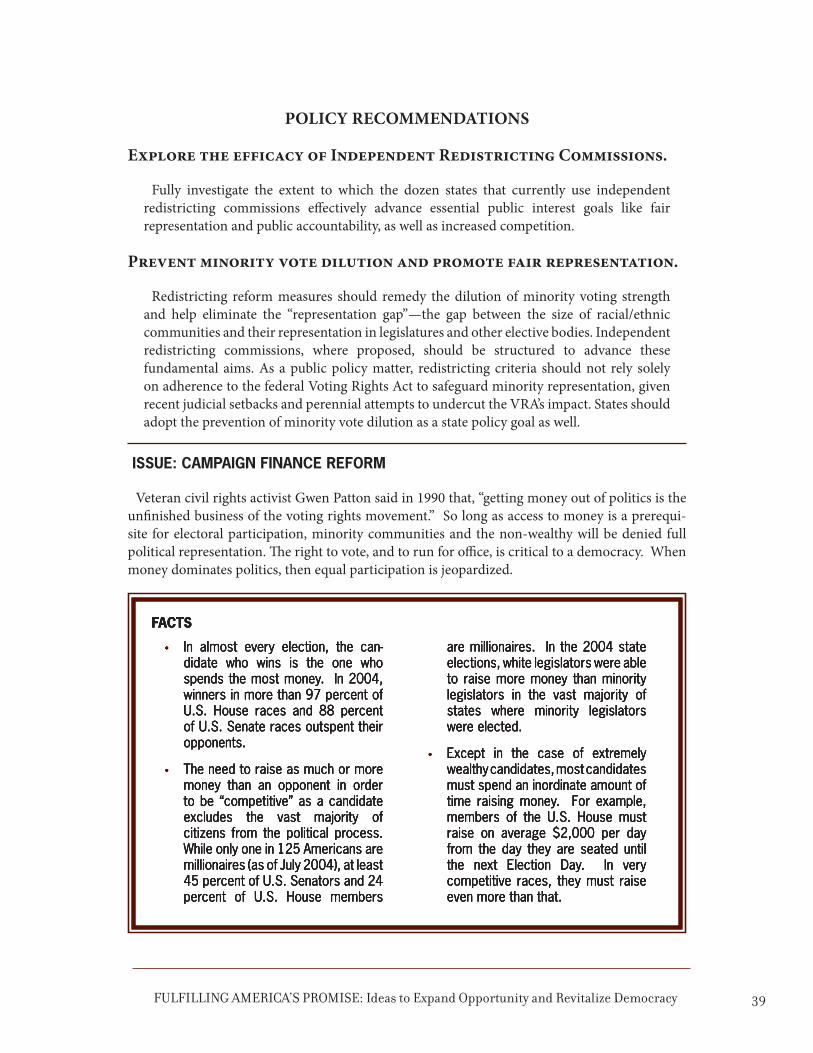
��FULFILLING AMERICA’S PROMISE: Ideas to Expand Opportunity and Revitalize Democracy
POLICy RECOMMENDATIONS
Explore the efficacy of Independent Redistricting Commissions.
Fully investigate the extent to which the dozen states that currently use independent redistricting commissions effectively advance essential public interest goals like fair representation and public accountability, as well as increased competition.
Prevent minority vote dilution and promote fair representation.
Redistricting reform measures should remedy the dilution of minority voting strength and help eliminate the “representation gap”—the gap between the size of racial/ethnic communities and their representation in legislatures and other elective bodies. Independent redistricting commissions, where proposed, should be structured to advance these fundamental aims. As a public policy matter, redistricting criteria should not rely solely on adherence to the federal Voting Rights Act to safeguard minority representation, given recent judicial setbacks and perennial attempts to undercut the VRA’�s impact. States should adopt the prevention of minority vote dilution as a state policy goal as well.
issue: camPaign Finance reForm
Veteran civil rights activist Gwen Patton said in 1990 that, “getting money out of politics is the unfinished business of the voting rights movement.” So long as access to money is a prerequi-site for electoral participation, minority communities and the non-wealthy will be denied full political representation. The right to vote, and to run for office, is critical to a democracy. When money dominates politics, then equal participation is jeopardized.
FactsFacts
In almost every election, the can-didate who wins is the one who spends the most money. In 2004, winners in more than 97 percent of U.S. House races and 88 percent of U.S. Senate races outspent their opponents.
The need to raise as much or more money than an opponent in order to be “competitive” as a candidate excludes the vast majority of citizens from the political process. While only one in 125 Americans are millionaires (as of July 2004), at least 45 percent of U.S. Senators and 24 percent of U.S. House members
•
•
are millionaires. In the 2004 state elections, white legislators were able to raise more money than minority legislators in the vast majority of states where minority legislators were elected.
Except in the case of extremely wealthy candidates, most candidates must spend an inordinate amount of time raising money. For example, members of the U.S. House must raise on average $2,000 per day from the day they are seated until the next Election Day. In very competitive races, they must raise even more than that.
•

�0 FULFILLING AMERICA’S PROMISE: Ideas to Expand Opportunity and Revitalize Democracy
POLICy RECOMMENDATIONS
Pass public financing of elections.
One of the best ways to diminish the role of money in politics and create more opportunity for equal citizen participation is through public election financing to create “clean elections”—elections where lobbyists and big donors do not hold sway. Funding for such clean elections systems—also called “fair elections” and “equal campaign funding”—can come from different sources, ranging from check-off options on tax returns and surcharges on civil fines, to drawing on a state’�s general fund. Candidates’� participation is contingent on exceeding a minimum number of small contributions from voters, thereby showing constituent support. Then, once candidates receive public funding, they must subscribe to limits on their campaign spending.
Place aggregate caps on PAC, lobbyist and large-donor contributions.
Caps on aggregate contributions from sources such as PACs, lobbyists and large donors can help, either in conjunction with partial public funding or in a system with no public funding, to decrease candidates’� dependence on financial support from special interests. Under an aggregate contribution limit, the total amount that a candidate raises from specific sources such as PACS, lobbyists or large donors is subject to a specific dollar limit or percentage of the candidate’�s funding, while the candidate remains free to raise unlimited numbers of smaller contributions from individual donors. Aggregate caps can work in conjunction with limits on the size of contributions, bans on corporate contributions, and incentives for small donors (see next recommendation), to enhance the influence of average citizens in election funding.
Provide incentives to increase participation by small donors.
Many Americans lack the funds to make contributions to their favored candidates, or feel that a small donation makes no difference compared to the large donations that candidates can collect from wealthy interests. A variety of different reforms hold promise for enhancing the role of small donors in our elections, and making candidates less dependent on big-dollar donations. These range from vouchers that a voter can provide to a candidate, political party or political organization, entitling the recipient to a set amount from a public election fund, to refund systems that reimburse voters for small contributions, to tax credits for small political contributions.
��FULFILLING AMERICA’S PROMISE: Ideas to Expand Opportunity and Revitalize Democracy
v. Move Forward with Meaningful ReformThe 2004 election was the second presidential contest in a row where procedural issues consti-
tuted a critical part of the debate and the drama. Unless immediate steps are taken, procedural problems will inevitably reoccur. We deserve better than the chaotic, patchwork electoral system we currently have. We deserve a system that will allow the US to become the true standard-bearer for democracy. To get from here to there, certain key changes must happen:
Beware false reform.
Policies that disfranchise eligible voters are always antithetical to a healthy democracy. We should aspire toward an election system with integrity—a non- discriminatory, inclusive system without corruption. To achieve this goal we must make every effort to enhance the administration of elections, discourage partisan interference, and expand opportunities for eligible voters to participate. So-called reforms that claim to foster “integrity” but actually diminish voter participation—such as measures that impose stringent voter ID requirements—should be recognized for the false reforms they are, and avoided.
Support sensible federal and state standards for elections.
On the national level, Congress should press the Department of Justice to investigate compliance with existing laws, such as the oft-ignored Section 7 of the National Voter Registration Act of 1993 (NVRA) and Section 5 oversight of the Voting Rights Act of 1965. Congress should also fully fund the Election Assistance Commission (EAC) as a permanent entity to provide states with guidance on election administration and implementation of election law on an ongoing basis. This would ease the substantial burden placed on voters and election officials.
State legislators, Secretaries of State and election officials should make it known that increased federal support for restoring integrity to elections is needed, and they should (in collaboration with non-partisan advocates) develop an agenda for—and champion—fair, pro-voter reforms that open ballot access and increase participation rates among eligible voters. They need to pay attention to necessary administrative repairs, like computerized voter lists, poll worker compensation and training, adequate machine and ballot access, and provisional ballot standards. States also need to remove partisanship from the administration of elections and reduce the influence of money on the political process. Policymakers must take to heart the needs of the voters, and the long-term health of democracy, and ensure that everyone has the fullest opportunity to have their say. Many of these goals can be reached by addressing the policies outlined in this book, including: passing Election Day Registration, enforcing NVRA, establishing clear and efficient procedures for reinstating the vote to the

�� FULFILLING AMERICA’S PROMISE: Ideas to Expand Opportunity and Revitalize Democracy
formerly incarcerated, modernizing voter rolls so that no eligible voter is erroneously purged, and others.
Work with Dēmos and others—federally and locally—to implement and properly enforce existing laws and for research and guidance on new policy proposals.
From basic concerns about election procedures to fundamental questions about full and equal representation, political leaders and the American people are engaged in a national dialogue about the health of American democracy not seen in a generation or more. Dēmos is a national, non-partisan public policy organization that works to strengthen democracy in the United States for the 21st century. We support reform efforts by developing and advancing a broad agenda for pro-voter policy; conducting research on current and long-range issues; providing advocates and policymakers with technical support; and working to strengthen reform networks.

43FULFILLING AMERICA’S PROMISE: Ideas to Expand Opportunity and Revitalize Democracy
Toolkits
Election Day Registration Helps America Vote
Restoring Voting Rights to Citizens with Felony Convictions
Reports
Continuing Failures in “Fail-Safe” Voting A Preliminary Analysis of Provisional Voting Problems
Democracy Denied The Racial History and Impact of Disenfranchisement Laws in the United States
Drawing Lines A Public Interest Guide To Real Redistricting Reform
Expanding the Vote The Practice and Promise of Election Day Registration
Maximizing Voter Registration Opportunities in Human Services Agencies An Important Responsibility For Agencies and Clients
Punishing at the Polls The Case Against Disenfranchising Citizens with Felony Convictions
Purged! How a patchwork of flawed and inconsistent voting systems could deprive millions of Americans of the right to vote
Re-Drawing Lines A Public Interest Analysis of California’s 2006 Redistricting Reform Proposals
Securing the Vote An Analysis of Election Fraud
Ten Years Later, A Promise Unfulfilled The National Voter Registration Act in Public Assistance Agencies, 1995-2005
Contact
Visit www.demos.org to sign up for Democracy Dispatches e-news-journal and download research reports, analysis and commentary.
Stuart Comstock-Gay, Director Democracy Program [email protected] 617.529.1406 | 212.633.1405
Regina M. Eaton, Deputy Director Democracy Program [email protected] 212.633.1405
Other Organizations
Advancement Project www.advancementproject.org
American Association of People With Disabilities www.aapd-dc.org
American Civil Liberties Union (ACLU) www.aclu.org
Asian American Legal Defense and Education Fund (AALDEF) www.aaldef.org
The Brennan Center for Justice www.brennancenter.org
The Center for Governmental Studies www.cgs.org
Center for Policy Alternatives www.cfpa.org
Common Cause www.commoncause.org
The Council for Excellence in Government, Redistricting Reform Project www.excelgov.org
FairVote www.fairvote.org
Lawyers Committee for Civil Rights Under Law www.lawyerscomm.org
League of Women Voters www.lwv.org
Mexican American Legal Defense and Education Fund (MALDEF) www.maldef.org
NAACP www.naacp.org
NAACP Legal Defense and Education Fund www.naacpldf.org
National Council of La Raza (NCLR/La Raza) www.nclr.org
National Disability Rights Network www.napas.org
National Voting Rights Institute (NVRI) www.nvri.org
People For the American Way (PFAW) www.pfaw.org
Project Vote www.projectvote.org
Public Campaign www.publiccampaign.org
The Sentencing Project www.sentencingproject.org
US Public Interest Research Group (USPIRG) www.uspirg.org
Resources from Demos


�� FULFILLING AMERICA’S PROMISE: Ideas to Expand Opportunity and Revitalize Democracy
DēmosA NETWORK FOR IDEAS & ACTION
220 Fifth Avenue, 5th fl., New York, NY 10001 T. 212.633.1405 F. 212.633.2015 [email protected] | www.demos.org