Embed Size (px)
Citation preview

Publication No. 01-015-069
FUGITIVE DUST CONTROLFOR PHOSPHATE FERTILIZER
Prepared by
University of FloridaDepartment of Environmental Engineering Sciences
under a grant sponsored by theFlorida Institute of Phosphate Research
Bartow, Florida
December, 1988
FLORIDA INSTITUTE OF PHOSPHATE RESEARCH

The Florida lnstitute of Phosphate Research was created in 1978 by the Florida Legislature(Chapter 878.101, Florida Statutes) and empowered to conduct research supportive to theresponsible development of the state’s phosphate resources. The institute has targeted areasof research responsibility. These are: reclamation alternatives in mining and processing,including wetlands reclamation, phosphogypsum storage areas and phosphatic clay contain-ment areas; methods for more efficient, economical and environmentally balanced phosphaterecovery and processing; disposal and utilization of phosphatic clay; and environmentaleffects involving the health and welfare of the people, including those effects related to radia-tion and water consumption.
FIPR is located in Polk County, in the heart of the central Florida phosphate district. Thelnstitute seeks to serve as an information center on phosphate-related topics and welcomesinformation requests made in person, by mail, or by telephone.
Research Staff
Executive DirectorRichard F. McFarlin
Research Directors
G. Michael Lloyd Jr. -Chemical ProcessingGordon D. Nifong -Environmental ServicesDavid J. Robertson -ReclamationHassan El-Shall -BeneficiationRobert S. Akins -Mining
Florida lnstitute of Phosphate Research1855 West Main StreetBartow, Florida 33830(863) 534-7160

FUGITIVE DUST CONTROL FOR PHOSPHATE FERTILIZER
FINAL REPORT
Dale A. Lundgren and Cumbum N. Rangaraj
UNIVERSITY OF FLORIDADepartment of Environmental Engineering Sciences, Gainesville, FL 32611
Prepared for
FLORIDA INSTITUTE OF PHOSPHATE RESEARCH1855 West Main StreetBartow, Florida 33830
Contract Manager: Mr. G. Michael Lloyd, Jr.
March, 1988

DISCLAIMER
The contents of this report are reproduced herein as receivedfrom the contractor.
The opinions, findings and conclusions expressed herein are notnecessarily those of the Florida Institute of Phosphate Research,nor does mention of company names or products constitute endorse-ment by the Florida Institute of Phosphate Research.

PERSPECTIVE
G. Michael Lloyd, Project ManagerFlorida Institute of Phosphate Research
Fugitive dust generated during the normal handling of granularfertilizer products has been a problem for both manufacturers and thoseselling the fertilizer products. An early commonly used solution forthis problem was to coat the fertilizer granules with petroleum oils.This proved highly effective in suppressing dust at the manufacturing andshipping location. This treatment tends to lose its effectiveness ifthe treated material is stored for long periods after treatment. Thisloss of effectiveness has been attributed to the fact that the oil usedto coat the particles is absorbed into the particles and no longer actsas a surface coating.
To adequately address this problem this project had to firstdevelop a satisfactory method to accurately measure the amount of dustgenerated. Once this technique was proven, it was possible to rapidlymeasure the dust generation characteristics of a fertilizer product anddetermine the effectiveness of the various dust suppression agentsavailable for this purpose.
While the study did not determine how to manufacture granularfertilizers that would not dust, it did evaluate a number of dustsuppression agents and conducted plant scale tests to demonstrate theeffectiveness of the best coating agents tested. The testing proceduredeveloped can be used to screen new dust suppression agents in a simpleand economical manner.


ii


iv

V

vi

vii

EXECUTIVE SUMMARY
Dust emissions from handling granular phosphate fertilizer is asignificant industrial problem. Because of the diffuse nature of thisdust, accurate emission measurement and/or control techniqueevaluation is very difficult. Research presented in this reportaddressed the problem of accurate dust emission measurement and dustcontrol technique evaluation.
Industrial process fugitive particle emissions can be defined asparticulate matter which escapes from a process flow stream because ofmaterial handling, transfer and storage. Because these emissions arenot emitted from a stack, they cannot be easily measured usingconventional techniques and their impact on air quality is extremelydifficult to quantify. Reference methods are available to quantifyemissions from ducted sources and reliable emission factor data can bedeveloped for such situations. However no comparable technique existsfor the measurement of fugitive dust emissions, Although a number ofmethods based upon some means of dropping a test sample in an enclosedspace have been developed to measure dust release, none provided atotally useful measure of this property.
A simple, reproducible technique to quantify fugitive dust emissionpotential of a granular product was developed and characterized. Thistest apparatus consists of a vertical flow dust chamber (VFDC) fittedwith a high-volume blower of the type used in the EPA ambient high-volume air sampler. Sampler preparation techniques were developed andoperational parameters determined. This test chamber was calibratedand the resulting dust size distribution and concentration measured.The relationship between product properties and product treatment werestudied for various granular fertilizer. The measurement techniquewas found to be sensitive and reproducible and dust emission factorsfrom about 0.0001 to over 0.1 kg/metric ton were measured for variousmaterials. Particle size vs. penetration characteristics of the dustchamber were determined using laboratory generated, monodisperse testaerosols. The chamber effectively size classifies and collects onlythose dust particles less than about 40 µm aerodynamic diameter, atthe normal test chamber operating conditions.
The dust chamber was used as a measurement tool to evaluate theeffectiveness of various dust suppressants, applied at various rateson various granular fertilizer products. Fertilizer samples wereobtained in quantities of about 100 kilograms. The fertilizer wasthoroughly mixed, divided into five kilogram test size samples, andbagged for storage before use or testing. Many types and classes ofdust suppressants were tested such as vegetable and petroleum basedoils, waxes, petrolatums and emulsions. Materials which were liquid
viii

at ambient temperature were air atomized. Waxes, which are solid atambient temperature, were sprayed both as water based emulsions andmelts. Petrolatum waxes were only sprayed as melts. The quantity ofdust suppressant was determined, after application, by weighing.Samples were stored in plastic bags until tested in the dust chamber.
Various batches of fertilizer were characterized by moisturecontent, size distribution of the granule and crushing strength of thegranule. Dust emission test were run on untreated samples and ontreated samples after various storage time periods. Fertilizertemperature was found to be a very important variable and was studiedin some detail.
Three principal types of fertilizer were used in this dustsuppression agent evaluation: granular triple superphosphate (GTSP),diammonium phosphate (DAP) and monoammonium phosphate (MAP).Fertilizer samples were obtained from several different manufacturersfor testing.
Various oils including petroleum and vegetable oil blends wereevaluated. The kinematic viscosity and oil aniline point weremeasured and used as indicators for comparison. In summary, most ofthe oils tested with GTSP show a dust release increase with storagetime and only some had good initial dust control capability. With DAPmost of the oils tested showed lower dust release and smallerincreases in dust emission with storage time.
Waxes evaluated included natural waxes such as Paraffin Wax,Microcrystalline Wax, Candellila Wax, Carnauba Wax, and Montan Wax andmany petrolatum and related waxes. The effectiveness of the dustcontrol depends upon the wax application rate. Nominally a 1, 2 and 4kg/metric ton application rate was used. A most important factor injudging coating agent performance is both the initial and afterstorage dust control factor. Results show that petrolatum waxes wereexcellent dust suppressants and that they provide long-term control offugitive dust emission.
Some of the waxes were difficult to melt and spray so water basedemulsions were considered as a means of delivering the wax to thegranule surface. As a control, tests were conducted using anequivalent weight of water as the coating agent. In general, the dustrelease characteristics of fertilizer samples coated with emulsionswere similar to those treated with plain water.
Miscellaneous coatings were also tested. Two commerciallyavailable Lignin based emulsions, primarily used to suppress roaddust, were evaluated. Both coatings performed poorly.
ix

Intermediate Scale Field Tests (ISFT)
Five petrolatum waxes and a wood processing by-product calledtall oil were evaluated in the ISFT setup. A small size, portablebelt conveyor with a 4 to 12 tons per hour product discharge rate wasused. Wax application rates of 1 to 3.5 kg/ton were tested. Of the 5waxes, 4 had similar performance while the fifth, NW6364LA, appearedto perform significantly better at lower application rates. All testswere conducted using GTSP at ambient temperature.
Full-Scale Field Tests (FSFT)
Based upon the laboratory and intermediate scale tests, a full-scale field test was designed. This test was conducted at the AgricoChemical Co., Big Bend Terminal in Gibsonton, Florida. This facilityhandles GTSP at a nominal rate of 250 tons per hour. The coatingagent spray system was designed within the facility constraints toprovide a maximum spray rate of about 5 gpm. Petrolatum waxes wereobtained and used in 55 gallon drum quantities. Although much timeand effort was spent on development of an effective spray applicationsystem, poor dust control was obtained. After many months of testingit was determined that the high fertilizer temperature was causing thewax to melt and act as an oil. Laboratory studies showed that theelevated fertilizer temperature caused the low-melting temperature waxto lose its performance. A higher melting petrolatum wax waslaboratory tested and showed improved performance. The loss inperformance was correlated with GTSP granules porosity. At elevatedtemperature the wax melted and the wax surface coating was absorbedinto the granule interior. General criteria for the selection ofappropriate dust suppressants were identified.
Selection of a coating agent (dust control agent) must take intoconsideration process variables such as fertilizer temperature andgranulation techniques. Other important factors include meltingtemperature, viscosity and oil content of the petrolatum wax. Fromevaluation of other natural waxes it was concluded that shrinkage andductility of the waxes must also be considered.
The petrolatum waxes were found to be capable of extremely highdust suppression effectiveness at a cost compatible with the oilscurrently used. They have the added advantage of being moreaesthetically pleasing, very clean, easy to spray and odorless.Petrolatum waxes can reduce dust emission by more than 90% and canmaintain that performance over a long period of time.

1. INTRODUCTION
Fugitive dust emissions from granular phosphate fertilizer resultprimarily from handling of the fertilizer during the various stages ofmanufacture, transfer, storage, shipment and use. Excessive fugitivedust emissions have a detrimental effect on the sale value of theproduct and can be a major nuisance problem.
Fugitive dust emissions from granular phosphate fertilizer can becaused by a number of factors including:
1. Loss of anti-caking agents due to pooradherence.
2. Incorrect granulation and screening ofgranular fertilizer.
3. Loss of dust adhered to granule surface andbreakage of crystal growths due to impactionand attrition.
4. Breakdown and fracture of granules duringmaterial handling operations as at beltconveyor transfer points or load out areas andcrushing of granules by material handlingequipment such as front end loaders in storageareas.
Fugitive dust can be controlled after generation by conveying thedust, if technically and economically feasible, to appropriate airpollution control equipment. The release of fugitive dust can also beprevented by using dust suppressants. This research is concerned withthe latter approach.
An extensive search of existing literature to determineinformation pertaining to dust suppressants and emission factormeasurement methods was conducted. Experimental procedures aredescribed and the various granule characteristics, including sizedistribution, hardness and moisture content, are discussed.
Laboratory tests were performed to study the performance of arange of dust suppressants and the factors which influence them.Based on the laboratory tests an intermediate scale field test (ISFT)setup was designed and assembled so as to evaluate candidate dustsuppressants when used in larger quantities. Results were verycomparable with those observed in laboratory tests.
1

Two petrolatum waxes, YP2A and NW6364LA, both with meltingtemperatures of about 52°C were used in full scale field tests (FSFT)at a GTSP shipping facility. The performance was not found to be asgood as expected from the smaller scale tests. Post field-testexperiments conducted in the laboratory showed that a combination offactors including, fertilizer temperature and porosity, wax meltingtemperature and softening point and coating aging time causedabsorption of the surface coating into the granule interior thusleading to a decreased performance level.
General criteria for the selection of appropriate dustsuppressants have been developed. Requirements for improvedperformance in field use are discussed.
2

2. BACKGROUND
Dust emissions from handling granular phosphate fertilizer are amajor problem in the industry. Because of the diffuse nature of thedust emission, accurate measurement and subsequent control are a majorproblem. Background information relating to this problem is discussedin this chapter.
DEFINITION
Industrial emissions are regulated in order to maintain a certainlevel of ambient air quality. However, only the ducted industrialemissions have specific regulations and test methods. Otherindustrial process emissions and natural emissions are grouped into aseparate category called fugitive emissions. These fugitive emissionsare not specifically regulated though they might have a significanteffect on ambient air quality. Fertilizer dust is usually considereda nuisance particulate and when released in a workplace
3environment
the published Threshold Limit Value (TLV) is 10 mg/m (AmericanConference of Governmental Industrial Hygienists, 1977).
There are many different definitions of the term "fugitiveemissions." "Fugitive dust" has been defined as particulate emissionsfrom wind and/or man's activity such as unpaved roads and agriculturaloperations and "fugitive emissions" are defined as particulate mattergenerated by industrial activities which escape to the atmosphere fromnon-ducted sources (Jutze et al., 1977). Industrial process fugitiveparticulate emissions can also be defined as particulate matter whichescapes from a defined process flow stream due to leakage, materialhandling, inadequate operational control, lack of proper pollutioncontrol technique, transfer and storage. Because these emissions are notemitted from a stack, they cannot be measured easily by conventionaltechniques and their impact on air quality is extremely difficult toquantify.
STANDARDS
During the initial development of ambient air and industrialemission standards, fugitive emissions were believed to be minor andefforts were directed toward control of emissions which could bereadily quantified. With the installation of air pollution controldevices on ducted stationary sources and the discharge of theseemissions at elevations significantly above ground level, the effectof fugitive emissions on ground level concentrations has become moresignificant.
3

The Air Quality Act was passed in 1967 and amended in 1970 andthe new law was referred to as the 1970 Clean Air Act Amendments. Theprimary National Ambient Air Quality Standards (NAAQS) for TotalSuspended Particulates (TSP) were
75 µg/m3 -260 µg/m3 -
annual geometric mean concentrationmaximum 24 hour concentration not to beexceeded more than once a year
The corresponding secondary standards were 60 µg/m3 and 150 µg/m3,respectively, and were described in the Code of Federal Regulationsreferred to as 40 CFR 50. The primary standards were aimed at theprotection of public health while the secondary standards definedlevels for the protection of public welfare.
The reference method for the determination of particulate matter(TSP) was based on the use of a high volume air sampler in anenclosure of standard dimensions and was also described in 40 CFR 50.Operational parameters were clearly specified and the upper particlesize limit was stated to be 50 µm. A number of studies have beenconducted to evaluate the collection characteristics of the airsampler (Wedding et al., 1977; Lundgren and Paulus, 1975; Robson andFoster, 1962) and it has generally been found that particles up toabout 60 urn were collected.
As of July 31, 1987, EPA promulgated a new standard based onparticulate matter with a carefully defined upper size limit of 10 urn. A new reference method was also proposed. This new standard specifiesthe mass concentration of particulate matter less than 10 µm (PM-10)and sampled over a 24-hour period. The idea is to concentrate on thatportion of the total suspended particulate matter that is likely to bedeposited in the thoraic region of the human respiratory tract.
Because PM-10 is only a portion of TSP, the new standard is lowerthan the old NAAQS for TSP. The annual average and 24-hour averageprimary standards are 50 µg/m3 3and 150 µg/m , respectively. Thecorresponding secondary standards are the same as the primarystandards. Depending on the size distribution of the fugitive dustemissions these lower limits can make the extent of fugitive dustemissions more or less significant.
FUGITIVE DUST EMISSION SOURCES
Fugitive dust emission sources are of both natural andanthropogenic origin. Early work in the study of fugitive dustemissions was stimulated by soil erosion problems due to wind.Important anthropogenic sources, specifically industrial processes,include material transfer and conveying, loading and unloading,storage piles and unpaved areas and roads within industrialfacilities.
4

Material transfer is usually accomplished by means of belt, screwor pneumatic conveyors. A series of conveyors is usually used and thetransfer points are the major sources of dust emissions. Emissionrates for bulk materials are highly variable and often not known(Jutze et al., 1977). As a result, the effectiveness of controltechniques is not quantitatively determined with any great degree ofreliability.
Loading and unloading of bulk material from and to storage areother sources of dust emissions. Mechanical agitation, dissipation ofkinetic energy on impact and turbulence all lead to generation ofdust. Emission factors vary with product type, moisture content andvarious process parameters. Some quantitative data is available butis of questionable reliability (Jutze et al., 1977).
Large tonnages of bulk materials are often stored in open orpartially enclosed storage piles and storage may be for a short timewith high turnover or for a long time to meet cyclical demand.Storage pile operations leading to dust emissions include loading ontopiles, vehicular traffic, wind erosion and loadout from piles. Therelative importance of each of these operations depends on factorslike storage pile activity, pile configuration, method of loading andunloading, wind speed and precipitation. Emission factors (U.S.Environmental Protection Agency,al.,
1976) and various equations (Jutze et1977; Midwest Research Institute, 1977; Carnes and Drehmel, 1981)
have been developed, but they are of limited value for general use.
Roads on plant property can be another major source. Vehiculartraffic causes increased mechanical breakdown of material and suspendsparticulate matter in the air. The emission factor for roads has beenfound to be a function of silt content, vehicle speed and weight and anumber of equations have been developed (Jutze et al., 1977; MidwestResearch Institute, 1977; PEDCO Environmental, Inc., 1976).
FUGITIVE DUST MEASUREMENT METHODS
As discussed earlier, reference methods are available to quantifyemissions of particulate matter from ducted sources and so reliableemission factor data can be developed for such situations. However,no such single technique exists for the measurement of fugitive dustemissions. Existing methods can be divided into field scale andlaboratory methods. The field scale methods were aimed at developingemission factors on the basis of large-scale tests of full scalematerial handling operations.
The six most widely used field scale methods are
2.1. Upwind/Downwind sampling
Roof Monitor sampling3. Quasi-stack sampling4. Exposure profiling5. Wind tunnel method
5

6. Tracer method
Upwind/Downwind sampling (Kolnsberg, 1976) involves themeasurement of particulate matter concentration in the atmosphereupwind and downwind of the source. Meteorological parameters are alsosimultaneously measured. Based on the concentration map obtained andthe values of the meteorological parameters, Gaussian dispersionequations are used to back-calculate the source emission rate.
Roof monitor sampling (Kenson and Bartlett, 1976) involvessampling at building openings and has been used with indoor sources.Emission rates are calculated based on the measured concentration andthe exhaust flow rate through the opening. No meteorological data isneeded. Quasi-stack sampling (Kolnsberg et al., 1976) requirestemporarily enclosing the source and drawing off the emissions throughductwork and measuring particulate matter concentrations usingstandard stack sampling methods. Exposure profiling (Cowherd et al.,1974) is a multi-point sampling technique where particulate matterconcentrations downwind of the source are isokinetically determinedacross the plume cross-section. Emission rate is then calculated by amass balance approach. In the wind tunnel method (Cuscino et al.,1983) dust generated by wind blowing over an exposed surface ismeasured. A wind tunnel with an open-floored test section is placedover the surface to be tested and air is drawn at controlled
velocities. Isokinetic samples are collected and used to calculatedust concentrations. Finally, the tracer method (Hesketh and Cross,1983) consists of releasing a tracer at the dust source. Downwindfrom the dust source both dust and tracer concentrations aredetermined and based on this ratio and the quantity of tracer releasedthe dust emission rate is determined.
The field scale techniques described above were all developed andapplied to special situations and were often dependant on meteorology.The techniques are all complicated, time consuming and expensive.Because of the scale of the tests, the performance of dust suppressiontechniques cannot be easily and quickly determined. In addition,reproducibility is a major problem.
A number of smaller scale techniques for use in the laboratoryhave also been developed. A dedusting tower (Hoffmeister, 1979)consisting of a 8.6 cm diameter glass tube fitted with seven screenstages has been used. Air is sampled such that air flow iscountercurrent to a falling 250 ml sample at a velocity of 0.9 m/sec.Weight loss of the test sample is used to calculate dust emissionfactor. Another laboratory scale technique involves the use of aspouted bed arrangement (Kjohl, 1976) where 1.2 liters of sample areused in the spouted bed and the dusty air is sampled through a filterbag. Test conditions are such that particles up to 200 um aresampled. An analogous technique is one where a fluidized bed of 400grams of material, 10% test sample and 90 % sand, is used and thedust generated is sampled with a cascade impactor (Schofield et al.,1979). All these techniques are more representative of pneumatic type
6

conveying systems. The fluidized bed technique has been compared witha rotary drum technique and an impact type test (Higman et al., 1983).The impact type test involves dropping 300 grams of material into abox and exhausting the box through a cascade impactor (Wells andAlexander, 1978). All the above tests were more suited to powders andreproducibilty has been stated to be 15 % to 20 %. The small samplesizes lead to greater variabilities in dust measurement. In addition,for moderately dusty materials, the small amount of dust generatedwould require more accurate gravimetric analysis. None of the abovetechniques really simulate dust generation at transfer points.
A semi-field scale technique where 50 kg of coal was dischargedfrom a hopper in three minutes through a series of belt conveyors ontoa stockpile (Nakai et al., 1986) is more directly based on an impacttype dust generation process, as at transfer points. Dustconcentrations at a transfer point were measured with an opticaldevice and efforts were made to correlate emission factors withambient dust concentrations.
A number of methods based on some means of dropping a test samplein an enclosed space have been developed. A technique called thepowder spill test column (Cooper and Horowitz, 1986) uses 10 gramsamples which are dropped a distance of 1 m inside a 17 cm diametercolumn and the air is exhausted through a 47 mm filter at a flow rateof 52 liters/min. A particle size limit of 40 µm is stated. Anothertechnique used to evaluate spills and pressurized releases (Sutter etal., 1982; Sutter and Halverson, 1984) was based on a chamber 2.9 m indiameter and 3 m high where small quantities of the sample weredischarged and the air was sampled with high volume air samplers. TheASTM method for determining an index of dustiness of coal (AmericanSociety for Testing Materials, 1975) consists of a 1.5 m tall metalcabinet with a 0.46 m square cross-section. A minimum of 23 kg of thesample is placed on a tray within the cabinet and released at a 1.2 mheight. After 5 seconds two slides are inserted 0.6 m below therelease point and pulled out 2 minutes and 10 minutes afterwards. Thedust settled on the slides is gravimetrically analyzed andreproducibility of 20 % is claimed. Another technique used with coaluses a belt conveyor to discharge coal samples into a 0.46 m diameterchamber of variable height (Cheng, 1973). The chamber is evacuatedwith a high volume air sampler and dust is sampled with a cascadeimpactor. A variation of the chamber technique called the Totman dusttest device uses a 0.9 m tall chamber of 0.15 m x 0.2 m cross-sectionwith a chevron type internal material flow arrangement. Because ofthis arrangement, unlike other chamber techniques where only oneimpact is used, at least 4 impacts occur before the product comes torest. The air is sampled in a counter-current manner through afilter for gravimetric analysis. A review of these and otherlaboratory techniques has been published elsewhere (Hammond et al.,1985).
7

DUST SUPPRESSANTS
Coating agents have been applied to a very large number ofmaterials to suit many requirements which include moisture control,prevention of caking, providing slow release capability and reducingdustiness. The most commonly used dust suppressant is water. Whencoal moisture content was raised from 0.8 % to 1.5 % and mixed brieflyin a tumbler, the emission factor was reduced 70 % (Cheng, 1973)though excessive mixing created more dust due to breakage. This sameeffect has been reported with different kinds of coal (Nakai et al.,1986) and has been reported to cause agglomeration of coal dust. Anumber of studies have also documented the increased adhesive forcesbetween particles and surfaces with increased relative humidity due toformation of liquid bridges (Stone, 1930; Van Den Tempel, 1972;Larsen, 1958; Corn, 1961; Ketkar and Keller, 1975; Corn and Stein,1965). However, excessive moisture content with phosphate fertilizercan cause caking problems (Hoffmeister, 1979; Kjohl, 1976) anddecrease granule crushing strength (Kjohl, 1976), thus leading toincreased dustiness due to granule fracture and subsequent generationof fines.
The most common dust suppressant used in the fertilizer industryis oil. Oils with high viscosities are suggested to avoid the problemof absorption into granules and consequent loss of effectiveness(Hoffmeister, 1979). Oils with high paraffinic content are alsosuggested as effective dust suppressants for fertilizer (Frick, 1977).Extensive work is reported in patent literature on the use of coatingagents to increase granule strength, reduce caking tendency, reducedustiness and control moisture content. A list of patents ispresented in the Appendix. Coating agents used have included amines,mineral oils, surfactants, fillers, acids, waxes and many othermaterials. These patents and some others are reviewed elsewhere(Sarbaev and Lavkovskaya, 1978).
In the laboratory, dust suppressants have been applied in arotary drum where the granules and coating agent are both introduced(Hoffmeister, 1979). In actual industrial facilities coating agentsused are primarily petroleum oil blends and have been sprayed in screwconveyors, mixers, on belt conveyors, coolers and material transferpoints and sufficient mixing occurs so as to effectively distributethe coating agent (Achorn and Balay, 1974).
8

3. EXPERIMENTAL PROCEDURES
Extensive experimental work was carried out in order to establishthe nature and extent of the fugitive dust problem associated withhandling phosphate fertilizer. The apparatus and procedures used aredescribed in this chapter.
LABORATORY TESTS
Sample Preparation
A supply of uncoated granular phosphate fertilizer was aprerequisite to any experimental work. Samples of fertilizer wereobtained in quantities of at least 100 kilograms and stored in 19liter (5 gallon) plastic buckets with tight fitting lids. The samplebuckets were kept air tight during transfer from the field to thelaboratory. Fertilizer sampling locations were chosen with care andincluded belt conveyors, material transfer hoppers and storage piles.
A batch of uncoated fertilizer consisting of about 80 kilogramsof product was poured out of the buckets on to a clean plastic sheetlaid out on the floor, The pile of fertilizer was thoroughly mixed toensure that all parts of the pile were homogeneous. Five kilogramtest samples were then made by collecting 8 to 10 scoops of productfrom various parts of the pile and stored in polythene bags to providea stable environment for the sample. This technique was also usedwhen making test samples of coated fertilizer.
Five kilograms was chosen as the standard test sample size. Thissample size was considered to be large enough to overcome the possiblevariabilities in the fertilizer and more representative of the averagecharacteristics of the bulk material. This sample size was also themaximum quantity that could be conveniently handled without spillageduring experiments. In addition, the larger the test sample size thegreater the amount of dust generated and, hence, the greater theaccuracy of gravimetric analysis of the emitted dust.
Application of Dust Suppresants
In actual plant situations the dust suppressant is usuallyapplied on the fertilizer when it moves past a spray header on a beltconveyor or at a product transfer point. The dust suppressant isapplied as a spray produced either by a high pressure airless spraysystem or by a lower pressure air atomized spray system.
9

The dust suppressants tested have included vegetable andpetroleum based oils, waxes, petrolatums, emulsions and many othermaterials. Dust suppressants which were liquid at ambienttemperatures, were dispersed using an air atomized spray system at apressure of about 138 kPa (20 psig). A Sears Model 919.156580portable air compressor was used with a Sears Model 919.156140 spraynozzle for this purpose. This system was used because of itssimilarity to actual industrial practice, ease of use andavailability. This system was designed for use with dust suppressantswhich did not require special handling and whose viscosities atambient temperature were such that they could be sprayed directly.
However, waxes, which are solid at ambient temperatures, weresprayed either in the form of water based emulsions or melts. Some natural waxes were easily emulsified by a process of saponification.These waxes were tested in both forms, where possible. Emulsificationof petrolatum waxes required a more complicated process using specialemulsifiers and they were, therefore, sprayed only as melts.
The wax emulsions were sprayed without further treatment. Thenon-emulsified waxes, on the other hand, were first melted by puttingthem in a plastic container immersed in boiling water. Once heated toa temperature of about 75°C the liquid wax was sprayed using an airatomized nozzle (Spraying Systems #SU-1) in a siphon arrangement. Toprevent plugging problems due to solidification of wax, the nozzle washeated to an appropriately elevated temperature by using a heatingtape and variable transformer arrangement.
The test sample to be coated was retained in the storage bag forthe coating operation. The exposed surface layer was first sprayedlightly, then a new layer was created by mixing the bag contents andthis new layer was sprayed. This process was carried out till therequired amount of dust suppressant was added. The quantity of dustsuppressant added was determined by weighing the test sample beforeand after application of the dust suppressant by using a single panbalance with a 20 kg capacity. Once the coating operation wascomplete the coated sample was stored in the polythene bag pending thedrop test.
Measurement of Some Fertilizer Properties
Moisture Content. For the purposes of characterization ofvarious batches of fertilizer, moisture content was determined for atleast two test samples per batch of fertilizer. The technique usedwas that recommended by the Association of Florida Phosphate Chemists(Association of Florida Phosphate Chemists, 1980).
Three 2-gram samples were taken from each test sample to beevaluated and placed in a vacuum oven (Precision Model #19). Thesamples were subjected to a temperature of 50°C and a vacuum of 508 mmof mercury for 2 hours with a stream of dry air being circulated inthe oven. The weight loss of each of the three samples was determined
10

with an electronic single pan balance (Mettler Model #HK60) andconverted to a "percent moisture content" representation. The averagevalue for the three samples was calculated and used as a measure ofthe moisture content of the test sample.
Size Distribution. Size distribution of the granular fertilizerwas another parameter of interest. A sieving machine (Gilson Model#SS-15 Sieve Tester) with a set of 6 sieves was used. The sieves usedwere U.S. Standard 6, 8, 12, 16, 20 and 40 mesh. One-hundred-gramsamples were weighed out using an electronic single pan balance(Sartorius Model #2355) and then poured into the first sieve. Thesieving machine was operated for 10 minutes. At the end of thesieving cycle the size fractionated sample was collected in preweighedpetri dishes and re-weighed. The weights of the various sizefractions were then used to calculate the size distribution.
Crushing Strength. Crushing strength of a granule is a measureof the resistance to fracture. The technique used is also known asthe TVA method. (Hoffmeister, 1979). Size fractionated samples wereprepared with the sieving machine as described earlier. For aparticular size range a number of granules were placed on a single panspring balance with a weighing range of 0 to 10 kilograms. A load wasapplied on individual granules by pressing down on the granules with asteel rod. The scale reading at the point of granule fracture wasnoted and the average value for a number of granules was calculated.This procedure was carried out for the various size fractions toestablish the crushing strength distribution.
Emission Factor Measurement
Apparatus and Operating Procedure. Emission factors for coatedand uncoated fertilizer were measured by means of a "drop test" usinga vertical flow dust chamber (VFDC). The VFDC was an enclosureconstructed of 1.3 cm (1/2 inch) thick plywood (Figure 1). Theenclosure was 0.6 m (2 feet) square and 0.9 m (3 feet) high. The topof the enclosure had two openings: a 0.2 m (8 inch) diameter openinginto which a 0.6 m (2 foot) long duct was mounted and a 18 cm (7 inch)by 23 cm (9 inch) rectangular opening over which a high volume airsampler (General Metal Works Model #2000) was placed. A baffleseparated the two openings in terms of the air flow characteristics ofthe enclosure (Figure 2(a)). The test sample was introduced manuallythrough the 0.2 m diameter feed tube and fell 1.5 m before strikingthe floor. Dust was released during the pouring process and also whenthe sample struck the floor, due to the combined action of impactionand attrition. The released dust was picked up by the high volume airsampler and deposited on a filter for gravimetric analysis.
About 10 % of the samples in a batch of fertilizer were tested inan uncoated state to establish an emission factor in units of g/kg foruntreated fertilizer for that particular batch. The remaining sampleswere treated with the dust suppressants to be evaluated and thentested.
11

12


The test sample was first preweighed to the nearest gram with a20 kg capacity single pan balance and then transferred from theplastic storage bag to a pouring bucket. Four 20 cm x 25 cm (8 inch x10 inch) glass fiber filters were weighed using a single pan balance(Mettler Model #H6) equipped with a special attachment for weighingfilters. The VFDC was placed on a plastic sheet spread out on thefloor. The first filter was mounted on the high volume air samplerwhich was then placed over the enclosure opening as shown in Figure2(b)- The high volume air sampler was previously calibrated by usinga set of calibration orifices to develop a correlation between airflow rate and sampler pressure drop as measured by a magnahelic gage(Figure 3).
The air sampler was turned on and set to operate at a flow rateof 31 liters/sec, unless, specifically stated otherwise. The samplerflow rate was adjusted with a variable transformer. After 15 secondsthe test sample was steadily poured into the enclosure through thefeed tube in a pouring time of 60 seconds. After an additional 45seconds of operation the air sampler was switched off. Thus, thetotal run time of the sampler was 2 minutes and this was equivalent toa total of about 10 air changes in the enclosure, 5 of which wereduring material transfer.
After the first drop of the test sample the "dirty“ filter wasremoved from the air sampler and the test sample, now on the plasticsheet on the floor under the enclosure, was transferred back into thepouring bucket. The above procedure was repeated 3 more times. Theweight gain of the 4 filters was determined and normalized to given anemission factor in units of grams of dust per kilogram of test sample.The average value of the emission factors calculated for the fourfilters was determined and represented the average emission factor forthe test sample. This procedures was used to determine emission factorsfor uncoated and coated test samples. A measure of performance of acoating agent or dust suppressant was the dust release and was defined asthe ratio of the coated emission factor to the uncoated emission factorand expressed as a percentage.
Discussion. The VFDC configuration and test procedure describedwere established after an extensive evaluation of a number ofparameters. These included baffles, feed tube diameter, enclosureheight, air flow rate and material pour rate.
The baffle in the VFDC was introduced in the basic design tobetter define the air flow in the enclosure and to prevent possible"short circuiting" of the air flows at the enclosure inlet and outlet.Tests with granular triple superphosphate (GTSP) showed that thepresence of the baffle did have a small, but not negligible, effect onmeasured emissions. The principal value of the baffle, however, wasthat it permitted a clearer mathematical description of the air flowin the enclosure. Dust emission factors for test samples were measuredusing a "drop test" procedure as described earlier. Four drops wereperformed per test sample in a "drop test" as a matter of practice. This
14

15

was done in order to obtain an average value for the dust emissionfactor. A single drop would usually, but not always, represent a maximumemission from the test sample and would not be representative of anaverage emission resulting from a series of handlings of that same testsample. Four drops would thus permit a more representative estimate ofdust potential of a test sample, especially when comparing differentmaterials.
The effect of various feed tube diameters was also evaluated. Asshown in Table 1 the diameter of the feed tube affects the velocity ofthe air at the inlet and so measured dust emission factors were higherfor the smaller diameter feed tube. However, both the 0.15 m and 0.25m diameter feed tubes were found to be not quite convenient forregular operational use. Therefore, a 0.20 m diameter feed tube sizewas used as standard. The 0.6 m length was chosen because this wouldmake the effective height of fertilizer discharge from the pouringbucket, 1.5 m from the ground. A height greater than this would havemade the process of fertilizer discharge, which was manual, veryinconvenient.
Enclosure heights of 0.9 m and 1.5 m were considered next. Theeffective fertilizer discharge height was 1.5 m for bothconfigurations. The configuration with the 0.9 m enclosure was asshown in Figure 1 while the configuration with the 1.5 m enclosureheight had the feed tube projecting into the enclosure rather than outof it. Results of tests conducted with phosphate rock and white sand(Table 2) show that the measured dust emissions were consistentlyhigher with the 0.9 m enclosure, probably because of a smaller volumeof dead space and a shorter distance between the point of dustemission and the air sampler. The difference in measured emissionfactor was of the order of 10% and so this factor did not play amajor part in the eventual selection of an enclosure height. The 0.9m enclosure was selected as standard because it was much easier tomove around due to its lower weight and smaller dimensions.
Using the standard inlet size and enclosure height, the effect ofthree different air flow rates was evaluated. The air flow rate wasvaried by changing the applied voltage to the air sampler. Themaximum possible air flow rate was found to be about 35 liters/secand, as shown in Figure 4, operating the sampler at this condition didnot result in a significant increase in measured dust emission. Aflow rate of 31 liters/sec was chosen as an optimum value for emissionfactor measurement tests. It was observed that a flow rate of 21liters/sec resulted in emission factor measurements which were 21 %lower than that at 29 liters/sec and that the air flow rate had anonlinear effect on measured dust emission factor. If the air samplerwas operated at a flow rate of 26 liters/sec instead of the optimum 31liters/sec, the deviation in the measured dust emission factor wouldbe less than 10 %.
16

17

18

19

20

Material pour rate was varied by pouring 5 kilogram test samplesof GTSP in three different pour times, viz., 30, 60 and 90 seconds.As shown in Table 3, for the pour times evaluated, the variations inmeasured dust emission factor as determined by the "drop test" werenot extreme for moderately dusty materials like GTSP. For operationalreasons, the 60-second pour time was found -to be most convenient andwas thus established as the standard pour time. Tests conducted withphosphate rock, a significantly dustier material, showed that pourrate did have a more significant impact (Figure 5) though the measuredemission factor was that from a single drop. However, the 60-secondpour time is still a valid selection since relative dust emissionfactor is the primary parameter of interest.
The cross-sectional area and air flow rate were selected so thatthe particle collection characteristics of the VFDC would be similarto that observed with the high volume air sampler operating in astandard housing as used for ambient air sampling. The VFDC testprocedure simulates the process of dust generation due to handling ofbulk materials as at transfer points in material conveyors andunloading stations.
Both VFDC configurations were calibrated with monodisperseammonium fluorescein aerosols and glass beads. The monodisperseammonium fluorescein aerosols were generated with a vibrating orificeaerosol generator (TSI Model #3050) while the monodisperse glassbeads, purchased commercially, were dispersed from a flask bycompressed air. The fractional penetration of particles of varioussizes was determined gravimetrically for glass beads andfluorimetrically for ammonium fluorescein aerosols. With the airsampler operated at 26 liters/sec the particle penetrationcharacteristics of the two units were found to be almost identical(Figure 6). The measured 50 % cut point for both units, whenoperated in an identical manner, was found to be 40 µm.
In summary, the standard VFDC configuration used was like thatshown in Figure 1. Five kilogram test samples were standard as was a60 second pour time, a 2 minute air sampling duration and an air flowrate of 31 liters/sec.
Dust Size Distribution Measurement
The size distribution of dust emitted due to handling of variousmaterials was measured using single stage impactors like that shown inFigure 7. For a given flow rate the 50% cut size can be changed bychanging the flow area in the impactor or, correspondingly, by usingseparate single stage impactors with different nozzle widths. Threeimpactors with 50% cut sizes of 42 µm, 25 µm and 13.6 µm whenoperated at 30 liters/sec were used. The calibration of the singlestage impactors has been described elsewhere (Vanderpool, 1983).
The impaction surface was prepared by lining it with aluminumfoil cut to size and then coated with a silicone spray and weighed.
21

22

23

24

The first impaction surface was mounted in the nozzle section of the42 µm impactor. Four spacers were placed on the rear side of theimpaction surface and the first pre-weighed filter was laid over it.The high volume air sampler was then mounted on the impactor andbolted in place. The impactor-high volume air sampler assembly wasthen placed over the enclosure opening. The procedure was thensimilar to that for the first drop of the "drop test" for emissionfactor measurement. For each test a new sample was used. At the endof the first drop the impaction surface and filter were carefullyremoved. Prior to the next drop of the test sample the secondimpactor nozzle was set up and a similar assembly and test procedurefollowed. After the third drop test with the third impactor nozzlethe weight fractions on the impaction surface and filter weredetermined and the size distribution calculated.
INTERMEDIATE SCALE FIELD TESTS
Apparatus and Operating Procedure
From extensive laboratory experiments it was apparent that fullscale field tests to demonstrate the validity of laboratory resultswould be much more likely to succeed if intermediate scale tests werefirst performed. The intermediate scale field tests were designed toevaluate possible scale-up problems and to determine the influence ofvarious operating conditions.
An intermediate scale field test (ISFT) setup was designed tohandle a minimum of about 70 kilograms of fertilizer at a maximum feedrate of about 10 tons per hour. The setup was composed of two majorcomponents which included the fertilizer handling system and thecoating agent spray system.
The fertilizer handling system consisted of feed and dischargehoppers and a belt conveyor. The system was made portable by mountingthe conveyor and feed hopper on a modified boat trailer. The boattrailer was a Harding Model #B-16-7 unit with an overall length ofabout 5.2 m and a 320 kilogram load capacity. The conveyor and feedhopper support structure was made of 5 cm x 10 cm (2 inch x 4 inch)pressure treated wood and was attached to the boat trailer frame with"U" clamps. The trailer was equipped with a seven foot long toungewhich was removed once the setup was put in place.
A general drawing of the fertilizer handling system is shown inFigure 8(a). The conveyor selected was a slider bed type conveyor(Hytrol Model #TT "Thin Trough" conveyor) where the belt runs in atrough cross-section frame as shown in Figure 8(b)(i). This type ofconveyor had the advantage that the probability of spillage wasreduced and the belt, when in operation, would be relatively smoothrunning and vibration free. The conveyor weight was about 200kilograms and was thus ideally suited for light duty use as in thepresent application. The overall bed length was 4.9 m and the beltwas driven by a 3/4 HP motor at a speed of 25 cm/sec through a
25

26

combination belt and chain drive. The conveyor belt speed could bechanged by changing the sprocket in the chain drive.
The conveyor was mounted on the wooden support structure on thetrailer at an angle of about 15 degrees by using 3 supports ofappropriate height so that the conveyor discharge was about 1.8 m fromthe ground. The support heights were adjustable and allowed avariation of a few degrees in the conveyor inclination if such anadjustment was desired. The belt tension could also be adjusted byusing tensioning screws provided. The feed hopper was held in placeover the belt in a slotted angle frame so that the relative positionof the hopper discharge with the belt surface was fixed. The hopperwas made of 1.9 cm (3/4 inch) plywood and painted so as to resistattack by the fertilizer. It had an approximate capacity of 255liters or, equivalently, about 250 kilograms of fertilizer. Thedownstream end of the hopper discharge was equipped with an adjustablealuminum slide plate as shown in Figure 8(b)(ii) to allow a measure ofcontrol over the product discharge rate from the hopper. The twosides and the upstream end of the feed hopper discharge were equippedwith rubber skirts to prevent spillage and to allow fertilizer flowonly in the direction desired. The support structure overhanging thetrailer frame was propped up by concrete blocks when the system was inuse.
The discharge end of the conveyor was semi-enclosed in anenclosure made of two 0.9 m sections of 0.51 m diameter galvanized.pipe. A slot was cut along the circumference so that the dischargeend of the conveyor was enclosed and the fertilizer discharge was downthe axis of the pipe. The top of the pipe was covered and bottom ofthe pipe was lower than the top of the discharge bin (Figure 9). Thisenclosure helped to protect the spray droplets and the fertilizerdischarge stream from the effects of wind. In addition to theconveyor supports mounted on the trailer support structure, a fourthsupport made of 5 cm x 10 cm pressure treated wood and slotted angleiron was used to support the overhanging discharge end of the conveyorwhere the motor and drive weight was concentrated. This support wason the ground and was removable (Figure 10).
speedThe fertilizer feed rate could be adjusted by changing the beltor by changing the feed hopper discharge characteristics. The
conveyor was equipped with a single speed motor and so the belt speedcould be varied only by changing the sprocket in the chain drive, Itwas much easier, on the other hand, to control the feed hopperdischarge rate. The width of the hopper discharge was about 20 cm andso the bead laid out on the belt was about 20 cm as shown in Figure11. However, the thickness of the bead could be easily varied byadjusting the slide plate. The feed rate could thus be varied fromabout 4 tons per hour to about 10 tons per hour by using the slideplate arrangement.
27

Figure 9. Photograph of the front view of the inter-mediate scale field test setup.
28

Figure 10. Photograph of the side view of theintermediate scale field test setup.
29

Figure 11. Photograph of the feed hopper discharge.
30

Figure 12. Dust suppressant spray system used for the intermediate scale fieldtest setup.

A line drawing of the coating agent spray system is shown inFigure 12. The spray system was designed to transfer a controlledamount of coating agent on to the fertilizer granules. The basicspray system included a portable air compressor (Sears Model#919.156580), two Fitz & Fitz 1.9 liter pressure containers and 2nozzles. The nozzles used were of the pressurized liquid type(Spraying Systems Catalog #1/4TT-730039). The compressed air supplywas divided into two streams, each passing through a pressurecontainer. The pressure containers were rated at a peak liquidpressure of about 414 kPa (60 psig). Each pressure container had twooutlets used to provide separate air and liquid flows for airatomizing nozzles. The air outlet was capped off since thepressurized liquid nozzles did not need atomizing air. All liquidlines were 9.5 mm (3/8 inch) diameter copper tubing. The coppertubing and nozzles were heated by heating tape while the pressurecontainers were heated by heating mantles. All heaters werecontrolled by variable transformers. Since petrolatum waxes were theprimary coating of interest, the pressure containers were maintainedat a temperature high enough to keep the petrolatum waxes molten andliquid lines were heated to prevent solidification in the lines. Theliquid feed was controlled by adjusting the regulator pressure on thepressure containers. The nozzles were in an opposing jet arrangementabout 25 cm from each side of the fertilizer discharge stream andabout 15 cm below the discharge end of the conveyor.
At least 3 buckets (about 70 kilograms) of fertilizer were usedin each test. Three 5 kilogram samples of the uncoated fertilizerwere first prepared in the standard manner. The remaining uncoatedfertilizer was then poured into the feed hopper. The line heaters andheating mantles were all energized and the nozzles were calibratedprior to the test by timing the consumption of a known amount of hotwater. This also helped to heat the lines and clean them. Hot waterwas poured into the pressure containers and the water temperature wasmaintained by means of heating mantles. The wax being tested wasweighed out into two plastic bottles which were then placed in abeaker of boiling water till the wax was completely melted. Thebottles were then placed in each of the two pressure containers. Inthis manner the wax was not subjected to excessive local heating, thepressure containers were easily cleaned after use, successive testscould be conducted more rapidly and cross contamination was not aproblem. After allowing sufficient time for the nozzles and fluidflow lines to heat up and setting the hopper discharge, the conveyorwas turned on. The wax spray was initiated so as to coincide with thefertilizer discharge from the conveyor. When all the fertilizer wasused up the wax spray was discontinued by disconnecting the air supplyat the quick disconnect and relieving the line pressure by using thepressure relief valve on the pressure container. Operating parameterssuch as the hopper discharge setting, fertilizer weight, weight of waxconsumed, wax temperature and the wax and fertilizer feed times werenoted. During the test the fertilizer was discharged into thedischarge bin. After the test was complete the fertilizer in the binwas stirred by using a shovel and then stored in 19 liter buckets. Two
32

to three test samples of coated fertilizer were then made in thestandard manner for later testing. To verify that the nozzles did notplug during the test the nozzle calibration for water was rechecked. Atthis point the next test , if planned, was performed by simply replacingthe wax sample bottles and recharging the feed hopper with a new batch ofuncoated fertilizer.
Discussion
The development of the ISFT setup and operating procedures was anevolutionary process. Preliminary tests were conducted without thedischarge enclosure, but excessive fertilizer dust and wax spray blow-off led to the addition of the discharge enclosure.
Before reaching a decision on the use of the pressurized liquidnozzles, air atomized nozzles were evaluated. Both internal mix andexternal mix nozzles were considered. In using the air atomizingnozzles the air outlet from the pressure container was connected tothe nozzle by an air hose. In the internal mix type nozzle,compressed air and liquid are mixed within the nozzle and then ejectedfrom the nozzle. However, wax solidification due to excessive coolingand losses by overspray due to extreme atomization were continualproblems. Modification of the setup by regulating the air pressure tothe nozzle did not significantly improve the problem nor did the useof 4 nozzles, each with half the capacity of the nozzles in the 2nozzle arrangement. The external mix nozzles did not have the samewax solidification problem but overspray losses were still excessive.With the pressurized liquid nozzles, nozzle plugging due to waxsolidification was no longer a problem and overspray losses were muchreduced due to the coarser droplets produced.
The two nozzles were placed 15 cm below the discharge end of theconveyor, one on each side of the fertilizer discharge. Because ofthe close proximity of the nozzle to the underside of the belt, over aperiod of time the belt had a tendency to get coated with wax and so adeflector shield was installed. The nozzles were originally placed 15cm from the fertilizer surface but at this distance the spread of thespray was insufficient. to cover the width of the fertilizer discharge.So, the nozzles were moved back to a distance of 25 cm from thefertilizer discharge.
FULL SCALE FIELD TESTS
Apparatus and Operating Procedure
Full scale field tests were conducted at a fertilizer shippingfacility (Agrico Chemical Co., Pembroke Road, Gibsonton, Florida).This facility handles granular triple super phosphate (GTSP) andphosphate rock. The GTSP was transported to this facility fromthe fertilizer plant by trucks in a travel time of about 1 hour. Thefertilizer handling setup was as shown in Figures 13 and 14(a) withair samplers placed within the storage building as shown in Figure
33

Figure 13. Photographs of the full scale field testfacility.(a) truck unloading station (b) transferpoint #2 (c) transfer point #3.
34
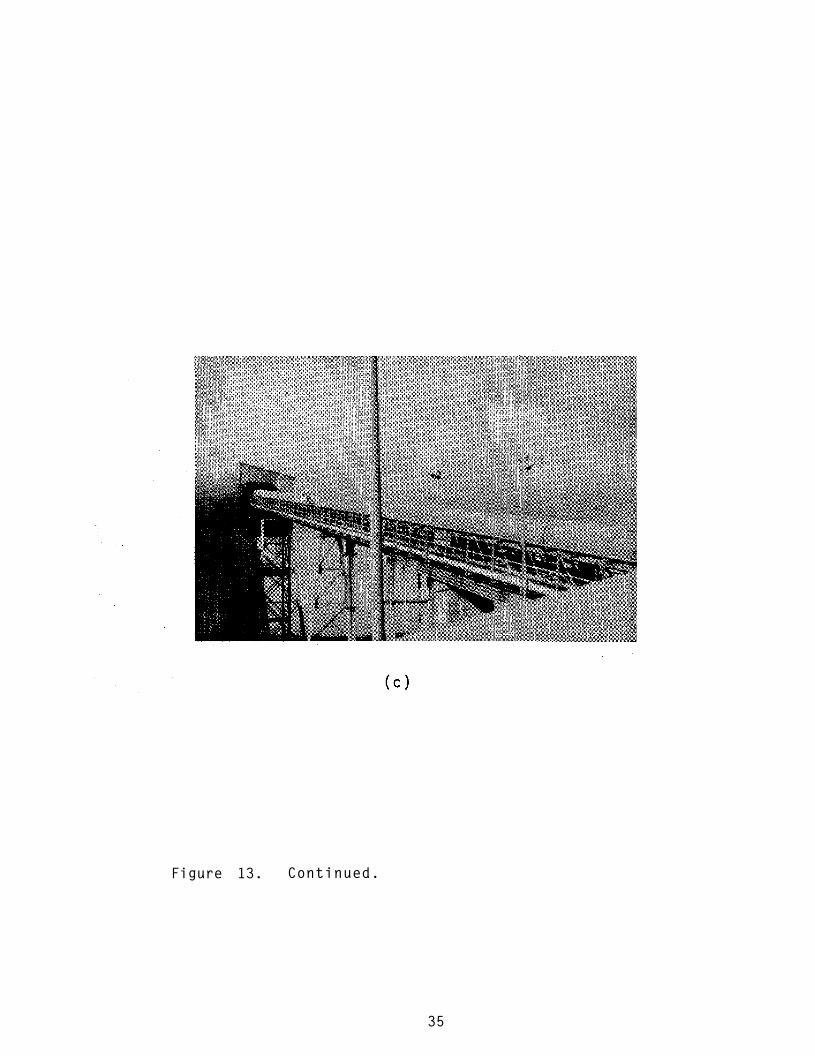
Figure 13. Continued.
35

Figure 14. Details of the full scale field testfacility.(a) fertilizer handling system.(b) air sampler locations.
36

Figure 15. Dust suppressant spray setup for the full scale field tests.

14(b). The nominal fertilizer handling rate was 250 tons/hour.
The coating agent spray system was designed within the facilityconstraints to provide a maximum spray rate of about 19 liters/min (5gpm) at about 414 kPa. Petrolatum waxes were acquired in 208 liter (55gallon) drum quantities. The spray setup was as shown in Figure 15.The pump used was a Liquiflo Series 86 Eccentric Impeller pump with a3/4 H.P., 110V motor. The flowmeter used was an Erdco Series 400vane-type flowmeter. Valve 1 was a bypass valve used as flow control,Valve 2 was a 3-way valve used to switch the flow from recycle mode tospray mode and Valve 3 was a 1/4 turn valve used to control the supplyof compressed air. All flow lines were 1.9 cm and 1.3 cm. black ironpipe and were heat traced with 220V heating tape and insulated. Fournozzles were aligned 46 cm (18 inch) apart along the axis of the beltconveyor between transfer point #1 and #2.
The drum of wax was heated by 2 drum heaters (Briskeat Catalog#SRL-A-DHC-1200) with integral temperature controllers being used toset the temperature at about 150°C and insulated with fiberglassinsulation. The drum heating process was begun 12 to 24 hours priorto actual use. The line heaters were then energized and heating wascontrolled by a variable transformer. The pump intake was equippedwith a suction filter (Spraying Systems Catalog #HSW) to strain outparticulate matter. Four pressurized liquid type nozzles were cleanedin hot water and mounted in the spray manifold. Each nozzle wasequipped with a 50 mesh strainer. Valve 2 was first set to position 1to permit use of the system in recycle mode, Valve 1 was openedhalfway and the pump was then turned on. The liquid wax was permittedto circulate through the system so that all the lines and componentscould be evenly heated. The pump intake was securely tightened so asto prevent air infiltration which could cause the liquid wax to foam.A yardstick was taped to the inside of the drum to permit a secondarymeasure of liquid consumption.
The oil supply to the existing oil spray system was first shut off.Once a truck started unloading its load and the fertilizer appeared onthe belt between transfer point #1 and #2, the fertilizer was allowed torun uncoated for about 45 seconds. The liquid wax was then switched fromthe recycle mode to the spray mode by switching Valve 2 to position 2.Valve 2 was then adjusted to set the flow rate at the required level asindicated by the flowmeter. It took 30 seconds for material transferfrom transfer point #1 to transfer point #2, 45 seconds for materialtransfer from transfer point #2 to transfer point #3 and 30 seconds formaterial transfer from transfer point #3 to transfer point #4. A bucketwas half-filled with uncoated fertilizer sampled at transfer point #2 andthen 2 buckets of coated fertilizer were sampled at transfer point #4 aminute after wax coated product appeared. Once the coated samples werecollected Valve 1 was used to reduce the liquid spray rate by recyclingpart of the pumped liquid back to the reservoir and Valve 2 was set toposition 1, to put the spray system in recycle mode. The half filledbucket of uncoated fertilizer was then completely filled at transferpoint #2. By measuring the fall of the liquid level in the drum and the
38

time of consumption, the application rate was calculated as a check ofthe flowmeter. If more than a few minutes wait was anticipated betweenruns compressed air was blown through the nozzles by switching Valve 3 tothe "on" position. Compressed air was provided by a portable aircompressor (Sears Model #919.156580). In this manner, nozzle pluggingwas avoided. At the end of a series of tests hot water was circulatedthrough the spray system in the recycle mode to clean out as much waxfrom the lines as possible. No attempt was made to spray water throughthe system in the spray mode because of possible caking problems whichcould occur in the vicinity of the conveyor.
The coated samples collected were brought back to the laboratoryand 5 kg test samples were prepared for further analysis in thestandard manner.
Discussion
The location for conducting the field test was chosen based on anumber of factors, the most important of which was familiarity withthe facility. Power outlets were easily accessible, fertilizersampling locations were convenient and the design of the fertilizerhandling system was such that the coating spray system could be .situated in a compact way not too far away from the spray location.
The pump selected was of an eccentric impeller design with a highdensity polymer impeller. The maximum pressure and temperatureratings were 1103 kPa and 9O°C, respectively. This pump wasconsidered ideal for the present application because the liquid to bepumped was clean and a lubricant. No pressure gages were installedbecause of the possibility of fouling the internal parts of the gageby solidifying wax. For this same reason a "sight gage" type vaneflowmeter was selected for flowrate measurement. The deflection ofthe vane was a measure of flow rate. In addition, line plugging couldbe signaled by the "see through" window in the flowmeter. Pressurerelief was provided by a plastic coupling rated at 828 kPa.
The pump and compressor both had 110 V motors and the powersupply was routed through a 15 amp circuit breaker. As a result, whenthe compressed air tank was full the cycling of the compressor causedthe breaker to trip due to the high starting current of the compressormotor. Thus, in order to operate the pump and compressorsimultaneously, a bleed valve was installed in the compressor outletso that the compressor would run continuously without shutting off.
Various combinations of spray location and nozzle size wereevaluated and the results are discussed in a later chapter.
39
4. RESULTS AND DISCUSSION
Extensive evaluations were conducted during the course of thisstudy. Results presented in this chapter are divided into separatesections: laboratory tests, intermediate scale field tests (ISFT) andfull scale field tests (FSFT). Criteria for the selection of dustsuppressants are also discussed.
LABORATORY TESTS
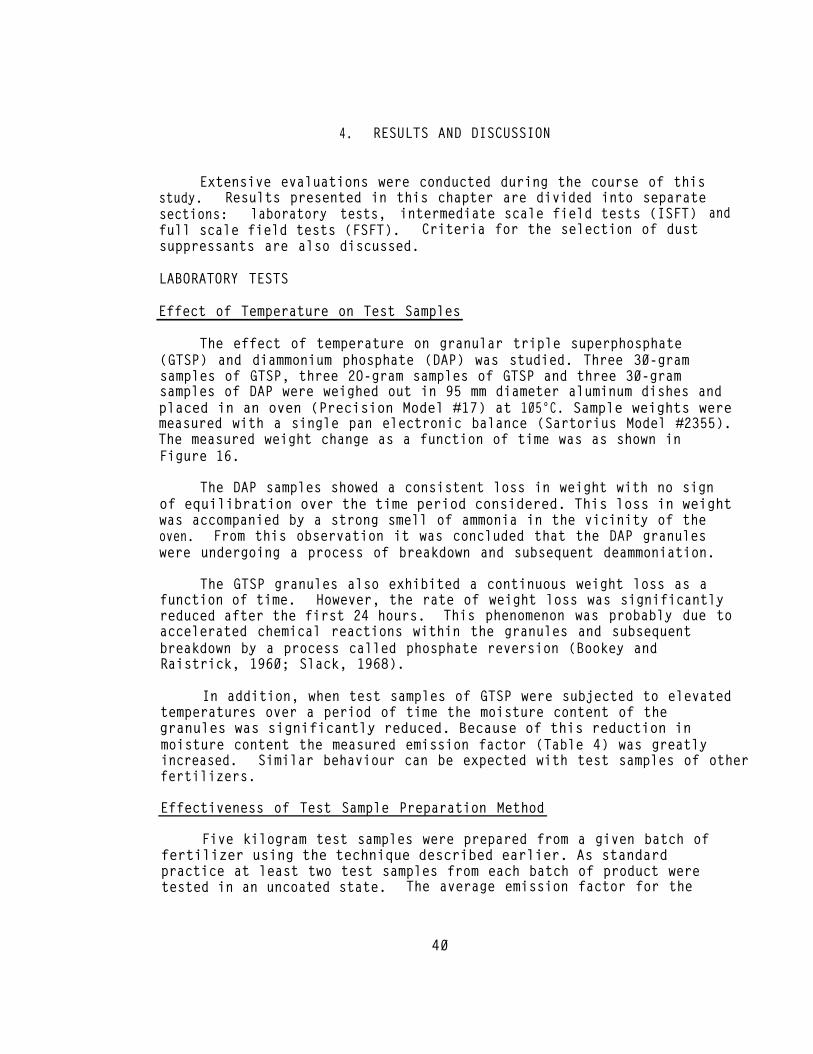
Effect of Temperature on Test Samples
The effect of temperature on granular triple superphosphate(GTSP) and diammonium phosphate (DAP) was studied. Three 30-gramsamples of GTSP, three 2O-gram samples of GTSP and three 30-gramsamples of DAP were weighed out in 95 mm diameter aluminum dishes andplaced in an oven (Precision Model #17) at 105°C. Sample weights weremeasured with a single pan electronic balance (Sartorius Model #2355).The measured weight change as a function of time was as shown inFigure 16.
The DAP samples showed a consistent loss in weight with no signof equilibration over the time period considered. This loss in weightwas accompanied by a strong smell of ammonia in the vicinity of theoven. From this observation it was concluded that the DAP granuleswere undergoing a process of breakdown and subsequent deammoniation.
The GTSP granules also exhibited a continuous weight loss as afunction of time. However, the rate of weight loss was significantlyreduced after the first 24 hours. This phenomenon was probably due toaccelerated chemical reactions within the granules and subsequentbreakdown by a process called phosphate reversion (Bookey andRaistrick, 1960; Slack, 1968).
In addition, when test samples of GTSP were subjected to elevatedtemperatures over a period of time the moisture content of thegranules was significantly reduced. Because of this reduction inmoisture content the measured emission factor (Table 4) was greatlyincreased. Similar behaviour can be expected with test samples of otherfertilizers.
Effectiveness of Test Sample Preparation Method
Five kilogram test samples were prepared from a given batch offertilizer using the technique described earlier. As standardpractice at least two test samples from each batch of product weretested in an uncoated state. The average emission factor for the
40

Figure 16. Weight loss due to heating of GTSP and DAP samplesas a function of time.
41

42

batch and the deviation of the emission factor of each individualsample from the average emission factor was calculated. This averageemission factor represents the baseline emission level prior totreatment while the deviation is a measure of relative producthomogeneity with regard to dust emissions.
Specific results for test samples from three batches offertilizer are shown in Table 5. A scatter diagram of measureddeviation for 178 samples of fertilizer from 89 distinct batches isshown in Figure 17. From these results it is evident that the samplepreparation method and the measurement method were very effective.The average deviation from the average emission factor was about 3.5 %and 97% of the samples had a deviation of less than 10 % from theaverage emission factor. Thus, the calculated average uncoatedemission factor for a batch can be considered to be representative ofthe whole batch. In addition, since dust suppression effectiveness isa function of the ratio of coated to uncoated emission factor, anaccurate value of uncoated emission factor improves the quality of thecalculated effectiveness.
Because of the reproducibility of the emission factormeasurements, this technique was used to screen materials fromdifferent sources (Table 6). Dust emission factors in the 0.005 g/kgto 0.1 g/kg range were measured for various products from manysources. This technique was also used to monitor the variation ofproduct quality, as shown in Table 7. For a particular source themeasured dust emission factor varied between 0.03 g/kg and 0.08 g/kgover a period of time.
Granule and Dust Characteristics
Moisture, both surface and chemically bound, is present in thefertilizer granules and, as discussed earlier, sustained hightemperatures lead to moisture loss and severe increases in dustemissions. This suggests that increased moisture content should havethe opposite effect. The validity of the above observation was borneout by the results shown in Figure 18. Four samples of GTSP frombatch A and three samples of GTSP from batch B were used. For batchA, sample #1 was dried, sample #2 was left untreated and sample #3 andsample #4 were sprayed with known amounts of water to raise theirmoisture content. For batch B, sample #1 was left untreated andsample #2 and sample #3 were sprayed with known amounts of water toraise their moisture content. The results of drop tests clearly showthat just a 20 % increase in moisture content resulted in significantdecreases in dust emission factor and it appeared that a moisturecontent of about 1.5 % for GTSP samples could be very beneficial asfar as dust emission reduction was concerned.
Since moisture plays such an important role in determiningproduct dustiness, a test was conducted to establish if there was anyvariation in measured moisture content as a function of time ofstorage. Three 2- gram samples were taken on 3 successive days from a
43

44

Figure 17. Deviation of the emission factor ofindividual samples from the averageemission factor for that batch.
45

46

47

Figure 18. Effect of the moisture content on the emissionfactor of GTSP samples.
48

5-kg test sample of GTSP and moisture content was measured in themanner described earlier. Results in Table 8 show that there was nosignificant change in moisture content over the time period consideredand, correspondingly, the dust emission factor can be considered to beunaffected by storage, at least in the short term.
The standard test procedure for the measurement of moisturecontent specifies 2-gram test samples. But, a series of tests withlarger sample sizes were carried out to determine if sample size was asignificant factor in the measurement. Results of tests withuntreated fertilizer (Table 9) show that the measured moisture contentwas quite insensitive to sample size when the fertilizer was notsprayed with water after manufacture. However, if in an effort toincrease moisture content, water was externally sprayed on the 5-kgtest sample, the smaller 2-gram sample results in erroneous andscattered results (Table 10). On the other hand, 10-gram samplesresulted in a significantly better determination of measured moisture.
Size distributions of DAP, GTSP and MAP samples from differentmanufacturers were determined by sieving 100-gram samples for 10minutes in a Gilson Model #SS-15 Sieve Tester. Calcined phosphaterock and fine grain white sand were also sieved as a comparativemeasure. Results of these sieving tests (Table 11 and Table 12) showthat the granular product was generally in the 2.0 mm to 2.5 mm rangeand the size distribution was fairly narrow. The various sizefractions were tested for granule hardness or crushing strength by theTVA method described earlier. Results show that the measured crushingstrength increased with increasing granule size as has been observedelsewhere (Jager and Hegner, 1985). For the samples tested, MAPgranules were stronger than DAP granules, which were, in turn,stronger than GTSP granules (Figure 19).
Since product dustiness was determined by drop tests, experimentswere conducted to determine if granule fracture, a possible mode ofdust generation, was measureable. One-hundred-gram samples wereextracted from 5-kg test samples before and after a complete "droptest" and sieved in the standard manner. The difference in measuredsize distribution for DAP and GTSP samples was not significant andcould have been due to sampling variabilities (Table 13). This samebehavior was exhibited by phosphate rock and white sand. However,though the dry sieving technique used was not sensitive enough todetermine if granule fracture occurred, the results do show that itwas not significant.
Similar tests were conducted with prilled sulfur, a brittlematerial, and the results are presented in Figure 20. With increasedhandling the size distribution exhibited a distinct shift toward thesmaller particle sizes with a corresponding increase in the fraction ofsmall particles. Examination of the samples also verified thatsignificant granule fracture occurred. A similar process has been foundto occur with coal, char particles and detergents (Arastoopour and Chen,1983; Goodwin and Ramos, 1987; Knight and Bridgewater, 1985).
49

50

51

52


54

55

56

57

Further study of the drop-wise change in dust emission factor(Figure 21) indicated the significant difference in response tohandling between sulfur and the other products. The dust releaseprocess is a function of the fracture tendency of materials. Dustrelease from sulfur was due to significant breakage of prills whilewith the other materials fracture was not a significant source ofdust.crystal
The dust was probably due to fines in the sample, breakage ofgrowths on the granule surface (Figure 22) and release of dust
bound to granule surfaces by physical forces. The existance ofcrystal growths has also been documented elsewhere (Hoffmeister, 1979;Kjohl, 1976; Jager and Hegner, 1985).
The dust size distribution for various products was measuredusing the technique described earlier. Products used included GTSP,DAP, phosphate rock and white sand. Tests were initially conductedwith the Andersen and University of Washington Mark III multi-stageimpactors. These tests were not successful because the optimumoperating characteristics of the multi-stage impactors were notcompatible with the drop test apparatus and operating conditions. Theabove multi-stage impactors were designed to measure particle sizedistributions in the approximate 0.4 µm to 15 µm size range with asample flow rate of about 7 liters/min to 21 liters/min. To ensurethat a representative sample was collected, isokinetic sampleconditions had to be maintained by an appropriate selection of nozzlediameter and sample flow rate and this required the use of a highlyflared short nozzle. By replacing the wood panel of one side of theVFDC with a plexiglass sheet it was possible to visualize the' flowpattern of smoke injected into the VFDC. This evaluation revealedthat the flow field had characteristics which prevented accuratesampling with the multi-stage impactor setup used.
Tests were later conducted with a set of 3 single stage impactorsused in the manner described earlier. Use of the single stageimpactors did not interfere with standard VFDC operation and theoperating conditions were exactly the same as that of the VFDC. Thethree single stage impactors were used at a flow rate of 29.7liters/sec (63 scfm) and the corresponding 50% cut points were 42uma, 25 uma and 13.6 uma, respectively. The measured mass mediandiameter (MMD) and geometric standard deviation (GSD) for GTSP, DAP,phosphate rock and white sand were 12 uma and 2.2, 17.5 uma and 1.7,25.5 uma and 1.8 and 7.4 uma and 3.2, respectively (Figures 23 and24). The aerosols from the fertilizer samples were mostly larger than10 µm though, with GTSP, a significant mass fraction was less than 10µm, and with white sand a major fraction was less than 10 µm. The 10µm size is important because of recent regulations regarding particleemissions in the less than 10 µm size range and their possible healtheffects.
58

59

Figure 22. Photograph of crystal growth on MAPgranules.
60

61

Figure 24. Size distribution of the dust emittedby handling of white sand and phosphaterock.
62

Product Treatments
Three principal types of fertilizer were used in the evaluationof proposed dust suppression agents. These were granular triplesuperphosphate (GTSP), diammonium phosphate (DAP) and monoammoniumphosphate (MAP). Dust suppression agents used included oils, waxes,emulsions and other miscellaneous materials.
Oils. The kinematic viscosities of various oil blends in actualindustrial use, were measured using Cannon-Fenske type glass capillaryviscometers according to procedures described in ASTM method D445-82.These oils were then applied in the standard manner to GTSP samples.The coated samples were drop tested immediately and again after anaging period. In general, the test results (Table 14) reveal that foroils with kinematic viscosities in the 50 to 250 centistokes range theperformance was poor. In addition, as the viscosity decreased theperformance decreased. Tests were also conducted with naphthenic oilswith kinematic viscosities of 105, 410 and 755 SUS, respectively.Results (Table 15) again show a definite decrease in dust release withincreased kinematic viscosity, but with aging the performance wasagain severely degraded as manifested by the increased dust releasevalues.
It has been stated in literature (Frick, 1977) that the dustsuppression effectiveness of oils improves with increasing paraffiniccontent. The aniline point represents the relative paraffinic contentof oils and is a commonly used measure. Paraffinic oils with anilinepoints in the 102°C to 121°C range were acquired from 2 manufacturersand sprayed on GTSP samples. Drop-test results (Table 16) do, indeed,show that increased aniline points lead to decreased dust release, butthe performance was still average.
A number of other oils, including petroleum and vegetable oilblends, were evaluated. The results show that most of the oilstested with GTSP (Table 17) exhibited increased dust release withincreasing age though some oils retained their effectiveness to agreater extent. Most of the oils tested on DAP (Table 18), on theother hand, showed low initial dust release levels and smallerincreases in dust release with age.
In summary, of the oil blends tested only some had low initialdust release values (better than 10 %) and even fewer had low finaldust release values when used with GTSP. With DAP all the oils testedhad low dust release values and exhibited small increases in dustrelease with age. This product specific behavior was probably causedby differences in the interactions at the substrate oil interfaceleading to migration of the oil from the granule surface to thegranule interior at different rates. Differences in granule porosityand oil viscosity and the corresponding differences in performancesuggest that the above explanation is quite plausible. This aspect isconsidered again later in this chapter.
63

64

65

66

TABLE 17
Performance of Oil Blends as Dust Suppressants with GTSP Samples
DustSuppressant
Sample Application Initial Normalized Final FinalI.D. Rate Dust Release Dust Release Age Dust Release
(kg/ton)* (%) (%) (days) (%)
AM302EEF GGTSP13 1.6 12.7 -- 1 18 .9AM302EEF IGTSP6 2.6 4.4 -- 1 3.8AM302EEF AN4 3.0 9.4 23.7 1 1 61.8
AM303AM303AM303
DCA BELLDCA BELL
TUFLOZOOOCarnationTUFL055
ADS-197-2
GGTSP15 2.8 20.1 -- 2 40.3IGTSP5 3.0 7.2 8.2 4 8.5
AGTSPB81 3.0 12.6 15.3 1 7 27.7
GGTSP14 1.6 11.0IGTSP7 3.0 23.5
AGTSP6O 3.6AGTSP77 2.8AGTSP52 3.4AN3 4.6
3.417.857.531.9
6.5 1 123.2 8-- --
WV
14.832.1--
NOTE: Initial Dust Release is that determined soon after application of the dust suppressantNormalized Dust Release is that determined after an aging period of three days.
*Unless stated otherwise ton implies metric ton.
---- --
--
67

TABLE 18
Performance of Oil Blends as Oust Suppressants with DAP Samples
Dust Sample Application Initial Normalized Final Final Suppressant I.D. Rate Dust Release Dust Release Me Oust Release
(kg/ton) (%) (%) (days) (%I
AM302EEF AM302EEF AM302EEF
AM303 AM303 AI4303
DCA BELL DCA BELL
GODAPlO 1.6 8.7 IMCDAPl4 2.0 6.4 GODAP7 3.4 4.3
IMCDAP15 2.6 9.3 7.2 4 GODAPll 3.2 5.5 6.2 4
GODAPS 4.4 6.6 5.7 8
IMCDAP8 1.4 7.5 -- --
GODAPZ 3.1 12.5 9.6 8
-a 2 5.4 -- 2 6.8 3.9 10 3.1
6.5 6.4 4.3 %
--
4.7
NOTE: Initial Dust Release is that determined soon after application of the dust suppressant. Normalized Dust Release is that determined after an aging of three days.

Waxes. Waxes evaluated included natural waxes such as paraffinwax, microcrystalline wax, candellila wax, carnauba wax and montan waxand many petrolatum and related waxes. Results of a preliminaryqualitative evaluation are shown in Table 19 and further details onthe use and properties of natural waxes are described elsewhere(Bennett, 1975). The waxes melt with varying degrees of difficulty.Paraffin, microcrystalline and candellila waxes formed coatings orfilms which were either flaky or powdery in nature and, for thisreason, were not expected to be effective dust suppressants when usedas melts. Montan wax did not melt easily and when it eventually didso, it was "tarry" and did not spray properly. Carnauba wax, thoughit melted easily, formed a "grainy" melt and thus an intermittant,uneven spray was produced. Petrolatum waxes, on the other hand,melted easily, sprayed easily and formed good, ductile films thatadhered well to substrate materials.
Based on the qualitative evaluations, it was expected that thenatural waxes would give poor results. The melting points of paraffinwax and candellila wax were 55°C and 70°C, respectively. Tests wereconducted at an application rate of 2 kg/ton and, as expected, theperformance was very poor. In fact, candellila wax had such pooradhesive qualities that the coated emission factor was much greaterthan the uncoated emission factor (measured dust release = 613%) thussuggesting that the coating itself was shedding and contributing tothe overall emission. For paraffin wax the measured dust release was72%.
Petrolatum and related waxes were the only materials, among thoseconsidered, that appeared to have good spray qualities and, thus, thepotential for superior performance. A total of 11 waxes from 3different manufacturers were evaluated. Of these Light Plasticrudeand NW7098 were slack waxes while all the others were various gradesof petrolatum waxes. These waxes were classified as having low,medium or high oil content based on the approximate oil content valuesprovided by the manufacturers and some of their properties aresummarized in Table 20.
Since the waxes were sprayed as melts the ease of melting was animportant consideration. In general, the higher the oil content, theeasier it is to melt a wax. All the petrolatums, except NW6889,melted and sprayed easily. NW6889 had the lowest oil content and thehighest melting temperature and was a little more difficult to handle.However, with proper selection of spraying conditions, NW6889 was alsosprayed without undue difficulty.
The effectiveness of the dust suppressant ultimately depends onthe application rate. As a result, 3 different application rates,nominally 1 kg/ton, 2 kg/ton and 4 kg/ton, were used and the resultsare shown in Tables 21, 22 and 23, respectively. The most importantfactors in judging coating performance are the initial and final dustreleases. Since not all the petrolatum waxes were tested after thesame aging period a normalized dust release was calculated for an
69

70

TABLE 20
Physical Properties of Pctrolatum and Slack Waxes
Dust Oil Content Specific Melting Point Congealing Point Penetration Viscosity cost Suppressant Gravity at 25°C at 100°C
ASTM # (%) at 16 C ASTM # ("C) ("C) ASTM # ("C) ASTM # units ASTM # SDS ($/kg)
NW6889 0721 5 -- D127 NW6364LA D721 15 -- D127 NW7098 D721 10 -- D127
NWLP D721 15 -- D87 Tech Pet F D721 20 0.87 D127
YP2A D721 25 0.87 D127 Red Vet __ -- -- --
Pet I-M D721 10 0.89 D127 P4523 D721 28 0.87 D127 P4556 D721 20 0.87 D127 P4576 D721 12 0.87 --
79 29-41 60-66 54-58 57-66 54-60
--
52-66 46-57 52-60
--
74 52 59 51 60 52 57 53 52 59 57
D938 D938 0938 0938 D938 D938
--
D938
68 29
60-66 54-58 50-58 46-52
me
41-52 -- --
D937 41 D937 loo-250 01321 66 D1321 51 D937 160-190 0937 HO-210
-- --
0937 125-175 D937 170-260 D937 130-175
-- --
D445 0445 D445 D445 D445 0445
D445 D445 D445
--
77 0.3960 60 0.7755
49-54 0.2530 40-55 0.2090 85-100 0.5830
80 0.6160 -- 0.6050
75-125 0.6600 70-115 0.6105 70-95 0.6105 -- --
NOTE: Measured as per technique described in [Bennett, 19751. Minimun.

TABLE 21
Performance of Petrolatum Waxes as Dust Suppressants at a Nominal Application Rate of 1 kg/ton
Dust Application Sample Initial Normalized Final Final Loss Suppressant Rate I.D. Dust Dust Age Dust Rate
Release Release Release (kg/ton) (%) w (days) (%I (%/day)
Pet M NW6889 P4576
Tech Pet F NW6364LA P4556
Red Vet P4523
1.2 1.0 1.2 1.0 1.0 1.0 1.0 1.0
AGTSP73 5.3 5.6 34 9.0 0.12 AGTSPlOO 3.9 3.9 46 2.3 -0.01 AGTSP74 16.5 17.5 35 28.3 0.34 AGTSP72 11.2 11.7 33 16.6 0.16 AGTSP106 5.9 6.5 53 16.5 0.20 AGTSP81 11.9 13.0 35 24.4 0.36 AGTSP71 21.0 22.1 28 31.5 0.88 AGTSP82 12.6 14.4 35 33.9 0.61
NOTE: All samples are GTSP. Initial Dust Release is that determined soon after application of the dust suppressant. Normalized Dust Release is that determined after an aging period of three days. Final age test represents the final test of the sample.

73

74

averaging period of 3 days to permit direct comparison of results fromdifferent petrolatum waxes. A loss or decay rate was also calculatedand used as an indicator of the rapidity with which the performancechanges. Both the above parameters were calculated assuming linearvariation of dust release with age. The variation could well be non-linear, but as a first step the linear assumption provides a quickmethod of comparing different coatings. Thus, for screening purposes,a good coating is chosen to be one which shows a low initial andnormalized dust release and a low loss rate.
Therefore, from Table 21 it can be concluded that NW6889 had thebest overall effectiveness since the dust release was the smallest at1 kg/ton. Pet HM and NW6364LA were also effective. From Tables 21,22 and 23 it will also be observed that the loss rate, in general,decreased with increasing application rates. Because of this effectsome of the coatings which performed marginally well at 1 kg/tonperformed significantly better at higher application rates. NW6364LAand NW6889 were also used on DAP and again the dust releases were verylow. The other petrolatum waxes will work just as well on DAP. Theresults show that the petrolatum waxes were excellent dustsuppressants and that they provided long-term control of fugitive dustemissions.
As discussed earlier, granule fracture was not a significantfactor with fertilizer granules. The wax coatings were found toeffectively suppress the surface dust and multiple handlings producedcontinually decreasing dust emissions. With sulfur treatedidentically the wax was found to be just as effective (Figure 25) withthe measured dust release being 3 %. More importantly, even after 10drops the dust release did not increase thus suggesting that the waxsuppressed dust emissions even though significant fracture of thesubstrate material was occurring.
In actual plant situations coatings are normally applied on warmproduct prior to transfer to storage. The fertilizer temperature insuch situations is usually about 49°C. Therefore tests (Table 24)were conducted to study the effect of fertilizer temperature on dustsuppressant performance. Unless specified otherwise, in alllaboratory tests the dust suppressants were applied while thefertilizer sample was in the storage bag. However, for tests withwarm product the fertilizer sample was transferred into 2 enameledpans SO that the fertilizer sample was an inch deep in the pan and placedin a 1OO°C oven for 2 hours. While still in the pan the top layer wassprayed, then a new layer was created by turning over the pan contentswith a spatula and sprayed again. This process was continued till thequantity required was attained. Results from the "pan coating" techniqueand the "bag coating" technique for product at ambient temperature werecomparable. The results also indicated that product temperature affecteddust suppressant performance significantly, with the lower meltingpetrolatum wax (NW6364LA) being affected more severely. Because of thenature of the experimental procedure, the product temperature indicatedwas only an approximate maximum measured at the beginning of the coating
75

Figure 25. Effect of handling on the emission factorfor coated and uncoated samples of GTSPand prilled sulfur.
76

TABLE 24
Effect of Fertilizer Temperature on the Performance of Fetrolatun Waxes with GTSP- Preliminary Tests
, . . . I * I , . , . . , . ,__
Sample Initial final Product oust Initial Final [lust Coating I.D. Moisture Ibisture Temperature Suppressant Gnission 6nission *lease Method
Content Content Factor Factor
(%I 1%) 1°C) (g/kg) WW w
AGTSP135 0.97 VW Pmbient None 0.0438 -- de M m
AGTSP134 0.96 - - Ambient None 0.0433 -- - - - -
AGTSP134 0.87 0.54 63 None AGTSPl25 0.94 0.27 74 None
Me 0.0628 - - - -
em 0.0684 - - - -
AGTSPlOS AGTSP103 --
-- Ambient Ambient
r!&mxA t&%889
r+vhxwlti l%h5364LA
Mm89 t&m389
NKWA Nw6364u Nw6364LA
N&889 mm89
0.0405 0.0405
0.0009 0.0010
2.2 2.5
AGTSPlSO AGTSP131
0.96 0.82
..- Ambient Ambient
0.0435 0.0029 6.7 0.0435 0.0024 5.5
AGTSP122 AGTSP121
AGTSP124 AGTSP123 AGTSP132
0.77 Ambient O.&l Ambient
0.0435 .0.0041 9.4 0.0435 0.0036 8.3
0.73 0.31 78 0.97 0.13 80 0.84 0.15 80
0.0656 0.0132 20.1 0.0656 0.0105 16.0 0.0656 0.0248 36.3
in
bag
in pans
in
pans
in‘
pans
AGTSP120 AGTSP130
0.80 0.59
0.21 0.15
66 66
0.0656 0.0099 13.1 in 0.0656 0.0097 14.8 pans
NOTE: Initial and final Moisture Contents are that measured before and after product heating. Application Pate = 2 kg/ton. For the coated samples the Initial hission Factor indicated is that for the uncoated batch. Samples are coated either in pans or in bags, as discussed in text.
77

procedure. The drop in performance was probably due to absorption of thedust suppressant into the granule interior. Since the elevatedtemperature chosen was higher than the wax melting temperature, the waxwas still in a liquid state for a sufficient length of time to permitabsorption. At ambient temperatures the fertilizer temperature was muchlower than the wax melting temperature and so the wax solidified on thegranule surface before significant penetration could occur. This aspectis explored further later in this chapter.
Emulsions. Some of the waxes named earlier were a littledifficult to melt and spray. So, water based emulsions wereconsidered as a means of delivering the wax to the granule surface.Water based emulsions have the advantage of raising the granulemoisture content and do not need the special handling required by themelts.
The natural waxes were emulsified using a simple saponificationprocess. The wax was first melted in a beaker and then a boilingsolution of potassium hydroxide or potassium carbonate was poured intothe beaker. The mixture was thoroughly stirred for a number of hoursto ensure homogenization. Candellila and carnauba waxes emulsifiedeasily while montan wax formed a dispersion rather than an emulsion.The candellila wax emulsions tended to thicken with time while thecarnauba and montan wax emulsions tended to sediment with time.Emulsion stability was thus a significant problem. Emulsions withvarious wax concentrations were tested with GTSP and the results arepresented in Table 25. As a control, tests were also conducted usingan equivalent weight of water as a coating agent. Though it appearedthat the emulsions had reasonable performance levels, this conclusionwas misleading. In general, the dust release characteristics offertilizer samples coated with emulsions were similar to those treatedwith plain water. This suggests that the water based emulsions werenot a significant improvement over plain water and reinforces theimportance of product moisture content. In addition, application ofwater subsequent to product manufacture can create caking problems.
The petrolatum waxes could not be saponified in the same fashion.Special surfactants were required to form stable emulsions and solittle success was achieved. However, based on results from testswith the natural wax emulsions, it appears that emulsions may not beappropriate long term dust suppressants.
Miscellaneous Coating Agents. In addition to the coatingsdescribed earlier, other dust suppressants were evaluated and theresults are shown in Table 26. Lignin, a by-product of the paper andpulp industry, has been claimed to be a good dust suppressant.However, when applied directly on GTSP, lumpy agglomerates of granuleswere produced and the resulting coated product had a higher emissionfactor than the uncoated product. The coating agent did not bind withthe granule surface and was dispersed into the air by handling thecoated product. When the granular product was first coated with oiland then coated with lignin, a smooth hard coat was formed and the
78

79

TABLE 26
Performance of Some Miscellaneous Dust Suppressants
co 0
Dust Suppressant
Type
Dust Application Sample Initial Normalized Final Final Suppressant Rate I.D. oust Dust Age oust
Release Release Release e ( kJ/tQn) (%) (%) (days 1 (%)
Lignin + Oil Norlig A + DCA BELL 6.2 RM6 1.9 22.9 6 43.9
Lignin + Oil Norlig A + DCA BELL 9.0 GODAP3 3.8 4.3 8 5.1 Lignin Norlig A 1.7 RM4 213.0 -- -- --
Hydrocarbon Polymer DcL1803 3.0 AGTSPl 44.3 57.4 3 57.4 Hydrocarbon Polymer DCL1803 4.0 AGTSP4 11.8 19.2 3 19.2
Oil + Surfactant DCA BELL + Petroleun 3.6 AN1 3.8 28.0 7 60.3 ~Sulfonate
Lignin in oil enulsion NALCO8802 4.3 FDAP8 43.4 -- -- -- Lignin in glycol
emulsion N4LCO7981 5.2 FDAPG 37.9 -- -- --
NOTE: All samples are GTSP, except GODAP and FDAP which are DAP. Initial Dust Release is that determined soon after application of dust suppressant. Normalized Dust Release is that determined after an aging period of three days.

resultant coated emission factor was significantly reduced. Lignin,which is in the form of a dispersion of lignin solids in an aqueousmedium, spreads easily on the oil coated product. The dust releasecharacteristics of the lignin-oil combination coating was practicallyundiminished with age for the DAP sample but was once againsignificantly reduced for the GTSP sample.
Two commercially available lignin based emulsions (NALC08802 andNALC07981) primarily used to suppress road dust were also evaluated.One was an oil based emulsion and the other was a glycol basedemulsion. Both coatings performed poorly, as shown by the high initialdust release values, Another commercially available dust suppressantfor road dust, Calgon DCL1803 (a hydrocarbon polymer), was also foundto be ineffective in this application. Finally, addition of apetroleum sulfonate to oil to change the wetting characteristicsresulted in good initial performance but poor long-term performance.
Dust Release Characteristics of Treated Fertilizer. A singlestage impactor with a 13.6 µm cut point was used in the mannerdescribed earlier in conjunction with the vertical flow dust chambersetup. Tests were conducted to study coating, aging and handlingeffects on the release of particles larger than 13.6 um. A petrolatumwax (Tech Pet F) and a naphthenic oil (S1OO), both of which were amongthe poorest performers of their class, were used at an applicationrate of 1 kg/metric ton. The percentage by weight of particles largerthan 13.6 µm, for uncoated fertilizer samples, is shown in Figure 26. Ingeneral, all four materials tested appeared to follow a similar trend intheir response to handling with the "weight % > size" value stabilizingafter the third drop. This suggests that the relative amounts of largeand small particles did not change though the total mass did decreasesteadily for these materials. The AGTSP sample produced a much largerquantity of large particles while the other three samples produced alarger quantity of small particles.
In Figure 27 the effect of aging is illustrated. The impactorand filter contributions to the total emission factor of the coatedproduct are compared with the corresponding values for the uncoatedproduct and represented as a percentage. For GAMAP, both the oil andwax were quite effective in controlling the large(>13.6 µm) andsmall(<13.6 µm) particle fractions, though with age the oil suppressedthe large particle fraction less effectively. With FDAP and IGTSP,the oil exhibited decreased performance with age and this loss was nota strong function of particle size. The wax also showed a decrease inperformance though the magnitude was much smaller and not particlesize dependant. Therefore, the results show that the oil was not aneffective dust suppressant with both FDAP and IGTSP. In addition, theloss in performance with age was more severe with oil and does notappear to be a strong function of particle size for both the coatingsevaluated.
81

82

8 3

However, as would be expected intuitively, large particles wereless effectively suppressed by coating agents as compared with smallparticles but this difference was small for wax coatings and largerfor the oil tested.
INTERMEDIATE SCALE FIELD TESTS
Five petrolatum waxes and a wood processing by-product calledtall oil were further evaluated in the ISFT test setup. Once thenozzle selection and location problem was addressed there were noproblems with spraying the molten petrolatum smoothly andcontinuously. Coating spray rates were in the 11.4 liters/hour to26.5 liters/hour range and the fertilizer feed rates were in the 4 to12 tons per hour range. The corresponding application rates werecalculated to be in the 1 kg/ton to 3.5 kg/ton range. Results areshown in Figure 28.
As expected, the dust release was reduced with increasingapplication rate. Of the 5 petrolatum waxes, 4 had similarperformance while the fifth, NW6364LA, appeared to performsignificantly better at lower application rates. Best fit curves werefitted to the data. In general, at 2 kg/ton the dust release measuredwas in the 5% to 10% range. These measured values were quitesimilar to the results obtained from laboratory evaluations with 5-kgtest samples. At an application rate of 3.4 kg/ton the dust releasewith the tall oil was 34 %.
Based on these results it was concluded that dust release valuesin the 10 % region could be attained in the field. In addition, thetests with the ISFT setup showed that handling larger quantities ofwax should not be a problem if the spray system was properly designed.
FULL SCALE FIELD TESTS
Dust Suppressant and Coating Technique Evaluation
Based on the results from laboratory and intermediate scaleevaluations the full scale field tests (FSFT) were undertaken. Thematerial handling system for GTSP had a nominal rate of 250 tons/hrand the wax spray system was designed to provide application rates inthe 1 kg/ton to 4 kg/ton range. The fertilizer temperature wasestimated to be not more than 49°C. Both NW6364LA and Yellow Protopet2A (YP2A) were effective in the smaller scale tests and since theirmelting temperatures were about 52°C they were considered ideal forthis application.
In order to get an estimate of dust concentrations in the storagebuilding (Figure 13) two high volume air samplers were operated usingthe standard method for ambient air sampling. The background levelprior to the start of discharge in the building was about 0.5 mg/m3. As trucks discharged their uncoated load into the receiving hopper thefertilizer was coated with oil by a "trickling" system in the
84

Figure 28. Performance of petrolatum waxes in intermediatescale field tests.
85

receiving hopper and about 2 minutes later the fertilizer wasdischarged through a tripper in the storage building. The dustconcentration in the building when oil coated fertilizer wasdischarged increased to about 4.5 mg/m3 during the duration of thetest (Table 27).sampler locations.
The measured concentration was influenced by theOther factors involved were the size, shape and
orientation of the pile of fertilizer in the storage building,frequency of truck unloading and building ventilation by drafts causedby wind blowing through the building doors. Due to the variousproblems encountered during sampling it was not expected that airsampling during discharge of wax coated fertilizer would providesignificant information. However, discharging uncoated fertilizer inthe building significantly raises dust concentrations in the airwithin the building.
From the intermediate scale tests it seemed that spraying thecoating agent at a transfer point would be the best course of action.Between the point of truck unloading and discharge into the buildingthere were five transfer points. Facility constraints such asavailability of space and utilities and safety considerations ruledout transfer point #2, #3 and #4. Transfer point #0 was the receivinghopper and was the location used at the facility to spray oil.Transfer point #1 was therefore chosen as the first nozzle location.Pressurized liquid nozzles were used.were considered as shown in Figure 29.
Three different arrangements
Results shown in Table 28 indicate very poor coating performance.Visual observation of the coated product showed little evidence of thecoating. A high volume air sampler was therefore setup just aftertransfer point #1 to study the problem. With arrangement 3 (Figure29), the filter weight gain when wax was sprayed was significantlyhigher than that observed with uncoated fertilizer. When the oilspray at transfer point #0 was turned on the measured dust emissionwas reduced (Table 29). Examination of the filters under black lightclearly showed significant wax deposits. When the same wax flow waspumped through 4 nozzles (arrangement 1) the measured filter weightgain was significantly reduced. This suggests that the poor resultswith the 2 nozzle arrangement was caused, at least in part, byexcessive atomization and subsequent dispersion in the air. Airsamples were also taken when oil was sprayed at transfer point #0using the existing facility setup and when oil was sprayed at transferpoint #1 using the new (UF) setup with 4 nozzles. Again filter weightgains showed similarities for both setups and the dust suppressionlevels were comparable. However, with NW6364LA, the dust suppressionwas only about 50 %, which was no better than that with oil. Transferpoint #1 was the location where fertilizer was brought up from theunderground receiving hopper by a drag flight conveyor. Unlike a beltto belt transfer point this arrangement discharges the fertilizer in adiffuse manner with significant turbulence. As a result, it appearedthat the wax spray was dispersed in the air and little actuallydeposited on the granules. In addition, the turbulence caused rapidfertilizer dust and petrolatum wax build-up on the enclosure walls.

87

88

89

90

91
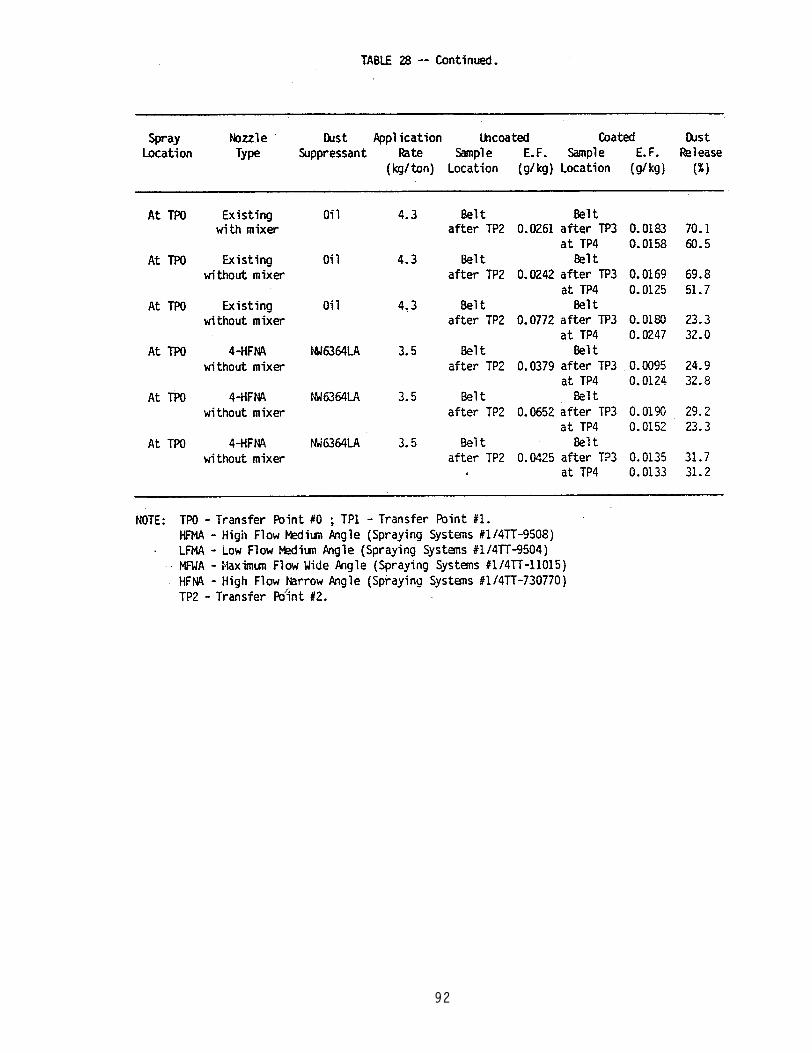
92

93

In order to better distribute the coating agent 2 nozzles wereinstalled at transfer point #1 in arrangement 3 as shown in Figure 29and 2 more were installed over the axis of the belt conveyor justafter transfer point #1. Since 2 of the nozzles were spraying on thetop surface of the bead of fertilizer on the belt, samples werecollected off the belt after transfer point #2. At 2.5 kg/ton theresult (Table 28) seems significantly improved compared with resultsdescribed earlier and at 3.9 kg/ton it was even better. When all fournozzles were located along the belt axis results were very good.However, because of the design of the material handling system, onetransfer between point of coating and point of sample was found to beinsufficient with regard to material mixing. Therefore, the resultsof some of the past tests were probably skewed.
A study was made of product variability. For a particular truck,ten 5 kg samples were collected about 20 to 30 seconds apart and a 19liter bucket was also filled a little at a time over the period ofdischarge of the truck. The bucket sample represents an averagesample and the average emission factor of 0.0296 g/kg had a deviationof 2.5% from the 2 individual emission factors (Table 30). Theemission factors for the instantaneous samples were between 66% and115% of the average value, though 6 out of 10 samples were between 90 % and 105 % of the average. Thus, there were small but significantdifferences in the product as discharged by the truck.
Similar tests were done with the existing oil spray setupoperating and samples being taken off the belt after transfer point#1. The deviation of the average value was about 5 %. Thevariability of the instantaneous emission factor was much higher(Table 31) but the average of the instantaneous values was within 5%of the average sample. Samples taken simultaneously at the truck andoff the belt after transfer point #1 with no oil spray, again showedsignificant variability though the samples off the belt were muchworse. Because of the action of the drag flight conveyor the samefertilizer appeared to be significantly dustier when oil was notapplied (Table 32). These tests show that the sampling procedureshould be carefully planned so as not to unfairly skew the evaluationof dust suppressants.
Four high flow, medium angle (HFMA) nozzles were used again at anapplication rate of 1.7 kg/ton and 2.6 kg/ton and as expected theperformance increased with application rate (Table 28). The uncoatedsamples were collected at transfer point #2 in 2 stages, before andafter the wax spray so that a reasonable, average, uncoated emissionfactor could be determined. The coated samples were taken a scoop ata time at both transfer point #2 and #3. There were significantdifferences in the measured dust release at the two sample locationswith that measured at transfer point #2 being generally lower becauseof insufficient product mixing and sampling bias. At 1.7 kg/tonwhether the HFMA nozzles or the low flow, medium angle nozzles wereused was not important and in both cases the dust release was veryhigh. With the HFMA nozzles, raising the wax feed rate to 2.6 kg/ton
94

95

96

97

raised the nozzle operating pressure. Adding the additional wax cutthe dust release in half but this was still too high. With the HFMAnozzles, operating at 2.6 kg/ton the spread did not completely coverthe top surface of the fertilizer bead on the belt. So, 2 nozzles ofhigher capacity and wider spray angle (MFWA) were used so as tocompletely cover the top layer. The improvement in initialdistribution of the wax, if any, did not significantly change the dustrelease. Installation of a plough type arrangement to introduce somemixing of the coated product on the belt also did not providesignificant improvement.
The nozzles placed along the belt, axis were about 22.5 cm fromthe fertilizer surface so that the top layer was completely covered.At this condition the petrolatum wax was still in the form of a liquidsheet to ensure that a maximum amount would be deposited on thefertilizer. Since the dust release levels were still too high andbecause the coating still appeared poorly distributed a bank ofmixers, as shown in Figure 30, was installed so as to present newgranule surface to the spray. When only 3 nozzles were used one extraproduct turnover occurred because of the fourth bank of the mixerwhereas, when 4 nozzles were used, after the final mixing the ensuingsurface layer was given an extra coating. Tests without and with themixer revealed no significant differences (Table 28). Samples takenat transfer point #3 and #4 did not reveal any major differences.Uncoated samples were taken simultaneously at transfer point #2 and #4and the measured emission factors for uncoated product were found tobe within 5%. Therefore, collecting uncoated and coated product atdifferent locations did not affect the quality of the data. Datasuggests that by the time the product passed transfer point #3 productmixing had played a significant role in damping out variabilities. Byraising the feed rate to 3.6 kg/ton the dust release was improved toabout 30 %. Thus, raising the feed rate from 1.7 kg/ton to 2.6 kg/tondecreased the dust release from about 85 % to about 40 % and raisingthe feed rate to 3.6 kg/ton only decreased the dust release to about30%. Visual observation of the coated product indicated that themixers and extra product transfers up to transfer point #4 had theeffect of improving the distribution of the petrolatum wax throughoutthe product because of the more even coloration of the fertilizer.However, the fertilizer granules did not look as dark as granules ofthe same product coated in the laboratory. This difference in colorcontrast suggests that less wax was on the granule surface.
Finally, tests were conducted by spraying the petrolatum wax atthe spray location currently used to spray oil. Four nozzles wereinstalled within the receiving hopper. Because of the close confinesof the hopper and to prevent loss of wax on hopper and drag flight
surfaces high flow, narrow angle (HFNA) nozzles, which have a narrowerspread, were used. At 3.6 kg/ton the average dust release for 3successive runs was again about 30 % and this was comparable with thedust release measured when oil was sprayed with the existing setup
and with results of earlier tests where the petrolatum wax was sprayedon the belt after transfer point #1.
98

99

When results of these tests are compared with that fromlaboratory and intermediate scale field tests, it is obvious thatcoating performance is significantly reduced in field use. Thecoating agents used in the full scale field tests were NW6364LA andYP2A both of which have melting temperatures of about 52°C. Thefertilizer used was the same in all the tests. The major differencewas that in the laboratory and intermediate scale tests the fertilizerwas at ambient temperature while the fertilizer in the full scaletests was at an elevated temperature of between 49°C and 77°C, with60°C to 77°C being the most frequent temperature range. Thetemperature of fertilizer delivered by a number of trucks was measuredand, as shown in Figure 31, it was quite variable, It was alsoobserved that there was little change in product temperature betweenthe truck discharge and transfer point #4. The temperature of twobuckets of coated fertilizer was measured as a function of time(Figure 32(a)) and was found to change very slowly and, as shown inFigure 32(b), after more than five hours fertilizer temperaturesgreater than 49°C were observed for product stored in buckets.Because of the high initial temperature and slow cooling of thefertilizer in sample buckets, the relatively low melting temperatureof the waxes causes them to behave as oils i.e., they do not harden onthe granule surface rapidly. As a result, the wax was susceptible tocapillary action and penetration into the granule interior leading toincreased dust release. Higher melting waxes or lower fertilizertemperatures could combat this problem. However, since the pumpselected for the field spray system was recommended for use withliquids at less than 85°C the higher melting wax, NW6889, was notsuitable for pumping with the existing system.
Therefore, the full scale field tests demonstrated that thepetrolatum waxes could be easily handled and pumped in largerquantities. The results obtained were comparable with those observedwith the oil currently used at the test facility but were not as goodas that obtained with the same petrolatum waxes in laboratory andintermediate scale field tests. The initial distribution of the waxdid not seem to be a major factor but fertilizer temperature didinfluence coating performance significantly. This factor is furtherdiscussed in the next section.
Further Experiments Pertaining to FSFT Results
As discussed earlier, the fertilizer used in the full scale fieldtests was at an elevated temperature of between 49°C and 77°C. Oncethe coated samples were collected in buckets and brought back to thelaboratory, measurement of temperature showed that the heat loss fromthe fertilizer while in the bucket was slow. Because of the fact thatthe dust suppression effectiveness of the selected petrolatum waxes infull scale field tests was not as high as expected, the combinedeffect of aging and fertilizer temperature was implicated. Inaddition, the effect of mixing on the distribution of the petrolatumwax was not clearly understood.
100

101

102

In order to establish the effect of mixing on the distribution ofthe petrolatum waxes a number of test samples were prepared and testedin the standard manner. Twenty percent of a 5-kg sample was separatedand coated with 10 grams of the petrolatum wax, an application rate of2 kg/ton, using the procedure described earlier. The remaininguncoated portion (80%) of the sample was then mixed in the requirednumber of times and the total sample was then "drop tested" in thestandard manner. The mixing procedure was carried out in squarebottomed plastic bags with one "mix" being one to and fro motion ofthe bag contents along the bag axis. Results shown in Figure 33emphasize the significant effect of mixing on dust release. Thefertilizer was at ambient temperature and NW6364LA, a soft wax, andNW6889, a harder wax, both produced a rapid decrease in dust releasewith increased mixing though the softer wax showed a faster response,as expected. Thus, though the coating was poorly distributedinitially, the distribution was significantly improved by mixing asevidenced by the decreased dust release.
Tests were also conducted where the initial distribution of thecoating agent was varied. Initial distributions of 20 %, 40 % and 100% were considered and the samples were mixed 60 times. For bothNW6364LA and NW6889 the initial distribution did not make asignificant difference as long as moderate mixing was carried out(Figure 34(a)). The individual differences between the performance ofthe two waxes can be attributed to the differences in their responseto a fixed number of “mixes" as discussed earlier. Similar tests(Figure 34(b), 34(c) and 34(d)) with Pet HM and P4556, petrolatumwaxes of intermediate hardness, and AM303, an oil blend, showedsimilar results except that the oil exhibited comparatively poorerperformance overall and, as expected, the lower application rateresulted in poorer performance. From these results it is clear thatgood mixing can overcome poor initial coating distribution and waxhardness does not significantly influence the outcome. Now, if thefertilizer temperature were higher, NW6889 would soften and distributemore easily and could be expected to perform better.
In an initial series of experiments (Table 33) with NW6364LA, 5kilogram test samples of AGTSP were transferred to enameled pans andheated in an oven set at 105°C. The average fertilizer temperaturewas determined by measuring the temperature of the product in the panusing a thermocouple at 9 different locations. Once the requiredtemperature was reached the pans were placed on a hot plate and thenthe top layer of fertilizer in the pan was repeatedly sprayed with thecoating agent till about 10 grams of wax was added. At this point thefertilizer was transferred from the pan to the plastic storage bag andmixed 100 times. After cooling, these samples were tested. Resultsin Table 33 show a slightly increasing trend suggesting that dustrelease does increase with temperature. However, the dust release wasstill only about half as much as that measured in the full scale fieldtests. But, because of the nature of the test procedure, primarilythe mixing process, the fertilizer cools quite rapidly. Therefore,the petrolatum is exposed to detrimental temperatures for only a short
103

Figure 33. Effect of laboratory mixing procedure onthe dust release of GTSP samples with aninitial petrolatum wax distribution of20% (application rate = 2 kg/ton).
104

105

106

107

108

time. Now, when uncoated fertilizer was subjected to the same mixingprocess the dust release was only about 71 % i.e., 29 % of the dustwas lost. Since the coating spreads quite rapidly the same dust losswill not occur with coated product. When the samples were reheated tothe required temperature for about half an hour after application ofthe coating agent the dust release increased to the 30% level. Testswere also conducted where samples were reheated for one hour and threehours at about 65°C and the measured dust release was again of theorder of 30%. Therefore, temperature and aging play a role in the lossof performance with AGTSP, with the lower melting petrolatum wax,NW6364LA, and apparently, the drop in performance occurred with aheating time of less than an hour.
A different method of mixing where the coated product wastransferred from one bucket to another four times (4 B-B), similar tomaterial transfer from conveyors, was tried. This process caused aloss of 22 % of the dust when the product was uncoated and since thismixing method was not as effective, it was factored into thecalculations for the coated product. The dust release for ambienttemperature fertilizer (Table 33) was about 32% and at 68°C it wasabout 36 %. This indicates the effect of poor mixing rather than thatof temperature. Further tests were conducted where the initialdistribution of the wax was improved by turning the product over 7times (7T) during the process of coating and then mixing 20 times.The measured dust release averaged about 22% whereas with coldfertilizer the result was about 6 %.
The rationale behind the above tests was to simulate the fullscale field test conditions by applying the coating agent on hotfertilizer. The results do indicate a significant increase in dustrelease with fertilizer temperature but because of some uncertaintyabout the length of time the coating was maintained at the requiredtemperature the test procedure was modified again and a second seriesof tests (Series #2) were conducted using NW6364LA, a low-meltingpetrolatum wax, and NW6889, a high-melting petrolatum wax. During thesecond series of tests, five kilogram test samples were first coatedin the standard manner and then mixed 100 times. The coated sampleswere then transferred into enameled pans and placed in an oven set atan appropriate temperature for the required length of time. Resultsin Table 34 show that for AGTSP, samples when no heating was done thecoated samples had very low dust release values, in the 2 % range, atboth application rates. When placed in a muffle furnace set at about82°C for 30 minutes and then in an convection oven set at about 71°Cfor 30 minutes the final product temperature was about 65°C and thedust release was in the 30 % to 35% range for both petrolatum waxesfor both application rates. In the above situations heating was quiterapid. Further tests were conducted where the coated samples wereplaced for 5 hours in a convection oven (Precision Model #17) set attemperature not more than 8°C higher than the required fertilizertemperature. An evaluation of the effect of fertilizer temperaturesin the 49°C to 65°C range showed that at an application rate of 2kg/ton, for NW6364LA the dust release was about 30 % at temperatures
109

TABLE 34
Effect of Fertilizer Temperature on the Performance of kst Suppressants -- Series 12
Sample Sample lhst Application Temperature kcoated Coated [)ust Szmple Type Suppressant Rate in pan in bag E.F. Rf?lease Treatment
(kg/W (OC) 1°C) (g/kg) i%i (V
B7-5(11/3) A6TSP NW6889 3.2 25 25 0.0462 0.0005 1.1 Coating applied on B7-9(11/3) AGTSP tam89 3.2 25 25 0.0462 0.0806 1.4 cold samples, mixed B7-18(11/3) AGTSP lw8a9 2.0 25 25 0.0462 ,O.OOll 2.4 100 times and tested B6-10(10/27) AGTSP NW6889 2.0 25 25 0.0434 0.0009 2.0 without heating.
B7-15(11/4) AGTSP NU6364LA 3.2 25 25 0.0462 0.0005 1.2 B6-16(10/25) AGTSP EIw6364LA 3.2 25 25 0.0434 0.0009 2.0 67-11(11/4) AGTSP tW364lA 2.0 25 25 0.0462 0.0011 2.4 B6-24(10/27) AGTSP MW64lA 2.0 25 25 0.0434 0.8008 1.9
B8-l(lU15) AGTSP AM303 3.0 25 25 0.0448 0.0057 12.6
Bl-9(11/20) @MAP Nma9 3.2 25 25 0.0434 0.0010 2.2
25 25 0.0434 0.0006 1.3 Bl-4(11/21) GAMAP tWZ364lA 3.2
81-l (12718) IGTSP _ pm39 3.2 25 25 0.0390 0.0004 1.0
Bl-6(12/19) Ci4GTSP NM889 3.2 25 25 0.0201 0.0007 3.6
’ B5-ll(10721) AGTSP M889 2.0 70.3 62.1 0.0456 0.0128 38.1 Coating applied on B5-15(10/24) AGTSP NM6889 2.0 65.1 64.7 0.0456 0.0133 29.2 cold samples, mixed 85-7 (10722) AGTSP tits889 . 2.0 64.9 66.4 0.0456 0.0195 42.8 100 times and tested 85-2 (10/23) AGTSP M889 3.2 64.7 65.1 0.0456 0.0161 35.4 after heating in oven 85-16(10/20) AGTSP Me889 3.2 64.6 62.5’ .0.0456 0.0128‘ 28.2 -and muffie furnace
for 1 hour. B5-21(10/19) AGTSP NW6364LA 2.2 65.3 63.8 0.0456 0.0158 34.6 B5-19(10/19) AGTSP NW6364lA 2.0 65.i 62.5 0.0456 0.0150 32.9
B7-6(11/8) AGTSP ‘Mm389 3.2 60.1 57.1 0.8462 0.0127 27.4 Coating applied on B8-10(11,/13) AGTSP Nu68s9 3.2 57.5 55.8 0.0448 0.0053 11.7 cold samples, mixed B8-6(11/17) AGTSP NW6889 3.2 56.9 54.9 0.0448 0.0051 11.3 100 times and tested B6-1(11/14) AGTSP NW89 3.2 51.5 58.4 0.0434 0.0036 8.3 after heating in oven B8-15(11/15) AGTSP NW6889 3.2 51.2 58.3 0.0448 0.0626 5.7 for 24 hours.
B8-16(11/20) AGTSP AM303 3.0 59.9 58.3 O-W48 0.0100 22.2 88-7(11/7) AGTSP AM303 3.0 52.3 58.2 0.0448 0.0081 18.1

111

as low as 52°C while with NW6889 the corresponding dust release wasabout 8 % (Figure 35(b)). At an application rate of 3.2 kg/ton, thedust release decreased to about 19 % with NW6364LA at the sametemperature while with NW6889 the dust release was reduced further toabout 4 % (Figure 35(a)). In general, the higher melting petrolatumwax, NW6889, performed better than the lower melting petrolatum wax,NW6364LA, at higher fertilizer temperatures. At fertilizertemperatures of about 60°C dust releases of 10 % to 15% wereattainable with NW6889. When the heating time was changed from 5hours to 24 hours NW6889 did exhibit some decrease in performance(Figure 36) at the higher temperatures thus indicating a clear time-temperature relationship. In comparison, AM303, an oil blend, did notrespond as well under similar conditions.
Similar tests with 5-hour heating times were conducted using GTSPsamples from two other manufacturers (IGTSP and GAGTSP), monoammoniumphosphate samples (GAMAP) and diammonium phosphate samples (FDAP).Results show that for NW6889, the IGTSP, GAGTSP and FDAP samples allhad time-temperature responses similar to that observed with AGTSP(Figure 37 (a)). However, GAMAP showed significantly differentbehavior with dust releases in the 1 % to 2 % range at fertilizertemperatures of up to 65°C just as was observed with fertilizers atambient temperature i.e., not heated after application of coatingagent. Similar response was observed with NW6364LA (Figure 37(b)).Tests also showed that 4-kg samples of FDAP, GAMAP and GAGTSP allresponded to heating and cooling in almost identical fashion (Figure38) thus suggesting that this factor did not contribute significantlyto the differences in the results. It is therefore obvious that bothNW6889 and NW6364LA are capable of being extremely effective dustsuppressants, even with elevated fertilizer temperatures, in specificsituations. The above results with heated fertilizer are of the sameorder of magnitude as that obtained with NW6364LA in full scale fieldtests and suggest that the time-temperature effect was a factor in thefield tests. For GTSP samples, the same coating agent performed verywell at low fertilizer temperatures but not at higher temperatures,all other parameters being the same.
Tests were conducted to determine if the petrolatum wax coatingscould be lost by vaporization due to exposure to elevated substratetemperatures. Two sets of 5 strips of aluminum foil, spray coatedwith NW6889 and NW6364LA were preweighed and placed in a convectionoven (Fisher Isotemp Oven Model #106G) set at 65°C for 5 hours andthen reweighed. No significant weight loss was detected (Table 35)suggesting that the wax must still be on the fertilizer and could nothave vaporized during heating. Since the performance does decreasewith GTSP the coating is clearly not at a location where it would do the most good viz., on the granule surface. Therefore the coating mustbe penetrating into the granule interior leaving less on the surfaceand consequently decreasing the ability of the film to suppress dust.
112

Figure 35. Effect of fertilizer temperature on dust releaseat 2 application rates.(a) 3.2 kg/ton(b) 2.0 kg/ton
113

114

115

116

117

Throughout the full scale field tests and the laboratory testsjust discussed, it was observed that the coated AGTSP samples appeareda lot lighter in color after heating when compared with unheatedsamples. This suggested that absorption within the granule interiorwas occurring. Now, the melting temperatures for NW6889 and NW6364LAwere about 74°C and 52°C, respectively and both petrolatum waxesexhibited decreased performance at or below these temperatures.Therefore, the melting temperatures are clearly not the primaryfactors. The corresponding congealing points were 68°C and 29°C(minimum), respectively with the softening points being a few degreeslower. Therefore, the petrolatum waxes could become soft enough toflow i.e., be absorbed through capillary effects, at temperatures muchlower than the melting temperature and these temperatures wereattained both in the full scale field tests and the subsequentlaboratory evaluation. To further evaluate this, uncoated granules ofAGTSP were placed on a piece of aluminum foil spray coated with thepetrolatum waxes. These samples were then placed in a convection ovenset at the appropriate temperature near the softening point of eachpetrolatum wax. Significant wax pickup was observed. Photographs ofgranules show evidence of significant petrolatum wax pickup afterabout 30 minutes at 65°C. When these granules were placed in an ovenset at 65°C for about 5 hours significant loss of color contrast wasobserved (Figure 39) again suggesting that absorption was the cause.This same technique could not be used with MAP because of the darkcolor of, the uncoated MAP granules. Since both the petrolatum waxeswere naturally fluorescent an effort was made to detect granulepenetration by looking at granule cross-sections under a fluorescentmicroscope but because of the small quantities of wax used (0.2% to0.3 % by weight) the fluorescence could not be detected.
The cross-sectional view of AGTSP and GAMAP (Figure 40) showsthe differences in structure. Experiments have shown that atidentically elevated temperatures there is a distinct difference inperformance for AGTSP and GAMAP. Therefore there must be a structuraldifference between the two fertilizers viz., porosity. Differences inporosity could account for the loss in performance with AGTSP and theunchanged performance with GAMAP. Results of tests using the BETtechnique (Quantachrome Autosorb 6) shown in Table 36 clearly indicatethe significant difference in pore volume and average pore diameterfor GAMAP and the 3 GTSP samples with the GTSP samples having largerpore volumes and pore diameters. For 5-kg samples of IGTSP, GAGTSP,AG SP and GAMAP the total pore volume would be 20 cm3, 49.5 cm3, 20.53cm and 1.15 cm3, respectively. The volume of 16 grams of coating
(application rate of 3.2 kg/ton) is about 20 3cm . Therefore, asignificant portion of the coating could be absorbed into the GTSPgranules while very little would be lost within the MAP granule.Granule porosity could, therefore, be the major factor in performancedegradation of coatings with GTSP samples.
A lead tag was applied to NW6889 by dissolving about 3 grams oflead oxide in 15 ml of oleic acid heated to about 80°C and then mixedthoroughly with 85 ml of melted NW6889. The process of dissolving
118

119

Figure 40. Photographs of fertilizer granule cross-sections(a) GTSP (b) MAP.
120

121

lead oxide in oleic acid forms lead oleate, a metallic soap. This isa waxy solid at ambient temperature and is soluble in waxes. Granulesof AGTSP and GAMAP were dipped in the melt and then placed in aconvection oven set at 65°C for 5 hours. After cooling, thesegranules were cleaved with a sharp blade and then mounted on agraphite mount and carbon coated for analysis with a scanning electronmicroscope (JEOL Model 35C) equipped with an X-ray detector. Becauseof the small quantities of petrolatum wax and the even smallerquantities of lead, only a small energy range in the region of leadwas scanned so that the wave form could be enhanced. The granuleinterior and surface near the fracture edge was studied and areasscanned were about 20 um x 30 um and not more than 100 um from thefracture edge. With GAMAP lead was detected on the granule surface,but none was detected in the granule interior for the dipped andheated samples. With AGTSP samples treated the same way no lead wasdetected either on the granule surface or the interior. Because ofthe small quantity of lead present, wax penetration would distributethe wax throughout the pores thus diluting the lead concentration evenfurther, making it harder to detect. Samples prepared by using theregular spray coating technique also exhibited this response, withlead being detected on the unheated AGTSP surface but not on theheated AGTSP surface (Figure 41) and with GAMAP lead was detected onthe surface of both heated and unheated samples (Figure 42). Thisobservation confirmed the penetration phenomenon.
Therefore, an improper match of fertilizer and coating agentresulted in lower levels of dust suppression than expected. For GTSPand DAP, lower fertilizer temperatures would result in better dustsuppression effectiveness with the petrolatum waxes used in the fullscale field tests. Both the petrolatum waxes would work with GAMAP.
GENERAL CRITERIA FOR THE SELECTION OF DUST SUPPRESSANTS
A large variety of coating agents have been used to serve manydifferent purposes. The coating agents used have included wastepetroleum oils, surfactants, resins, inorganic acids, polymers, clays,diatomaceous earth and many others. The primary goals in usingcoating agents on fertilizers have been to reduce caking tendencies,reduce dust emissions, improve granule strength and provide timedrelease characteristics.
In order to be an effective dust suppressant any coating shouldhave certain qualities which will ensure success. But, it is possiblethat no coating agent would possess all the required positivequalities. A knowledge of good coating qualities would however,enhance the chances of successfully finding an appropriate coating.
The most important requirement of any dust control agent is thatit provide a significant reduction in dust emissions. In this work a90% reduction level has been chosen as a minimum requirement. Inaddition, the dust suppressant should retain its effectiveness withage. The dust control agent must not adversely affect the handling
122

123

124

characteristics of the granulated fertilizer, must not be toxic orflammable and must provide the greatest benefit for the least cost.Finally, since the dust release process is a surface phenomenonwhereby dust is released by breakage of surface crystal growth or byrelease of fine dust adhered to the granule surface, the coating mustremain where it will do most good viz., on the granule surface.
During the course of this project waxes, oils and othermiscellaneous coating agents were evaluated. Of these only some ofthe waxes were found to satisfy all the requirements discussed above.Oils and other liquid coating agents were found to have variable dustcontrol effectiveness values. Some worked well on DAP but not on GTSPwhile others did not work well at all. This was due to the porosityof the fertilizer granules and the consequent capillary forces actingon surface coatings thus drawing the coating into the granule interiorin the manner of a sponge.
Waxes may be classified in accordance with their origin asmineral, vegetable, animal, insect, synthetic, compounded and so on.The waxes evaluated have included montan wax, paraffin wax,microcrystalline wax and petrolatum waxes, all of which are of mineralorigin. Candellila wax and carnauba wax were also evaluated and theseare of vegetable origin.
Waxes, like other natural products, vary within certain limits because of their place of origin, climatic conditions, methods of
collection, handling, storage and shipping, age, exposure, impuritiesand many other factors. In addition, these waxes are usually made upof a number of distinct chemical fractions which result in the wax nothaving sharply defined properties (Bennett, 1975).
All coating agents used, including the waxes, were applied byusing pneumatic spray nozzles. Waxes can be applied to the substratein two forms. First, they can be dissolved in a volatile solventwhich plays no part in the final coating and only serves as a means oftransferring the non-volatile solute to the substrate. Secondly, theycan also be heated to a temperature beyond their melting temperatureso that the melt can then be sprayed. For this particular applicationthe first approach would not be economically feasible and would resultin very high volatile organic emissions. Therefore, the secondapproach was the one of choice.
Since the wax is sprayed, there are some practical aspects whichmust be addressed. Because no liquifying agents or solvents are used,particular attention must be paid to the coating agents' viscosity andmelting temperature. Both these factors strongly influence the flowand spray behavior of the waxes. Waxes with high melting temperaturesrequire correspondingly high heating rates to keep them in a fluidstate, require grater care in handling and are generally moredifficult to spray. Viscosity affects the degree of penetration ofthe wax into the substrate. It also governs the ease with which themelt can be sprayed and thus strongly influences the choice of wax.
125

Viscosity in the molten state generally decreases with increasingtemperatures, but excessive temperatures can lead to physical andchemical changes in the waxes which can be detrimental to theirutility.
On the other hand, the blocking characteristics of a coatingagent must also be considered. Blocking refers to the fusion of thecoatings present on separate substrate granules and can lead toagglomeration of granules which, in turn, causes the bulk product tolose its free-flowing condition. Storage conditions, principallytemperature, pressure and time, influence the blocking tendencies andas any of these three factors increases so does the tendency to block.Blocking tendencies are also significantly affected by three principalwax properties viz., melting point, oil content and ductility. Ingeneral, coatings with high oil contents have low melting temperaturesand form more ductile films which do not shrink appreciably and deformwithout fracture. However, high oil content and low meltingtemperatures increase blocking tendencies and tend to accelerate agingeffects on dust suppression effectiveness. Extreme film ductility isalso not desirable because the film formed would be either too brittleor too deformable.
The temperature of the substrate material can affect the dustsuppression effectiveness of the waxes. The higher the substratetemperature the greater the penetration of the wax into the substrate.Excessive penetration takes a significant fraction of the wax awayfrom the substrate surface, where it is most required. Other factorswhich must be considered, where appropriate, are the odor, flashpoint, volatility and toxicity of the coating agent. Coating agentswith low flash points should be avoided because of the potential firehazard while a high volatility can adversely affect the dust emissionversus age profile. Finally, cost and availability are probably themost important considerations in making a final decision about asuitable dust control agent.
It is evident that the waxes are complex in nature and that theirproperties are not sharply defined. Results of extensive testing showthat no strong correlation exists between physical properties and dustsuppression effectiveness. As a result, it is not possible to arriveat specific guidelines for the selection of waxes for specificfugitive dust suppression effectiveness values. But, based on theearlier discussion of effectiveness and handling requirements, somegeneral guidelines in the form of a range of values of selectedphysical properties will, most likely, be applicable. The appropriaterange of values of the selected parameters are as follows:
1. Melting temperature - 65°C to 95°C2. Viscosity at 100°C - 70 SUS to 120 SUS3. Oil Content - 5 % to 20%
Keeping in mind the earlier discussion, it is important to selecta coating agent which is neither too ductile nor too brittle and
126

subject to shrinkage. Petrolatum waxes based on these generalcriteria have been successfully used during the course of this projectand are not expected to significantly affect the solubility andrelease characteristics of coated fertilizers (Slack, 1968). Thesecriteria can be used to narrow the choices so that extensiveevaluations may be avoided.
127

5. SUMMARY AND CONCLUSIONS
A vertical flow dust chamber (VFDC) was thoroughly characterizedand a standard operating procedure was established. Calibration ofthe VFDC with monodisperse, solid aerosols has shown that the upperparticle penetration limit was about 100 um and the 50 % cut size was40 um. This was similar to the collection characteristics of thestandard method for ambient air sampling of total suspendedparticulate matter (TSP).
Extensive use of the VFDC established that the technique wascapable of providing extremely reproducible results. From tests withfertilizer samples it was determined that a deviation of less than 5%from average emission factor values could be easily attained. Thisfact was used to screen fertilizers from many sources and to monitorthe variation in product dustiness with time for product from a singlesource.
The fertilizer samples used during the course of this projecthave had a mean granule size between 2.0 mm and 2.5 mm and the sizedistribution was quite narrow. The granule hardness was found toincrease with increasing granule size and, in general, MAP granuleswere harder than GTSP and DAP granules.
Tests were conducted to show that granule fracture was not asignificant mode of dust release for granular fertilizers. However,with sulfur the dust release was shown to be accompanied bysignificant fracture and generation of fines. The latter mode of dustrelease has been observed with coal, char particles and detergentpowders in other studies. The generation of dust was due to abrasionof surface dust, dislodgement of adhered dust due to impact forces andbreakage of surface crystal growths.
The performance of oils was found to improve with increasingkinematic viscosity and aniline point but long term performance wasstill inadequate with GTSP. Petrolatum waxes were found to beexcellent dust suppressants regardless of substrate material and werefound to be capable of continued long term effectiveness. Based onlaboratory tests an intermediate scale field test (ISFT) setup wasdesigned and used to evaluate the performance of petrolatum waxes on alarger scale. Results were very similar to those obtained in thelaboratory scale tests.
Full scale field tests (FSFT) were conducted at a GTSP shippingfacility handling material at a nominal process rate of 250 tons/hour.Tests conducted with two petrolatum waxes did not produce the samekind of effectiveness as had been produced during small scale tests.
128

It was determined that this was caused by an unanticipated set ofcircumstances viz., high fertilizer temperatures, slow heat lossduring transport and low petrolatum wax melting temperatures.
Further evaluations in the laboratory showed that the petrolatumwaxes spread quite easily by the process of mixing and the initialdistribution of the petrolatum wax was not a significant factor aslong as sufficient mixing was provided afterwards. The resultsobtained in the FSFT were duplicated in the laboratory and it wasfound that better performance could be obtained by using a petrolatumwax with a higher melting temperature. In addition, it was found thatboth high-melting and low-melting waxes performed extremely well whenapplied on MAP samples at temperatures upto 65°C. It was apparent that a number of factors were involved in determining effectivenessincluding fertilizer temperature, fertilizer cooling rate, coatingaging time, petrolatum wax softening point and, most importantly,fertilizer porosity. A number of techniques were used to show thatthe loss in performance was due to absorption of the coating agentinto the interior of granules. It was also shown that the coatedfertilizers which showed poor performance had enough pore volume toabsorb the coating agent.
Based on the above results it was concluded that the selection ofcoating agent must take into consideration process variables likefertilizer temperature and granulation technique. Other factorsinclude melting temperature, viscosity and oil content of thepetrolatum wax. From evaluations of other natural waxes it was alsoconcluded that shrinkage and ductility of the waxes must also beconsidered in the final selection of a number of possible candidates.
The petrolatum waxes were found to be capable of extremely highdust suppression effectiveness at a cost comparable with the oilscurrently used with the added advantage of being more aestheticallypleasing, very clean and easy to spray and odorless. The performanceobserved in field use could have been significantly improved byselecting a more suitable petrolatum wax, one with a higher meltingtemperature, or by applying the petrolatum at a point in the processwhere the fertilizer temperature was better controlled at a lowerlevel. If these conditions are met the petrolatum waxes are capableof reducing dust emissions from handling by about 90 % and retainingthis performance in the long term.
129

REFERENCES
American Conference of Governmental Industrial Hygienists. 1977.Threshold Limit Values for Chemical Substances and Physical Agents inthe Workroom Environment. Cincinnati, Ohio: ACGIH.
Association of Florida Phosphate Chemists. 1980. Methods Used andAdopted by the Association of Florida Phosphate Chemists. Bartow,Florida: AFPC.
American Society for Testing Materials. 1975. Annual Book of ASTMStandards. Philadelphia, Pennsylvania: ASTM.
Achorn, F.P. and H.L. Balay.fertilizer plants.
1974. Controlling in-plant dust inIn Proceedings of the 24th Annual Meeting of the
Fertilizer Industry Round Table, Washington, D.C. pp. 76-96.
Arastoopour, H. and C. Chen. 1983. Attrition of char agglomerates.Powder Technology. 36: 99-106.
Bennett, H. 1975. Industrial Waxes, Volume II. New York, New York:Chemical Publishing Company, Inc.
Bookey, J.B. and B. Raistrick. 1960. Caking of the mixedfertilizers. In Chemistry and Technology of Fertilizers. V.Sauchelli, ed New York, New York: Reinhold Publishing Corporation.pp. 454-479.
Carnes, D. and D.C. Drehmel. 1981. The control of fugitive emissionsusing windscreens. In Proceedings of the Third Symposium on theTransfer and Utilization of Particulate Control Technology, Vol. 4.F.P. Venditti, J.A. Armstrong and M.D. Durham, eds. Research TrianglePark, North Carolina: U.S. Environmental Protection Agency. pp. 135-145.
Cheng, L. 1973. Formation of airborne-respirable dust at beltconveyor transfer points. American Industrial Hygiene AssociationJournal. 34: 540-546.
Cooper, D.W. and M. Horowitz. 1986. Exposures from indoor powderreleases: Models and experiments. American Industrial HygieneAssociation Journal. 47(4): 214-218.
Corn,. M. 1961. The adhesion of solid particles to solid surfaces,II. Journal of the Air Pollution Control Association. 11(12): 566-584.
130

Corn, M. and F. Stein. 1965. Re-entrainment of particles from aplane surface. American Industrial Hygiene Association Journal. 26:325-336.
Cowherd, C., Jr., K. Axetell, Jr., C.M. Guenther and J.A. Jutze.1974. Development of emission factors for fugitive dust sources.U.S. Environmental Protection Agency. EPA-450/3-74-037.
Cuscino, T., G. Muleski and C. Cowherd, Jr. 1983. Iron and Steelplant open source fugitive emission control evaluation. U.S.Environmental Protection Agency. EPA-600/2-83-110.
Environmental Protection Agency. 1976. Compilation of air pollutantemission factors. U.S. Environmental Protection Agency. AP 42.
Frick, J.O. 1977. Petroleum based DCA's to control fugitive dust. InProceedings of the 27th Annual Meeting of the Fertilizer Industry Round Table, Washington, D.C. pp. 94-96.
Goodwin, P.J. and C.M. Ramos. 1987. Degradation of sized coal attransfer points. Bulk Solids Handling. 7(4): 517-534.
Hammond, C.M., N.R. Heriot, R.W. Higman, A.M. Spivey, J.H. Vincent andA.B. Wells. 1985. Dustiness Estimation Methods for Dry MaterialsPart 1, Their Uses and Standardization and Part 2, Towards a StandardMethod. London, England: British Occupational Hygiene Society.
Hesketh, H.E. and F.L. Cross. 1983. Fugitive Emissions and Controls.Ann Arbor, Michigan: Ann Arbor Science.
Higman, R.W., C. Schofield and M. Taylor. 1983. Bulk materialdustiness, an important material property--Its measurement andcontrol. Presented at the 4th International Environment and SafetyConference, London, England.
Hoffmeister, G. 1979. Physical Properties of Fertilizers and Methodsfor Measuring Them. Muscle Shoals, Alabama: National FertilizerDevelopment Center.
Jager, L. and P. Hegner. 1985. Physico-mechanical properties offertilizers. Fertilizer Technology. 1(2): 191-221.
Jutze, G.A., J.M. Zoller, T.A. Jansen, R.S. Amick, C.E. Zimmer andR.W. Gerstle. 1977. Technical guidance for control of industrialprocess fugitive particulate emissions. U.S. EnvironmentalProtection Agency. EPA-450/3-77-010.
Kenson, R.E. and P.T. Bartlett. 1976. Technical manual for measurement of fugitive emissions: Roof monitor sampling method forindustrial fugitive emissions. U.S. Environmental Protection Agency.EPA-600/2-76-089b.
131

Ketkar, A.B. and D.V. Keller, Jr. 1975. Adhesion of micron-sizedlimestone particles to a massive coal substrate. Journal of Adhesion.7: 235-251.
Kjohl, 0. 1976. Product quality requirements in bulk shipment offertilizers. In Proceedings of the International SuperphosphateManufacturers Association Technical Conference, The Hague,Netherlands. pp. 144-165.
Knight, P.C. and J. Bridgewater. 1985. Comparison of Methods forassessing powder attrition. Powder Technology, 44: 99-102.
Kolnsberg, H.J. 1976. Technical manual for measurement of fugitiveemissions: Upwind/downwind sampling method for industrial emissions.U.S. Environmental Protection Agency. EPA-600/2-76-089a.
Kolnsberg, H.J., P.W. Kalika, R.E. Kenson and W.A. Marrone. 1976.Technical manual for measurement of fugitive emissions: Quasi-stacksampling method for industrial fugitive emissions. U.S. EnvironmentalProtection Agency. EPA-600/2-76-089c.
Larsen, R.I. 1958. The adhesion and removal of particles attached toair filter surfaces. American Industrial Hygiene Association Journal.19: 265-270.
Lundgren, D.A. and H.J. Paulus. 1975. The mass distribution of largeatmospheric particles. Journal of the Air Pollution ControlAssociation. 25: 12-27.
Midwest Research Institute. 1977. A study of fugitive emissions frommetallurgical processes. U.S. Environmental Protection Agency.Contract Number 68-02-2120.
Nakai, M., Y. Ichikawa and K. Sada. 1986. Coal particle dispersionmonitoring system. Atmospheric Environment. 20(10): 1891-1895.
PEDCO Environmental, Inc. 1976. Evaluation of fugitive dustemissions from mining. U.S. Environmental Protection Agency.Contract Number 68-02-1321.
Robson, C.D. and K.E. Foster. 1962. Evaluation of air particulatesampling equipment. American Industrial Hygiene Association Journal.23: 404-410.
Sarbaev, A.N. and M.A. Lavkovskaya. 1978. Conditioning additives toimprove the properties of complex fertilizers. The Soviet ChemicalIndustry. 1O(9): 755-756.
Schofield, C., H.M. Sutton and K.A.N. Waters. 1979. The generationof dust by material handling operations. Powder and Bulk Solids
Technology. 3(1): 40-44.
132

Slack, A.V. 1968. Fertilizer Developments and Trends. Park Ridge,Illinois: Noyes Development Corporation.
Stone, W. 1930. Some Phenomena of the Contact of Solids. PhilosophyMagazine. 9: 610-620.
Sutter, S.L. and M.A. Halverson. 1984. Aerosols generated byaccidents: Pressurized liquid release experiments. AmericanIndustrial Hygiene Association Journal. 45(4): 227-230.
Sutter, S.L., J.W. Johnston and J. Mishima. 1982. Investigation ofaccident-generated aerosols: Releases from free fall spills.American Industrial Hygiene Association Journal. 43(7): 540-543.
Van Den Tempel, M. 1972. Interaction forces between condensed bodiesin contact. Advances in Colloid and Interface Science. 3: 137-159.
Vanderpool, R.W. 1983. Calibration of the Wide-Range AerosolClassifier Impactors. M.E. Thesis, University of Florida.
Wedding, J.B., A.R. McFarland and J.E. Cernak. 1977. Large particlecollection characteristics of ambient aerosol samplers. EnvironmentalScience and Technology. 11: 387-390.
Wells, A.B. and D.J. Alexander. 1978. A method for estimating thedust yield of powders. Powder Technology. 19:. 271-277.
133

APPENDIX
This Appendix contains a partial list of patents relating tocoating agents used with fertilizers for the purpose of reducingcaking and dustiness.
1.
2.
3.
4.
5.
6.
7.
8.
9.
10
Adams, B.E., W.H. Lawhon, and B.C. Philips, "FertilizerGranules," U.S. Patent 3630713, December 28, 1971.(Coating Agent -- Vegetable Oils/High Wax Oil, Cement and Salt)
Arend, K.H., V. Schmide, K.C. Traenckner, K.F. Weitendorf and G.Langhans , "Fertilizer with Dust-free, Nonagglomerating, andGood Storage Properties," German Patent 2018623, November 11,1971.(Coating Agent -- Polymer and Amine)
Cook, L.H. and S. Atkin, "Coating Fertilizer Granules," U.S.Patent 3477842, November 11, 1969.(Coating Agent -- Urea and Formaldehyde Reaction Product)
Giesicke, H.J., "Dustless Granulated Mineral Fertilizer," GermanPatent 2003862, August 12, 1971.(Coating Agent. -- Water Soluble Resin)
Goodale, C.D. and J.A. Frump, "Process for Improving Storabilityand Controlling Release of Fertilizers by Coating with InorganicSalts," U.S. Patent 3419379, December 31, 1968.(Coating Agent -- Concentrated Acids)
Jack, J., J. Drake, D.C. Thompson and F.J. Harris, "NoncakingFertilizer Compositions," German Patent 1767304, September 16,1971.(Coating Agent -- Mineral Oil and Silane)
Jones, J.C. and G.C. Price,"Coating Fertilizer Granules withSilicones and Fuel Oil," British Patent 1161609, August 13, 1969.(Coating Agent -- Fuel Oil and Silicones)
Lueth, G. and R Zink , "Polyolefin Coating to Prevent Dusting orCaking of Fertilizers," German Patent 1905834, September 3, 1970.(Coating Agent -- Polyethylene Wax and Surfactant)
Robins, P.J. and P. Hayler "Compositions for Coating GranularFertilizers," German Patent 2120385, November 11, 1971.(Coating Agent -- Waxy Substance and Amine)
Sarrade-Loucheur, J., "Coatings Preventing Dust Formation onFertilizer Granules," German Patent 2037647, February 11, 1971.(Coating Agent -- Gums, Gelatins and Amines)
134

11. Schmidt, V., K.H. Arend, K.F. Weitendorf, K.C. Traenchner and F.Langhans, "Nondusting and Nonclumping Mineral Fertilizers," German Patent 1947874, May 13, 1971.(Coating Agent -- Polymer, Wax and Amine)
12. Kistler, J.P. and M. Guinot, "Anticaking Compositions," U.S.Patent 4185988, January 29, 1980.(Coating Agent -- Mineral Oil and Surfactant)
13. Tsekhanskay, Y.V., "Preventing the Caking of Ammonium Nitrate,"USSR Patent 618363, August 5, 1978.(Coating Agent -- Silicones)
14. Koch, H.K. and W. Rupilius, "Fertilizer Compositions Carrying anAminoalkanol as Anticaking Agent," U.S. Patent 4105430, August 8,1978.(Coating Agent -- Fatty Aminoalkanol)
15. Pas, M.D. and I. Johnston, "Coating Particulate Fertilizers,"British Patent 1527597, October 4, 1978.(Coating Agent -- Liquid Paraffin, Surfactant and Polymer)
16. Bennett, F.W. and R.S. Nunn, "Coating Fertilizers," BritishPatent 1470652, April 21, 1977.(Coating Agent -- Polyolefin Wax, Surfactant and Water)
17. Knorre, H. and J. Fischer, "Anticaking Composition for InorganicSalts," German Patent 2456433, June 10, 1976.(Coating Agent -- Metal Oxide, Ferrocyanide and HydrophobicAgent)
18. Kistler, J.P. and M. Guinot, "Fertilizer Conditioner," GermanPatent 2664522, April 14, 1977.(Coating Agent -- Sodium Salt of Alkylaryl Sulfonic Acid andParaffinic Mineral Oil)
19. Bennett, F.W. and RJ. Nunn, "Coating Particles," British Patent1462181, January 19, 1977.(Coating Agent -- Polyolefin Wax, Surfactant and Water)
20. Takashima, H. and F. Yamada, "Urea Fertilizer Coating," JapanPatent 75129362, October 13, 1975.(Coating Agent -- Reaction Product of Organic Isocyanate andAmmonia)
21. Steinmetz, W.E., "Prevention of Caking of Potassium Bisulfate,"U.S. Patent 3936392, February 3, 1976.(Coating Agent -- Ground Phosphate Rock)
135
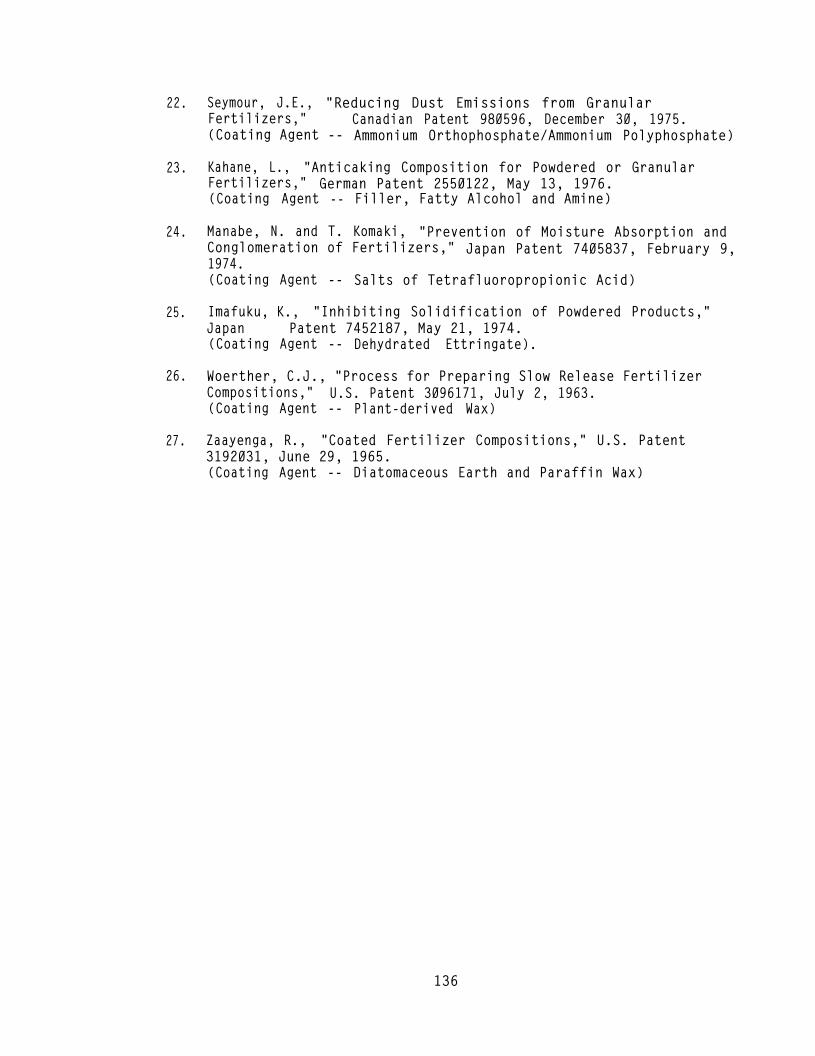
22. Seymour, J.E., "Reducing Dust Emissions from GranularFertilizers,"(Coating Agent --
Canadian Patent 980596, December 30, 1975.Ammonium Orthophosphate/Ammonium Polyphosphate)
23. Kahane, L., "Anticaking Composition for Powdered or GranularFertilizers," German Patent 2550122, May 13, 1976.(Coating Agent -- Filler, Fatty Alcohol and Amine)
24. Manabe, N. and T. Komaki, "Prevention of Moisture Absorption andConglomeration of Fertilizers,"1974.
Japan Patent 7405837, February 9,
(Coating Agent -- Salts of Tetrafluoropropionic Acid)
25. Imafuku, K.,Japan
"Inhibiting Solidification of Powdered Products,"Patent 7452187, May 21, 1974.
(Coating Agent -- Dehydrated Ettringate).
26. Woerther, C.J., "Process for Preparing Slow Release FertilizerCompositions," U.S. Patent 3096171, July 2, 1963.(Coating Agent -- Plant-derived Wax)
27. Zaayenga, R., "Coated Fertilizer Compositions," U.S. Patent3192031, June 29, 1965.(Coating Agent -- Diatomaceous Earth and Paraffin Wax)
136