Embed Size (px)
Citation preview

1
FUELWOOD COLLECTION AND CONSUMPTION: A CASE STUDY IN LUPETA,
TANZANIA
By
Katie M. Preston
A THESIS
Submitted in partial fulfillment of the requirements for the degree of
MASTER OF SCIENCE
In Forestry
MICHIGAN TECHNOLOGICAL UNIVERSITY
2012
2012 Katie M. Preston

2
This thesis has been approved in partial fulfillment of the requirements for the Degree of
MASTER OF SCIENCE in Forestry.
School of Forest Resources and Environmental Science
Thesis Advisor: Thomas Pypker
Committee Member: Blair Orr
Committee Member: Diane Shoos
School Dean: Terry Sharik

3
TABLE OF CONTENTSACKNOWLEDGEMENTS ..................................................................................................................... 4 ABSTRACT ................................................................................................................................................ 5 CHAPTER 1- INTRODUCTION ........................................................................................................... 6
INTRODUCTION TO STUDY ................................................................................................................................ 7 CHAPTER 2-COUNTRY BACKGROUND .................................................................................... 10
LOCATION ............................................................................................................................................................. 10 HISTORY ................................................................................................................................................................ 11 CLIMATE AND TOPOGRAPHY ......................................................................................................................... 12 THE PEOPLE, CULTURE, AND RELIGION ................................................................................................... 13 HEALTH ................................................................................................................................................................ .. 15 ECONOMY ............................................................................................................................................................. 15
CHAPTER 3-STUDY SITE BACKGROUND................................................................................ 17 INTRODUCTION ................................................................................................................................................... 17 STUDY SITE ......................................................................................................................................................... 17
CHAPTER 4-METHODS ..................................................................................................................... 20 INTERVIEW ............................................................................................................................................................ 20 HUMAN SUBJECT RESEARCH ......................................................................................................................... 21 FUELWOOD WALKS ........................................................................................................................................... 21 TRANSECT WALKS ............................................................................................................................................ 23 DATA ANALYSIS .................................................................................................................................................. 25
CHAPTER 5- RESULTS ..................................................................................................................... 27 FOREST INVENTORY ......................................................................................................................................... 27 COLLECTION ........................................................................................................................................................ 30 CONSUMPTION .................................................................................................................................................... 34
CHAPTER 6-DISCUSSION ............................................................................................................... 37 FOREST INVENTORY ......................................................................................................................................... 37 COLLECTION ........................................................................................................................................................ 38 CONSUMPTION .................................................................................................................................................... 42 PREFERENCES .................................................................................................................................................... 43
CHAPTER 7-CONCLUSION ............................................................................................................. 45 REFERENCES ....................................................................................................................................... 48 APPENDIX A: COPYRIGHT PERMISSION ................................................................................. 52 APPENDIX B: INTERVIEW QUESTIONS .................................................................................... 54 APPENDIX C: DISTRICT PERMISSION ..................................................................................... 57 APPENDIX D: DATA .......................................................................................................................... 58

4
Acknowledgements
I would like to thank Tom Pypker and Blair Orr for all their amazing support while in
Tanzania and at home and their counsel in writing this thesis. Also thank you to Diane
Shoos for being on my committee. I would like to thank Peace Corps Tanzania and all
the volunteers that had to sit and listen to me talk on and on about my study, especially
Randi, Tanya, Claire, and Kenzi. Also to Devis Mlowe at the Mpwapwa Forestry Office
and the villagers of Lupeta for helping me in my data collection and constant questions,
especially Jesca Manyonga, Jesca Maziwa, and Talita Kamala. I cannot forget my office
mates: Ruth and Jon, you guys helped me stay sane when questioning everything. And of
course to my wonderful family and friends that supported my in all of my ups and downs
along the way. I love you all so much; thank you will never be enough.
5
Abstract
Fuelwood is a major resource in rural areas. Fuelwood collection and
consumption habits were monitored in Lupeta, Tanzania through household interviews
and fuelwood collection walks. Social dimensions, economic aspects of fuelwood, and
alternative fuel sources were also examined. The study found that for all wealth classes,
fuelwood is the primary source of fuel used within the village, with the middle and upper
classes occasionally supplementing fuelwood with charcoal. Women collect and
consume fuelwood for cooking. The majority of women (69%) prefer to use charcoal
because fuelwood collection is labor intensive and time consuming. While the use of
charcoal would provide more time for other required household activities, local economic
constraints inhibit their adoption. The fuel shift from biomass fuels to transition fuels is
happening slowly in Lupeta from fuelwood to charcoal. As fuelwood becomes scarcer,
improved methods will need to be adopted or the fuel source will change.

6
Chapter 1- Introduction
I served in Peace Corps Tanzania as an environmental extension volunteer within
the environment sector from August 2010 until July 2012. After arriving at site, I spent
the first year getting to know the people, the language, and generally learning how to live
in a rural community without electricity and running water. I learned that I had to get out
of the house, explore, and interact with my village if I wanted to know and understand
my community. While walking through the village and waiting to getting water, I
noticed several women walking back into the village with large bundles of fuelwood on
there heads. There were always people walking to and from the village, either on their
way to get fuelwood or coming back, usually making trips early in the morning or in the
late afternoon (Figure 1.1).
After seeing these women walking to and from the village, I gathered up the
courage to speak in Kiswahili and began to ask the villagers questions about fuelwood. I
learned that fuelwood was the main source of fuel within the village. I became more
curious and began accompanying women on fuelwood walks, which always seemed to
give them a good laugh.

7
Figure 1.1: Women walking home after collecting fuelwood in the mountains. Photo credit: Katie Preston.
Introduction to Study
As one looks at the developing world, differences in fuel sources used can be
noted across the different landscapes and socioeconomic divides that exist. Fuel is an
essential source needed in the household to survive. Fuel is needed for light, heat, and
cooking (Heltberg, 2003). Access to fuel can also improve the health and education of the
household by improving air pollution quality and allowing light for studying at night
(Heltberg 2003).
In the household, an “ideal” fuel preference ladder with biomass fuels at the
bottom and kerosene and electric at the top exists (Leach 1992). Preferences to these

8
fuels are based on presumed rank built on physical characteristics of cleanliness, ease of
use, and cooking speed (Horst & Hovorka 2008). The households transition up and down
the fuel ladder with the rise and fall of the household income, the improved distribution
and availability of fuels, or the increasing scarcity of a fuel source (Horst & Hovorka
2008).
The fuel preference ladder is broken down into 3 categories: biomass fuels,
transition fuels, and modern fuels. The biomass fuels are divided into two categories:
dung and crop residue, fuelwood. Dung and crop residue reside below fuelwood and are
used when fuelwood is scarce. Biomass lies at the bottom of the ladder. On the next tier
are transition fuels of charcoal and coal. The top tier consists of kerosene, electric,
liquefied petroleum gas (LPG), solar, and wind (Figure 1.2).
Figure 1.2: Energy ladder preferences The purpose of this study was to examine the fuelwood collection and
consumption habits of villagers living in the village of Lupeta, Tanzania. While also
looking at how fuelwood collection affects the forest and wealth classes of villagers and
the preferences that women had towards fuelwood collection. When looking at the fuel
preference ladder, it is interesting to note that a shift is starting from biomass fuels into

9
transition fuels. This can be seen by looking at the difference wealth classes and the
ability of the middle and upper class to supplement fuelwood with charcoal.
I hypothesized that fuelwood would be the primary source of fuel in the village.
The collection of fuelwood is a labor-intensive and time consuming process that affects
the lower class more. And charcoal is the preferred fuel source due to income restraints
fuelwood would be used more.
Chapter Two provides a general background of the country of Tanzania with a
focus on the people and culture, history, government, and the economy. Chapter Three
takes a closer look into fuelwood collection in developing countries and the village of
Lupeta, where the study was conducted. The methodology of the study is described in
Chapter Four. Results of the study are covered in Chapter Five. The discussion section
is presented in Chapter Six and looks specifically at the forest inventory and consumption
and collection habits of the villagers by wealth class. In Chapter Seven, a conclusion of
the results and discussion is given with recommendations on the future of fuelwood
consumption and collection patterns.
10
Chapter 2-Country Background
Location
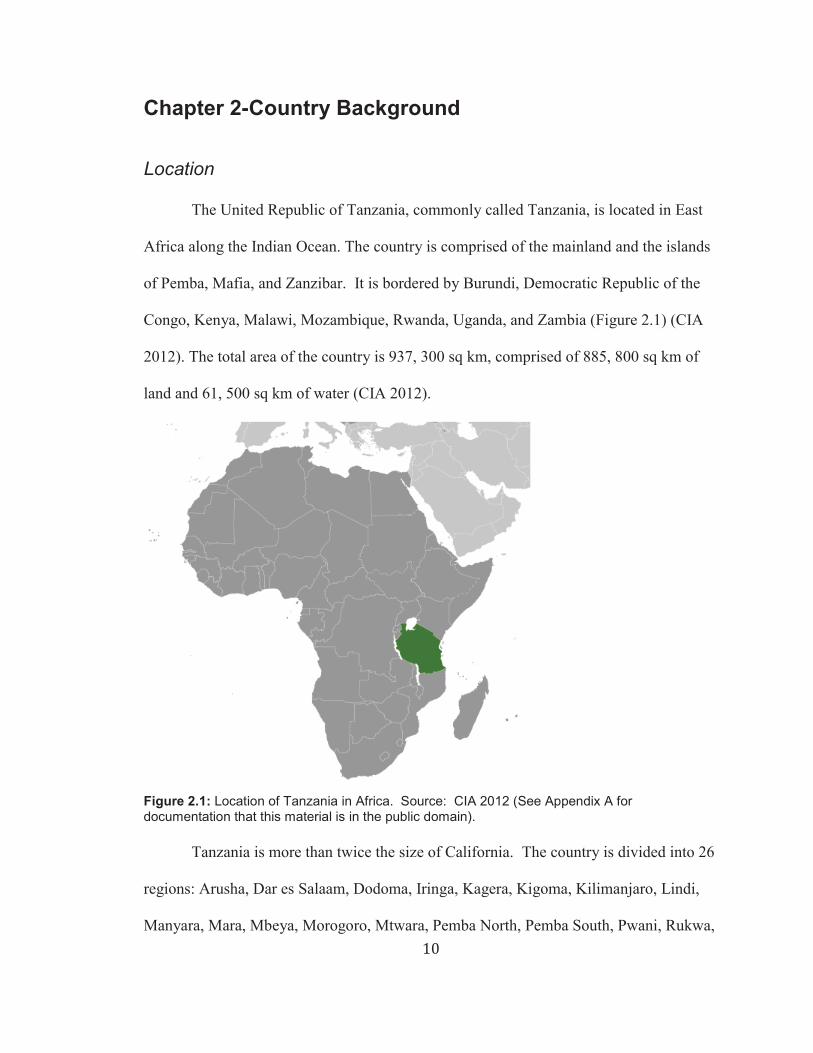
The United Republic of Tanzania, commonly called Tanzania, is located in East
Africa along the Indian Ocean. The country is comprised of the mainland and the islands
of Pemba, Mafia, and Zanzibar. It is bordered by Burundi, Democratic Republic of the
Congo, Kenya, Malawi, Mozambique, Rwanda, Uganda, and Zambia (Figure 2.1) (CIA
2012). The total area of the country is 937, 300 sq km, comprised of 885, 800 sq km of
land and 61, 500 sq km of water (CIA 2012).
Figure 2.1: Location of Tanzania in Africa. Source: CIA 2012 (See Appendix A for documentation that this material is in the public domain).
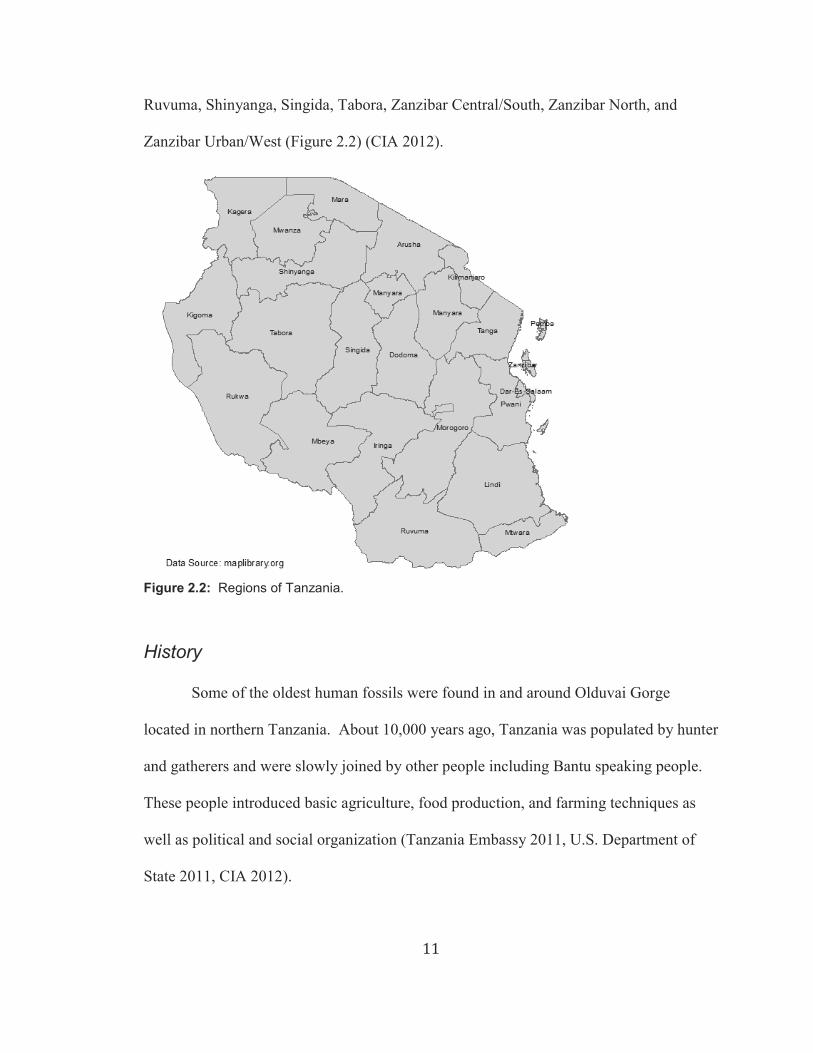
Tanzania is more than twice the size of California. The country is divided into 26
regions: Arusha, Dar es Salaam, Dodoma, Iringa, Kagera, Kigoma, Kilimanjaro, Lindi,
Manyara, Mara, Mbeya, Morogoro, Mtwara, Pemba North, Pemba South, Pwani, Rukwa,
11
Ruvuma, Shinyanga, Singida, Tabora, Zanzibar Central/South, Zanzibar North, and
Zanzibar Urban/West (Figure 2.2) (CIA 2012).
Figure 2.2: Regions of Tanzania. History
Some of the oldest human fossils were found in and around Olduvai Gorge
located in northern Tanzania. About 10,000 years ago, Tanzania was populated by hunter
and gatherers and were slowly joined by other people including Bantu speaking people.
These people introduced basic agriculture, food production, and farming techniques as
well as political and social organization (Tanzania Embassy 2011, U.S. Department of
State 2011, CIA 2012).
12
Early in the first Millennium CE, Arabians and Persians established a presence
on the East African coast. The economy was made economically strong by participation
within the Indian Ocean trade route. As a result of their presence, Islam was introduced
and Arabic influences and the Kiswahili language entered the culture (Tanzania Embassy
2011). The first European, Vasco da Gama, reached East Africa in 1498, and with him
the Portuguese took control of the coast. In the late 1600s, Arabs from Oman established
themselves, moved the capital of Oman to Zanzibar, and created new caravan routes,
mainly for the trade of slaves and ivory (CIA 2012, U.S. Department of State 2011).
In the late 1800s, Germans took control of the mainland and introduced several
crops including sisal, cotton, and plantation-grown rubber. British troops occupied
German East Africa during World War I. After the end of World War I the League of
Nations mandated it to the United Kingdom (CIA 2012, U.S. Department of State 2011,
CIA 2012).
Tanganyika received its independence from the United Kingdom on December 9,
1961 and united with Zanzibar on April 26, 1964 to form the United Republic of
Tanganyika. The United Republic of Tanganyika was later renamed the United Republic
of Tanzania (CIA 2012, U.S. Department of State 2011).
Climate and Topography
Tanzania is home to Mount Kilimanjaro (5895 m, largest peak), Lake Victoria
(the largest freshwater lake), and Lake Tanganyika (the deepest lake). The landscape is
dominated by the Great Rift Valley with the terrain comprised of plains along the coast, a
plateau in the central region, and highlands in the north and south (FAO 2012).
13
Woodland, grassland, and bushland account for 80% of the landcover in Tanzania (FAO
2012).
Climate varies from tropical along the coast to temperate in the highlands (CIA
2012). The region is dominated by unimodal or bimodal rainfall with annual rainfall
ranging between 500 mm to 3000 mm. Unimodal occurs in the central, southern, and
southwestern highlands from October/ November to April. Bimodal type occurs along
the coastal belt, the northeastern highlands, and the Lake Victoria Basin with the short
rains in October to December and the long rains occurring March to June (FAO 2012).
The People, Culture, and Religion
Tanzania has a population 43.1 million people with 41.8 million living on the
mainland and 1.3 million on Zanzibar (U.S. Department of State 2011). Ethnic groups
consist of Africans (99%) and Asians, Europeans, Arabs (1%) (Figure 2.3). Of the
African population, 95% are Bantu consisting of over 130 tribes (CIA 2012).

14
Figure 2.3: Local Children. Photo by Randi Walsh. (See Appendix A for documentation of permission to use this material)
The official languages of Tanzania are Kiswahili and English with many people
also speaking Arabic (CIA 2012). Within the country 156 spoken languages are present
including Sukuma and Gogo (Muzale & Rugemalira 2008). The first language of most
people is their local language.
Religious beliefs in Tanzania include Christianity (63%), Islam (35%), and
indigenous beliefs, Sikh, Hindu, and Baha’i (2%). (U.S. Department of State 2011)
Islam is dominant in Zanzibar, Pemba, and along the coastline and as one moves inland
Christianity becomes more dominant.

15
Health
The life expectancy for males and females is 53 years and 58 years respectively
(WHO 2012). The leading cause of death is HIV/AIDs with 5.6% of the population (1.4
million) living with HIV/AIDS (WHO 2012). Major infectious diseases include bacterial
diarrhea, hepatitis A, typhoid, plague, schistosomiasis, and rabies (CIA 2012). Malaria
is responsible for one-third of deaths among children under 5 years, with over 95% on the
population at risk for malaria infection (Mboera et al. 2007).
Economy
The country’s gross domestic product (GDP) was 64.71 billion dollars and
averaged 7% GDP growth per year between 2000 and 2008 on strong gold production
and tourism (CIA 2012). The industrial sector accounts for 22.6% of the GDP and
includes food processing, mining, and textile production with most of the industry
concentrated in Dar es Salaam (CIA 2012, U.S. Department of State 2011).
Agriculture is the largest sector and accounts for 27% of the GDP and 80%
employment (CIA 2012). Eighty percent of goods come from the surplus of smallholders
and account for 75% of the export earnings within the agricultural sector (FAO 1995).
Of the population, 80% live in rural communities (U.S. Department of State 2011). In
these rural communities, 98% of women participate in agriculture and produce a large
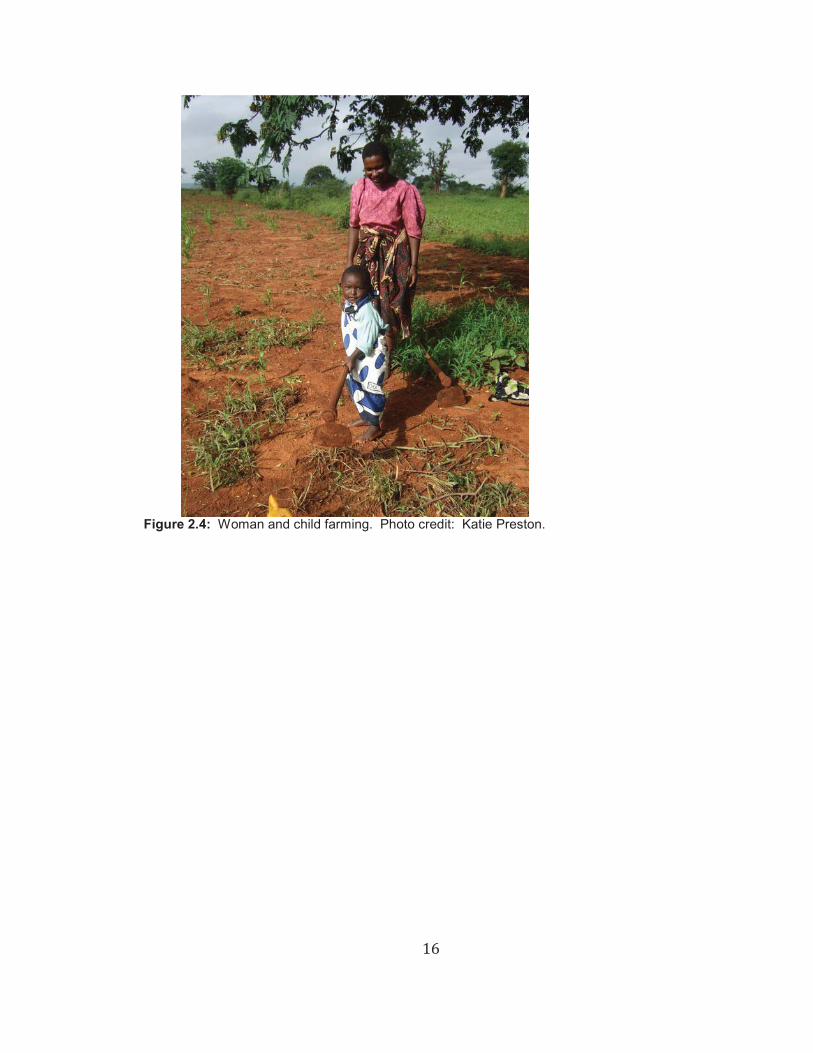
share of the food crops for household consumption and export (Figure 2.4) (FAO 1995).
Cash crops include coffee, tea, cotton, and cashews (CIA 2012). Agricultural duties in
addition to household duties take up a large portion of a rural woman’s day. This study
focuses on fuelwood collection, which is included in a woman’s household duties.
16
Figure 2.4: Woman and child farming. Photo credit: Katie Preston.
17
Chapter 3-Study Site BackgroundIntroduction
The main source of fuel in both urban and rural areas within developing countries
is biomass (FAO 2012). Biomass is commonly available in two forms: charcoal and
fuelwood. Charcoal is energy that is made from wood, while fuelwood is collected and
used directly from the field (FAO 2012).
Fuelwood gathered from forested areas is the most important source of domestic
energy for the developing world (Heltberg et al. 2000). African countries still heavily
rely on fuelwood to meet their basic energy needs. An estimated 60-85% of Africans use
fuelwood as their primary source of fuel (FAO 2009). In Tanzania, 90% of the total
energy consumption (biomass, petroleum, electricity, coal) is fuelwood (SADC 1993).
In most rural households, women collect and consume fuelwood for household use (FAO
1995). Study Site The study site was located in the village of Lupeta, Mpwapwa district, Dodoma
region of Central Tanzania (Figure 3.1) (6°23'24.84"S 36°32'28.69"E). Lupeta is located
on a dirt road 8 kilometers from the town of Mpwapwa.

18
Figure 3.1: Women waiting for water in Lupeta. Photo credit: Katie Preston Lupeta has 241 households and a population of 1,964. The main tribes present are
the Wagogo and Wahehe people with the main languages of Kigogo and Kiswahili
spoken. Lupeta is comprised of subsistence farmers who grow their own food for the
year and sell any surplus. The main crops cultivated are sorghum, millet, groundnuts
[peanuts], sunflowers, and maize [corn]. Villagers live in mud houses with either grass
or tin roofs with a separate structure for cooking. There is no electricity within the
village, although power is planned for 2013. Water is obtained from 5 main water
stations throughout the village.
Lupeta is located within the Kiboriani Forest Reserve, which is within the Rubeho

19
Mountain block of the Eastern Arc Mountains (Figure 3.2). The Kiboriani Forest
Reserve totals 56,000 ha that includes woodland of Eastern Arc forest and grassland
habitats at higher altitudes (EAMCEF 2007). Vegetation within the area consists of a
deciduous thicket of Acacia, Cassia, Grewia, Commiphora, and Lannea species. Open
Brachystegia woodland with grass is found at altitudes above 1,200 m (TALIRI 2006).
The area is defined as Zone III, which is classified as semi-arid land with unimodal
rainfall (de Pauw 1984). The average rainfall is 500 to 800 mm with 90% of the rainfall
occurring between the months of November to April. The coldest month is August with a
minimum average temperature of 15.6 C and the warmest month is November with a
maximum temperature of 27.6 C (de Pauw 1984).
Figure 3.2: Extent of the Eastern Arc Mountain range with Lupeta located within the red circle.Source: EAMCEF 2007 (See Appendix A for documentation of permission to republish this material)

20
Chapter 4-Methods
The study was conducted from January to July of 2012 within the village of
Lupeta and the surrounding Kiboriani Forest Reserve. Qualitative and quantitative data
was gathered to gain a better understanding of fuelwood collection within Lupeta. Data
was gathered through structured household interviews with both open and closed ended
questions as well as direct and participant observations (Bernard 2002). A household is
defined as a group of people that live within the same home or compound. Quantitative
data was gathered through transect walks of fuelwood collection areas.
Interview
Before the interviews were administered two pre-test interviews were conducted
to ensure that the questions were comprehensible and appropriate. Interviews took place
face to face with the female head of the household. Information gathered on
demographics, gathering and collection of fuelwood, home and domestic attributes,
charcoal use, and social factors were recorded. (Appendix B) The sample included 32
randomly selected households out of 241 within the main village of Lupeta having an
average of 4 people (st dev 2) per household. If a household selected was unavailable to
participate, the next household on the list was interviewed. Reasons provided that a
household was unable to participate include working in another city, not living within the
area anymore, and farming within a different region. At each household, a GPS point was
taken using a Garmin 72h handheld device (Garmin International, Inc., Olathe, Kansas)
21
and general observations on harvesting, collection, and household use of fuelwood were
noted.
Human subject research
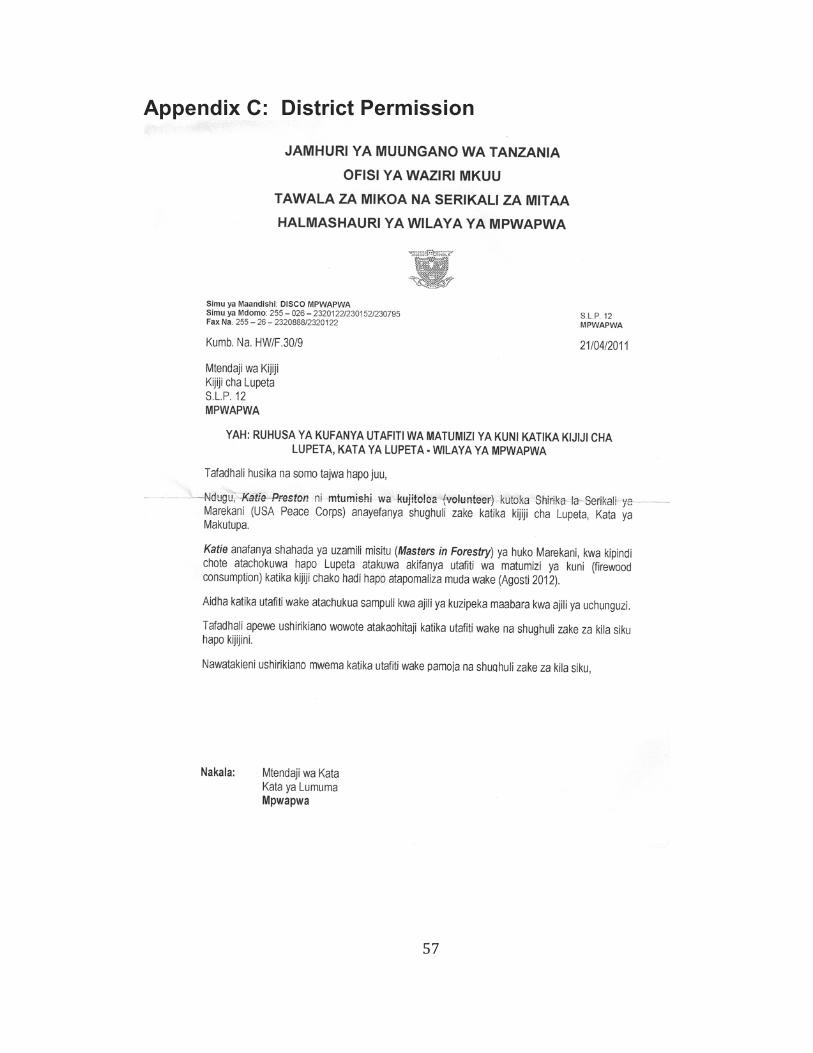
Written approval from the District Forestry Office was obtained as well as verbal
consent from the mwenyekiti, or village chairman, of Lupeta (Appendix C). The
fuelwood interview survey was approved by the Michigan Technological University
Institutional Review Board (approval # M0845E). Each household was informed that the
interview was voluntary and that the data was being collected as part of my research for
my thesis that I would complete on my return to the United States. All interviews were
spoken primarily in Kiswahili but some Kigogo was used if needed. If Kigogo was
spoken an interpreter was present to make sure that the interviewer understood what was
being stated. All answers were recorded in a Kiswahili/ English mixture.
Fuelwood Walks
Of the 32 households that were selected for interviews, 15 were accompanied on
fuelwood collection walks. The 15 households that were accompanied were based on the
availability of both the household and the interviewer/observer (Figure 4.1). The
criterion for a walk was that it must include the head woman of the household. Fuelwood
collection walks were arranged ahead of time, with the interviewer meeting at the
household at a designated time. This was repeated time after time until the walk was
completed. The walk may have been postponed for reasons including a death within the

22
family/ village, inclement weather, the household needed to go to the farm, or because
the water pipe would be open that day. The path taken from the household to the
fuelwood collection point was monitored using a GPS. The GPS was programmed to
note location, time, and distance.
Figure 4.1: Women walking to collect fuelwood. Photo credit: Katie Preston. On the walk, general observations were made about dynamics of the group
(example: who went, did they talk, what did they talk about), thought provoking
questions were asked (example: Why are we going here and not there), and age, gender,
and relationship to the household were noted. Each person’s fuelwood bundle was
measured for total wet-weight using a 35 kilogram Pesola Macro-Line 80035 Spring
Scale with 0.5 kilogram increments (Pesola, Inc.,Baar, Switzerland) (Figure 4.2).

23
Figure 4.2: Women getting ready to carry a bundle of fuelwood. Photo by Katie Preston. Transect Walks
Transect walks were done within the area of fuelwood collection. The 15-
fuelwood collection GPS points were mapped and two main fuelwood collection areas
were defined. Within these two main areas, a total of 24 points were systematically grid
sampled 161 meters apart (Figure 4.3).

24
Figure 4.3: A diagram of the fuelwood walks mapped with transect points.
At each point, a 17.5 m-radius circular plot was used and diameter at base height
(dbh), number of coppicing trees, and species were recorded. The 17.5 m-radius plot was
then divided into 4 quadrants and within each quadrant a 2 m-radius sub-plots and 1 m²
plots were chosen with a random distance and direction. Within the 2 m-radius plots,
seedling and sapling counts were written as well as species and number of trees coppiced.
At the 1 m² plots, observed ground flora was recorded (Figure 4.4) (Bork et al., in press).

25
Figure 4.4: Transect sampling method used. The 17.5m-raduis circular plot was used from tree samples, the 2 m-radius circular plot was used for tree samples, and the 1m² plot was used for ground flora.
Data Analysis
Data was analyzed using SAS (SAS Institute Inc., Cary, N.C.) (Appendix D).
Correlation tests as well as Chi Square and ANOVA tests were done on the data set to
test significance (Steel and Torrie 1960). Results of a p<0.10 were considered significant.
Some analysis relied upon understanding the wealth classes within the village.
Through the interview questions and direct observations of the household’s living
conditions, wealth classes, as outlined by Shalketon et al. (2006), were assigned based
26
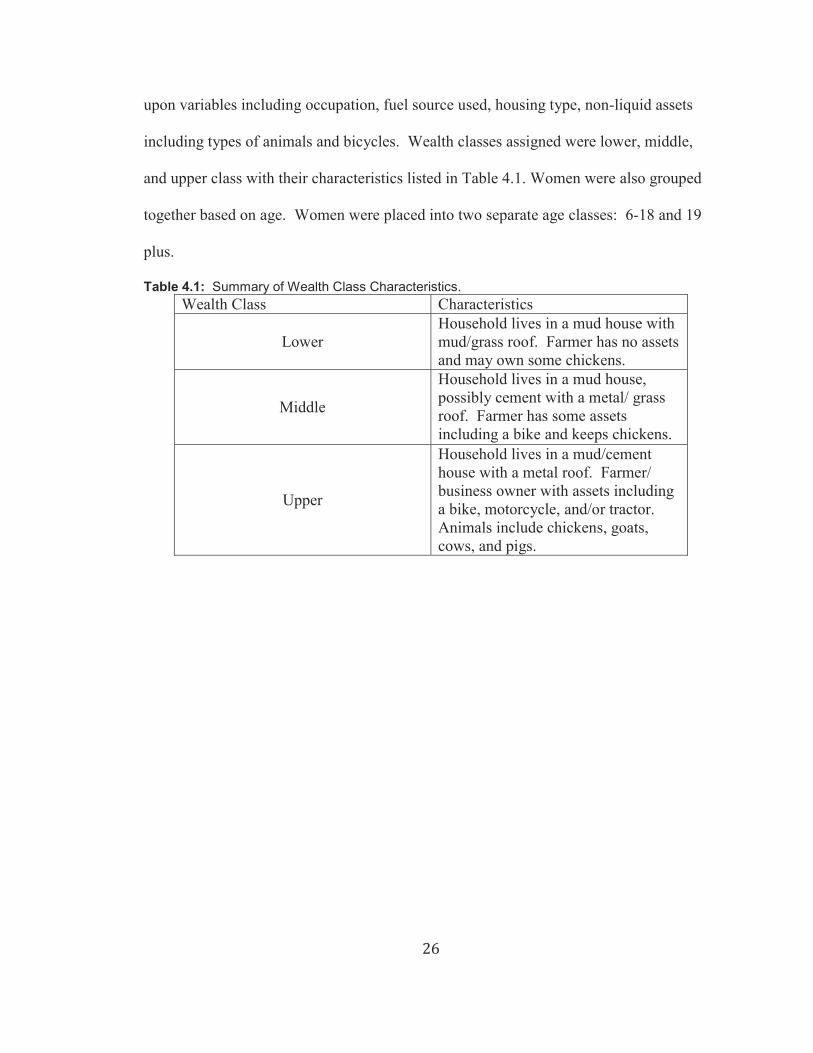
upon variables including occupation, fuel source used, housing type, non-liquid assets
including types of animals and bicycles. Wealth classes assigned were lower, middle,
and upper class with their characteristics listed in Table 4.1. Women were also grouped
together based on age. Women were placed into two separate age classes: 6-18 and 19
plus.
Table 4.1: Summary of Wealth Class Characteristics.Wealth Class Characteristics
LowerHousehold lives in a mud house with mud/grass roof. Farmer has no assetsand may own some chickens.
Middle
Household lives in a mud house, possibly cement with a metal/ grass roof. Farmer has some assets including a bike and keeps chickens.
Upper
Household lives in a mud/cement house with a metal roof. Farmer/ business owner with assets including a bike, motorcycle, and/or tractor. Animals include chickens, goats, cows, and pigs.
27
Chapter 5- Results There are two types of fuel used within the village: fuelwood and charcoal.
Fuelwood is cut and collected mainly by women of the household. Charcoal is purchased
either from neighbors or along the roadside. The objectives of this study were to examine
the fuelwood collection and consumption habits of villagers living within Lupeta,
Tanzania. The wealth classes of villagers and women’s attitudes towards collection were
considered in the analysis. This chapter presents the quantitative results and analysis of
the data.
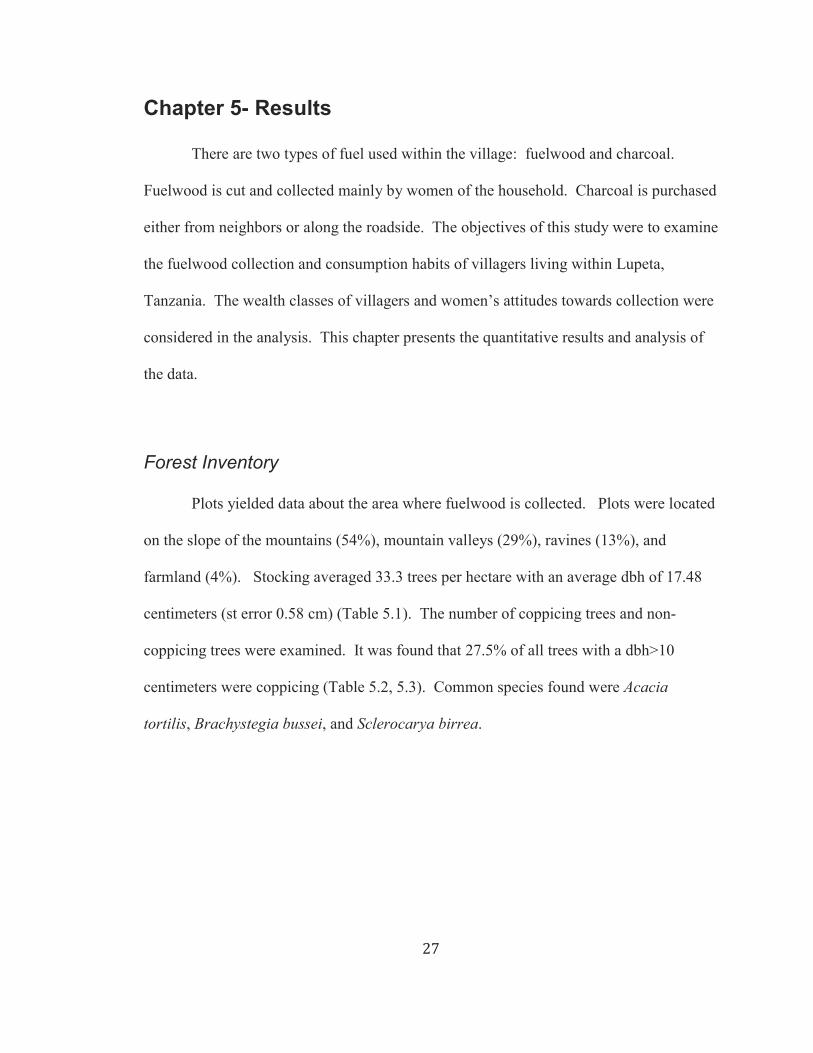
Forest Inventory Plots yielded data about the area where fuelwood is collected. Plots were located
on the slope of the mountains (54%), mountain valleys (29%), ravines (13%), and
farmland (4%). Stocking averaged 33.3 trees per hectare with an average dbh of 17.48
centimeters (st error 0.58 cm) (Table 5.1). The number of coppicing trees and non-
coppicing trees were examined. It was found that 27.5% of all trees with a dbh>10
centimeters were coppicing (Table 5.2, 5.3). Common species found were Acacia
tortilis, Brachystegia bussei, and Sclerocarya birrea.
28
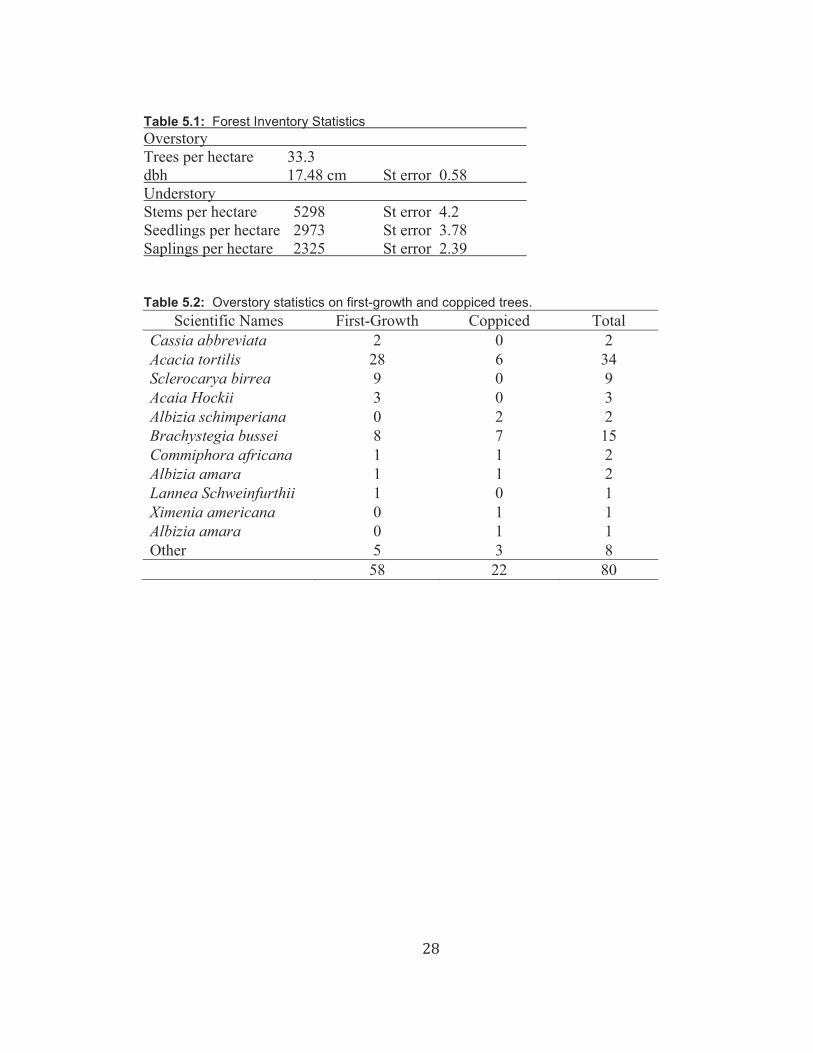
Table 5.1: Forest Inventory StatisticsOverstoryTrees per hectare 33.3dbh 17.48 cm St error 0.58 UnderstoryStems per hectare 5298 St error 4.2Seedlings per hectare 2973 St error 3.78Saplings per hectare 2325 St error 2.39 Table 5.2: Overstory statistics on first-growth and coppiced trees.
Scientific Names First-Growth Coppiced TotalCassia abbreviata 2 0 2Acacia tortilis 28 6 34Sclerocarya birrea 9 0 9Acaia Hockii 3 0 3Albizia schimperiana 0 2 2Brachystegia bussei 8 7 15Commiphora africana 1 1 2Albizia amara 1 1 2Lannea Schweinfurthii 1 0 1Ximenia americana 0 1 1Albizia amara 0 1 1Other 5 3 8
58 22 80

29
Table 5.3: Statistics of distance of uncut and cut trees from the village.
PlotDistance from Village (km)
First-growth Coppiced Total Topography
1 1.61 0 0 0 Valley2 1.77 3 0 3 Valley3 1.93 0 0 0 Valley4 2.09 2 0 2 Valley5 1.61 2 0 2 Mountain6 1.77 2 4 6 Mountain7 1.93 0 0 0 Mountain8 2.09 0 0 0 Farm
Total 9 4 139 1.29 0 0 0 Mountain10 1.45 3 0 3 Mountain11 1.61 1 0 1 Mountain12 1.77 5 0 5 Mountain13 1.61 8 0 8 Ravine14 1.77 6 0 6 Mountain15 1.93 1 0 1 Mountain16 2.09 2 1 3 Mountain
Total 26 1 2717 2.41 3 0 3 Ravine18 2.25 1 0 1 Valley19 2.09 0 4 4 Ravine20 1.93 0 3 3 Valley21 2.25 4 8 12 Mountain22 2.41 4 2 6 Mountain23 2.57 8 0 8 Valley24 2.74 3 0 3 Mountain
Total 23 17 40Grand Total 58 22 80
Seedlings (dbh<2.54 cm) and saplings (1<dbh<10 cm) in the understory averaged
5,298 (st error 4.20) stems per hectare: 2,973 (st error 3.78) seedlings per hectare and
2,325 (st error 2.38) saplings per hectare. The percentage of coppicing seedlings and
saplings were 14.7% and 40.9%, respectively (Table 5.2). The most common species in
the understory were Cassia abbreviata, Brachystegia bussei, Albizia schimperiana, and
Dichrostachys cinerea.
30
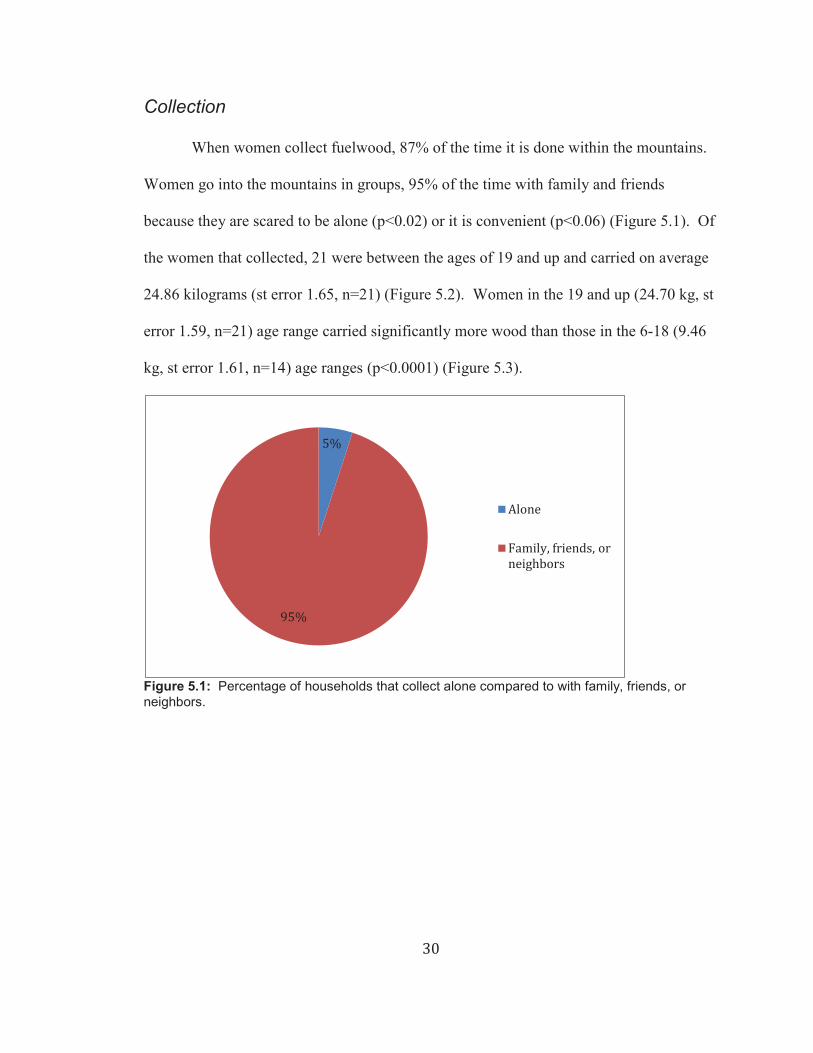
Collection When women collect fuelwood, 87% of the time it is done within the mountains.
Women go into the mountains in groups, 95% of the time with family and friends
because they are scared to be alone (p<0.02) or it is convenient (p<0.06) (Figure 5.1). Of
the women that collected, 21 were between the ages of 19 and up and carried on average
24.86 kilograms (st error 1.65, n=21) (Figure 5.2). Women in the 19 and up (24.70 kg, st
error 1.59, n=21) age range carried significantly more wood than those in the 6-18 (9.46
kg, st error 1.61, n=14) age ranges (p<0.0001) (Figure 5.3).
Figure 5.1: Percentage of households that collect alone compared to with family, friends, or neighbors.
5%
95%
Alone Family, friends, or neighbors

31
Figure 5.2: Age range of females on fuelwood collection walks.
Figure 5.3: Kilograms of fuelwood females carry by age class in one trip. Bars represent standard error. *p<0.0.0001 An average distance of 3.86 kilometers (st error 0.29, n=15) was walked round
trip to collect fuelwood with more time spent collecting fuelwood than walking to and
from the collection site. For each trip, the average household spent 104 minutes (st error
5.42, n=15) collecting and 71 minutes (st error 5.42, n=15) walking. Within classes, the
0
5
10
15
20
25
6-12 13-18 19-55 55+
Part
icip
ants
Age
0
5
10
15
20
25
30
6-18 19 & up
Kilo
gram
s
Age
*
*

32
upper class spent significantly more time (128 minutes, st error 16.74, n=3) collecting
fuelwood per trip compared to the lower class (p<0.08, 79 minutes, st error 8.94, n=5).
The middle classes collection time per trip was on average 112 minutes (st error 12.09,
n= 7) (Figure 5.4).
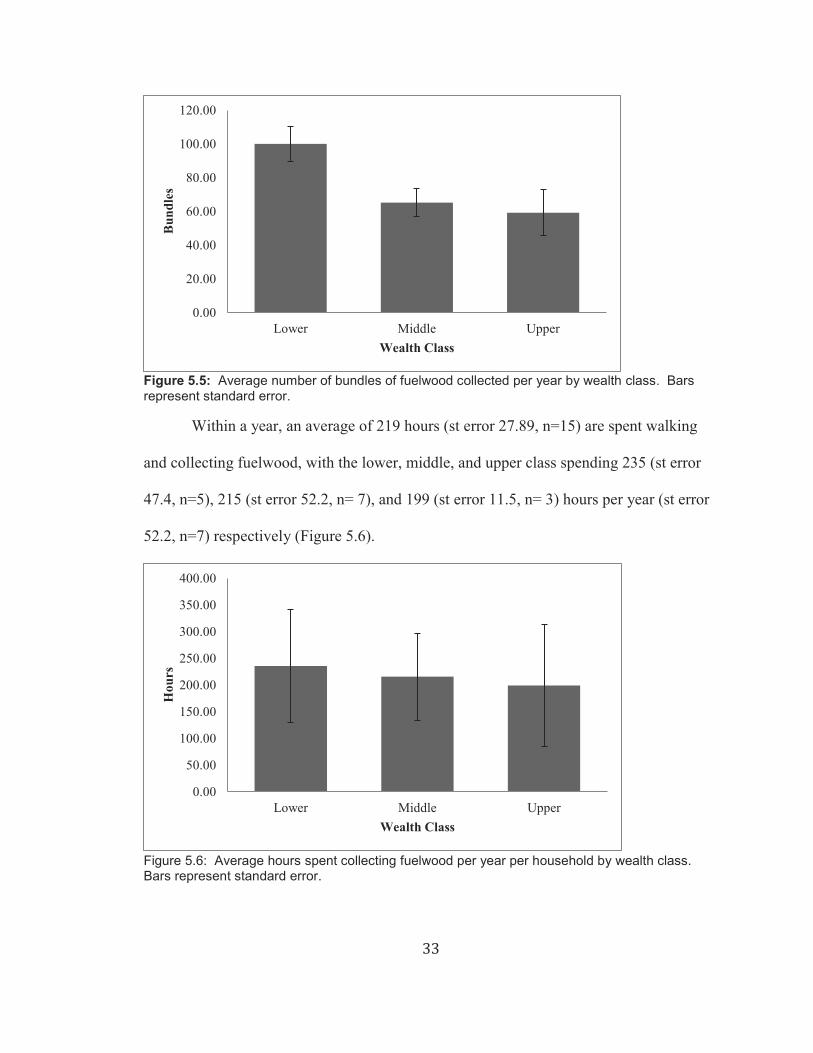
Figure 5.4: Average collection and walking time per trip per household by wealth class. Bars represent standard error. *p<0.08 During the dry season, more fuelwood was collected than was immediately
needed. The extra fuelwood is stockpiled for the wet season. The average bundles of
fuelwood collected per year per household are 76 bundles (st error 9.97, n=15) collected
mainly during the dry season. The lower class collects the most often with 100 bundles
(st error 24.42, n=5) followed by the middle class (65 bundles, st error 9.86, n=7) and the
upper class (60 bundles, st error 6.93, n=3) (Figure 5.5). The wet season is mainly spent
farming, thus less time is spent collecting fuelwood. Of the 32 households interviewed,
11 said they collect 1-2 times per week during the wet season.
0
20
40
60
80
100
120
140
160
Lower Middle Upper
Min
utes
Wealth Class
Collection
Walking
* *
*
33
Figure 5.5: Average number of bundles of fuelwood collected per year by wealth class. Bars represent standard error. Within a year, an average of 219 hours (st error 27.89, n=15) are spent walking
and collecting fuelwood, with the lower, middle, and upper class spending 235 (st error
47.4, n=5), 215 (st error 52.2, n= 7), and 199 (st error 11.5, n= 3) hours per year (st error
52.2, n=7) respectively (Figure 5.6).
Figure 5.6: Average hours spent collecting fuelwood per year per household by wealth class.Bars represent standard error.
0.00
20.00
40.00
60.00
80.00
100.00
120.00
Lower Middle Upper
Bun
dles
Wealth Class
0.00
50.00
100.00
150.00
200.00
250.00
300.00
350.00
400.00
Lower Middle Upper
Hou
rs
Wealth Class
34
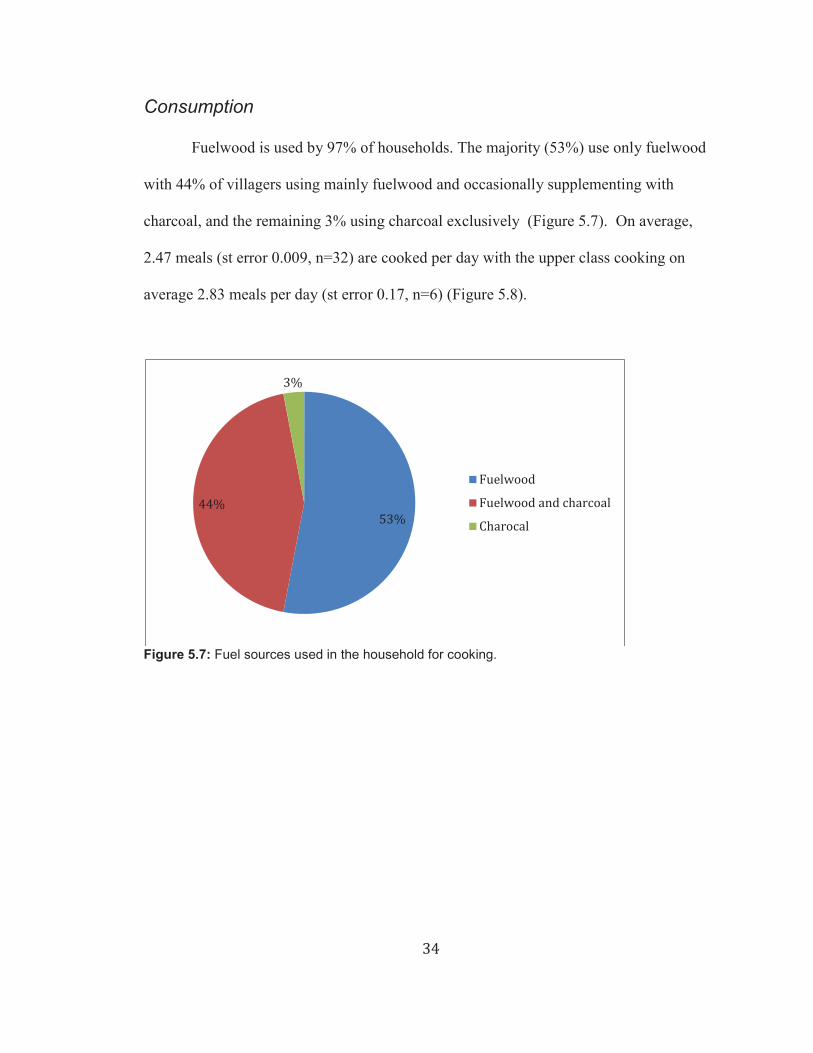
Consumption Fuelwood is used by 97% of households. The majority (53%) use only fuelwood
with 44% of villagers using mainly fuelwood and occasionally supplementing with
charcoal, and the remaining 3% using charcoal exclusively (Figure 5.7). On average,
2.47 meals (st error 0.009, n=32) are cooked per day with the upper class cooking on
average 2.83 meals per day (st error 0.17, n=6) (Figure 5.8).
Figure 5.7: Fuel sources used in the household for cooking.
53% 44%
3%
Fuelwood Fuelwood and charcoal Charocal

35
Figure 5.8: Meals cooked per day per household by wealth class. Bars represent standard error.
When cooking a meal, 1.9 kilograms (st error 0.22, n=15) of fuelwood are used
with the lower class household using more fuelwood than the upper class household
(Figure 5.9). On a per capita basis, 0.51 kilograms (st error 0.11, n=15) of fuelwood was
used per day. The average household uses 1658 kilograms (st error 231.6, n=15) of
fuelwood per year with the lower and middle classes using more kilograms of fuelwood
per year than the upper class (Figure 5.10). These analyses combined with qualitative
data show how and why women collect fuelwood and why they would prefer charcoal.
0.00
0.50
1.00
1.50
2.00
2.50
3.00
3.50
Lower Middle Upper
Mea
ls
Wealth Class

36
Figure 5.9: Kilograms of fuelwood used per meal per household by wealth class. Bars represent standard error.
Figure 5.10: Average kilograms of fuelwood used per year per household by wealth class. Bars represent standard error.
0.00
0.50
1.00
1.50
2.00
2.50
Lower Middle Upper
Kilo
gram
s
Wealth Class
0
500
1000
1500
2000
2500
Lower Middle Upper
Kilo
gram
s
Wealth Class
37
Chapter 6-Discussion
This chapter presents a discussion that focuses on the state of the forest and
fuelwood collection and consumption habits between wealth classes of villagers living in
Lupeta. Fuel source preferences are also examined. Qualitative and quantitative analysis
as well as other studies help explain collection and consumption habits of households.
Forest Inventory
Statistics from the forest inventory imply that the forest is declining and trees are
not regenerating. More first growth trees were found compared to coppicing trees within
the plots suggesting that trees are not regenerating as they have been in the past thus less
trees are present within the area. The higher numbers of coppicing trees are found at
plots along the mountainside and at farther distances from the village. The higher
numbers are found along the mountainside because they are more difficult to get to and
require climbing up steep slopes. This suggests that women have to expend more energy
climbing up the steep slopes and travel farther to cut fuelwood. One woman said “when I
was a little girl, I went with my mother not very far from the house to collect fuelwood.
There were lots of wood close together but now I have to go far.”
Common species in the overstory and understory are different indicating certain
preferences women have towards certain tree species when collecting fuelwood.
Brachystegia bussei was found in both the understory and overstory indicating its ability
to regenerate. Brachystegia bussei was liked by women because “it burns slow and does
not give off a lot of smoke’ while also saying ‘the bark is good for rope to bundle the
38
wood with”. Acacia tortilis was the most common overstory tree; its long thorns make it
a hard tree to cut down.
Collection
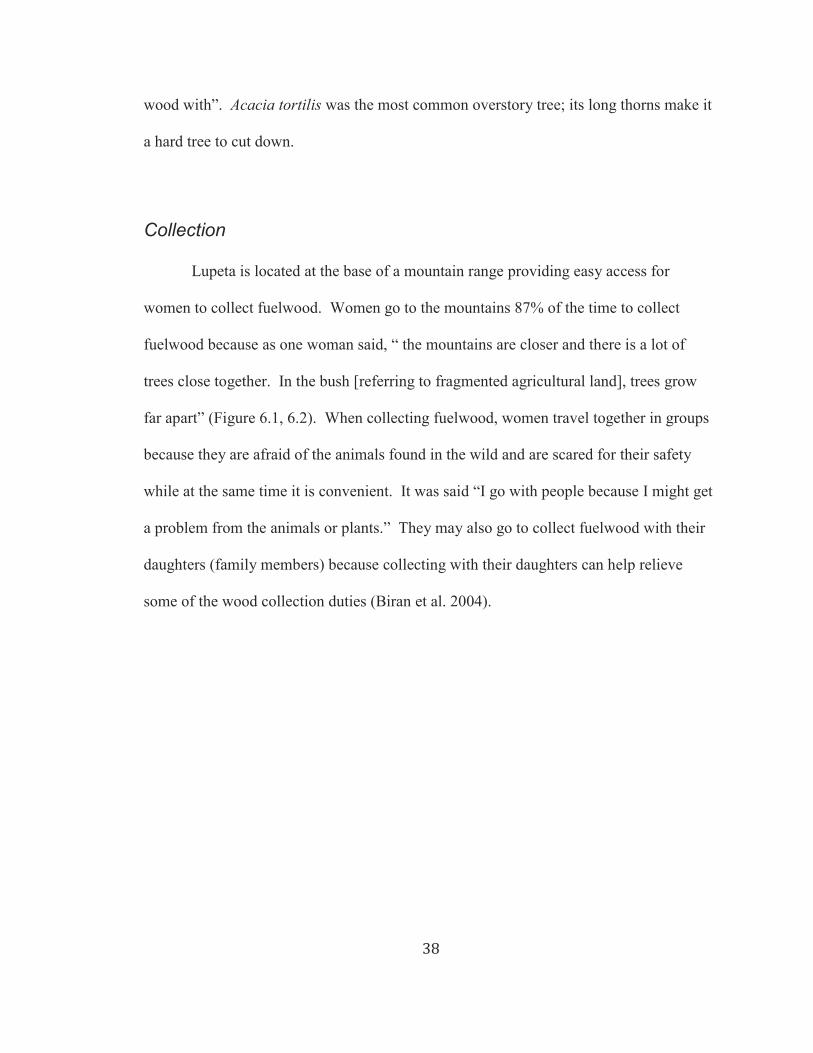
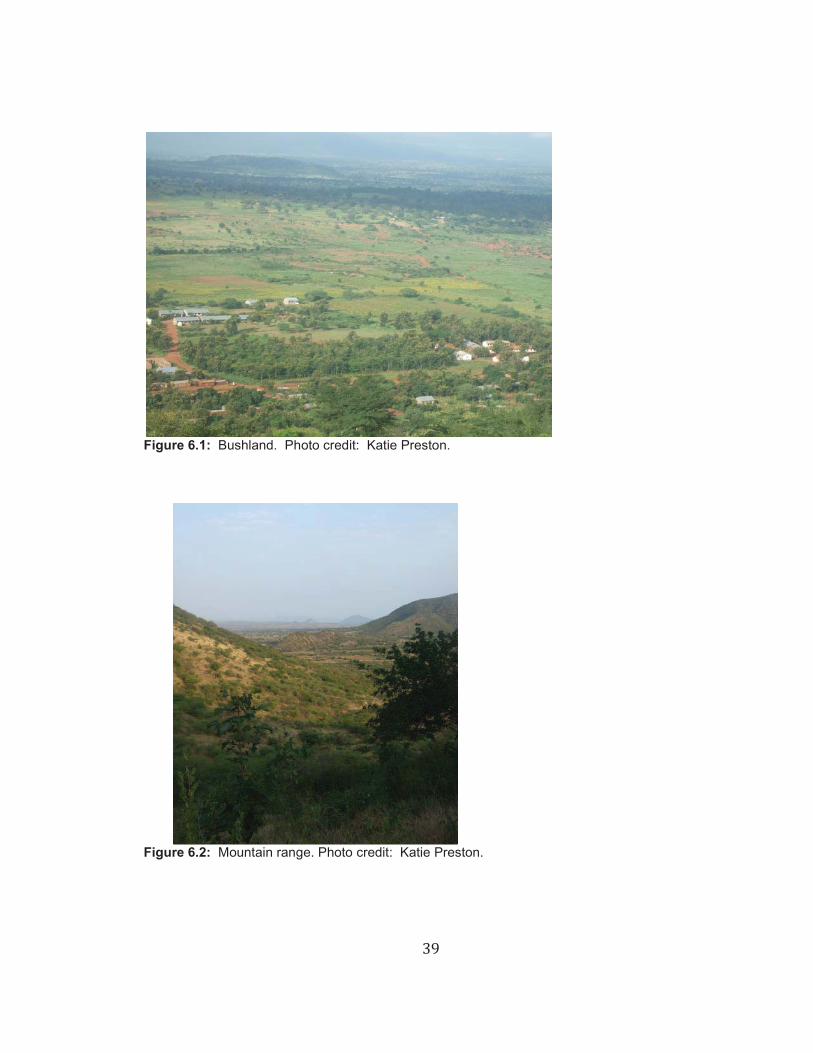
Lupeta is located at the base of a mountain range providing easy access for
women to collect fuelwood. Women go to the mountains 87% of the time to collect
fuelwood because as one woman said, “ the mountains are closer and there is a lot of
trees close together. In the bush [referring to fragmented agricultural land], trees grow
far apart” (Figure 6.1, 6.2). When collecting fuelwood, women travel together in groups
because they are afraid of the animals found in the wild and are scared for their safety
while at the same time it is convenient. It was said “I go with people because I might get
a problem from the animals or plants.” They may also go to collect fuelwood with their
daughters (family members) because collecting with their daughters can help relieve
some of the wood collection duties (Biran et al. 2004).
39
Figure 6.1: Bushland. Photo credit: Katie Preston.
Figure 6.2: Mountain range. Photo credit: Katie Preston.
40
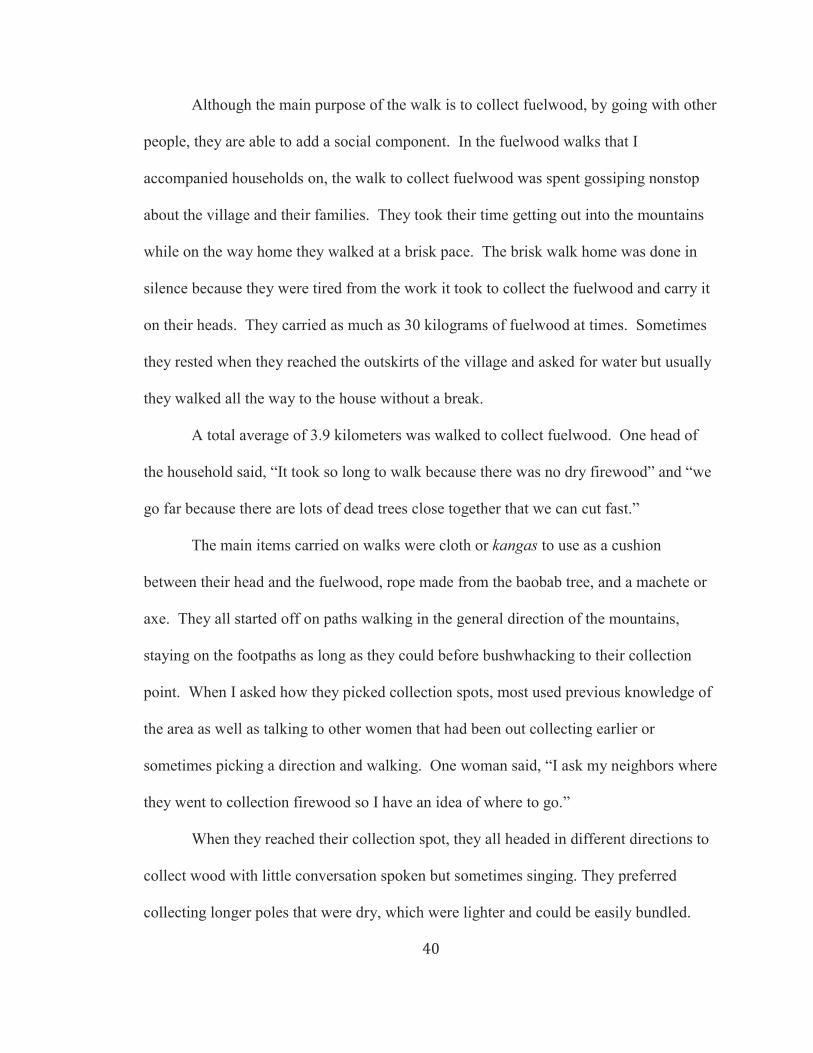
Although the main purpose of the walk is to collect fuelwood, by going with other
people, they are able to add a social component. In the fuelwood walks that I
accompanied households on, the walk to collect fuelwood was spent gossiping nonstop
about the village and their families. They took their time getting out into the mountains
while on the way home they walked at a brisk pace. The brisk walk home was done in
silence because they were tired from the work it took to collect the fuelwood and carry it
on their heads. They carried as much as 30 kilograms of fuelwood at times. Sometimes
they rested when they reached the outskirts of the village and asked for water but usually
they walked all the way to the house without a break.
A total average of 3.9 kilometers was walked to collect fuelwood. One head of
the household said, “It took so long to walk because there was no dry firewood” and “we
go far because there are lots of dead trees close together that we can cut fast.”
The main items carried on walks were cloth or kangas to use as a cushion
between their head and the fuelwood, rope made from the baobab tree, and a machete or
axe. They all started off on paths walking in the general direction of the mountains,
staying on the footpaths as long as they could before bushwhacking to their collection
point. When I asked how they picked collection spots, most used previous knowledge of
the area as well as talking to other women that had been out collecting earlier or
sometimes picking a direction and walking. One woman said, “I ask my neighbors where
they went to collection firewood so I have an idea of where to go.”
When they reached their collection spot, they all headed in different directions to
collect wood with little conversation spoken but sometimes singing. They preferred
collecting longer poles that were dry, which were lighter and could be easily bundled.
41
When they were done collecting, they bundled up the wood in long bundles and balanced
them on their heads and walked back to the house. Young girls (6-18) often carried less
because they were younger and not as strong. Research also shows that with the
diminishing fuelwood supply, sex and age rules of fuelwood collection have changed
(FAO 1983). As fuelwood becomes scarcer, women bring their children with them to
help collect more fuelwood, pulling the boys and girls out of school to help in the
fuelwood collect process.
The difference in collection habits and bundles collected between wealth classes
corresponds to an increase in wealth and ability to supplement fuelwood use with
charcoal. The lower class spent the least amount of time per trip collecting fuelwood
because of their efficiency at collecting. They use only fuelwood when cooking and as a
result make more trips per year to collect fuelwood compared to the middle and upper
class that collect more infrequently making fuelwood collection times per trip longer. In
Kenya research suggests that as income increases, the household’s use of other fuels is
likely to increase due to greater convenience or desired status (Openshaw 1978).
However in China, even among higher classes a level exists from which fuelwood
consumption could not be reduced, also suggesting that for traditional cooking habits,
fuelwood is consumed on some level (Démurger & Fournier 2011). One household used
charcoal exclusively, they were restaurant owners that cooked food from morning until
night, requiring constant heat.
42
Consumption
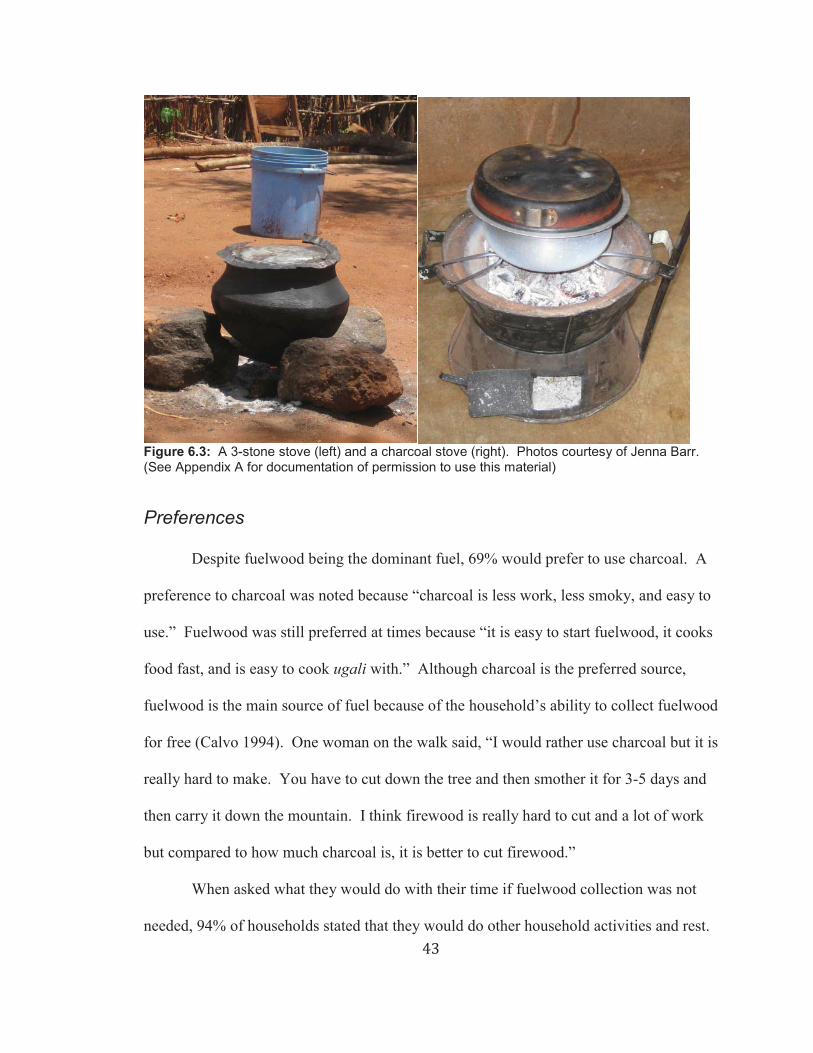
In the household, fuelwood is primarily used with a three-stone stove in a
structure separate from the household for cooking (Figure 6.3), although some villagers
in the community use improved stoves (fuel efficient). The fire is started from gathering
hot coals from neighbors to start the fire. A common meal made in the household
consists of ugali (stiff porridge made from sorghum/millet) and greens. Some reasoned
that fuelwood was used because “fuelwood cooks food fast” and “ I use fuelwood
because I have no money and it is free”.
Similar to the results in this paper, an inverse relationship between wealth class
and fuelwood consumption was found in Uganda (Démurger & Fournier 2011).
Although an average 2.5 meals are cooked per day, the upper class cooked more meals
per day and used the least amount of fuelwood while the lower class cooked the fewest
meals and consumed the most fuelwood. Consumption patterns in Mozambique also
found comparable fuelwood consumption rates per household, around 1700 kilograms
(Brouwer & Falcão 2004).
43
Figure 6.3: A 3-stone stove (left) and a charcoal stove (right). Photos courtesy of Jenna Barr.(See Appendix A for documentation of permission to use this material) Preferences
Despite fuelwood being the dominant fuel, 69% would prefer to use charcoal. A
preference to charcoal was noted because “charcoal is less work, less smoky, and easy to
use.” Fuelwood was still preferred at times because “it is easy to start fuelwood, it cooks
food fast, and is easy to cook ugali with.” Although charcoal is the preferred source,
fuelwood is the main source of fuel because of the household’s ability to collect fuelwood
for free (Calvo 1994). One woman on the walk said, “I would rather use charcoal but it is
really hard to make. You have to cut down the tree and then smother it for 3-5 days and
then carry it down the mountain. I think firewood is really hard to cut and a lot of work
but compared to how much charcoal is, it is better to cut firewood.”
When asked what they would do with their time if fuelwood collection was not
needed, 94% of households stated that they would do other household activities and rest.

44
In developing countries, rural women face a major problem in assigning time among the
many activities that are needed to get done within the household (Berio 1984, Boserup
1989). Thus, charcoal would allow more time for other household activities. Six percent
of households said that they would devote that time to other business endeavors such as
selling tomatoes or baked goods. One girl said, “ It is a lot of work because there is not a
lot of time to get everything done in a day. I am the only girl so I have to cook, clean,
watch the children, and fetch the water.” While another woman stated, “fuelwood is a lot
of work, but if we want to eat we have to collect fuelwood.”
When converting the average kilograms of fuelwood used per year by households
into charcoal, 829 kg of charcoal a year is needed (Rosillo-Calle et al. 1996). Rural
households buy charcoal in 20 liter buckets (8-10 kg) along the roadside or from
neighbors for $1.00 (1500 /=), $83-104 per year. Charcoal is too expensive given that
90% of the population of Tanzania lives on less than $2.00 a day (Government of
Tanzania 2005). It was stated “People buy bundles of firewood ($1.00) when they do not
have time but it cost people money that they do not have.” Forest inventory, fuelwood
collection, and consumption habits suggest that households need to look for other forms
of fuel as fuelwood becomes scarcer.
45
Chapter 7-Conclusion
This chapter presents the conclusion of fuelwood collection and consumption
habits in Lupeta. The “ladder of energy preferences” is examined, strategies to combat
fuelwood shortages are suggested, and the future research within the area are proposed.
Scholars suggest there is a “ladder of energy preferences” from low quality
biomass to transition fuels such as coal and charcoal in response to factors such as higher
incomes, deforestation and urbanization (Heltberg 2003). People eventually use more
efficient modern fuels such as kerosene, liquid petroleum gas (LPG), and electricity, with
the change being much slower in rural areas (Leach 1992). In rural communities
households rely primarily on traditional fuel sources of fuelwood and dung
(Masekoameng et al. 2005). For example in South Africa, rural populations rely on
fuelwood and cow dung because of poor social services, infrastructure, and low quality
and limited availability of fuel sources (Masekoameng et al. 2005). As fuelwood
becomes scarce, households use inconvenient burnable materials including crops
residues, further depleting the environment (Masekoameng et al. 2005). And at a certain
point households switch from collecting fuelwood to buying fuelwood and charcoal
(Démurger & Fournier 2011). The jump between transition and modern fuels is harder
due to income, availability, and ease of use (Heltberg 2003). South Africa shows that the
jump can be made from fuelwood to electricity within rural areas but that traditional fuels
are not replaced; the modern fuels are just added (Davis 1998).
Lupeta is a village that relies primarily on fuelwood collected by women in the
mountains. Fuelwood is used among all wealth classes for cooking. While fuelwood
46
collection is a labor intensive and a time consuming process, the ability of households to
self-collect without a fee is invaluable. The forest inventory data suggests the fuelwood
collection is only going to become increasingly more difficult. As fuelwood becomes
scarcer, villagers are going to seek other fuel sources or ways in which they can obtain
fuelwood. Looking at the “energy ladder”, Lupeta is slowing seeing a transition from
low quality biomass fuel (dung, straw, fuelwood) to the addition of charcoal.
There are strategies to aid villagers in the face of increasing fuelwood scarcity.
One strategy to aid the villagers in their fuelwood consumption habits would be investing
in improved stoves (fuel efficient), an alternative to the three-stone stove. The adoption
of such stoves can reduce the pressure on local forests and decrease the amount of
deforestation in developing countries (Amacher et al. 1992), while also influencing
environmental and economic concerns. A study in Guatemala yielded fuelwood savings
of 40% when an improved stove was used compared to a traditional stove (Boy 2000). In
Niger, fuelwood consumption also dropped from 0.7 kilograms per person per day to 0.4
kilograms (World Bank 1991). If improved stoves were used on a large enough scale, it
could reduce the pressure on biomass resources (Barnes et al. 1994). While fuelwood
savings is an advantage, improved stoves can also reduce time allotted to fuelwood
collection and free up time to earn cash or to produce other goods and services (Barnes et
al. 1994).
Another strategy would be the establishment of woodlots for the cultivation of
fuelwood, either on a household or community scale. In establishing woodlots closer to
the household, distance traveled and amount of time spent on fuelwood collection is
reduced (Calvo 1994). Woodlots can be an important source of woody biomass that also

47
aid in soil and water conservation efforts. Woodlots can also reduce deforestation and
land degradation in the community, while also empowering and generating income within
the community (Jagger 2005). The creation of woodlots depends on the scarcity of
fuelwood; only when walking distances become unreasonable for women to collect
fuelwood will woodlots be created (Axelsson & Hagborg 1994).
Further research into the extent of charcoal production and use within the village
is needed. While fuelwood is mainly collected for household use, charcoal is always
manufactured, transported, and sold for commercial use (Wood 1985). For example, in
Ethiopia, charcoal is preferred to simmer sauces on while wood is preferred for cooking
injera or pancakes (Wood 1985). It would be interesting to examine the level of
deforestation caused by fuelwood collection within the area. While deforestation is a
problem, conversion to agricultural land is the main cause of deforestation with fuelwood
collection having a small impact (Ramadhani 1989).
As Lupeta looks into the future, households are going to need to find other ways
to cope with the fuelwood shortage. Through improved stoves and woodlots households
can cut down on collection times and devote time to other household and entrepreneurial
activities. They are ready to take the next step in the energy ladder.
48
References
Amacher, G. S., Hyde, W. F., & Joshee, B. R., 1992. The adoption of consumption technologies under uncertainty: a case of improved stoves in Nepal. Journal of Economic Development, 17(2), 93-105.
Axelsson, A.L. & Hagborg, L., 1994. Karatu yarir a Karatu gantsar. Great Karatu is green Karatu. A follow-up study of a tree-planting project in Karatu, Tanzania, Working paper no. 268, International Rural Development Centre, Uppsala: Swe- dish University of Agricultural Sciences.
Barnes, D. F., Openshaw, K., Smith, K. R., & Van der Plas, R., 1994. What makes people cook with improved biomass stoves. World Bank technical paper, 242, 2004.
Biran, A., Abbot, J., & Mace, R., 2004. Families and firewood: a comparative analysis of the costs and benefits of children in firewood collection and use in two rural communities in sub-Saharan Africa. Human Ecology, 32(1), 1-25.
Bernard H., 2002. Research Methods in Anthropology: Qualitative and Quantitative Approaches. Ed. 2. Walnut Creek (CA): Altimira.
Berio, A., 1984. The analysis of time allocation and activity patterns in nutrition and rural development planning. Food and Nutrition Bulletin. 6(4):53-68.
Boserup, E., 1989. Women’s Roles in Economic Development. Earthscan Publications Limited, London.
Bork, S., Pypker, T., Corace III, R., Chimner, R., & Maclean, A., (in press). A case study of large-scale hydrologica restoration at Seney National Wildlife Refuge, Upper Michigan, USA. American Midland Naturalist.
Boy, E., 2000. Fuel efficiency of an improved wood-burning stove in rural Guatemala: implications for health, environment and development. Energy for Sustainable Development. 4(2): 23-31.
Brouwer, P., & Falcão, M., 2004. Wood fuel consumption in Maputo, Mozambique. Biomass and Bioenergy. 27:233-245.
Calvo, C. M., 1994. Case study on the role of women in rural transport: access of women to domestic facilities. World Bank.
CIA (Central Intelligence Agency), 2012. Washington (DC): Central Intelligence Agency. The World Factbook, Africa-Tanzania. https://www.cia.gov/library/publications/the-world-factbook/geos/tz.html AccessedSeptember 10, 2012.
49
Davis, M., 1998. Rural household energy consumption: the effects of access to electricity—evidence from South Africa. Energy Policy, 26(3), 207-217.
Démurger, S., Fournier, M., 2011. Poverty and firewood consumption: A case study of rural households in northern China. China Economic Review. 22(4): 512-523.
de Pauw, E., 1984. Soils, Physiography and Agroecological Zones of Tanzania. CMEW Project. MALD. Dar es Salaam.
EAMCEF (Eastern Arc Mountains Conservation Endowment Fund), 2007. Nguru. http://www. easternarc.or.tz/ Accessed September 18, 2012.
FAO. 1983. Wood Fuel Surveys. Rome (Italy). http://www.fao.org/docrep/Q1085E/Q1085E00.htm Accessed October 30, 2012.
FAO. 1995. A synthesis report of the Africa region: Women, agriculture, and rural development. Rome (Italy). http://www.fao.org/docrep/X0250E/x0250e03.htm. Accessed November 4, 2012.
FAO. 2009. Case studies on bioenergy policy and law: options for sustainability. Rome (Italy). http://www.fao.org/docrep/012/i1285e/i1285e.pdf. Accessed November 3, 2012.
FAO. 2012. FAO Water Reports 29: Irrigation in Africa in figures: AQUASTAT survey-2005. Rome (Italy). http://www.fao.org/nr/water/aquastat/countries_regions/tza/index.stm. Accessed September 12, 2012.
Government of Tanzania (GoT), 2005, Poverty and Human Development Report 2005, The Research and Analysis Working Group, Dar es Salaam, Tanzania.
Heltberg, R., Arndt, T. C., & Sekhar, N. U., 2000. Fuelwood consumption and forest degradation: a household model for domestic energy substitution in rural India. Land Economics, 213-232.
Heltberg, R., 2003. Household fuel and energy use in developing countries: A multi-country study. World Bank, Oil and Gas Policy Division, May, 14.
Horst, G. & Hovorka, A., 2008. Reassessing the “energy ladder”: Household energy use in Maun, Botswana. Energy Economics 36:3333-3344.
Jagger, P., Pender, J., & Gebremedhin, B., 2005. Trading Off Environmental Sustainability for Empowerment and Income: Woodlot Devolution in Northern Ethiopia. World Development. 33(9):1491-1510.
Leach, G., 1992. The energy transition. Energy Policy. Feb: 116-123
50
Masekoameng, K. E., Simalenga, T. E., & Saidi, T., 2005. Household energy needs and utilization patterns in the Giyani rural communities of Limpopo Province, South Africa. Journal of Energy in Southern Africa, 16(23).
Mboera LEG, Makundi EA, Kitua AY., 2007. Uncertainty in Malaria Control in Tanzania: Crossroads and Challenges for Future Interventions. American Society ofTropical Medicine and Hygiene. 77(6).
Muzale, Henry R. T. and Josephat M. Rugemalira., 2008. Researching and documenting the languages of Tanzania. Language Documentation & Conservation. 2(1):68–108.
Openshaw, K., 1978. Woodfuel ... A Time for Reassessment. Natural Resources Forum 3:35-51.
Ramadhani, H., 1989, Fuelwood problems and land use in semi arid areas: A casestudy of Dodoma rural district – Tanzania, M.Sc. thesis, Ås: Agricultural Univer-sity of Norway.
Rosillo-Calle, F., Rezende, M., Furtado, P., & Hall, D. 1996. The charcoal dilemma: finding sustainable solutions for Brazilian industry. Intermediate Technology Publications Ltd (ITP).
SADC, 1993. Energy Statistics Year Book for 1991. Energy Sector, TAU, Luanda, Angola.
Steel, Robert G D & Torrie, James H., 1960. Principles and procedures of statistics. New York: McGraw.
Shackleton, Charlie M., Shackleton, Sheona E., 2006. Household wealth status and natural resource use in the Kat River valley, South Africa, Ecological Economics. 57(2): 306-317.
Tanzania Embassy, 2011. Washington (DC): Embassy of Tanzania. About Tanzania;. http://tanzaniaembassy- us.org/tzegeo.html Accessed September 10, 2012.
TALIRI (Tanzania Livestock Research Institute), 2006. Livestock Research Institute-Mpwapwa (LITI). http://www.mifugo.go.tz/documents_storage/National_Livestock_Research_Institute_Tanzania.pdf Accessed November 1, 2012.
U.S. Department of State, 2011. Washington (DC): U.S. Department of State. Background Note: Tanzania; Available from: http://www.state.gov/r/pa/ei/bgn/2843.htm.Accessed September 10, 2012.

51
Wood, T, 1985. Report on domestic energy use for cooking. (Energy Assessment Mission, Ethiopia.) Washington, DC : World Bank. 33 pp.
World Bank, 1991. "La Consommation de Bois de Feu a Niamey." Energy Sector Management Assessment Program Report. Industry and Energy Department, Washington, D.C. Processed.
WHO (World Health Organization), 2012. Countries: United Republic of Tanzania. http://www.who.int/countries/tza/en/. Accessed September 15, 2012.

52
Appendix A: Copyright PermissionFigure 2.1:
Copyright Notice
Unless a copyright is indicated, information on the Central Intelligence Agency Web site is in the public domain and may be reproduced, published or otherwise used without the Central Intelligence Agency's permission. We request only that the Central Intelligence Agency be cited as the source of the information and that any photo credits or bylines be similarly credited to the photographer or author or Central Intelligence Agency, as appropriate.
If a copyright is indicated on a photo, graphic, or any other material, permission to copy these materials must be obtained from the original source.
This copyright notice does not pertain to information at Web sites other than the Central Intelligence Agency Web site.
Online: https://www.cia.gov/library/publications/the-world-factbook/geos/tz.html
Accessed: September 10, 2012.
Figure 3.2:
Eastern Arc Mountains Conservation Endowment Fund (EAMCEF). 2007. Nguru.
From: EAMCEF <[email protected]>Subject: RE: Eastern Arc Mountains MapDate: November 2, 2012 9:22 AM To: Katie Preston <[email protected]>
Permission is hereby granted for you to use our EAM sketch map for your thesis.
With best wishes,Francis.
Francis B.N. Sabuni,Executive Director,Eastern Arc Mountains Conservation Endowment Fund,Plot No. 348, Forest Hill Area,Kingalu Road,P.O. Box 6053,Morogoro, Tanzania.
Online: http://www. easternarc.or.tz/, (EAMCEF).

53
Accessed September 18, 2012.
Figure 2.3:
From: Randi Walsh (Randisuewalsh@ gmail.com)Sent: November 2, 2012 12:30 PMTo: Katie Preston ([email protected])
Katie Preston has permission to use any photograph of mine that she wants to.
Randi Walsh
Figure 6.3:
From: Jenna Barr ([email protected])Sent : November 4, 2012 9:30 AMTo: Katie Preston ([email protected])
Katie Preston has permission to use any photograph of mine that she wants to.
Jenna Barr

54
Appendix B: Interview QuestionsHousehold Interview
Name/ Jina:Age/ Miaka:Female or MaleOccupation/ Kazi:Family size/ Watu ngapi wa familia:Land size (acres)/ Una acre ngapi?:Education (Highest Level of interviewee)/ shule:Gathering Information:
1. Where do you go to cut firewood? Why do you go where you go?Unakata miti wapi?
o Mountainso Busho Mountains and bush a littleo Bush and mountains a little
2. Why do you go there? Why not other places? Kwa nini?3. What time of day do you collect firewood?
Muda gani unapenda kukata miti?o Morningo Night
4. Who goes to collect firewood? Ages? Genders?Unaenda pamoja nani kukata miti?
5. Why do you go together? What is your relationship? Do you go for safety and security? Unakwenda pa moja kwa nini?
6. How often do you collect firewood per week/ season? Unakata miti muda ngapi kwa wiki/ majira?Per week rainy season_____________________Per week dry season ______________________
7. What do you do when you go to cut firewood?Do you cut wood for other things? Do you look for certain things? Rocks, fruit, ect.Unapoenda mlima unafanya nini? Unachuma jiwe, matunda, ?
8. How much firewood do you collect at a time? How many bundles?Unakata mizigo ngapi kwa siku moja? Unababa fungu ngapi kwa siku moja?
Home Information:1. Why is firewood used compared with other fuel sources?/ What is firewood used
for? Kwa nini unatumia kuni?2. Do you use other fuel sources? When? Why?
o Charcoalo Keroseneo Gas
3. How many meals per day do you cook? Unapika milo ngapi kwa siku moja?
55
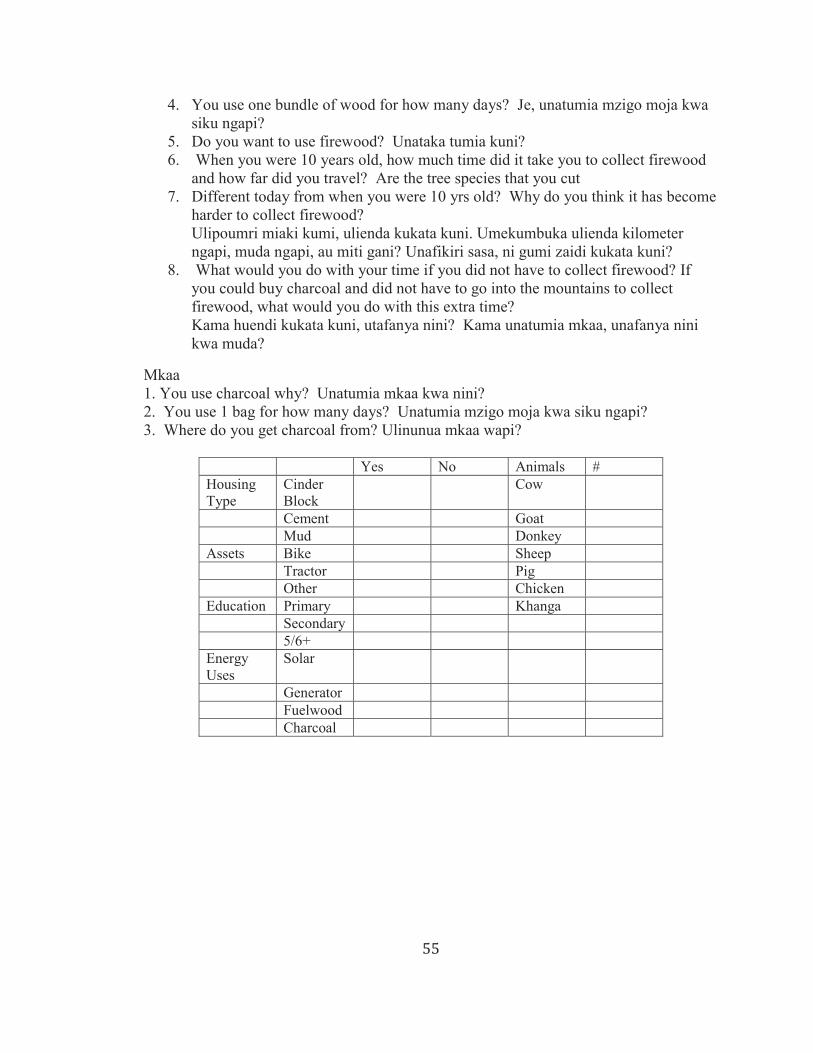
4. You use one bundle of wood for how many days? Je, unatumia mzigo moja kwa siku ngapi?
5. Do you want to use firewood? Unataka tumia kuni?6. When you were 10 years old, how much time did it take you to collect firewood
and how far did you travel? Are the tree species that you cut7. Different today from when you were 10 yrs old? Why do you think it has become
harder to collect firewood?Ulipoumri miaki kumi, ulienda kukata kuni. Umekumbuka ulienda kilometer ngapi, muda ngapi, au miti gani? Unafikiri sasa, ni gumi zaidi kukata kuni?
8. What would you do with your time if you did not have to collect firewood? If you could buy charcoal and did not have to go into the mountains to collect firewood, what would you do with this extra time?Kama huendi kukata kuni, utafanya nini? Kama unatumia mkaa, unafanya nini kwa muda?
Mkaa1. You use charcoal why? Unatumia mkaa kwa nini?2. You use 1 bag for how many days? Unatumia mzigo moja kwa siku ngapi?3. Where do you get charcoal from? Ulinunua mkaa wapi?
Yes No Animals #Housing Type
Cinder Block
Cow
Cement GoatMud Donkey
Assets Bike SheepTractor PigOther Chicken
Education Primary KhangaSecondary 5/6+
Energy Uses
Solar
GeneratorFuelwoodCharcoal

56
Trekking Information:Observations:Weight of firewood bundle:Distance Traveled:Time taken:Waypoint name:Number of people going together:Ages of people:Gender of People:Time of day go:What do they carry?What do they do when they go to cut firewood?
57
Appendix C: District Permission

58
Appendix D: Data
Table D.1: Fuelwood Walk Data Set #1
WalkWealth Class
Distance (miles)
Collecting (min)
Walking (min)
Total Time (min)
#People went
# Bundles collected
1 2 3.1 120 75 195 3 32 3 2.2 159 84 245 4 44 2 3.7 107 114 221 2 25 3 2.3 122 80 202 1 19 2 2.6 118 70 188 2 210 1 2.7 66 107 173 3 311 2 2.8 128 48 174 2 212 1 1.3 75 52 127 7 713 1 1.3 75 52 127 7 714 3 1.5 102 41 171 2 215 2 2.1 106 60 166 1 116 2 2.1 51 70 121 2 217 2 3.0 157 96 253 5 518 1 1.7 66 69 135 1 119 1 2.5 114 59 175 1 1
Table D.2: Fuelwood Walk Data Set # 2
Walk
Headwomen of
household=1 bundle (KG)
Family Size
Week: #
bundle collect-
dry
Week: # bundles collect-rainy
Fuel source used
Amount of meals cooked per day
1bundle= # days
1 32 4 5 2 F 2 52 24.5 7 2 Farming F 2 74 21.5 5 1 1 F 2 75 27 7 3 Farming FC 3 79 21 3 2 Farming FC 2 710 35 5 2 2 F 3 411 22.5 3 4 Farming FC 3 712 11.5 5 3 1 F 2 313 7.5 4 2 2 F 2 214 15 3 4 1 FC 3 515 31 3 4 Farming FC 3 716 16.5 6 2 Farming FC 3 717 34 7 6 Farming F 3 318 27.5 4 4 Farming F 2 719 26 1 7 Farming F 2 7
*F=fuelwood, FC=fuelwood & charcoal