Embed Size (px)
Citation preview

US 20050250212A1
(12) Patent Application Publication (10) Pub. No.: US 2005/0250212 A1 (19) United States
Azizian (43) Pub. Date: Nov. 10, 2005
(54) FT-NIR FATTY ACID DETERMINATION METHOD
(76) Inventor: Hormoz Azizian, (US)
Correspondence Address: MARKS & CLERK 1075 NORTH SERVICE ROAD WEST SUITE 203 OAKVILLE, ON L6M 2G2 (CA)
(21) Appl. No.: 10/840,277
(22) Filed:
Eh 12
May 7, 2004
Publication Classi?cation
(51) Im. c1? ................................................... ..G01N 33/92 (52) US. Cl. .............................................................. .. 436/71
(57) ABSTRACT
Amethod for the rapid analysis of the fatty acid components present in a fat and/or oil-containing material is provided Wherein the levels and types of fatty acids present in a sample are determined using Fourier Transform Near Infra red (FT-NIR) spectroscopy. The FT-NIR technique is devel oped by preparing a calibration matrix based on FT-NIR and Gas Chromatography (GC) analysis of knoWn standards, and subsequently using the calibration matrix to analyZe the FT-NIR spectral data obtained from a sample to be tested.
10

Patent Application Publication Nov. 10, 2005 Sheet 1 0f 7 US 2005/0250212 A1
16
Eh 12

Patent Application Publication Nov. 10, 2005 Sheet 2 0f 7 US 2005/0250212 A1
.n IEU LUDESCU>N>> OOOQ OOmQ OOOm OOmm OQOW 69mm OQOM
53:2;
QOQQ QOmQ OOQm Comm OOOO oOmw DOOM
£22.;
522.; new 222-2.; Lou mbuwnm cornromn< mHzJE N 952"
0'1 0'1 0"! szgun aou eqJosqv

Patent Application Publication Nov. 10, 2005 Sheet 3 0f 7 US 2005/0250212 A1
E 8
l
.s o m L l
E I- l- _ 8
"6 5 E I: 5 _ u
.3 i a E Q Q n. _ c E
3 m s: 0
.2 m H .
.2 4
‘g 00 o m U cu m n
m
s ,9 T I I I N a I I I w
Z000 0 Z000 0- 9000 0 suun Memqw

Patent Application Publication Nov. 10, 2005 Sheet 4 0f 7 US 2005/0250212 A1
H IEU LUDEDCU>N>> 83 85 8mm 8mm 83 8S _ _ _ _
Ecm_oc__t._. . ....... .. m
0 m
c_w_oc:_._.r 9
_ N mu m.. m w z m n m. 11
o 5 .0 0 0 Z
Eco-05:; ucm _Eo_o:=_...r tE22‘; mo :omtmnEou $235201 ucouom w 959“


Patent Application Publication Nov. 10, 2005 Sheet 6 0f 7 US 2005/0250212 Al
N “33> S. I. g 3.. we. we
_ . _ _ w-cl
| eso». 25F Qiv =0 >om .
I M-Ql - =
M a
o . 1
a3. 25:. ‘ QRN 25; w
- 2. i 2
$2 25¢ I
2
2.0 >om uBmcumEEf >=£fmm h2... m.m>_m:< uwutoaumm w 0.5m."


US 2005/0250212 A1
FT-NIR FATTY ACID DETERMINATION METHOD
FIELD OF THE INVENTION
[0001] The invention relates to a method for the measure ment of fatty acid content in a selected material by the use of radiation in the near infrared region of the light spectrum.
BACKGROUND OF THE INVENTION
[0002] Recently there has been increasing interest in the determination of the quantity and type of fatty acids present in the oils and fats Which are used in the food, and other industries. For example, recently government and health organiZations have called for, or imposed regulations on the amount and type of fatty acids contained in food products. Also, food suppliers are increasingly being mandated to provide information on the quantity and types of fatty acids contained Within their products. This is particularly true for materials termed as “trans fatty” acids, as discussed here inbeloW.
[0003] Fats and oils are made of a complex mixture of a chemically similar group of compounds knoWn as fatty acids. HoWever, the composition of the fats and oils present in a given material is largely dependent on the source of the material. For example, vegetable oils are composed of mainly palmitic, palmitoleic, stearic, oleic, linoleic and linolenic acids. On the other hand, commercially manufac tured “shortening” materials may contain over 30 different fatty acids including numerous trans fatty acids.
[0004] There are several different types of fat materials. Some fats occur naturally, While others are only attainable by diet. Brie?y, the types of fat are saturated fats, unsatur ated fats, phospholipids and triglycerides. Saturated fats are commonly found in animal fat products such as butter, lard and animal meats. Unsaturated fats, are divided into tWo groups, mono or poly unsaturated fats. An example of a monounsaturated fat is triolein, or its associated fatty acid, Oleic acid, Which is the main component of olive oil. Polyunsaturated fats are essential fatty acids and are only attainable through diet. Examples of polyunsaturated fats are linoleic acid, linolenic and arachidonic acids. These fatty acids may be found in soy bean oil, peanut oil and corn oil, ?sh, to name a feW.
[0005] Phospholipid fats, the most common of Which is lecithin, are an important common component of all cell membranes.
[0006] Triglycerides, are composed of three fatty acids attached to glycerol molecule and are, for example, the storage form of fat that occurs When humans eat calories in excess of their energy needs.
[0007] The so-called “trans fatty acids” are carboxylic acids With a long hydrocarbon chain in Which the isolated double bond occurs in the “trans” con?guration. It should be noted that almost all of the unsaturated sites in natural fats and oils from plant or animal origins generally occur in the “cis” double bond con?guration. A small amount of “trans” fat is found naturally in ruminant fat, but is most commonly introduced into food or other materials during partial hydro genation of, for example, vegetable oils. Levels of trans fat of up to 50% have been reported in products produced from partially hydrogenated vegetable oil.
Nov. 10, 2005
[0008] This is of concern since recent studies have ques tioned the long term health issues related to the consumption of trans fatty acids. For example, studies have noW sug gested a link betWeen trans fatty acid consumption and coronary heart disease. As such, there is increasing interest in determining the level of trans fatty acids in a material, and, more generally, in determining the quantity and type of all oils and/or fatty acids present in materials, and in particular, the levels and types of these materials Which is present in food.
[0009] Currently, the level and type of oils and/or fatty acid, and the determination of trans fatty acid, is performed using capillary gas chromatography (GC) analysis, or by use of infrared (1R) spectroscopic techniques, as described in a monograph from the American Oil Chemists’ Society (“Of?cial Method for the Determination of Trans Fat”, Mossoba et al., AOCS Press, 2003), the contents of Which is incorporated herein by reference. While these techniques provide the necessary information, they suffer from some inherent dif?culties.
[0010] First, the GC technique requires that representative samples be collected, processed and prepared for analysis (sometimes using toxic materials) over several hours, and then analyZed using a GC procedure that can take more than 45 to 60 minutes, or longer, to complete. As such, the GC technique can require several hours of a trained GC opera tor’s time in order to ?nally prepare, analyZe and report the results from the samples. In a production situation, the time and cost of this technique can be prohibitive.
[0011] This technique is also described by Satchithanan dam et al. in “Trans, Saturated, and Unsaturated Fat in Foods in the United States Prior to Mandatory Trans-Fat Labeling”, Lipids, Vol. 39, No. 1 (2004). [0012] Other chromatography techniques including silver ion Thin Liquid Chromatography (TLC-GC), and silver ion High Performance Liquid Chromatography (HPLC) are also knoWn, but these techniques suffer from the same problems as the above mentioned GC techniques.
[0013] With the IR technique, a sample of the material to be tested is exposed to an Infrared light source, and the transmission or re?ectance of the Infrared light is measured so that the amount of absorption can be determined. In traditional mid-infrared spectroscopy, the sample is progres sively exposed to IR Wavelengths so that an absorption spectrum is produced Which can be compared to knoWn standards for both absorption Wavelength, and for the per centage of absorption. As such, the type of fatty acid or oil can be determined, and the amount present can be calcu lated.
[0014] This mid-infrared spectroscopy technique has been used since the 1940’s for determining the trans content of fats and oils. HoWever, it is also time consuming to prepare the sample for testing, and is subject to errors introduced by absorption of other materials such as Water or the like. As such, using mid-infrared dispersive spectrometers that use prisms or diffraction gratings to resolve the infrared light into its component Wavelengths, does not typically have the required accuracy necessary for precise quantitative analy sis. Also, it is inconvenient and time consuming to prepare samples for analysis by this technique. [0015] The advent of Fourier transform infrared spectros copy (FTIR) has, hoWever, led to improvements in compen

US 2005/0250212 A1
sating for absorption by other materials, and greatly improves the sampling time, and accuracy. In an FTIR machine, a pulse of infrared radiation is emitted, and an interferometer alloWs the essentially simultaneous detection of all of the re?ected or transmitted component Wavelengths of the mid-infrared region (4000 to 600 cm_1). A Fourier transformation calculation is then performed on the inter ferometer output to determine a spectrum Which is essen tially identical to the spectrum obtained by variation of the frequency. [0016] Near Infrared (NIR) spectroscopy is a similar tech nique to infrared spectroscopy, Wherein radiation from only the near infrared region is used. HoWever, the interest in NIR for the analysis of various chemicals and other materials stems from a number of factors. For example, absorptions in the near infrared region arise from vibrational transitions to the second or higher energy states. Because of the very loW probability of such transitions, absorption intensities are typically several orders of magnitude beloW those of the corresponding fundamental vibrations in the infrared and/or ultraviolet (UV) regions. Consequently NIR has improved sensitivity in the analysis of species present at loW concen trations over conventional IR techniques.
[0017] Also, near infrared spectroscopy has the advantage that aqueous solutions can be readily analyZed Without signi?cant interference from Water absorption since Water does not signi?cantly absorb the NIR radiation. Further NIR alloWs for the use of quartZ or glass materials to be used in the construction of the NIR apparatus or in the sampling equipment, Which materials cannot be used in traditional IR devices.
[0018] Further, the intense absorption of near infrared radiation at only selected Wavelengths by a species, alloWs the NIR radiation to penetrate a sample suf?ciently in order to be useful in the analysis of thicker samples.
[0019] As With the FTIR technique, Fourier transforma tion of the NIR spectrum (FT-NIR) provides improved results, Wherein the FT-NIR instrument again makes use of an interferometer to encode data from the Whole spectral range simultaneously. The interferometer, and preferably a Michelson interferometer, is thus used to produce a signal of a loWer frequency than the frequency emitted from the NIR source. The loWer frequency contains the same information as the original radiation signal, but its output is supplied at a speed sloW enough for detection by a detector. The resultant output of the interferometer is an interferogram of all Wavelengths emitted by the source.
[0020] A computer then performs a Fourier Transform on the interferogram and generates a frequency domain trace speci?c to the tested material.
[0021] FT-NIR spectroscopy has certain advantages over the traditional IR or NIR spectroscopy, in Which the response of a sample to light is measured by scanning sequentially over a range of Wavelengths. Primarily, hoW ever, the FT-NIR technique is rapid, less energy limited than using FTIR machines, can use glass or quartZ cells, and can use sensitive detectors contained in more convenient forms. For example, FT-NIR devices are available Which use ?bre optics to transmit the NIR radiation to hand-held devices Which can be merely inserted into the material to be tested. Alternatively, loW cost glass sampling equipment can be used When analyZing the selected material.
Nov. 10, 2005
[0022] FT-NIR spectroscopy has been previously used to determine the amounts of cis, trans, the relative degree of unsaturation or iodine values (IV), and the Weight average molecular Weight of saponi?cation number (SN) parameters of edible fats and oils. This is described by Li et al. in “Rapid determination of cis and trans content, iodine value, and Saponi?cation Number of Edible Oils by Fourier Transform Near-Infrared Spectroscopy”, JAOCS, Vol. 76, No. 4 (1999). HoWever, this technique relies on establishing a series of knoWn materials by using an analysis based on an FTIR technique, and using this information to establish a calibra tion curve for use With the FT-NIR device. HoWever, this technique relies on the accuracy of the underlying FTIR technique.
[0023] A similar technique is described by Li et al. in “Trans Determination of Edible Oils by Fourier Transform Near-Infrared Spectroscopy”, JAOCS, Vol 77, No. 10 (2000), in Which FT-NIR is used to measure trans fat content based on a calibration curved generated by testing a series of knoWn samples using a single bounce, horiZontal attenuated total re?ectance, mid Infrared based technique.
[0024] While these techniques have some advantages over the prior art methods, they both rely on establishing a calibration curve (or matrix) based on a mid-FTIR tech nique, With its inherent analysis dif?culties and accuracy limitations. To overcome these dif?culties, it Would be advantageous to provide a method of quantitative measure ment of the amounts and types and/or categories of the fatty acid content in a material containing fats and oils, using a method With improved accuracy While maintaining a tech nique having good ?exibility of use.
SUMMARY OF THE INVENTION
[0025] Accordingly, it is a principal advantage of the present invention to provide a rapid method for the quanti tative analysis of the fatty acid content of a material con taining fats and/or oils.
[0026] It is a further advantage of the present invention to provide a method in Which the tested material is a food product.
[0027] It is a still further advantage of the present inven tion to provide a method Wherein the analytical technique is based on a more accurate instrument calibration matrix.
[0028] The advantages set out hereinabove, as Well as other objects and goals inherent thereto, are at least partially or fully provided by the method for fatty acid analysis in a material, of the present invention, as set out herein beloW.
[0029] As such, the present invention provides a method for the determination of the fatty acid type and/or content of a fat or oil component of a test sample material, Which method comprises preparation of a calibration matrix using a fatty acid reference analytical technique adapted to iden tify the type and quantity of fatty acids in a baseline reference material, and relating the results obtained to the spectral data obtained from an FT-NIR analysis of said baseline reference material;
[0030] analysing a test sample material using an FT-NIR technique to obtain FT-NIR spectral data for said test sample material; and
US 2005/0250212 A1
[0031] relating said FT-NIR spectra data of said test sample material to said calibration matrix in order to determine a value for the fatty acid content of any or all of the fatty acids present in said test sample material.
[0032] The fatty acid reference analytical technique is any analytical technique Which can directly, or indirectly provide speci?c information on the type and quantity of the fatty acid components of a fat or oil. Preferably, the fatty acid refer ence analytical technique is based on a GC (gas chroma tography) procedure, and can therefore including such tech niques as GC, GC Silver Ion, GC-HPLC (High Performance Liquid Chromatography), GC-TLC (Thin Layer Chroma tography), GC-MS (Mass Spectrometry) or the like, or any other suitable GC technique knoWn to those skilled in the art.
[0033] As such, the calibration matrix is preferably pre pared using a technique based on data obtained by GC and FT-NIR analysis of selected baseline materials.
[0034] Accordingly, the present invention also provides a method for the determination of the fatty acid type and/or content of a fat or oil component of a test sample material, Which method comprises:
[0035] identifying a series of baseline materials hav ing a similar composition to that of a test sample material, and containing at least one form of fatty acid having a re?ectance or transmission character istic corresponding to a narroW Wave band of light in the near-infrared region of the spectrum;
[0036] analysing said baseline materials using a GC technique to determine the fatty acid composition of each of said baseline materials;
[0037] analysing said baseline materials using an FT-NIR technique to produce FT-NIR spectra data for each of said baseline materials;
[0038] establishing a calibration matrix to relate the FT-NIR spectra data to the results determined from said GC technique for any or all of said fatty acids identi?ed by said GC technique;
[0039] analysing a test sample material using said FT-NIR technique to produce NIR spectral data for said test sample material, and relating the spectral data from said FT-NIR technique to said calibration matrix to determine a value for the fatty acid content of any or all of the fatty acids present in said test sample material.
[0040] The procedure of the present invention is particu larly adapted for the rapid determination of the fatty acid compositions of various materials containing fats and oils, and is particularly adapted for the rapid determination of trans fatty acid levels of various materials.
DETAILED DESCRIPTION OF THE INVENTION
[0041] The invention provides a method for determining the fatty acid content of a selected material using a Fourier Transform Near infrared (FT-NIR) spectrometer and using various calculations.
[0042] The FT-NIR spectroscopy has a much higher reso lution and accuracy level than Near Infrared (NIR) spec trometers. The FT-NIR spectrometer has a spectral resolu tion of 0.3 nm (2 cm'1 at 8000 cm_1) Whereas other grating
Nov. 10, 2005
or ?lter instruments are betWeen 2 nm (5 cm'1 at 5000 cm_1) to 10 nm (25 cm'1 at 5000 cm_1). Further, dispersive instruments operate in a frequency domain Whereas the Fourier Transformed NIR Infrared (FT-NIR) may be oper ated in the frequency domain or a time domain. The advan tage of operating in a time domain alloWs for faster results.
[0043] Near infrared Wavelengths of light are absorbed by species due to distinctive molecular vibrations and loW level electronic excitations. Many molecules, particularly mol ecules of biochemical interest, have characteristic “?nger print” absorption spectra in the near infrared.
[0044] While there is no exact de?nition of the frequency range related to the term “near infrared”, generally, the term is used to de?ne the range of frequencies betWeen 4000 and 14000 cm-1 (2.5 to 0.7 microns) Wavenumber, and the technique of the present invention is applicable over this general range. HoWever, preferably, the FT-NIR technique of the present invention is practiced Within the range of 4300 to 9000 cm-1 (2.2 to 1.1 microns), and even more preferably, the technique is practiced Within the range of 5400 to 9000 cm'1 (1.7 and 1.1 microns). [0045] In use, the sample material is placed adjacent to the output of the interferometer and the detector. The sample absorbs radiation of speci?c Wave lengths. The unabsorbed radiation is re?ected (or otherWise transmitted) back to the detector and recorded as an interferogram. The interfero gram is then transformed into a single channel spectrum by Fourier Transformation. The background spectrum is then used to calculate the transmission or absorption of the sample. After an interferogram has been collected, a com puter performs a Fast Fourier Transform (FFT), Which results in a frequency domain trace (i.e. intensity vs Wave number). The detector used in an FT-NIR instrument must respond quickly because intensity changes are rapid (the moving mirror moves quickly). To achieve a good signal to noise ratio, many interferograms are obtained and then averaged. This can be done in less time than it Would take a dispersive instrument to record one scan.
[0046] The advantages of the Fourier Transform Near Infrared Spectrometers over Dispersive Near Infrared Spec trometers include:
[0047] [0048] [0049] Higher energy throughput;
Improved frequency resolution; Improved frequency reproduceablity;
[0050] Faster operation computer based (alloWing storage of spectral facilities for processing spectra); and
[0051] Easily adapted for remote use.
[0052] As such, the FT-NIR technique is superior to any similar techniques using FTIR or dispersive IR techniques.
[0053] In the present application, the term “test sample material” refers primarily to a food product, and as such, the present application is primarily directed to the use of this technique for the determination of fatty acid content and composition in food products. HoWever, the skilled artisan Will be aWare that this technique might also be used in a Wide variety of applications Where measurement of fatty acid composition is desired. Accordingly, While the present appli cation is described With particular reference to the food industry, the skilled artisan Would be aWare that the present application is equally applicable in other non-food-related applications.

US 2005/0250212 A1
[0054] It is to be noted that the skilled artisan Will be Well aWare of the GC techniques used to determine the types and amounts of the fatty acids found in a given sample, as described in, for example the AOCS monograph described hereinabove. As such, the GC technique Will not be described in any detail, but it is suf?cient to state that a skilled artisan trained in the use of GC equipment Would readily be able to produce the necessary GC data using readily available techniques and methods.
[0055] This data, hoWever, once obtained by the GC technique, Would form the basis of the calibration matrix developed for the particular material, or group of related materials, to be tested.
[0056] The baseline materials are preferably materials Which are similar in composition (particularly With respect to the type of fatty acid) to the test sample material but having a range of fatty acid levels. As such, a range of fatty acid levels can be determined using the GC technique. The range of fatty acid levels might be prepared by adding or removing knoWn amounts of fatty acid materials to some of the baseline materials.
[0057] Alternatively, the baseline materials might be materials Which are prepared from blends of knoWn mate rials in order to simulate the test sample composition With respect to any or all of the fatty acid components.
[0058] Once the baseline materials have been selected and analyZed using the GC technique, they are then tested using the FT-NIR technique. Again, the skilled artisan Will be Well aWare of the use of suitable commercial FT-NIR devices, and the use of these devices Will not be described in detail. These FT-NIR devices are readily available.
[0059] Preferably, hoWever, the FT-NIR device has ?bre optic probe through Which the near infrared radiation can be transmitted, and a detector to Which the transmitted infrared radiation can be directed (as a transmitted, re?ected or trans?ected emission). The FT-NIR device is then capable of analyZing the transmitted or re?ected NIR radiation using a Fourier Transform technique in order to determine the spectral data for the sample material. This spectral data may be in the form of a chart shoWing the entire NIR spectra, but might also be data collected from speci?c, selected NIR frequencies. As such, the intensity of the collected radiation is compared in speci?c frequencies to the Wave band obtained from testing the baseline materials having a knoWn fatty acid composition. By comparison of the spectral data, the re?ectance and/or transmission characteristics of the baseline materials,—With knoWn fat composition, can be compared to the values obtained from the test sample material. As a result of this comparison, a calibration matrix can be prepared for a selected test material, or group of materials.
[0060] Comparison of the spectral data can be based on the actual re?ectance or transmittance data, but can also be based on mathematically modi?ed values of the spectral data. This can include, for example, determination of second derivative values, and comparison based on these second derivative values. Use of these types of mathematically modi?ed values can improve the ability to distinguish one material over another.
[0061] For example, a margarine producer can prepare a calibration matrix from a series of baseline margarine samples all of Which might have fatty acid compositions similar to the fatty acid composition of the margarine test sample. It Will be clear that the more baseline materials that
Nov. 10, 2005
are analyZed by the GC and FT-NIR techniques, the better the calibration matrix Will become.
[0062] Using the calibration matrix, the FT-NIR technique is used on a margarine test sample. This can be conducted rapidly during production by use of a probe inserted into the production stream, or in a sample of material collected from the production stream. It is possible that the test sample might require pre-treatment including, for example, heating to melt the test material, or the like. Commonly hoWever, the test sample is used as is.
[0063] Using the FT-NIR probe, the spectral data for the test material is rapidly obtained, and then compared to the calibration matrix applicable for that test material, in order to determine values for the types and amounts of fatty acids present in the test material. As a result, the user is able to determine the fatty acid composition of the test sample in less than a matter of minutes versus the time of several hours required for the GC or, the user is able to determine the fatty acid composition of the test sample With more speci?city than possible With prior art IR techniques. Once a reference library has been constructed, typically, the FT-NIR scanning and analysis of the test sample material is conducted in less than 5 minutes, and more preferably, is conducted in less than 2 minutes.
[0064] The test sample material is preferably a food mate rial containing or comprising a fat or oil having a fatty acid component. This can include materials such as oils such as vegetable oils, soy oils, ?ax oils, or the like, shortening, lards, mayonnaise, salad dressings, cookies, baked goods, crackers, potato chips, or a Wide range of other food prod ucts. HoWever, the test sample material can be any material having a fatty acid component, Which might include analysis of living tissue such as human tissue, ?sh, or other non human mammal tissue.
[0065] Preparation of the calibration matrix is knoWn to those skilled in the art, and may consist, at a simple level, as being a straight line comparison of the spectral data at a selected frequency to the spectral data obtained from the range of baseline materials. HoWever, typically, the calibra tion matrix Will be someWhat more complex mathematical model Which can be used in order to compare a series of spectral data (eg frequency and transmittance and/or re?ec tance data). Using these mathematical models, a calibration matrix is prepared Which is capable of determining the types and/or the amounts of a number of fatty acids Which may be present in a selected test material.
[0066] The mathematical models used to prepare the cali bration matrix can be based on statistical analysis of the spectral data Which have been compared to the GC data, in order to analyse complex chemical mixtures and solutions. Typically, the user Will start by constructing a data matrix from the GC data and FT-NIR spectra for a set of baseline materials. The calibration matrix is then prepared by math ematical analysis of the data matrix. Suitable mathematical approaches for preparation of the calibration matrix can include, for example, mathematical techniques such as mul tiple linear regression (MLR), principal component regres sion (PCR), and partial least squares regression (PLSR), although other methods can be adopted.
[0067] The calibration matrix can be limited to only a selected type of material (eg margarine) having a limited number of fatty acid types, and limited range of fatty acid levels. As such, a less complex calibration matrix is required. HoWever, as more types of materials are analysed

US 2005/0250212 A1
or otherwise encountered, With different fatty acid types and With Wider ranges of fatty acid levels, the calibration matrix Will, by necessity become more complex. The skilled arti san, hoWever, Will be able to determine the complexity of the calibration matrix required for a selected application. As such, the skilled artisan Would be able to select a calibration matrix “library” appropriate for the type of materials to be tested.
[0068] The various features of novelty Which characteriZe the invention are pointed out With more particularity in the claims annexed to and forming a part of this disclosure. For a better understanding of the invention, its operating advan tages and speci?c objects attained by its use, reference should be made to the accompanying draWings, examples, and descriptive matter in Which there are illustrated and described preferred embodiments of the invention.
BRIEF DESCRIPTION OF THE DRAWINGS
[0069] Embodiments of this invention Will noW be described by Way of example only in association With the accompanying draWings in Which:
[0070] FIG. 1 is a representative draWing of a ?bre optic probe of the type used in an FT-NIR device;
[0071] FIGS. 2 to 5 are FT-NIR spectral data taken from a variety of materials; and
[0072] FIGS. 6 and 7 shoW factoriZed analysis results of different materials.
DETAILED DESCRIPTION OF THE PREFERRED EMBODIMENTS
[0073] The novel features Which are believed to be char acteristic of the present invention, as to its structure, orga niZation, use and method of operation, together With further objectives and advantages thereof, Will be better understood from the folloWing draWings in Which a presently preferred embodiment of the invention Will noW be illustrated by Way of example only. In the draWings, like reference numerals depict like elements.
[0074] It is expressly understood, hoWever, that the draW ings are for the purpose of illustration and description only and are not intended as a de?nition of the limits of the invention.
[0075] Scanning of different types of test material using the FT-NIR device involves exposing the test sample to NIR radiation. Some of the NIR radiation is absorbed by the sample, and the remaining NIR radiation is re?ected, or transmitted through the sample. This re?ected or transmitted NIR radition is detected by a detector, and then analyZed.
[0076] In FIG. 1, a probe arrangement for the collection of re?ected NIR radiation in and FT-NIR device is represented. As illustrated in FIG. 1, the Infrared source (12) emits a laser light beam of Near Infrared Radiation (NIR), Which is delivered to the test sample (14) via a delivery ?bre optic bundle (16). The NIR penetrates the sample (14) and speci?c Wavelengths are absorbed or re?ected. The re?ected Wave lengths are transmitted to a detector (18) via a collection ?bre optic bundle (20). The re?ected NIR Wavelengths are recorded as an interferogram. The interferogram is then converted into a spectral reading, integrated, and the result ing data is collected and/or displayed as numerical values at selected Wavelengths, or as spectral charts shoWing a range of Wavelength absorption values.
Nov. 10, 2005
[0077] A similar device might also be used to collect transmission radiation by having the Infrared source direct its radiation output directly at the detector With a gap betWeen the source and the detector in Which the test sample material is located.
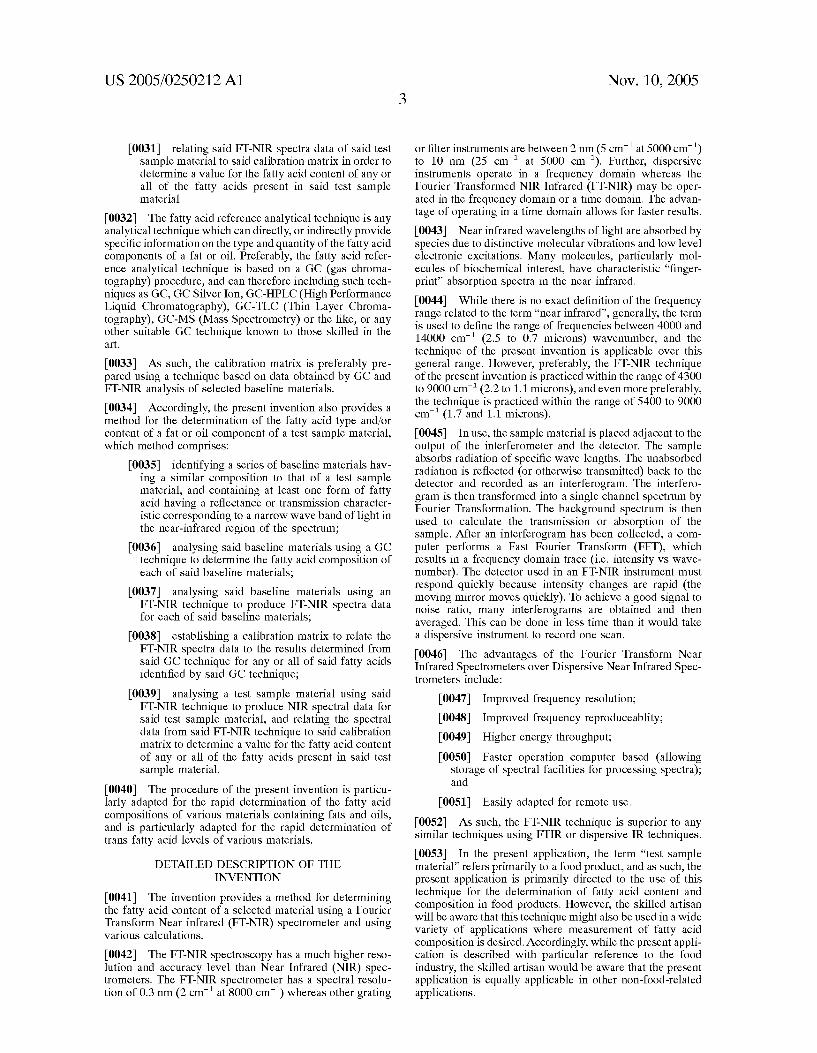
[0078] FIGS. 2 to 5 shoW absorption or second derivative spectrum for a variety of materials as set out hereinbeloW.
FIG. No. Material(s) and comments
2 Trielaidin and Triolein Absorption Spectrum 3 Second Derivative Spectrum comparison
of Triolein and Trielaiden 4 Second Derivative Spectrum comparison
of Triolein, Trilinolein and Trilinolenin 5 Second Derivative Spectrum comparison
of Partially Hydrogenated Soy Oils having different Trans Fat levels
[0079] In FIG. 2, the FT-NIR absorption spectrum for tWo similar fatty acids is shoWn. Triolein and Treilaidin have similar chemical compositions and molecular Weights, but differ in that Triolein contains a cis fatty acid and Treilaidin contains a trans fatty acid. The absorption spectra are similar but have minor differences.
[0080] In FIG. 3, a second derivative comparison of the absorption spectra from FIG. 2 is shoWn and the differences betWeen the spectra of the tWo materials is shoWn With greater clarity.
[0081] FIG. 4 shoWs a similar second derivative compari son of Triolein With tWo other fats, namely Trilinolein and Trilinolenin. Again although the materials are similar in nature but have different chemical structures, the spectral differences betWeen these materials is clearly evident.
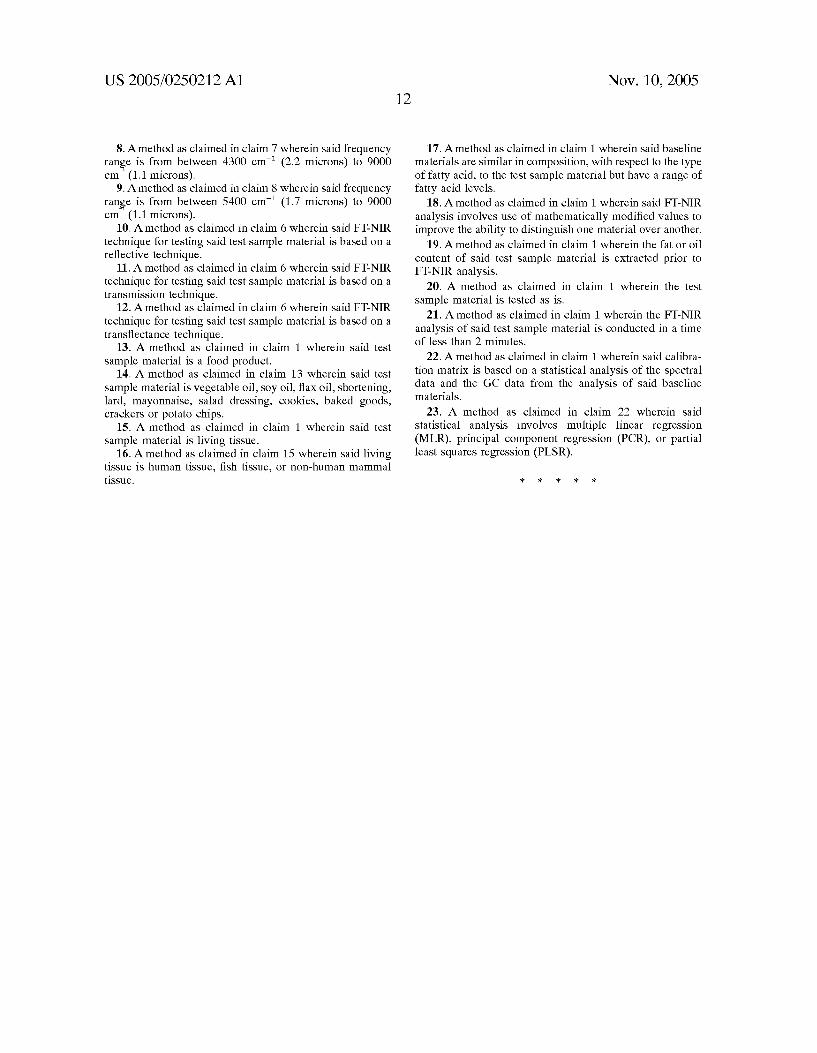
[0082] In FIG. 5, a number of partially hydrogenated soy oils are compared having a trans fatty acid levels from betWeen <1% (pure soy oil) to 100% (pure Trielaidin). Again, the spectral differences betWeen the materials is evident.
[0083] Using the data from the spectral analysis shoWn in FIG. 5, mathematical factoriZed analysis can be conducted, and the results of comparative vector analysis can be plotted. In FIG. 6, a plot of tWo different vectors for the materials plotted in FIG. 5 is shoWn. Again, the plot shoWs the differences betWeen the tested materials.
[0084] FIG. 7 shoWs a similar chart Wherein additional material have been included. These additional materials include 9-cis 18:1; 9,12-cis 18:2; 9,12,15 cis 18:3; and 9-trans 18:1, Which are representative of the pure fatty acids Which might be found in a number of fats and oils. It can be seen that the pure soy oil lies betWeen the three “cis” values, shoWing an approximation of the soy oil composition, and that increasing “trans” values shoW a progressive movement toWards the 9-trans 18:1 value.
[0085] Using the samples from FIG. 5, and additional samples having approximately 19 and 44% trans fatty acids, the samples Were again tested and analyZed by FT-NIR, using the calibration matrix developed for this mixture. These values Were compared to the results obtained by GC, and the results are presented in Tables 1A and 1B. It can clearly be seen that the results from the FT-NIR closely folloW the results from the GC technique.

US 2005/0250212 A1
[0086] Also, it should be noted that since the method of the present invention allows each fatty acid species to be separately identi?ed and quanti?ed, it is a simple matter to classify and total the amounts of fatty acids present in a sample, or alternatively, the desired total could be made as part of the mathematical model. As such, in Tables 1A and 1B, summary amounts are shoWn for Total Saturated Fat (T SAT), Total Cis Monounsaturated Fatty Acid (T C MUFA), Total Cis Polyunsaturated Fatty Acid (T C PUFA), Total trans Monounstaturated Fatty Acid (T MUFA trans), Total trans Double Unsaturated Fatty Acid (T DUFA trans), Total trans Triple Unstaturated Fatty Acid (T TUFA trans), and the Total Trans Fatty Acid (T Trans). Comparison of the values from the GC analysis and the FT-NIR analysis shoW a good correlation even When using the summation data. This is in spite of the fact that the FT-NIR spectra Was taken over a matter of minutes, While the GC analysis took several hours for each sample. [0087] In Table 2, the summation data for the <1%, 19%, 27%, 44% and 50% materials from Tables 1A and 1B are presented in a different format, for both the GC-HPLC and FT-NIR techniques. [0088] In Table 3, a comparison of the results obtained on several oil samples using a suitable calibration matrix for FT-NIR Was compared to the analysis obtained using GC HPLC (Gas chromatography—high performance liquid chromatography). The results Were obtained for the indi vidual fatty acid components of soy oil, olive oil and ?ax oil samples. [0089] It is to be noted that the amounts determined by the FT-NIR technique are in all cases similar to the amounts determined from the GC-HPLC technique. Further, it should be noted that again, the summation values at the bottom of Table 3 for Total Saturated Fat (T SAT), Total Cis Monoun saturated Fatty Acid (T C MUFA), Total Cis Polyunsaturated Fatty Acid (T C PUFA), Total trans Monounstaturated Fatty Acid (T MUFA trans), Total trans Double Unsaturated Fatty Acid (T DUFA trans), Total trans Triple Unstaturated Fatty Acid (T TUFA trans), and the Total Trans Fatty Acid (T Trans), are in agreement With the same values determined by the GC-HPLC technique even though the FT-NIR results Were obtained in signi?cantly less time.
[0090] Similarly, in Table 4, a comparison of the data obtained for representative samples of commercial Shorten ing and Lard materials is shoWn. The individual fatty acid components are listed, together With the total amounts described With respect to Table 3. Again, the FT-NIR tech nique provided individual fatty acid results, and total amounts similar to the GC-HPLC method for both shorten ing and lard. [0091] The higher level of total trans fatty acid in the shortening sample should be noted. [0092] In Table 5, the results of a further comparison betWeen the results obtained from the GC-HPLC technique and the FT-NIR technique are shoWn. In this case, the data relate to the fatty acid components of the extracted fat from hydrogenated and non-hydrogenated margarine. Again, the individual fatty acid components are listed, together With the total amounts described With respect to Table 3. The FT-NIR technique again provided individual fatty acid results, and total amounts similar to the GC-HPLC method for both the extracted fat from hydrogenated and non-hydrogenated mar garine. [0093] The high level of total trans fat found in the hydrogenated sample should also be noted, When compared to the non-hydrogenated sample.
Nov. 10, 2005
[0094] In Table 6, the results of a further analysis of margarine is provided Which is similar to the results described in FIG. 5. HoWever, in this case, the fat Was not extracted from the margarine samples, and as such, the margarine samples Were analyZed Without any processing. For these samples, a signi?cant Water value Was present (11 or 13%), and the Weight percentage values shoWn are based on the total Weight of the sample (including Water). HoW ever, it is to be noted that this Water level did not affect the accuracy of the results obtained by the FT-NIR procedure When compared to the GC technique.
[0095] In Table 7, a further comparison of tWo samples is shoWn. In this case, blends of shortening and lard are compared. The ?rst sample contains 80% shortening and 20% lard. The second sample contains 21% shortening and 79% lard. Again the values for individual fatty acids as obtained from GC-HPLC and FT-NIR are listed, and there is a good agreement betWeen the tWo techniques. Similarly, the summation values shoWn are also in good agreement.
[0096] In vieW of these results, it has clearly been dem onstrated that the use of FT-NIR, using a calibration matrix prepared from baseline sample testing using FT-NIR and a fatty acid reference analytical technique, Which technique is preferably a GC technique, alloWs for subsequent rapid analysis of fatty acid-containing fats and/or oils With a high degree of speci?city and accuracy. As a result, the use of FT-NIR for the analysis of a test sample provides a rapid, convenient method for the determination of the fatty acid content of a material. In particular, the FT-NIR technique described herein With respect to the present invention pro vides a rapid method for the determination of the trans fatty acid content of a particular sample material.
[0097] Thus, it is apparent that there has been provided, in accordance With the present invention, a method for the analysis of fatty acid content in materials containing fats and/or oils, Which fully satis?es the goals, objects, and advantages set forth hereinbefore. Therefore, having described speci?c embodiments of the present invention, it Will be understood that alternatives, modi?cations and varia tions thereof may be suggested to those skilled in the art, and that it is intended that the present speci?cation embrace all such alternatives, modi?cations and variations as fall Within the scope of the appended claims.
[0098] Additionally, for clarity and unless otherWise stated, the Word “comprise” and variations of the Word such as “comprising” and “comprises”, When used in the descrip tion and claims of the present speci?cation, is not intended to exclude other additives, components, integers or steps.
[0099] Moreover, the Words “substantially” or “essen tially”, When used With an adjective or adverb is intended to enhance the scope of the particular characteristic; e.g., substantially planar is intended to mean planar, nearly planar and/or exhibiting characteristics associated With a planar element.
[0100] Further, use of the terms “he”, “him”, or “his”, is not intended to be speci?cally directed to persons of the masculine gender, and could easily be read as “she”, “her”, or “hers”, respectively.
[0101] Also, While this discussion has addressed prior art knoWn to the inventor, it is not an admission that all art discussed is citable against the present application.

US 2005/0250212 A1 Nov. 10, 2005
TABLE 1A
Comparison of GC-HPLC and PT-NIR Results for Partiallv Hydrogenated Sov Oil
No. fatty acid <1% Trans <1% Trans 19% trans 19% trans 27% trans 27% trans
1 10:0 0.02 0.02 0.02 0.02 0.03 0.03 2 12:0 0.04 0.05 0.03 0.06 0.03 0.04 3 14:0 0.09 0.10 0.08 0.05 0.08 0.08 4 16:0 10.44 10.56 9.98 9.75 9.62 9.90 5 9c-16:1 0.08 0.08 0.09 0.05 0.08 0.07 6 17:0 0.11 0.11 0.11 0.11 0.11 0.11 7 17:1 0.00 0.00 0.00 0.00 0.00 0.00 8 18:0 4.49 4.48 5.37 5.10 4.95 4.98 9 5t- 0.00 0.00 0.03 0.03 0.10 0.10
10 6t-8t- 0.04 0.01 1.23 1.25 2.13 2.11 11 9t- 0.05 0.02 1.29 1.34 2.20 2.11 12 10t- 0.08 0.07 3.89 3.84 4.87 4.90 13 11t- 0.04 0.06 3.34 3.36 4.51 4.60 14 12t- 0.02 0.01 1.37 1.40 2.19 2.20 15 13t/14t- 0.04 0.04 1.89 1.88 2.85 2.86 16 9c- 19.86 19.61 24.33 25.09 22.45 21.62 17 15t 0.00 —0.01 0.65 0.67 1.12 1.12 18 11c- 1.40 1.40 1.95 2.05 2.24 2.17 19 12c- 0.04 0.10 5.86 5.52 4.56 4.72 20 13c- 0.05 0.05 0.30 0.30 0.45 0.45 21 14c/16t- 0.00 0.00 0.21 0.20 0.39 0.39 22 14c 0.00 0.00 0.17 0.16 0.21 0.21 23 19:0 0.01 0.01 0.53 0.49 0.48 0.48 24 9t12t-18:2 0.00 0.00 0.11 0.11 0.15 0.15 25 9c13t- 0.02 0.05 1.52 1.45 1.88 1.89 26 9c 12t 18:2 0.06 0.09 1.34 1.25 1.68 1.65 27 9t, 12c 18:2 0.01 0.03 1.20 1.11 1.50 1.47 28 11t, 15c 18:2 0.00 0.00 0.49 0.46 0.51 0.51 29 18:2n6 52.70 52.78 26.57 26.69 21.52 21.70 30 20:0 0.36 0.35 0.37 0.39 0.36 0.36 31 cct-18:3 0.04 0.05 0.19 0.21 0.19 0.17 32 9c-20:1, ctc 0.02 0.02 0.04 0.05 0.05 0.05 33 10c-20:1, cct 0.02 0.02 0.10 0.13 0.12 0.10 34 11c-20:1 0.17 0.16 0.18 0.22 0.16 0.12 35 18:3n3 8.85 8.83 2.03 1.84 1.43 1.27 36 9c11t-CLA 0.04 0.07 0.07 0.07 0.23 0.23 37 20:2n6 0.04 0.04 0.02 0.01 0.02 0.02 38 22:0 0.36 0.36 0.37 0.36 0.38 0.37 39 24:0 0.10 0.10 0.10 0.10 0.10 0.10 40 T Sat 16.04 16.17 16.96 16.52 16.13 16.56 41 T C MUFA 21.52 21.32 32.79 33.22 30.08 29.25 42 T C PUFA 61.59 61.65 28.62 29.06 22.97 23.45 43 T MUFA trans 0.27 0.16 13.89 14.14 20.37 20.56 44 T DUFA trans 0.13 0.24 4.73 4.43 5.95 5.87 45 T TUFA trans 0.08 0.09 0.34 0.39 0.36 0.31 46 T Trans 0.47 0.47 18.96 18.80 26.69 26.71
GC-HPLC = Gas Chromatography High Performance Liquid Chromatography PT-NIR = Fourier Transform Near Infrared Spectrosocpy
[0102] TABLE lB-continued
TABLE 1B Comparison of GC-HPLC and PT-NIR Results for
Comparison of GC-HPLC and PT-NIR Results for Partiallv Hvdrogenated Sov Oil Partiallv Hydrogenated Sov Oil
GC GC_ HPLC % PT-NIR % GC-HPLC % PT-NIR %
HPLC % FILNIR % GC_HPLC % FILNIR % No. fatty acid 44% trans 44% trans 50% trans 50% trans
No. fatty acid 44% trans 44% trans 50% trans 50% trans 9 5t- 0.14 0.14 0.27 0.26
1 10:0 0.02 0.02 0.02 0.02 10 6t-8t- 4.08 4.13 6.47 6.31 2 12:0 0.04 —0.01 0.02 —0.07 11 9t- 4.99 5.07 6.66 6.67 3 14:0 0.08 0.05 0.08 0.08 12 10t- 9.39 9.36 10.01 9.98
4 16:0 9.94 9.78 10.00 10.41 13 11t- 8.35 8.30 8.29 8.25 5 9c—16:1 0.06 0.05 0.04 0.12 14 12t- 4.59 4.56 5.66 5.55 6 17:0 0.11 0.11 0.12 0.13 15 13t/14t- 5.13 5.12 6.90 6.75 7 17:1 0.00 0.00 0.00 0.01 16 9c- 20.61 20.56 13.91 13.41 8 18:0 6.89 6.93 12.31 12.52 17 15t 2.27 2.27 3.03 2.95

US 2005/0250212 A1 Nov. 10, 2005
TABLE lB-continued TABLE lB-continued
Comparison of GC-HPLC and FT-NIR Results for partianv Hvdrogenated 50V Oil Comparison of GC-HPLC and FT-NIR Results for
Partially Hydrogenated Soy Oil GC
HPLC % FT-NIR % GC-HPLC % FT-NIR % No. fatty acid 44% trans 44% trans 50% trans 50% trans GC
18 11C_ 284 2.83 2.81 2.79 HPLC % FT-NIR % GC-HPLC % FT-NIR %
19 120 657 644 485 498 No. fatty acid 44% trans 44% trans 50% trans 50% trans
20 13c— 0.76 0.76 1.03 1.01
21 14c/16t- 0.53 0.54 0.75 0.75 39 240 0 1O 0 11 O 10 O 10 22 14c 0.42 0.42 0.55 0.54 ' ' ' ' '
24 9t12t'18I2 O-ZO O-ZO O-14 O-15 41 T C MUFA 31.33 31.23 23.22 22.84 25 9c13t- 1.96 1.95 1.11 1.20 26 9c 12t18:2 0.73 0.73 0.41 0.48 42 T C PUFA 3'57 4'02 0'35 0'47
27 9t, 12c 18:2 0.60 0.60 0.18 0.25 43 T MUFA trans 39.46 39.56 48.04 47.51 28 11t, 15c 18:2 0.54 0.53 0.36 0.38 29 18:2n6 3.41 4.07 0.35 0.73 44 T DUFA trans 4.08 4.03 2.20 2.47
30 201) 037 039 038 036 45 T TUFA trans 0.06 —0.03 0.02 —0.05
31 @4813 O-OZ 4103 O-OO —003 46 T Trans 43.60 43.49 50.25 49.85 32 9c—20:1, ctc 0.02 0.02 0.02 0.01 33 10c—20:1, cct 0.02 —0.02 0.00 —0.03
34 110-2051 012 O-13 O08 O08 GC-HPLC = Gas Chromatography High Performance Liquid Chromatog 35 18:3n3 0.16 —0.11 0.00 0.18 raphy
36 gcllt'cLA 0'06 0'06 0'01 0'01 FT-NIR = Fourier Transform Near Infrared Spectrosocpy 37 20:2n6 0.00 0.00 0.00 0.02 38 22:0 0.36 0.36 0.36 0.36
[0103] \
TABLE 2
Summary of Total Fatty Acids for Partially Hydrogenated Soy Oils
Summary Totals
T Sat T C MUFA T C PUFA T MUFA trans T DUFA trans T TUFA trans T Trans
GC-HPLC % Soy Oil <1 trans 16.04 21.52 61.59 0.27 0.13 0.08 0.47 FT-NIR % Soy Oil <1 trans 16.17 21.32 61.65 0.16 0.24 0.09 0.47 GC-HPLC % Soy Oil 19% trans 16.96 32.79 28.62 13.89 4.73 0.34 18.96 FT-NIR % Soy Oil 19% trans 16.52 33.22 29.06 14.14 4.43 0.39 18.80 GC-HPLC % Soy Oil 27% trans 16.13 30.08 22.97 20.37 5.95 0.36 26.69 FT-NIR % Soy Oil 27% trans 16.56 29.25 23.45 20.56 5.87 0.31 26.71 GC-HPLC % Soy Oil 44% trans 18.60 31.33 3.57 39.46 4.08 0.06 43.60 FT-NIR % Soy Oil 44% trans 18.55 31.23 4.02 39.56 4.03 —0.03 43.49 GC-HPLC % Soy Oil 50% trans 24.09 23.22 0.35 48.04 2.20 0.02 50.25 FT-NIR % Soy Oil 50% trans 24.58 22.84 0.47 47.51 2.47 —0.05 49.85
GC-HPLC = Gas Chromatography High Performance Liquid Chromatography FT-NIR = Fourier Transform Near Infrared Spectrosocpy
[0104]
TABLE 3
Comparison of GC-HPLC and FT-NIR Results for Different Oils
No. fatty acid Soy Oil Soy Oil Olive Oil Olive Oil FlaX Oil FlaX Oil
1 10:0 0.02 0.02 0.02 0.02 0.02 0.02 2 12:0 0.04 0.05 0.04 0.06 0.04 0.04 3 14:0 0.09 0.10 0.41 0.42 0.43 0.42 4 16:0 10.44 10.56 11.49 11.50 4.93 4.78 5 9c-16:1 0.08 0.08 0.75 0.75 0.05 0.05 6 17:0 0.11 0.11 0.06 0.06 0.06 0.06 7 17:1 0.00 0.00 0.09 0.09 0.04 0.04 8 18:0 4.49 4.48 2.76 2.77 4.31 4.26 9 5t- 0.00 0.00 0.00 0.00 0.00 0.00
10 6t-8t- 0.04 0.01 0.05 0.03 0.01 0.02 0.05 0.02 0.15 0.16 0.01 0.07

US 2005/0250212 A1 Nov. 10, 2005
TABLE 3-c0ntinued
Comparison of GC-HPLC and FT-NIR Results for Different Oils
No. fatty acid Soy Oil Soy Oil Olive Oil Olive Oil FlaX Oil FlaX Oil
12 10t- 0.08 0.07 0.06 0.03 0.02 0.03 13 11t- 0.04 0.06 0.01 —0.02 0.01 0.01 14 12t- 0.02 0.01 0.01 —0.01 0.01 0.02 15 13t/14t- 0.04 0.04 0.01 —0.02 0.00 0.01 16 9c- 19.86 19.61 68.34 68.55 20.20 20.04 17 15t 0.00 —0.01 0.00 —0.01 0.00 0.01 18 11c- 1.40 1.40 2.05 2.07 0.66 0.64 19 12c- 0.04 0.10 0.00 —0.02 0.01 —0.01 20 13c- 0.05 0.05 0.00 0.00 0.01 0.01 21 14c/16t- 0.00 0.00 0.00 0.00 0.00 0.00 22 14c 0.00 0.00 0.00 0.00 0.00 0.00 23 19:0 0.01 0.01 0.00 0.00 0.00 0.00 24 9t12t-18:2 0.00 0.00 0.00 0.00 0.00 0.00 25 9c13t- 0.02 0.05 0.00 0.00 0.00 0.00 26 9c 12t 18:2 0.06 0.09 0.06 0.06 0.06 0.06 27 9t, 12c 18:2 0.01 0.03 0.04 0.04 0.01 0.01 28 11t, 15c 18:2 0.00 0.00 0.00 0.00 0.00 0.00 29 18:2n6 52.70 52.78 10.68 10.55 15.40 15.68 30 20:0 0.36 0.35 0.52 0.52 0.17 0.16 31 cct-18:3 0.04 0.05 0.03 0.04 0.23 0.21 32 9c-20:1, ctc 0.02 0.02 0.02 0.02 0.02 0.02 33 10c-20:1, cct 0.02 0.02 0.03 0.04 0.04 0.03 34 11c-20:1 0.17 0.16 0.36 0.37 0.18 0.18 35 18:3n3 8.85 8.83 0.64 0.68 51.83 51.88 36 9c11t-CLA 0.04 0.07 0.06 0.06 0.02 0.02 37 20:2n6 0.04 0.04 0.00 0.00 0.04 0.04 38 22:0 0.36 0.36 0.24 0.24 0.14 0.14 39 24:0 0.10 0.10 0.10 0.10 0.09 0.09 40 T Sat 16.04 16.17 15.64 15.67 10.20 9.96 41 T C MUFA 21.52 21.32 70.84 70.99 21.11 20.92 42 T C PUFA 61.59 61.65 11.32 11.31 67.27 67.60 43 T MUFA trans 0.27 0.16 0.30 0.14 0.05 0.14 44 T DUFA trans 0.13 0.24 0.16 0.16 0.09 0.09 45 T TUFA trans 0.08 0.09 0.07 0.09 0.29 0.26 46 T Trans 0.47 0.47 0.52 0.39 0.44 0.51
GC-HPLC = Gas Chromatography High Performance Liquid Chromatography FT-NIR = Fourier Transform Near Infrared Spectrosocpy
[0105] TABLE 4-c0ntinued TABLE 4
Comparison of GC-HPLC and FT-NIR Results for
Comparison of GC-HPLC and FT-NIR Results for Shortening and Lard Shortening and Lard
GC GC_ HPLC % FT-NIR % GC-HPLC % FT-NIR %
HPLC % FILNIR % GC_HPLC % FILNIR % No. fatty acid Shortening Shortening Lard Lard No fatty acid Shortening Shortening Lard Lard
21 14c/16t- 0.14 0.14 0.03 0.03 1 100 0.07 0.07 0.05 0.05 22 14° 0-14 0-14 0-03 0-03 2 12:0 O03 O04 O06 002 23 1920 0.00 0.01 0.03 0.02 3 14:0 O21 021 130 129 24 9t12t-18I2 0.11 0.11 0.01 0.01 4 16:0 16.01 16.17 24.21 24.22 25 901% 0-92 0-96 0-10 0-07 5 90161 O10 010 L88 189 26 9C 12t 1812 1.33 1.36 0.21 0.18 6 17:0 011 011 O38 038 27 9t, 12C 1822 1.05 1.08 0.15 0.12 7 17:1 O06 O06 O27 027 28 11t, 150 1822 0.22 0.23 0.00 —0.01 8 18:0 1104 1103 14_64 14_75 29 18:2n6 19.68 19.76 12.41 12.54 9 5g O06 O06 O03 003 30 20:0 0.40 0.39 0.25 0.25
10 6t_gt_ 160 15g 036 037 31 cct-18:3 0.23 0.24 0.09 0.08 11 9t- 2.11 2.05 0.66 0.66 32 90-2021, Ctc 0.16 0.16 0.00 0.00 12 10t- 4.08 4.11 0.55 0.54 33 10c—20:1, cct 0.20 0.20 0.05 0.04 13 11t- 3.79 3.83 0.35 0.35 34 11c—20:1 0.20 0.19 0.62 0.62 14 12t- 1.43 1.43 0.17 0.18 35 18:3n3 0.97 0.95 0.55 0.56 15 13t/14t- 1.86 1.87 0.24 0.25 36 9c11t-CLA 0.17 0.18 0.06 0.05 16 9c- 24.46 24.05 36.36 36.37 37 20:2n6 0.00 0.00 0.46 0.46 17 15t 0.65 0.65 0.00 0.00 38 22:0 0.31 0.31 0.03 0.03 18 11c- 1.69 1.68 2.44 2.44 39 24:0 0.10 0.10 0.02 0.02
19 12c- 4 11 4.22 0.17 0.10 40 T Sat 28.27 28.42 40.97 41.03 20 13c- 0.23 0.23 0.13 0.13 41 TCMUFA 30.90 30.55 40.01 39.94

US 2005/0250212 A1
TABLE 4-c0ntinued
Comparison of GC-HPLC and PT-NIR Results for Shortening and Lard
GC
HPLC % PT-NIR % GC-HPLC % PT-NIR %
No. fatty acid Shortening Shortening Lard Lard
42 T C PUFA 20.65 20.70 13.41 13.56
43 T MUFA trans 15.71 15.69 2.39 2.42
44 T DUFA trans 3.79 3.91 0.53 0.42
45 T TUFA trans 0.58 0.59 0.14 0.12
46 T Trans 20.09 20.20 3.06 2.96
GC-HPLC = Gas Chromatography High Performance Liquid Chromatog raphy PT-NIR = Fourier Transform Near Infrared Spectrosocpy
[0106]
TABLE 5
Comparison of GC-HPLC and PT-NIR Results for Extracted Fat from Margarine
GC- GC-HPLC % PT-NIR % HPLC % PT-NIR % Non- Non Hydrogen- Hydrogen- Hydrogen- Hydrogen
No fatty acid ated ated ated ated
1 10:0 0.01 0.01 0.05 0.05 2 12:0 0.02 0.02 1.91 1.92 3 14:0 0.06 0.07 1.06 1.06 4 16:0 4.57 4.70 11.27 11.26 5 9c-16:1 0.15 0.15 0.19 0.19 6 17:0 0.07 0.07 0.07 0.07 7 17:1 0.05 0.05 0.07 0.07 8 18:0 7.18 7.13 2.87 2.87 9 5t- 0.08 0.08 0.00 0.00
10 6t-8t- 3.88 3.82 0.07 0.07 11 9t- 7.87 7.74 0.14 0.13 12 10t- 5.36 5.37 0.13 0.13 13 11t- 3.04 3.10 0.05 0.02 14 12t- 1.98 1.99 0.04 0.03 15 13t/14t- 2.47 2.48 0.05 0.05 16 9c- 42.42 42.54 51.70 51.73 17 15t 1.38 1.37 0.00 0.00 18 11c- 2.89 2.90 2.82 2.81 19 12c- 2.19 2.35 0.03 0.07 20 13c- 0.28 0.28 0.03 0.03 21 14c/16t- 0.40 0.40 0.01 0.01 22 14c 0.20 0.20 0.00 0.00 23 19:0 0.43 0.44 0.01 0.01 24 9t12t-18:2 0.41 0.40 0.02 0.02 25 9c13t- 1.08 1.09 0.03 0.03 26 9c 12t 18:2 1.04 1.02 0.16 0.16 27 9t, 12c 18:2 0.95 0.95 0.14 0.15 28 11t, 15c 18:2 0.48 0.47 0.00 0.00 29 18:2n6 3.43 3.24 16.59 16.65 30 20:0 0.73 0.73 0.59 0.59 31 cct-18:3 0.15 0.16 0.67 0.66 32 9c-20:1, ctc 0.09 0.09 0.11 0.11 33 10c-20:1, cct 0.12 0.12 0.59 0.59 34 11c-20:1 0.83 0.83 1.12 1.12 35 18:3n3 0.56 0.59 6.24 6.17 36 9c11t-CLA 0.19 0.18 0.06 0.04 37 20:2n6 0.02 0.02 0.06 0.06 38 22:0 0.29 0.29 0.28 0.28 39 24:0 0.11 0.11 0.10 0.10 40 T Sat 13.49 13.51 18.23 18.25 41 T C MUFA 48.87 49.07 55.77 55.82 42 T C PUFA 4.00 3.93 22.88 22.87 43 T MUFA trans 26.45 26.34 0.49 0.46 44 T DUFA trans 4.15 4.12 0.41 0.42
10 Nov. 10, 2005
TABLE 5-c0ntinued
Comparison of GC-HPLC and PT-NIR Results for Extracted Fat from Margarine
GC- GC-HPLC % PT-NIR % HPLC % PT-NIR % Non- Non Hydrogen- Hydrogen- Hydrogen- Hydrogen
No. fatty acid ated ated ated ated
45 T TUFA trans 0.36 0.36 1.37 1.36
46 T Trans 30.95 30.82 2.26 2.21
GC-HPLC = Gas Chromatography High Performance Liquid Chromatog raphy PT-NIR = Fourier Transform Near Infrared Spectrosocpy
[0107] TABLE 6
Comparison of GC-HPLC and FT-NIR (Direct Measurement) Results for Hydrogenated and Non-Hydrogenated Margarine
GC-HPLC PT-NIR GC-HPLC PT-NIR Hydrog. Hydrog. Non-Hydrog. Non-Hydrog.
No. fatty acid Margarine Margarine Margarine Margarine
1 10:0 0.01 0.01 0.04 0.04 2 12:0 0.02 —0.05 1.66 1.60 3 14:0 0.05 0.02 0.93 0.90 4 16:0 4.07 3.92 9.80 9.70 5 9c, 16:1 0.13 0.13 0.16 0.16 6 17:0 0.07 0.07 0.07 0.07 7 9c-17:1 0.01 0.01 0.06 0.06 8 11c-17:1 0.05 0.05 0.06 0.06 9 18:0 6.39 6.35 2.50 2.55
10 5t 0.07 0.07 0.00 0.00 11 6-8t 3.45 3.48 0.06 0.11 12 9t 7.00 7.04 0.13 0.19 13 10t 4.77 4.84 0.11 0.15 14 11t 2.70 2.75 0.04 0.07 15 12t 1.76 1.82 0.03 0.03 16 13t, 14t 2.20 2.23 0.04 0.09 17 9c-18:1 37.76 37.30 44.98 44.42 18 15t 1.22 1.24 0.00 0.01 19 11c-18:1 2.57 2.55 2.45 2.41 20 12c 1.95 1.93 0.03 0.05 21 13c 0.25 0.26 0.02 0.02 22 14c/16t 0.36 0.37 0.01 0.01 23 19:0/15c 0.38 0.39 0.01 0.01 24 9t12t-18:2 0.37 0.37 0.02 0.02 25 9c13t-18:2 0.97 0.96 0.03 0.04 26 8, 12-18:2 0.22 0.22 0.00 0.00 27 9c12t-18:2 0.92 0.91 0.14 0.15 28 9t12c-18:2 0.85 0.84 0.12 0.12 29 11t15c-18:2 0.42 0.42 0.00 0.00 30 18:2n6 3.05 3.39 14.43 15.13 31 9c15c-18:2 0.06 0.06 0.03 0.03 32 c, c-18:2 0.46 0.45 0.02 0.02 33 20:0 0.65 0.64 0.52 0.52 34 18:3n-6 0.09 0.09 0.04 0.04 35 18:3 cct- 0.13 0.12 0.58 0.56 36 18:3 ctc 0.08 0.08 0.10 0.10 37 18:3 tcc 0.11 0.10 0.51 0.49 38 20:1-11c 0.74 0.72 0.97 0.94 39 18:3n3 0.50 0.46 5.43 5.34 40 9t11t/10t12t 0.17 0.17 0.05 0.05 41 20:2n6 0.01 0.01 0.05 0.05 42 22:0 0.26 0.26 0.25 0.25 43 24:0 0.10 0.10 0.09 0.09 44 T Sat 12.01 11.67 15.86 15.78 45 T MUFA cis 43.46 42.96 48.74 48.17 46 T PUFA cis 3.65 3.94 19.95 20.51 47 T MUFA tr 23.54 23.90 0.43 0.62 48 T DUFA tr 3.75 3.72 0.31 0.34 49 T TUFA tr 0.32 0.29 1.19 1.15

US 2005/0250212 A1
TABLE 6-continued
Comparison of GC-HPLC and FT-NIR (Direct Measurement) Results for Hydrogenated and Non-Hydrogenated Margarine
GC-HPLC FT-NIR GC-HPLC FT-NIR Hydrog. Hydrog. Non-Hydrog. Non-Hydrog.
No. fatty acid Margarine Margarine Margarine Margarine
50 T trans 27.60 27.86 1.92 2.11 51 Water % 11.00 11.22 13.00 13.20
GC-HPLC = Gas Chromatography High Performance Liquid Chromatog raphy FT-NIR = Fourier Transform Near Infrared Spectrosocpy
[0108] TABLE 7
Validation of FT-NIR Method for Mixtures of Shortening and Lard
GC HPLC % FT-NIR % FT-NIR % 80% 80% GC-HPLC % 21% Short. Short. 21% Short. Short.
No. fatty acid 20% Lard 20% Lard 79% Lard 79% Lard
1 10:0 0.06 0.06 0.06 0.05 2 12:0 0.04 0.03 0.04 0.07 3 14:0 0.23 0.44 0.32 1.12 4 16:0 17.01 17.22 22.03 23.49 5 9c-16 1 0.45 0.54 1.57 1.56 6 17:0 0.18 0.15 0.35 0.32 7 17:1 0.10 0.09 0.25 0.22 8 18:0 10.63 10.69 13.09 13.90 9 5t- 0.03 0.07 0.00 0.05
10 6t-8t- 1.32 1.51 0.47 0.81 11 9t- 1.56 1.77 0.62 1.27 12 10t- 3.35 3.31 1.08 1.34 13 11t- 2.50 3.07 0.82 1.04 14 12t- 1.12 1.37 0.38 0.58 15 13t/14t- 1.11 1.72 0.45 0.72 16 9c- 27.10 28.83 34.53 35.17 17 15t 0.30 0.62 0.20 0.24 18 11c- 1.85 1.58 2.38 1.97 19 12c- 3.40 2.81 1.04 0.54 20 13c- 0.22 0.24 0.15 0.17 21 14c/16t- 0.11 0.16 0.05 0.07 22 14c 0.11 0.14 0.05 0.06 23 19:0 0.28 0.04 0.14 0.02 24 9t12t-18:2 0.10 0.07 0.03 0.03 25 9c13t- 0.77 0.61 0.25 0.16 26 9c 12t 18:2 1.26 0.83 0.50 0.28 27 9t, 12c 18:2 1.04 0.62 0.41 0.18 28 11t, 15c 18:2 0.26 0.14 0.06 0.01 29 18:2n6 19.36 17.18 14.94 11.79 30 20:0 0.38 0.31 0.28 0.29 31 cct-18:3 0.24 0.05 0.13 —0.01 32 9c-20:1, ctc 0.13 0.08 0.09 0.01 33 10c-20:1, cct 0.18 0.02 0.14 —0.04 34 11c-20:1 0.31 0.15 0.65 0.34 35 18:3n3 1.00 2.65 0.73 1.39 36 9c11t-CLA 0.14 0.12 0.08 0.07 37 20:2n6 0.12 0.08 0.43 0.34 38 22:0 0.27 0.21 0.09 0.08 39 24:0 0.09 0.08 0.02 0.04 40 T Sat 29.17 29.28 36.41 39.37 41 T C MUFA 33.08 33.79 39.05 38.45 42 T C PUFA 20.48 19.92 16.10 13.36 43 T MUFA trans 11.40 13.48 4.07 6.21 44 T DUFA trans 3.57 2.39 1.33 0.73 45 T TUFA trans 0.55 0.15 0.36 —0.05 46 T Trans 15.51 16.13 5.76 6.85
GC-HPLC = Gas Chromatography High Performance Liquid Chromatog raphy FT-NIR = Fourier Transform Near Infrared Spectrosocpy
11 Nov. 10, 2005
We claim: 1. A method for the determination of the fatty acid type
and/or content of a fat or oil component of a test sample material, Which method comprises preparation of a calibra tion matrix using a fatty acid reference analytical technique adapted to identify the type and quantity of fatty acids in a baseline reference material, and relating the results obtained to the spectral data obtained from an FT-NIR analysis of said baseline reference material;
analysing a test sample material using an FT-NIR tech nique to obtain FT-NIR spectral data for said test sample material; and
relating said FT-NIR spectra data of said test sample material to said calibration matrix in order to determine a value for the fatty acid content of any or all of the fatty acids present in said test sample material.
2. Amethod as claimed in claim 1 Wherein said fatty acid reference analytical technique is any analytical technique Which can directly, or indirectly provide speci?c information on the type and quantity of the fatty acid components of a fat or oil.
3. Amethod as claimed in claim 1 Wherein said fatty acid reference analytical technique is based on a GC (gas chro matography) procedure.
4. A method as claimed in claim 3 Wherein said GC procedure is standard GC, GC Silver Ion, GC-HPLC, GC TLC, or GC-MS.
5. Amethod as claimed in claim 4 wherein said calibration matrix is prepared using a technique based on data obtained by GC and FT-NIR analysis of selected baseline materials.
6. A method for the determination of the fatty acid type and/or content of a fat or oil component of a test sample material, Which method comprises:
identifying a series of baseline materials having a similar composition to that of a test sample material, and containing at least one form of fatty acid having a re?ectance or transmission characteristic correspond ing to a narroW Wave band of light in the near-infrared region of the spectrum;
analysing said baseline materials using a GC technique to determine the fatty acid composition of each of said baseline materials;
analysing said baseline materials using a Fourier Trans form-Near Infrared (FT-NIR) technique to produce FT-NIR spectral data for each of said baseline materi als;
establishing a calibration matrix to relate the FT-NIR spectral data to the results determined from said GC technique for any or all of said fatty acids identi?ed by said GC technique;
analysing a test sample material using said FT-NIR tech nique to produce NIR spectral data for said test sample material, and relating the spectral data from said FT NIR technique to said calibration matrix to determine a value for the fatty acid content of any or all of the fatty acids present in said test sample material.
7. A method as claimed in claim 6 Wherein said near infrared region of the spectrum has a frequency range of from betWeen 4000 cm-1 (2.5 microns) and 14000 cm-1 (0.7 microns) Wavenumber.
US 2005/0250212 A1
8. A method as claimed in claim 7 wherein said frequency range is from betWeen 4300 cm-1 (2.2 microns) to 9000 cm (1.1 microns).
9. A method as claimed in claim 8 Wherein said frequency range is from betWeen 5400 cm'1 (1.7 microns) to 9000 cm (1.1 microns).
10. A method as claimed in claim 6 Wherein said FT-NIR technique for testing said test sample material is based on a re?ective technique.
11. A method as claimed in claim 6 Wherein said FT-NIR technique for testing said test sample material is based on a transmission technique.
12. A method as claimed in claim 6 Wherein said FT-NIR technique for testing said test sample material is based on a trans?ectance technique.
13. A method as claimed in claim 1 Wherein said test sample material is a food product.
14. A method as claimed in claim 13 Wherein said test sample material is vegetable oil, soy oil, ?ax oil, shortening, lard, mayonnaise, salad dressing, cookies, baked goods, crackers or potato chips.
15. A method as claimed in claim 1 Wherein said test sample material is living tissue.
16. A method as claimed in claim 15 Wherein said living tissue is human tissue, ?sh tissue, or non-human mammal tissue.
Nov. 10, 2005
17. Amethod as claimed in claim 1 Wherein said baseline materials are similar in composition, With respect to the type of fatty acid, to the test sample material but have a range of fatty acid levels.
18. A method as claimed in claim 1 Wherein said FT-NIR analysis involves use of mathematically modi?ed values to improve the ability to distinguish one material over another.
19. A method as claimed in claim 1 Wherein the fat or oil content of said test sample material is extracted prior to FT-NIR analysis.
20. A method as claimed in claim 1 Wherein the test sample material is tested as is.
21. A method as claimed in claim 1 Wherein the FT-NIR analysis of said test sample material is conducted in a time of less than 2 minutes.
22. A method as claimed in claim 1 Wherein said calibra tion matriX is based on a statistical analysis of the spectral data and the GC data from the analysis of said baseline materials.
23. A method as claimed in claim 22 Wherein said statistical analysis involves multiple linear regression (MLR), principal component regression (PCR), or partial least squares regression (PLSR).
* * * * *