Embed Size (px)
Citation preview
REVIEW
Fruits, vegetables, and bladder cancer risk: a systematicreview and meta-analysisAna R. Vieira1, Snieguole Vingeliene1, Doris S. M. Chan1, Dagfinn Aune1,2, Leila Abar1,Deborah Navarro Rosenblatt1, Darren C. Greenwood3 & Teresa Norat1
1Department of Epidemiology and Biostatistics, School of Public Health, Imperial College London, London, United Kingdom2Department of Public Health and General Practice, Faculty of Medicine, Norwegian University of Science and Technology, Trondheim, Norway3Division of Biostatistics, University of Leeds, Leeds, United Kingdom
Keywords
Bladder cancer, fruits, meta-analysis,
systematic review, vegetables
Correspondence
Ana R. Vieira, Department of Epidemiology
and Biostatistics, School of Public Health,
Faculty of Medicine, Imperial College
London, room 501, 5th floor, Norfolk Place,
St Mary’s Campus, London W2 1PG, United
Kingdom.
Tel: +44 207 5948589;
E-mail: [email protected]
Funding Information
This work was funded by the World Cancer
Research Fund (grant number 2007/SP01) as
part of the Continuous Update Project. The
sponsor of this study had no role in the
decisions about the design or conduct of the
study; the collection, management, analysis,
or interpretation of the data; or the
preparation, review, or approval of the
manuscript.
Received: 10 June 2014; Revised: 22 July
2014; Accepted: 31 July 2014
Cancer Medicine 2015; 4(1):136–146
doi: 10.1002/cam4.327
Abstract
Smoking is estimated to cause about half of all bladder cancer cases. Case–con-trol studies have provided evidence of an inverse association between fruit and
vegetable intake and bladder cancer risk. As part of the World Cancer
Research/American Institute for Cancer Research Continuous Update Project,
we conducted a systematic review and meta-analysis of prospective studies to
assess the dose–response relationship between fruit and vegetables and incidence
and mortality of bladder cancer. We searched PubMed up to December 2013
for relevant prospective studies. We conducted highest compared with lowest
meta-analyses and dose–response meta-analyses using random effects models to
estimate summary relative risks (RRs) and 95% confidence intervals (CIs), and
used restricted cubic splines to examine possible nonlinear associations. Fifteen
prospective studies were included in the review. The summary RR for an
increase of 1 serving/day (80 g) were 0.97 (95% CI: 0.95–0.99) I2 = 0%, eight
studies for fruits and vegetables, 0.97 (95% CI: 0.94–1.00, I2 = 10%, 10 studies)
for vegetables and 0.98 (95% CI: 0.96–1.00, I2 = 0%, 12 studies) for fruits.
Results were similar in men and women and in current, former and nonsmok-
ers. Amongst fruits and vegetables subgroups, for citrus fruits the summary RR
for the highest compared with the lowest intake was 0.87 (95% CI: 0.76–0.99,I2 = 0%, eight studies) and for cruciferous vegetables there was evidence of a
nonlinear relationship (P = 0.001). The current evidence from cohort studies is
not consistent with a role for fruits and vegetables in preventing bladder
cancer.
Introduction
Bladder cancer is the 11th most common cancer in the
world. Age-standardized rates (per 100,000 persons per
year) are higher in men than in women for both inci-
dence (8.9 vs. 2.2) and mortality (3.3 vs. 0.9). The high-
est incidence rates are in Europe, the United States, and
Egypt, and the lowest rates are found in sub-Saharan
Africa, Asia, and South America [1]. The geographic
variation in incidence rates is thought to be explained by
differences in the prevalence of risk factors across coun-
tries. Tobacco use, a well-established risk factor of blad-
der cancer is estimated to account for about half of all
bladder cancer cases in both men and women and may
explain the high incidence of bladder cancer in Europe
and North America [2]. The high incidence of bladder
cancer in Egypt and other North African countries has
been largely attributed to infection with schistosoma
136 ª 2014 The Authors. Cancer Medicine published by John Wiley & Sons Ltd. This is an open access article under the terms of
the Creative Commons Attribution License, which permits use, distribution and reproduction in any medium,
provided the original work is properly cited.
Cancer MedicineOpen Access

parasite. After the successful control of schistosomiasis,
Egypt experienced a decrease in the proportion of squa-
mous cell carcinoma cases, which are associated with
schistosomiasis, but an increase in the proportion of
transitional cell carcinoma that is related to smoking [3].
Occupational exposure to carcinogenic aromatic amines,
polycyclic aromatic hydrocarbons, and chlorinated hydro-
carbons is a risk factor of urothelial bladder cancer and
increasing evidence supports an influence of genetic pre-
disposition [4].
The role of dietary factors in the development of blad-
der cancer has also been investigated, but the evidence is
not clear. In the World Cancer Research/American Insti-
tute for Cancer Research (WCRF/AICR) Second Expert
Report from 2007 it was concluded that the evidence of a
relationship between incidence of bladder cancer and milk
intake (decreased risk) and arsenic from drinking water
(increased risk) was “limited but suggestive” and that the
evidence of other nutritional factors was too limited for a
conclusion to be drawn [5].
Amongst dietary factors, fruits and vegetables have
been investigated because they provide an abundant
source of nutrients and phytochemicals with potentially
anticarcinogenic properties. Since the 2007 WCRF/AICR
report, seven cohort studies from six publications have
published on this association [6–11]. As part of the
WCRF/AICR Continuous Update Project, we conducted a
systematic review and meta-analysis of cohort studies to
assess the relationship of fruits and vegetables intake and
bladder cancer risk. We investigated the strength and
shape of the relationship by performing linear and non-
linear dose–response meta-analyses. We investigated the
total intake of fruits and vegetables and also subgroups of
vegetables for which there was enough information to
conduct meta-analyses.
Methods
Search strategy
The PubMed database was searched up to December 2013
for studies of fruit and vegetables and bladder cancer risk.
The protocol followed for the review can be found
at: http://www.dietandcancerreport.org/cancer_resource_
center/downloads/cu/CUP_bladder_cancer_protocol.pdf
and includes the specific search criteria used. Further-
more, the reference list of the included articles and
published meta-analyses and reviews was searched.
Figure 1. Flowchart of study selection.
ª 2014 The Authors. Cancer Medicine published by John Wiley & Sons Ltd. 137
A. R. Vieira et al. Fruits, Vegetables, and Bladder Cancer Risk

Study selection
The inclusion criteria were (1) being a randomized trial,
cohort study, case-cohort study or nested case–controlstudy; (2) report the estimates of the relative risk (RR)
(e.g., hazard ratio [HR], risk ratio or odds ratio) and
95% confidence intervals (CIs) for the association of
fruit and/or vegetables and bladder cancer or urothelial
cancer incidence or mortality; (3) provide a quantitative
measure of the intake to be used in the dose–responseanalysis. When the same study published more than one
article on fruit and vegetables and bladder cancer, we
selected the newest publication with the largest number
of cases.
From 7051 articles identified, 6885 articles were
excluded based on the abstract and title and 166 articles
were retrieved and assessed for potential inclusion. Of
these, 153 articles which did not meet the inclusion crite-
ria were excluded and 15 articles (15 studies) which met
the inclusion criteria were included (Flowchart of study
selection—Fig. 1).
Data extraction
The data extracted for each article were: first author’s
last name, publication year, country where the study was
conducted, the study name, follow-up period, sample
size, gender, age, number of cases, dietary assessment
method (type, number of food items, and whether it
had been validated), type of fruit and/or vegetable,
amount of intake, RRs and 95% CIs and adjustment
variables. The search and data extraction of articles pub-
lished up to June 2006 was conducted by several review-
ers at the University of Bristol during the systematic
literature review for the WCRF/AICR Second Expert
Report (available online: http://www.dietandcancerreport.
org/cancer_resource_center/downloads/SLR/Bladder_SLR.
pdf). The search and extraction from June 2006 and up
to December 2013 was conducted by the CUP team at
Imperial College London.
Statistical methods
We calculated summary RRs and 95% CIs for the highest
compared to the lowest levels of fruits and vegetables
intake using random effect models to account for antici-
pated heterogeneity. The natural logarithm of the RRs
was weighted by the method of Dersimonian and Laird
and then pooled across studies [12]. The method
described by Greenland and Longnecker [13, 14] was
used to estimate linear trends and 95% CIs from the nat-
ural logs of the RR and respective CI across categories of
fruit and vegetable intake. In order to use this method, at
least three categories of intake and the number of cases
and person-years or noncases per category was required.
When studies reported only the total number of cases or
total person-years and the exposure was defined in quan-
tiles, the distribution of cases or person-years was calcu-
lated dividing the total number by the number of
quantiles. Whenever reported, the mean or median intake
by category was assigned to the corresponding RR. The
midpoint was calculated for studies that only reported a
range of intake by category. When the intake range was
open-ended we assumed that its width was the same as
the adjacent category. For studies presenting the exposure
per given unit of energy intake, we rescaled it using the
mean energy intake provided. We expressed the dose–response by increments of 1 serving/day for fruits and
vegetables and 1 serving/week for cruciferous and leafy
vegetables, because most of the studies reported the
intake in servings. For studies that reported in grams, the
conversion unit of 80 g as a serving size was used, for
comparison with other meta-analyses of fruit and vegeta-
ble intake and cancer risk [15].Where results were only
presented separately for men and women, they were com-
bined using a fixed effects meta-analysis before being
pooled with other studies to ensure that between-study
heterogeneity was not underestimated. Between-study
heterogeneity was assessed using Cochran Q test and the
percentage of total variation in study estimates attribut-
able to between-study heterogeneity (I2). Heterogeneity
was explored by stratified analysis by sex, geographic
location and smoking status (when the studies provided
sufficient data), and by visual inspection of the forest
plots. Most of the studies adjusted the analysis for smok-
ing status. Potential small-study effects, such as publica-
tion bias, were explored using Egger’s test and funnel
plots.
To examine possible nonlinear associations, we calcu-
lated restricted cubic splines for each study with more
than three categories of exposure, using three fixed knots
at 10%, 50%, and 90% through the total distribution of
the reported intake, and combined them using multivari-
ate meta-analysis [16, 17]. Only studies which presented
more than three categories could be included in the non-
linear analysis. A two-tailed P < 0.05 was considered sta-
tistically significant. All the studies included provided
adjusted results.
Stata version 12 software (StataCorp, College Station,
TX) was used for the statistical analyses.
Results
Fifteen cohort studies (n) from 15 publications were
included in the analyses [6–11, 18–27]. Nine studies were
on total fruit and vegetables, 10 studies on vegetables,
138 ª 2014 The Authors. Cancer Medicine published by John Wiley & Sons Ltd.
Fruits, Vegetables, and Bladder Cancer Risk A. R. Vieira et al.

Table
1.Su
mmarytable
ofresults.
Exposures
Totalfruitan
d
vegetab
les
Veg
etab
les
Cruciferous
vegetab
les
Leafyvegetab
les
Fruits
Citrusfruits
Highestversuslowestan
alysis
n/N
9/2588
10/5119
7/2437
6/2310
12/5329
8/2293
HvL
RR(95%
CI)
0.89(0.75–1
.05)
0.92(0.84–1
.01)
0.85(0.69–1
.06)
0.90(0.78–1
.04)
0.91(0.82–1
.00)
0.87(0.76–0
.99)
I2,P h
eterogeneity
I2=34%,P h
=0.16
I2=5%,P h
=0.39
I2=63%,P h
=0.02
I2=0%,P h
=0.69
I2=11%,P h
=0.34
I2=0%,P h
=0.88
Stratified
highestversuslowestan
alysisbysm
okingstatus
Never
smokers
(n)
53
13
HvL
RR(95%
CI)
0.85(0.62–1
.18)
0.95(0.68–1
.33)
0.26(0.10–0
.65)
0.91(0.64–1
.28)
I2,P h
eterogeneity
I2=0%,P h
=0.42
I2=0%,P h
=0.85
I2=0%,P h
=0.94
Form
ersm
okers
(n)
53
13
HvL
RR(95%
CI)
0.96(0.77–1
.19)
0.96(0.76–1
.20)
0.70(0.43–1
.15)
1.00(0.75–1
.34)
I2,P h
eterogeneity
I2=0%,P h
=0.73
I2=0%,P h
=0.95
I2=38%,P h
=0.18
Curren
tsm
okers
(n)
53
13
HvL
RR(95%
CI)
0.83(0.64–1
.09)
0.80(0.61–1
.05)
0.89(0.36–2
.17)
0.78(0.53–1
.13)
I2,P h
eterogeneity
I2=0%,P h
=0.74
I2=0%,P h
=0.45
I2=44%,P h
=0.15
1serving/day
1serving/day
1serving/w
eek
1serving/w
eek
1serving/day
1serving/day
Lineardose–response
meta-an
alysis
n/N
8/2508
10/5119
7/2437
6/2310
12/5329
8/2988
RR(95%
CI)
0.97(0.95–0
.99)
0.97(0.94–1
.00)
0.98(0.94–1
.02)
0.98(0.95–1
.01)
0.98(0.96–1
.00)
0.98(0.93–1
.03)
I2P h
eterogeneity
I2=0%,P h
=0.76
I2=10%,P h
=0.35
I2=58%,P h
=0.04
I2=0%,P h
=0.74
I2=0%,P h
=0.51
I2=0%,P h
=0.61
Stratified
lineardose-response
bysex
Men
(n)
45
31
62
RR(95%
CI)
0.99(0.96–1
.01)
0.98(0.93–1
.02)
0.98(0.91–1
.06)
0.99(0.93–1
.05)
0.98(0.94–1
.02)
0.99(0.92–1
.07)
I2,P h
eterogeneity
I2=0%,P h
=0.59
I2=20%,P h
=0.28
I2=77%,P h
=0.01
I2=19%,P h
=0.29
I2=0%,P h
=0.54
Women
(n)
23
23
3
RR(95%
CI)
0.93(0.81–1
.07)
0.97(0.80–1
.18)
0.97(0.88–1
.07)
0.97(0.87–1
.09)
0.87(0.64–1
.20)
I2,P h
eterogeneity
I2=87%,P h<0.01
I2=76%,P h
=0.02
I2=68%,P h
<0.07
I2=70%,P h
=0.04
I2=72%,P h
=0.03
Stratified
lineardose-response
bylocation
USA
(n)
45
31
63
RR(95%
CI)
0.97(0.94–0
.99)
0.97(0.93–1
.02)
0.96(0.92–1
.01)
0.99(0.93-1.05)
0.98(0.94–1
.01)
0.99(0.94–1
.04)
I2P h
eterogeneity
I2=0%,P h
=0.86
I2=18%,P h
=0.30
I2=53%,P h
=0.12
I2=15%,P h
=0.32
I2=0%,P h
=0.48
Europe(n)
45
44
42
RR(95%
CI)
0.99(0.95–1
.03)
0.97(0.92–1
.03)
1.00(0.92–1
.09)
0.97(0.94–1
.01)
0.99(0.95–1
.03)
0.95(0.83–1
.09)
I2,P h
eterogeneity
I2=0%,P h
=0.39
I2=25%,P h
=0.26
I2=69%,P h
=0.04
I2=0%,P h
=0.50
I2=0%,P h
=0.45
I2=0%,P h
=0.83
Asia(n)
11
2
RR(95%
CI)
0.94(0.82–1
.07)
0.77(0.42–1
.42)
0.50(0.19–1
.31)
I2,P h
eterogeneity
I2=0%,P h
=0.37
Nonlineardose–response
analysis
n/N
7/2437
8/4101
7/2437
4/1275
8/4101
5/1844
P non-linearity
P=0.06
P=0.001
P<0.001
P=0.29
P=0.43
P=0.15
P h,Pforheterogen
eity;n,number
ofstudies;
N,number
ofcases.
ª 2014 The Authors. Cancer Medicine published by John Wiley & Sons Ltd. 139
A. R. Vieira et al. Fruits, Vegetables, and Bladder Cancer Risk
seven studies on cruciferous vegetables, six studies on
leafy vegetables, 12 studies on fruits, and eight studies on
citrus fruits. The outcome was urothelial cancer in four
studies and bladder cancer in 10 studies. Six studies were
from the U.S.A., five studies were European, and four
studies were from Asia. Eleven studies were on men and
women, three studies were on men, and one study was
on women (Table S1). A summary of the results of the
meta-analyses is provided in Table 1.
Fruit and vegetables
The overall RR for the highest compared with the lowest
category of fruits and vegetables intake was 0.89 (95%
CI: 0.75–1.05, I2 = 34%, Pheterogeneity = 0.16) across nine
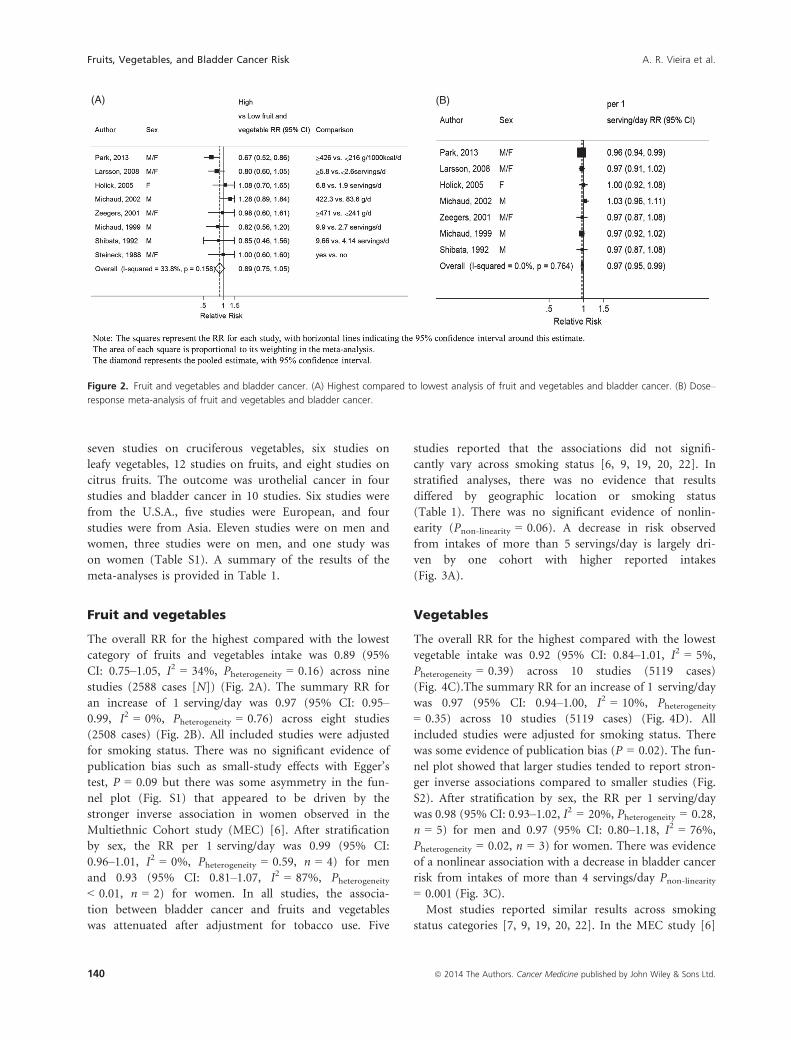
studies (2588 cases [N]) (Fig. 2A). The summary RR for
an increase of 1 serving/day was 0.97 (95% CI: 0.95–0.99, I2 = 0%, Pheterogeneity = 0.76) across eight studies
(2508 cases) (Fig. 2B). All included studies were adjusted
for smoking status. There was no significant evidence of
publication bias such as small-study effects with Egger’s
test, P = 0.09 but there was some asymmetry in the fun-
nel plot (Fig. S1) that appeared to be driven by the
stronger inverse association in women observed in the
Multiethnic Cohort study (MEC) [6]. After stratification
by sex, the RR per 1 serving/day was 0.99 (95% CI:
0.96–1.01, I2 = 0%, Pheterogeneity = 0.59, n = 4) for men
and 0.93 (95% CI: 0.81–1.07, I2 = 87%, Pheterogeneity< 0.01, n = 2) for women. In all studies, the associa-
tion between bladder cancer and fruits and vegetables
was attenuated after adjustment for tobacco use. Five
studies reported that the associations did not signifi-
cantly vary across smoking status [6, 9, 19, 20, 22]. In
stratified analyses, there was no evidence that results
differed by geographic location or smoking status
(Table 1). There was no significant evidence of nonlin-
earity (Pnon-linearity = 0.06). A decrease in risk observed
from intakes of more than 5 servings/day is largely dri-
ven by one cohort with higher reported intakes
(Fig. 3A).
Vegetables
The overall RR for the highest compared with the lowest
vegetable intake was 0.92 (95% CI: 0.84–1.01, I2 = 5%,
Pheterogeneity = 0.39) across 10 studies (5119 cases)
(Fig. 4C).The summary RR for an increase of 1 serving/day
was 0.97 (95% CI: 0.94–1.00, I2 = 10%, Pheterogeneity= 0.35) across 10 studies (5119 cases) (Fig. 4D). All
included studies were adjusted for smoking status. There
was some evidence of publication bias (P = 0.02). The fun-
nel plot showed that larger studies tended to report stron-
ger inverse associations compared to smaller studies (Fig.
S2). After stratification by sex, the RR per 1 serving/day
was 0.98 (95% CI: 0.93–1.02, I2 = 20%, Pheterogeneity = 0.28,
n = 5) for men and 0.97 (95% CI: 0.80–1.18, I2 = 76%,
Pheterogeneity = 0.02, n = 3) for women. There was evidence
of a nonlinear association with a decrease in bladder cancer
risk from intakes of more than 4 servings/day Pnon-linearity= 0.001 (Fig. 3C).
Most studies reported similar results across smoking
status categories [7, 9, 19, 20, 22]. In the MEC study [6]
(A) (B)
Figure 2. Fruit and vegetables and bladder cancer. (A) Highest compared to lowest analysis of fruit and vegetables and bladder cancer. (B) Dose–
response meta-analysis of fruit and vegetables and bladder cancer.
140 ª 2014 The Authors. Cancer Medicine published by John Wiley & Sons Ltd.
Fruits, Vegetables, and Bladder Cancer Risk A. R. Vieira et al.

the inverse association with vegetable intake was similar
across smoking strata in women but in men a significant
inverse trend was observed in current smokers (RR high-
est vs. lowest: 0.40, 95% CI: 0.18–0.90; Ptrend = 0.02) but
not in never or former smokers. In the EPIC study [7]
there was no significant interaction with smoking, but
lower risks of bladder cancer were observed in never and
former smokers with higher consumption of vegetables,
but not in current smokers. Overall, there was no evi-
dence that results differed by smoking status or geo-
graphic location (Table 1).
Cruciferous vegetables
The overall RR for the highest compared with the lowest
intake was 0.85 (95% CI: 0.69–1.06, I2 = 63%, Pheterogeneity= 0.02) across seven studies (2437 cases) (Fig. 4A). The
summary RR for an increase of 1 serving/week was 0.98
(95% CI: 0.94–1.02, I2 = 58%, Pheterogeneity = 0.04) across
seven studies (2437 cases) (Fig. 4B). All included studies
were adjusted for smoking status.
One study found no evidence that the association
between cruciferous vegetables and risk of bladder cancer
was modified by smoking status (data not shown) [19].
The only study that stratified the analysis by smoking status
observed a strong inverse association between cruciferous
vegetable intake and bladder cancer in nonsmokers
(RR = 0.26; 95% CI: 0.10–0.65, ≥4.5 vs. <1.5 servings/
week) and weak nonsignificant inverse associations in past
(RR = 0.70; 95% CI: 0.43–1.15, ≥4.5 vs. <1.5 servings/
week) and current smokers (RR = 0.89; 95% CI: 0.36–2.17,≥4.5 vs. <1.5 servings/week) [20]. There was no evidence
that results differed by geographic location (Table 1).
There was no evidence of publication bias (P = 0.50)
but the number of studies was small. There was evidence
of a nonlinear association with a decrease in bladder
cancer risk from intakes of more than 3 servings/week,
Pnon-linearity = 0.001 (Fig. 3D).
(A) (B)
(C) (D)
Figure 3. Nonlinear dose–response analysis. (A) Nonlinear analysis of fruit and vegetables intake and bladder cancer. (B) Nonlinear analysis of
fruit intake and bladder cancer. (C) Nonlinear analysis of vegetables intake and bladder cancer. (D) Nonlinear analysis of cruciferous vegetables
and bladder cancer.
ª 2014 The Authors. Cancer Medicine published by John Wiley & Sons Ltd. 141
A. R. Vieira et al. Fruits, Vegetables, and Bladder Cancer Risk
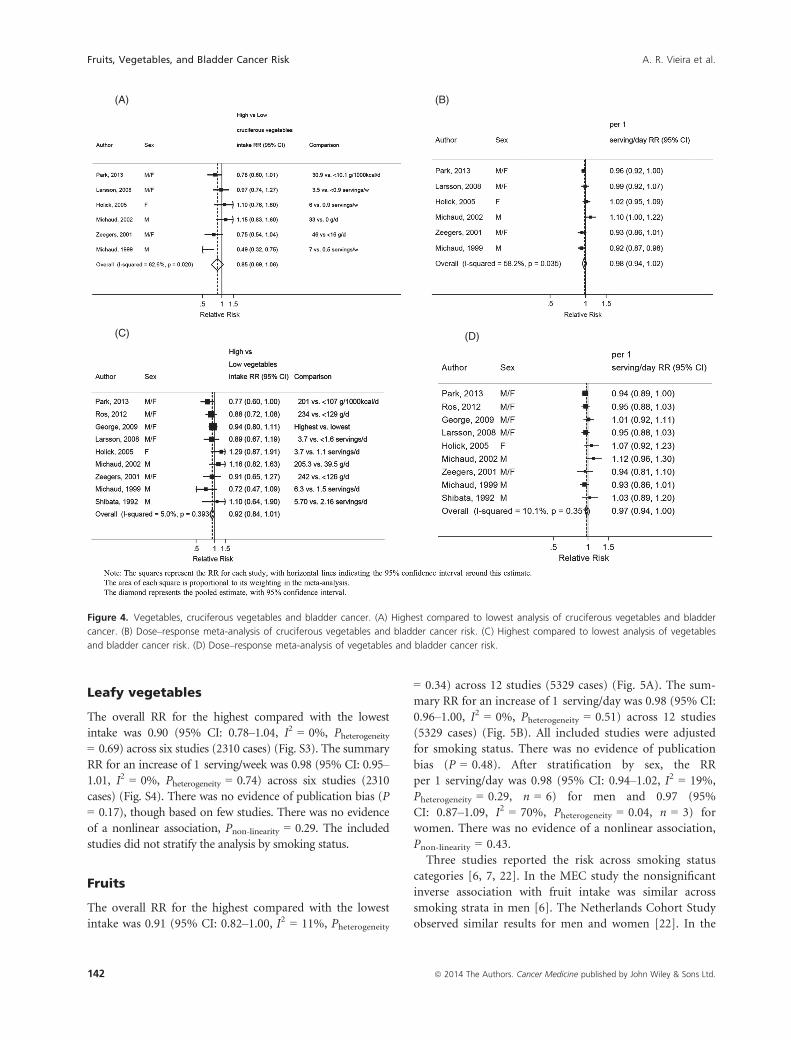
Leafy vegetables
The overall RR for the highest compared with the lowest
intake was 0.90 (95% CI: 0.78–1.04, I2 = 0%, Pheterogeneity= 0.69) across six studies (2310 cases) (Fig. S3). The summary
RR for an increase of 1 serving/week was 0.98 (95% CI: 0.95–1.01, I2 = 0%, Pheterogeneity = 0.74) across six studies (2310
cases) (Fig. S4). There was no evidence of publication bias (P
= 0.17), though based on few studies. There was no evidence
of a nonlinear association, Pnon-linearity = 0.29. The included
studies did not stratify the analysis by smoking status.
Fruits
The overall RR for the highest compared with the lowest
intake was 0.91 (95% CI: 0.82–1.00, I2 = 11%, Pheterogeneity
= 0.34) across 12 studies (5329 cases) (Fig. 5A). The sum-
mary RR for an increase of 1 serving/day was 0.98 (95% CI:
0.96–1.00, I2 = 0%, Pheterogeneity = 0.51) across 12 studies
(5329 cases) (Fig. 5B). All included studies were adjusted
for smoking status. There was no evidence of publication
bias (P = 0.48). After stratification by sex, the RR
per 1 serving/day was 0.98 (95% CI: 0.94–1.02, I2 = 19%,
Pheterogeneity = 0.29, n = 6) for men and 0.97 (95%
CI: 0.87–1.09, I2 = 70%, Pheterogeneity = 0.04, n = 3) for
women. There was no evidence of a nonlinear association,
Pnon-linearity = 0.43.
Three studies reported the risk across smoking status
categories [6, 7, 22]. In the MEC study the nonsignificant
inverse association with fruit intake was similar across
smoking strata in men [6]. The Netherlands Cohort Study
observed similar results for men and women [22]. In the
(A) (B)
(C) (D)
Figure 4. Vegetables, cruciferous vegetables and bladder cancer. (A) Highest compared to lowest analysis of cruciferous vegetables and bladder
cancer. (B) Dose–response meta-analysis of cruciferous vegetables and bladder cancer risk. (C) Highest compared to lowest analysis of vegetables
and bladder cancer risk. (D) Dose–response meta-analysis of vegetables and bladder cancer risk.
142 ª 2014 The Authors. Cancer Medicine published by John Wiley & Sons Ltd.
Fruits, Vegetables, and Bladder Cancer Risk A. R. Vieira et al.

EPIC study [7] inverse associations were observed among
never and former smokers but not in current smokers.
The multiplicative interaction test was not significant.
Overall, there was no evidence that results differed by
smoking status or geographic location (Table 1).
Citrus fruits
The overall RR for the highest compared with the
lowest intake was 0.87 (95% CI: 0.76–0.99, I2 = 0%,
Pheterogeneity = 0.88) across eight studies (2293 cases)
(Fig. 5C). After excluding the only study on mortality
[10], the overall result was nonsignificant 0.88 (95%
CI: 0.77–1.01, I2 = 0%, Pheterogeneity = 0.98). The sum-
mary RR for an increase of 1 serving/day was 0.98
(95% CI: 0.93–1.03, I2 = 0%, Pheterogeneity = 0.62) across
eight studies (2988 cases) (Fig. 5D). All, except one
study [10], adjusted for smoking status. There was no
evidence of publication bias with Egger’s test, P = 0.38.
There was no evidence of a nonlinear association,
Pnon-linearity = 0.15. The included studies did not stratify
the analysis by smoking status. One study that found
no evidence of association between citrus fruits and risk
of bladder cancer reported that the relationship was not
modified by smoking status [19].
Discussion
In this meta-analysis, the consumption of total fruit
and vegetables, total vegetables, and total fruit was not
(A) (B)
(C) (D)
Figure 5. Fruits, citrus fruits, and bladder cancer. (A) Highest compared to lowest analysis of fruit and bladder cancer. (B) Dose–response meta-
analysis of fruit and bladder cancer risk. (C) Highest compared to lowest analysis of citrus fruits and bladder cancer. (D) Dose–response meta-
analysis of citrus fruits and bladder cancer risk.
ª 2014 The Authors. Cancer Medicine published by John Wiley & Sons Ltd. 143
A. R. Vieira et al. Fruits, Vegetables, and Bladder Cancer Risk

associated with lower risk of bladder cancer. No associa-
tion was observed in the meta-analysis comparing the
highest with the lowest intake of fruit and vegetables and
a modest inverse association was observed in the dose–response meta-analysis. The shape of the nonlinear curves
showed a trend toward a decrease in risk although this
might be driven by two studies with higher reported
intakes [6, 22]. In all studies, any observed associations
were attenuated after adjustment for smoking status.
There was higher heterogeneity across studies in women
compared to men, mainly explained by the results of one
study [6] that showed a strong significant inverse associa-
tion of fruit and vegetables and bladder cancer in women,
but not in men.
A significant association was observed for citrus fruits
in the analysis of the highest compared with the lowest
intake, however this was nonsignificant after excluding
the only study with mortality as outcome. The dose–response meta-analysis was nonsignificant. Citrus fruits
are rich in vitamin C and dietary vitamin C was not asso-
ciated with bladder cancer risk in three cohort studies
[19, 28, 29]. No association of plasma vitamin C levels
with risk of urothelial cell cancer was reported by an
European prospective study [30].
Although the results of several case–control studies
have reported inverse association of fruits and vegetables
and bladder cancer risk, previous meta-analyses that
included cohort studies and case–control studies have
shown different results between the two study types. In a
meta-analysis of cohort and case–control studies, lower
compared with higher consumption of vegetables was not
related to bladder cancer in cohort studies (RR = 1.09,
95% CI: 0.76–1.54, n = 3, N = 203) but lower vegetables
consumption was associated with an increased risk in
case–control studies (RR = 1.18, 95% CI: 1.01–1.31,n = 7, N = 2463). Similarly, lower compared to higher
consumption of fruit was associated with an increased
risk of bladder cancer in cohort and case–control studiescombined (RR = 1.47, 95% CI: 1.08–2.00, n = 7,
N = 2208), but the association was not significant when
restricted to cohort studies (RR = 1.42, 95% CI: 0.98–2.06, n = 3) [31]. In another meta-analysis [15], the sum-
mary RR were 0.91, 95% CI: 0.82–1.00, Pheterogeniety= 0.12, n = 6 and 0.81, 95% CI: 0.73–0.91, P < 0.01,
n = 8 for an increase of 100 g of vegetables and fruits
respectively, but only two and three cohort studies were
included and when the analyses were restricted to cohort
studies, the associations were slightly attenuated.
A meta-analysis of citrus fruit intake and bladder can-
cer risk [32] reported a significant inverse association for
the highest compared with the lowest analysis in case–control studies (RR = 0.77, 95% CI: 0.64–0.92, n = 8,
N = 4729) and a nonsignificant association for cohort
studies (RR = 0.96, 95% CI: 0.87–1.07, n = 6, N = 2643).
Comparing with our meta-analysis, Liang et al. [32] only
performed highest compared with lowest analysis while
we also conducted linear and nonlinear analyses. They
included the EPIC study [33] in their highest compared
with lowest analysis while we only included it in the
dose–response meta-analysis because the study only pro-
vided HR (95% CI) for continuous increment of citrus
fruits intake [7]. The Netherlands Cohort Study [22] was
missed by Liang et al. [32] and studies with mortality as
endpoint were excluded, while we showed results includ-
ing and excluding the only study on mortality [10]. When
our highest compared with lowest analysis was restricted
to studies on bladder cancer incidence the overall result
we obtained was similar to the result of Liang et al. [32].
The high antioxidant content of fruit and vegetables
may reduce or prevent the oxidative damage caused by
cigarette smoking. Smokers may benefit the most from
fruits and vegetables, because they have been shown to
have lower antioxidant levels than nonsmokers although
this has not been consistently shown [34]. Bladder cancer
is associated with smoking [35, 36]. Most of the studies
included in this quantitative review reported no signifi-
cant interaction by smoking of the association of fruits
and vegetables intake with bladder cancer. In the MEC,
bladder cancer risk was inversely associated with a “vege-
table dietary pattern” in current smokers but not in for-
mer smokers and nonsmokers [6] and in the EPIC study,
a higher consumption of fruit and vegetables was associ-
ated with a lower risk of bladder cancer among never and
former smokers but not in current smokers [7]. All the
studies, except one [10], included in the meta-analyses
were adjusted for smoking. Five studies [6, 7, 9, 19, 22]
were included in the highest compared with lowest strati-
fied analysis by smoking status and no difference of asso-
ciation emerged. There were not enough data to conduct
a dose–response analysis stratified by smoking status.
Our meta-analysis has several limitations. First, and
although in order to conduct the meta-analysis in serv-
ings/day, we had to use a conversion unit of 80 g as equiv-
alent to a serving size for studies which reported the
consumption of fruit and vegetables in g/day [7, 22, 27],
g/1000 kcal/day [6] or cup equivalent/1000 kcal [8]. This
conversion may introduce some additional error because
different fruits and vegetables may have different serving
sizes. However, the results were mainly consistent with the
meta-analysis of the highest compared with the lowest
intakes, indicating that the approximation should not have
masked any existing association. All the included studies
assessed the dietary intake with food frequency question-
naires (FFQ). In two studies the RR estimates were cor-
rected for dietary measurement error [6, 7] and in two
studies, repeated dietary assessment were used [19, 20].
144 ª 2014 The Authors. Cancer Medicine published by John Wiley & Sons Ltd.
Fruits, Vegetables, and Bladder Cancer Risk A. R. Vieira et al.

Only in one of these studies [6], fruits and vegetables were
inversely associated with the risk of invasive bladder can-
cer in women and current smoker men—but not in never
and former smoker men. Some studies have reported
inverse associations between plasma carotenoids (as mark-
ers of fruit and vegetable intake) and urothelial cell carci-
noma or bladder cancer [30, 37–39], but the number of
studies is limited. Only studies with more than three cate-
gories of intake could be included in the nonlinear dose–response meta-analyses using restricted cubic splines
therefore the results were repeated using fractional polyno-
mial models that allow the inclusion of more studies, but
are more sensitive to extreme values. With the fractional
polynomial models nonlinearity was observed for fruits
and vegetables (Pnon-linearity = 0.04, n = 8 and for crucifer-
ous vegetables (Pnon-linearity = 0.03, n = 7). However, the
decreased risk observed at higher intake levels was driven
for a small number of observations and no firm conclu-
sion can be made. Although no small-study effects such as
publication bias were identified, the total number of stud-
ies was small, so we cannot exclude bias from this source.
This meta-analysis has strengths, including the prospec-
tive design of the studies included in the analyses that
avoids the potential recall bias and selection bias from
case–control studies. Contrary to what has been suggested
in previous case–control studies, the current evidence
from cohort studies does not support that fruits and veg-
etables can protect against bladder cancer. However,
based on the limited number of studies available, an asso-
ciation with specific types of fruits or vegetables, such as
citrus fruits or cruciferous vegetables cannot be excluded.
Acknowledgments
This study is part of the WCRF Continuous Update
Project (http://www.wcrf.org/cancer_research/cup/index.
php). The views expressed in this review are the opinions
of the authors. They may not represent the views of
WCRF International/AICR and may differ from those in
future updates of the evidence related to food, nutrition,
physical activity, and cancer risk. All authors had full
access to the data in the study.
Conflict of Interest
A. R. Vieira takes responsibility for the integrity of the
data and the accuracy of the data analysis. The authors
declare that there are no conflicts of interest.
References
1. Chavan, S., F. Bray, J. Lortet-Tieulent, M. Goodman, and
A. Jemal. 2013. International variations in bladder cancer
incidence and mortality. Eur. Urol. 66:59–73.
2. American Cancer Society. 2012. Cancer facts and figures
2012. American Cancer Society, Atlanta.
3. Salem, H. K., and S. Mahfouz. 2012. Changing patterns
(age, incidence, and pathologic types) of
schistosoma-associated bladder cancer in Egypt in the past
decade. Urology 79:379–383.
4. Kiriluk, K. J., S. M. Prasad, A. R. Patel, G. D. Steinberg,
and N. D. Smith. 2012. Bladder cancer risk from
occupational and environmental exposures. Urol. Oncol.
30:199–211.
5. World Cancer Research Fund/American Institute for
Cancer Research. 2007. Food, nutrition, physical activity,
and the prevention of cancer: a global perspective. AICR,
Washington, DC.
6. Park, S. Y., N. J. Ollberding, C. G. Woolcott, L. R.
Wilkens, B. E. Henderson, and L. N. Kolonel. 2013. Fruit
and vegetable intakes are associated with lower risk of
bladder cancer among women in the Multiethnic Cohort
Study. J. Nutr. 143:1283–1292.
7. Ros, M. M., H. B. Bueno-de-Mesquita, E. Kampman,
F. L. Buchner, K. K. Aben, L. Egevad, et al. 2012. Fruit
and vegetable consumption and risk of aggressive and
non-aggressive urothelial cell carcinomas in the European
Prospective Investigation into Cancer and Nutrition. Eur.
J. Cancer 48:3267–3277.
8. George, S. M., Y. Park, M. F. Leitzmann, N. D. Freedman,
E. C. Dowling, J. Reedy, et al. 2009. Fruit and vegetable
intake and risk of cancer: a prospective cohort study. Am.
J. Clin. Nutr. 89:347–353.
9. Larsson, S. C., S. O. Andersson, J. E. Johansson, and A.
Wolk. 2008. Fruit and vegetable consumption and risk of
bladder cancer: a prospective cohort study. Cancer
Epidemiol. Biomarkers Prev. 17:2519–2522.
10. Iso, H., and Y. Kubota. 2007. Nutrition and disease in
the Japan Collaborative Cohort Study for Evaluation of
Cancer (JACC). Asian Pac. J. Cancer Prev. 8
(Suppl.):35–80.
11. Li, W. Q., S. Kuriyama, Q. Li, M. Nagai, A. Hozawa,
Y. Nishino, et al. 2010. Citrus consumption and cancer
incidence: the Ohsaki cohort study. Int. J. Cancer
127:1913–1922.
12. DerSimonian, R., and N. Laird. 1986. Meta-analysis in
clinical trials. Control. Clin. Trials 7:177–188.
13. Hamling, J., P. Lee, R. Weitkunat, and M. Ambuhl. 2008.
Facilitating meta-analyses by deriving relative effect and
precision estimates for alternative comparisons from a set
of estimates presented by exposure level or disease
category. Stat. Med. 27:954–970.
14. Orsini, N., R. Bellocco, and S. Greenland. 2006.
Generalized least squares for trend estimation of
summarized dose-response data. Stata J. 6:40–57.
15. Riboli, E., and T. Norat. 2003. Epidemiologic evidence of
the protective effect of fruit and vegetables on cancer risk.
Am. J. Clin. Nutr. 78(Suppl. 3):559S–569S.
ª 2014 The Authors. Cancer Medicine published by John Wiley & Sons Ltd. 145
A. R. Vieira et al. Fruits, Vegetables, and Bladder Cancer Risk
16. White, I. R. 2009. Multivariate random-effects
meta-analysis. Stata J. 9:40–56.
17. Orsini, N., and S. Greenland. 2011. A procedure to
tabulate and plot results after flexible modeling of a
quantitative covariate. Stata J. 11:1–29.
18. Sakauchi, F., M. Mori, M. Washio, Y. Watanabe, K. Ozasa,
K. Hayashi, et al. 2004. Dietary habits and risk of
urothelial cancer death in a large-scale cohort study (JACC
Study) in Japan. Nutr. Cancer 50:33–39.
19. Holick, C. N., I. De Vivo, D. Feskanich, E. Giovannucci,
M. Stampfer, and D. S. Michaud. 2005. Intake of fruits
and vegetables, carotenoids, folate, and vitamins A, C, E
and risk of bladder cancer among women (United States).
Cancer Causes Control 16:1135–1145.
20. Michaud, D. S., D. Spiegelman, S. K. Clinton, E. B. Rimm,
W. C. Willett, and E. L. Giovannucci. 1999. Fruit and
vegetable intake and incidence of bladder cancer in a male
prospective cohort. J. Natl. Cancer Inst. 91:605–613.
21. Michaud, D. S., T. J. Hartman, P. R. Taylor, P. Pietinen,
G. Alfthan, J. Virtamo, et al. 2002. No association between
toenail selenium levels and bladder cancer risk. Cancer
Epidemiol. Biomarkers Prev. 11:1505–1506.
22. Zeegers, M. P., R. A. Goldbohm, and P. A. van den
Brandt. 2001. Consumption of vegetables and fruits and
urothelial cancer incidence: a prospective study. Cancer
Epidemiol. Biomarkers Prev. 10:1121–1128.
23. Nagano, J., S. Kono, D. L. Preston, H. Moriwaki, G. B.
Sharp, K. Koyama, et al. 2000. Bladder-cancer incidence in
relation to vegetable and fruit consumption: a prospective
study of atomic-bomb survivors. Int. J. Cancer 86:132–
138.
24. Chyou, P. H., A. M. Nomura, and G. N. Stemmermann.
1993. A prospective study of diet, smoking, and lower
urinary tract cancer. Ann. Epidemiol. 3:211–216.
25. Shibata, A., A. Paganini-Hill, R. K. Ross, and B. E.
Henderson. 1992. Intake of vegetables, fruits,
beta-carotene, vitamin C and vitamin supplements and
cancer incidence among the elderly: a prospective study.
Br. J. Cancer 66:673–679.
26. Steineck, G., S. E. Norell, and M. Feychting. 1988. Diet,
tobacco and urothelial cancer. A 14-year follow-up of
16,477 subjects. Acta Oncol. 27:323–327.
27. Michaud, D. S., P. Pietinen, P. R. Taylor, M. Virtanen, J.
Virtamo, and D. Albanes. 2002. Intakes of fruits and
vegetables, carotenoids and vitamins A, E, C in relation to
the risk of bladder cancer in the ATBC cohort study. Br. J.
Cancer 87:960–965.
28. Roswall, N., A. Olsen, J. Christensen, L. O. Dragsted, K.
Overvad, and A. Tjonneland. 2009. Micronutrient intake
and risk of urothelial carcinoma in a prospective Danish
cohort. Eur. Urol. 56:764–770.
29. Michaud, D. S., D. Spiegelman, S. K. Clinton, E. B. Rimm,
W. C. Willett, and E. Giovannucci. 2000. Prospective study
of dietary supplements, macronutrients, micronutrients,
and risk of bladder cancer in US men. Am. J. Epidemiol.
152:1145–1153.
30. Ros, M. M., H. B. Bueno-de-Mesquita, E. Kampman, K.
K. Aben, F. L. Buchner, E. H. Jansen, et al. 2012. Plasma
carotenoids and vitamin C concentrations and risk of
urothelial cell carcinoma in the European Prospective
Investigation into Cancer and Nutrition. Am. J. Clin.
Nutr. 96:902–910.
31. Steinmaus, C. M., S. Nunez, and A. H. Smith. 2000. Diet
and bladder cancer: a meta-analysis of six dietary variables.
Am. J. Epidemiol. 151:693–702.
32. Liang, S., G. Lv, W. Chen, J. Jiang, and J. Wang. 2014.
Citrus fruit intake and bladder cancer risk: a meta-analysis
of observational studies. Int. J. Food Sci. Nutr. 16:1–6.
33. Buchner, F. L., H. B. Bueno-de-Mesquita, M. M. Ros, E.
Kampman, L. Egevad, K. Overvad, et al. 2009.
Consumption of vegetables and fruit and the risk of
bladder cancer in the European Prospective Investigation
into Cancer and Nutrition. Int. J. Cancer 125:2643–2651.
34. Yanbaeva, D. G., M. A. Dentener, E. C. Creutzberg, G.
Wesseling, and E. F. Wouters. 2007. Systemic effects of
smoking. Chest 131:1557–1566.
35. Freedman, N. D., D. T. Silverman, A. R. Hollenbeck, A.
Schatzkin, and C. C. Abnet. 2011. Association between
smoking and risk of bladder cancer among men and
women. JAMA 306:737–745.
36. Letasiova, S., A. Medve’ova, A. Sovcikova, M. Dusinska,
K. Volkovova, C. Mosoiu, et al. 2012. Bladder cancer, a
review of the environmental risk factors. Environ. Health
11(Suppl. 1):S11.
37. Helzlsouer, K. J., G. W. Comstock, and J. S. Morris. 1989.
Selenium, lycopene, alpha-tocopherol, beta-carotene, retinol,
and subsequent bladder cancer. Cancer Res. 49:6144–6148.
38. Hung, R. J., Z. F. Zhang, J. Y. Rao, A. Pantuck, V. E.
Reuter, D. Heber, et al. 2006. Protective effects of plasma
carotenoids on the risk of bladder cancer. J. Urol.
176:1192–1197.
39. Nomura, A. M., J. Lee, G. N. Stemmermann, and A. A.
Franke. 2003. Serum vitamins and the subsequent risk of
bladder cancer. J. Urol. 170(4 Pt 1):1146–1150.
Supporting Information
Additional Supporting Information may be found in the
online version of this article:
Table S1. Table of study characteristics.
Figure S1. Funnel plot of fruit and vegetables and bladder
cancer.
Figure S2. Funnel plot of vegetables and bladder cancer.
Figure S3. Highest compared to lowest analysis of leafy
vegetables and bladder cancer risk.
Figure S4. Dose–response meta-analysis of leafy vegeta-
bles and bladder cancer risk.
146 ª 2014 The Authors. Cancer Medicine published by John Wiley & Sons Ltd.
Fruits, Vegetables, and Bladder Cancer Risk A. R. Vieira et al.