Embed Size (px)
Citation preview

109
Fruits and vegetables is one of the most important and fast growing sub-sectors of the food processing
sector, as fruits and vegetables form an indispensable part of healthy diet. China, India, Brazil, USA,
Italy, Spain, Mexico, Iran the Philippines and France are the top ten aggregate fruit producers in the
world.
Asia dominates the world vegetables scene accounting for nearly 60% of global production, with
China and India ranking as 1st and 2nd. European Union and U.S.A follow next. Over the last quarter
of a century (1980-2004), the fruit and vegetable market has been one of the fastest growing of all
agricultural markets.
Global fruit and vegetables consumption increased by an average of 4.5% per annum between 1999
and 2009. This was higher than the world population growth rate, meaning that the global per capita
consumption of fruit and vegetables has also increased.
IntroductionIntroductionIntroductionIntroduction

110
The list of large exporters of fresh fruits and vegetables starts with the USA. Mexico is 2nd, having
overtaken EU in the past decade. Other big exporters are China, Chile, Ecuador and South Africa. In
total, the top 10 exporters account for 66% of the world's fresh fruits and vegetables exports. On the
import side, the EU is the world's largest importer. The US follows closely behind, while other
countries, like Canada, Japan and China have significantly smaller imports. The top 2 importers (EU
and USA) take in 50%.
Fruit and vegetable products (both fresh and processed) accounted for 22% of total agricultural
exports from developing countries. Fruit trade is heavily concentrated in Bananas, Citrus, Grapes and
Apples. Fresh produce comprising citrus, pears, peaches, nectarines, plums and kiwi fruit, and
processed produce comprising tomato based products, fruit juices and concentrates, packed
vegetables as well as tinned and frozen fruits are mostly certified under Protected Geographical
Indication status.
India is the second largest producer of fruits and vegetables in the world, accounting for about 16% of
global vegetable production and 10% of world fruit production. India’s production of fruits and
vegetables, currently, stands at 64 million tonnes and 126 million tonnes, respectively, making up for
around 12% and 14% of world production, in the respective sector. India is a front runner in many
fruits and vegetables with share in world production as follows:
» 41% of mango
» 23% of banana
» 24 % of cashew nut
» 10% of onion
» 30% of cauliflower
» 36% of green peas
Although India’s share in world exports of fruits and vegetables are less than 1.5%, India’s exports of
fruits and vegetables have grown at a CAGR of 20.61% and 7.21% respectively by value between 2004
and 2007. Over 90% of India’s exports in fresh fruits and vegetables mainly go to west Asia and East
European markets. With respect to export value, mango is the main fruit crop, and among vegetables,
onion occupies the first position. In the recent years, potatoes and green vegetables like okra, bitter
gourd, and green chillies are also showing good export potential. Commodity-wise analysis reveals
majority of India’s fruits and vegetables are exported to neighbouring countries followed by Middle
East region.

111
Bangladesh is one of the major trading partners for India for exports of fresh fruits, and onions and
potatoes. However, in the recent years, fruits from India such as grapes, mangoes, and vegetables,
such as eggplant are increasingly gaining market share in the UK, the Netherlands, France and
Germany. India is the fruit and vegetable basket of the world. India produces 54% of world’s mango,
23% banana, 24% cashew nuts, 36% green peas and 10% onion production.
Andhra Pradesh is a major fruit and vegetable producing States of India. A variety of tropical and sub-
tropical fruits and vegetables are grown in the state. The state occupies a distinct place in the national
scenario in respect of some fruits and vegetables as indicated in table.
Production of Major Fruits and Vegetables in Andhra Pradesh [Area: Ha Production: MT]

112
There are 157 fruit and vegetable processing units in the state mainly in the small and medium sector.
Fruit processing activity is largely concentrated in Chittoor district. There are 67 processing units with
an aggregate installed capacity to produce about 2 lakh tonnes of mango and other fruit pulps.
Contract manufacturing for leading exporters and food retail majors is most common. Own account
production is low. 90% of the production by these units is exported in the form of canned pulp or
aseptic concentrate. The remainder finds way to domestic markets in the form of RTS fruit juices and
nectars, jams and jellies and de-hydrated fruit bits.
This report identifies the trade potential and markets for few prominent fruits and vegetables
produced in the state including tomatoes, onion, cabbage, green chilly, mangoes and processed
mangoes (mango sliced dried, mango squash), fresh grapes and raisins and banana.

113
Tomato is one of the largest producing vegetables in the state of Andhra Pradesh amounting to 26.89
% of total vegetable production in 2003-04 to 36.58% in 2006-07. Districts with highest tomato
producing capacity are Prakasam & Vishakhapatnam in coastal region, Karnool & Chittoor region in
Rayalaseema Region; Adilabad & Ranga Reddy in Telangana Region. (Details in the Annexure)
Region-wise Area and Production of Tomato in Andhra Pradesh
(2002-2003 to 2006-2007)
(Area in Hect. & Production in M.Ts.)
2002-03 2003-04 2004-05 2005-06 2006-07 Areas in AP
A P A P A P A P A P
Coastal Area 9833 98330 10335 124020 8686 156348 7583 144077 23306 442814
Rayalaseema Region 44106 441060 39835 478020 38652 695736 33922 644518 26475 503025
Andhra Region 53939 539390 50170 602040 47338 852084 41505 788595 49781 945839
Telangana Region 25500 255000 26904 322848 22164 398952 42782 812858 31288 594472
Andhra Pradesh 79439 794390 77074 924888 69502 1251036 84287 1601453 81069 1540311
However, this high production potential is not reflected in the exports of tomato from the region and
therefore this section will help the tomato exporters from the state to identify the right market for the
exports of tomato.
Trend Analysis for Tomatoes, fresh or chilled (070200)
Table 1 Trend in exports for 070200
2003 2004 2005 2006 2007 2008 CAGR
1473.29 1298.66 2462.526 7522.806 20322.6 35885.69 89.37
The CAGR from the year 2003 to 2008 is 89.37. The overall trend shows a high positive growth rate
during that period. Another trend which can be noticed from the above table is that exports are
growing positively where they have slightly decreased. The CAGR shows that the exports are steadily
increasing.
Tomatoes, fresh or chilled [070200]Tomatoes, fresh or chilled [070200]Tomatoes, fresh or chilled [070200]Tomatoes, fresh or chilled [070200]

114
Figure 1 India’s export to the world
It can be seen from the above graph that India’s export of Tomatoes has been continuously increasing
apart from the year 2004. The growth has been tremendous from 1473.29 US $ mn to 35885 in 2008.
Revealed Comparative Advantage of Tomato
Source: Author’s calculations
India’s export World Export
Year Tomatoes Total Agriculture Tomatoes Total Agriculture RCA
2003 1473.291 324572.077 4293237.753 26636644.7 0.028
2004 1298.66 360681.075 4491324.398 30187384.07 0.024
2005 2462.526 570050.192 5035453.114 32293223.39 0.027
2006 7522.806 622347.956 5637266.856 37184264.96 0.079
2007 20322.595 632880.057 6635987.795 42953816.81 0.202
2008 35885.689 683739.685 5647001.264 40211871.08 0.373

115
Figure 2: RCA for 070200
The RCA values have been quite low starting from .028 in the year 2003 and increasing to .373 in the
year 2008. This shows that India’s strength vis-a-vis world is quite weak.
Major Export Destinations for Tomatoes from the region as per the past trends are Pakistan, United
Arab Emirates, Bangladesh & Maldives.
Importing
Country 2003 2004 2005 2006 2007 2008 Growth
Bangladesh 2.37 0.91 1.18 0.64 0.9 2.41 0.42
Maldives 0.02 0.07 0.02 0.02 0.07 0.09 45.65
Pakistan 0.02 1.55 3.74 31
UAE 0.01 0.01 0.01 0.12 2.47 4.22 353.24
The market fluctuations for these markets are as follows:
2003 2004 2005 2006 2007 2008
Bangladesh Bangladesh Pakistan Pakistan Pakistan Pakistan
Nepal Nepal Bangladesh
United Arab
Emirates
United Arab
Emirates
United Arab
Emirates
Maldives Pakistan
United Arab
Emirates Bangladesh Bangladesh Bangladesh
United
States Maldives Nepal Nepal Nepal Nepal
Italy Japan Maldives Singapore Maldives Maldives

116
From the above we see that Bangladesh which was the best market in 2003 & 2004 had suddenly
declined in subsequent years and had been overpowered by Pakistan and UAE by 2008. Pakistan has
been the topmost market throughout last five years. USA and Japan which are the most desirable
market by the exporters have been unreachable after 2003 and 2004 respectively due to high pesticide
content present in the tomato produced in the region. The details of these SPS issues has been handled
in report II of the project.
Trade Intensity Index for Major export Markets of Tomato
We see that India’s TII with Pakistan has been pretty good at an average around 3 but has reduced to
2.94 in 2008 from a high of 4.62 in 2004. With UAE the TII has been pretty low but has increased
considerably to 0.34 in 2008. With Bangladesh TII has been good at an average of around 2. Maldives
also commands a good TII but has reduced from 4.93 to 2.34 in 2008.

117
Trade Intensity Index of Other Competing Suppliers to identified target Countries
Pakistan TII
India 2.94
UAE 0.02
UAE TII
Jordan 5.52
European Union 0.78
Netherlands 0.82
Ethiopia(excludes Eritrea) 0.59
India 0.35
Bangladesh TII
India 1.93
Thailand 0.45
United Arab Emirates 2.86
Maldives TII
India 3.21
United Arab Emirates 1.07
Sri Lanka 0.16
Lower TII than India Higher TII than India hence the competitor.
⇒ Analyzing the TII of the competitors in the target markets; we see that in Pakistan; UAE is the only
other supplier but India with a TII value difference of 2.92 is in a much comfortable position.
⇒ UAE is the toughest market with tough competition from Jordan, European Union, Netherlands &
Ethiopia since TII values for these markets are higher with UAR as compared to India.
⇒ UAE is also a competitor for India in Bangladesh
⇒ Maldives is a good market to target for tomato exports from the state since India is much better off
that UAE and Srilanka.

118
RELATIVE COMPETITIVE ADVANTAGE
Pakistan Rel. CA
India 1.012
Competitors
UAE 0.005
UAE Rel. CA
India 0.19
Competitors
Jordan 3.03
European Union 0.43
Netherlands 0.44
Ethiopia(excludes Eritrea) 0.32
Bangladesh Rel. CA
India 1.01
Competitors
Thailand 0.23
United Arab Emirates 1.48
Maldives Rel. CA
India 2.37
Competitors
United Arab Emirates 0.79
Sri Lanka 0.12
Relative competitive position for India is better off Tough competition for India
⇒ In Pakistan India has the highest RCE
⇒ In UAE Jordan has the highest RCE
⇒ In Bangladesh UAE has the highest RCE
⇒ In Maldives India has the highest RCE

119
Tariff and Non Tariff barriers for Tomato in Identified Markets
Other Tariff where ever
applicable
Major Markets
Import
tariff
Tariff
description Tariff rate
NTM %
NTM
Customs Duty 35%
Product Characteristics
requirement to protect humans Pakistan
0%
Sales Tax 15%
100%
Labeling requirement to protect
human health
U AE 0% - - 0% none
Maldives 15% - - 0% none
Statutory Rate 100%
Infrastructural
Surcharge 2.5%
VAT 15%
0%
Bangladesh
37.5%
Income Tax on
Imports
0.%
0%
none
The analysis of the table above gives a mixed result. In market where MFN import duties are low like
in case of Pakistan, the non tariff barriers in terms of labeling requirements and human health
requirements are very high and in Markets like Maldives where there are no non tariff barriers, the
MFN duty is high. There is a high Tariff Rate of 35 % in Pakistan and Sales Tax of 15 %. UAE is free of
any Tariffs. Bangladesh involves a variety of tariffs like Infrastructural Surcharge, VAT, Income tax on
Exports, MFN etc. In this scenario, UAE seems to be the best combination where the import duty is 0%
and no non tariff barriers exist. Maldives in the next best option since there is no barrier and the
import duty is relatively lower than other markets.
Presence of Special Safeguard Duty
Country Volume Trigger Price Trigger
Pakistan NO NO
United Arab Amirates NO NO
Bangladesh NO NO
Maldives NO NO
NO NO
There is no special Safeguards duty present in Any Market

120
Tariff Rate Quota Structure of 070200 in major export destinations
Markets
TRQ Quantity (METRIC
TONS)
In quota -
Duty
Out Quota -
Duty
Pakistan No No No
United Arab
Amirates No No No
Bangladesh No No No
Maldives No No No
No No No
Subsidy provided to Tomatoes in Identified markets
Markets Product Specific Non Product Specific Green Box S & D * Currency
Pakistan 3.66 yes none none
UAE none none yes 90,00,000 US$ million
Bangladesh none 40.18 none none (billion Rp)
Maldives none none none 2335.02 RM million
*Special and Differential Treatment – "Development Programs"
Above are the various subsidies available in each market.
Comparative Analysis across Major Export Destinations for Tomatoes
Other Tariff where ever
applicable
NTM
%
NTM Markets Grow
th
Mkt
fluctuatio
n
TII
(Ind versus
competitors)
Import
tariff
Tariff
description Tariff rate
Customs Duty 35%
Product
Characteristics
requirement to
protect humans Pakistan
- Topmost Very good
0% Sales Tax 15%
100%
Labeling
requirement to
protect human
health
UAE 353.2
4
Rising Jordan and
EU 0% - - - -
Bangladesh 0.42 Declining UAE
15% - - - -
Statutory Rate 100%
Infrastructural
Surcharge 2.5%
VAT 15%
Maldives
45.65 Declining Very good
37.5%
Income Tax on
Imports
0.%
- -

121
Trade Intensity Index for Tomatoes across various markets
Markets 2003 2004 2005 2006 2007 2008
Pakistan 0.00 4.62 4.8 6.0 3.56 2.94
UAE 0.00 0.00 0.02 0.24 0.45 0.34
Bangladesh 2.00 1.8 1.5 2.2 3.1 1.9
Maldives 4.2 5.8 6.1 7.0 5.0 2.34
Conclusions
⇒ The exports are growing at a CAGR of 89.37% which is a healthy figure.
⇒ RCA is generally increasing which is a positive sign. Although state of AP needs to
develop an export strategy to improve its competitiveness since the RCA value is very
poor.
⇒ Market Analysis in descending order of priority
Growth Mkt
fluctuation TII with India TII
(Ind versus
competitors)
Tariffs Non Tariffs
(%)
Subsidy
UAE Pakistan Pakistan Maldives
UAE UAE
Bangladesh
Maldives
Pakistan
Maldives UAE
UAE Pakistan
Bangladesh Pakistan Bangladesh
Bangladesh Bangladesh Maldives Bangladesh Pakistan Maldives
Pakistan Maldives Bangladesh UAE Maldives
UAE
A comparative analysis across identified markets highlights the fact that, considering various
parameters, Pakistan stands number one in terms of growth, strength in bilateral trade with India for
indicating high acceptance for Indian tomatoes, less competition and no subsidy. If only Andhra
Pradesh tomato growers and exporters can tackle the non tariff barrier of labeling requirements in
Pakistan, this market is most suggestive. Next best market is UAE, except for the competition from
Jordan and EU.

122
TOMATO PRODUCTION IN ANDHRA PRADESH
Region/District-wise Area and Production of Tomato in Andhra Pradesh
(2002-2003 to 2006-2007)
(Area in Hect. & Production in M.Ts.)
2002-03 2003-04 2004-05 2005-06 2006-07 District
A P A P A P A P A P
Srikakulam 345 3450 526 6312 348 6264 435 8265 348 6612
Vijaya Nagaram 605 6050 643 7716 670 12060 670 12730 585 11115
Vishakhapatnam 1294 12940 1461 17532 1515 27270 2608 49552 2408 45752
East Godavari 681 6810 1423 17076 980 17640 893 16967 962 18278
West Godavari 317 3170 681 8172 196 3528 430 8170 458 8702
Krishna 1322 13220 1004 12048 536 9648 1684 31996 1707 32433
Guntur 1067 10670 315 3780 874 15732 718 13642 778 14782
Prakasam 4048 40480 4238 50856 3526 63468 0 0 16000 304000
Nellore 154 1540 44 528 41 738 145 2755 60 1140
Coastal Area 9833 98330 10335 124020 8686 156348 7583 144077 23306 442814
Chittoor 16838 168380 13296 159552 14588 262584 14678 278882 13529 257051
Cuddapa 2443 24430 2606 31272 4378 78804 4288 81472 1264 24016
Anatapuram 3356 33560 3295 39540 0 0 3906 74214 632 12008
Karnool 21469 214690 20638 247656 19686 354348 11050 209950 11050 209950
Rayalaseema Region 44106 441060 39835 478020 38652 695736 33922 644518 26475 503025
Andhra Region 53939 539390 50170 602040 47338 852084 41505 788595 49781 945839
Mehaboob Nagar 5518 55180 4942 59304 3217 57906 3650 69350 3500 66500
Ranga Reddy 10468 104680 12155 145860 2864 51552 6990 132810 6877 130663
Hyderabad 0 0 0 0 0 0 0 0 0 0
Medak 2207 22070 2474 29688 3722 66996 4081 77539 3790 72010
Nizamabad 1065 10650 2331 27972 1316 23688 2469 46911 2469 46911
Adilabad 1851 18510 1347 16164 7962 143316 21905 416195 11231 213389
Karim Nagar 813 8130 1100 13200 740 13320 1831 34789 1280 24320
Warangal 1688 16880 1085 13020 408 7344 175 3325 432 8208
Khamam 823 8230 647 7764 1375 24750 1381 26239 1400 26600
Nalgonda 1067 10670 823 9876 560 10080 300 5700 309 5871
Telangana Region 25500 255000 26904 322848 22164 398952 42782 812858 31288 594472
Andhra Pradesh 79439 794390 77074 924888 69502 1251036 84287 1601453 81069 1540311

123
The onion is one of the oldest vegetables known to mankind and is used in an array of recipes and
preparations. However, it’s rarely eaten on its own and is usually an accompaniment to the main
course. Depending on the variety, an onion can be tangy and pungent or mild and sweet. World onion
production is estimated at approximately 105 billion pounds each year. The average annual onion
consumption is approximately 13.67 pounds of onions per person across the world. Libya has the
highest consumption of onions with an astounding average per capita consumption of 66.8 pounds. At
least 175 countries grow onions. According to the United Nations Food and Agriculture Organization,
there are an estimated 6.7 million acres of land under onion cultivation in the world, producing 105
billion pounds of onions each year. Approximately 8 percent of this global onion production is traded
internationally. Leading onion production countries are China, India, United States, Turkey and
Pakistan, as can be seen from Table below.
Although onions are consumed in all the countries of the world, they are cultivated only in some
countries. Area under onion cultivation in the world is about 20 lakh hectares. India has the largest
area of about 4 lakh hectares (20 per cent) followed by China at about 3 lakh hectares.
Onions and shallots, fresh or chilled [070310]Onions and shallots, fresh or chilled [070310]Onions and shallots, fresh or chilled [070310]Onions and shallots, fresh or chilled [070310]

124
But the production is the highest in China (48 lakh MT) as against India (44 lakh MT) due to higher
productivity in China (16 MT/ha compared to India’s 14 MT/ha).
Onion production in India
Onion, a major ingredient in Indian food, and a politically-sensitive commodity, is typically cultivated
thrice a year; in monsoon, winter and summer. The onion harvested during October-December is
Kharif crop, during January-March is Rangada crop, and in April-May is called Rabi or Unhal Crop.
All three crops are available for export, with Rabi having the longer shelf life.
In India, of the four lakh hectares of area under onion, the maximum area of about 95,000 hectares
(about 24 per cent) is in Maharashtra. Andhra Pradesh is next important onion producing state facing
domestic competition with rich quality of onions from Karnataka, Orissa, U.P., Rajasthan, M.P., Tamil
Nadu, Bihar and Gujarat.
2 Source: Agricultural Statistics, Indian Horticulture Database, National Horticulture Board, Gurgaon, India 007-08 2006-07
Small onions, known as rose onion, and Krishnapuram onions are grown in Kolar district in
Karnataka and Cudappah district in Andhra Pradesh. Multiplier onion, known as Podisu and Shallots,
are grown in Tamil Nadu, Pondicherry and Andhra Pradesh.

125
District-wise breakup of production of Onion in AP is given in the table below indicating the rise in
the production levels for last five years indicating the importance of onions for the state. This section
handles the market identification for onion export from the state.
District-wise Area and Production of Onion in Andhra Pradesh
(Area in Hect. & Production in M.Ts.)
2004-05 2005-06 2006-07 2007-08 2008-09 District
A P A P A P A P A P
Coastal Area 5163 80078 3179 47685 4288 68608 4849 82433 4825 82025
Rayalaseema
Region 17825 276466 15410 231150 17097 273552 20439 347463 19167 325839
Andhra Region 22988 356544 18589 278835 21385 342160 25288 429896 23992 407864
Telangana
Region 12314 190990 10460 156900 14029 224464 12923 219691 9772 166124
Andhra Pradesh 35302 547534 29049 435735 35414 566624 38211 649587 33764 573988
Export of Onions from India
India’s onion exports have made a gradual growth during the last four-and-a-half decades. Onion is
the pride of India’s agricultural exports and earns valuable foreign exchange for the country. Of the
total fresh vegetable exports, the share of onion is 67 per cent. Onion has now become a cash crop,
which is in demand in export markets as well as in India throughout the year.
2003 2004 2005 2006 2007 2008 CAGR
119.09 231.07 409.22 476.33 293.61 678.96 41.64
The CAGR from the year 2003 to 2008 is 41.64. The overall trend shows a high positive growth rate
during that period. The exports have been consistently increasing apart from 2007 where they fell to
293.61 US $ mn.

126
Figure 3 India’s export to the world
It can be seen from the above graph that India’s exports have been continuously increasing apart from
the year 2007. The growth has been tremendous from 119 US $ mn to 678.96 in 2008.
Revealed Comparative Advantage of Onion
Revealed Comparative Advantage for Indian Onion
India’s Export World's Export
Onion Total agriculture Onion Total agriculture RCA
2003 119.09 296871.65 231566.05 26636644.7 0.046
2004 231.07 364224.70 223174.66 30187384.07 0.085
2005 409.22 537491.59 241927.78 32293223.39 0.101
2006 476.33 609294.18 287299.86 37184264.96 0.101
2007 293.61 632880.05 308438.48 42953816.81 0.064
2008 678.96 683739.68 330276.34 40211871.08 0.120

127
The RCA values have been quite low starting from .04 in the year 2003 and increasing to .12 in the year
2008. This shows that India’s strength vis-a-vis world is quite weak. The strength however has
increased from 2003 to 2008.
Major Export Destination
Onions grown in India are very much in demand in Gulf Countries and Singapore, Malaysia, Sri
Lanka and Bangladesh because of strong pungency. Small onions produced in Andhra Pradesh are
exported from Chennai port to Singapore and Malaysia, and multiplier onions to Singapore, Malaysia,
Sri Lanka etc. The other major export destinations are United Arab Emirates, Canada and Saudi
Arabia.
Importing
Country 2003 2004 2005 2006 2007 2008 Growth
Canada 0.04 0 0 0.01
Saudi Arabia 1.94 2.14 1.32 0.86 1.81 3.55 16.31
UAE 13.79 19.27 16.91 16.61 46.31 35.84 26.97
Market Fluctuations
2003 2004 2005 2006 2007 2008
Iran Iran Iran Iran Kenya UAE
Turkey Turkey Turkey Turkey Turkey Canada
Nigeria UAE Syrian Arab Republic Tanzania UAE Saudi Arabia
UAE Bahamas UAE UAE Uganda Qatar
Kuwait Bangladesh Malaysia Saudi Arabia Spain Bahamas
As we can see the constant markets for last five years have been Iran, UAE and Turkey. Some of the
markets which have recently emerged in last two years are Saudi Arabia, Uganda, Spain and Canada.
But an important observation is that Canada appears only in 2008.

128
INDIA’S TII with Identified Markets for Tomato
United Arab Emirates
Year TII
2003 0.44
2004 1.41
2005 2.15
2006 1.22
2007 1.42
2008 3.55
Canada
Year TII
2003 0
2004 0
2005 0
2006 0
2007 0.002
2008 0.224
Saudi Arabia
Year TII
2003 0.74
2004 0.36
2005 0
2006 0.042
2007 0.015
2008 6.87
As we can see India’s TII in UAE has been consistently increasing, in Canada it is quite low at .224
whereas it is extremely high in Saudi Arabia at 6.87.

129
COMPETETORS TII
Competitor's export to the Market World's Export to the market
UAE Onion Total Agriculture Onion
Total
Agriculture TII
India 410.593 84930.633 625.69 4543.883 0.035
Ethiopia 11.607 23443.105 625.69 4543.883 0.0035
Netherlands 135.569 34194.423 625.69 4543.883 0.028
In UAE each of the competitors has a very low TII
Competitor's export to the Market World's Export to the market
Canada Onion Total Agriculture Onion
Total
Agriculture TII
India 76.191 5585.445 12292.938 12292.938 0.013
United States 11730.297 2048281.608 12292.938 12292.938 0.006
EU 47.137 65022.766 12292.938 12292.938 0.0007
In Canada also every competitor has an extremely low TII
Competitor's export to the Market World's Export to the market
Saudi Arabia Onion Total Agriculture Onion Total Agriculture TII
India 67.72 18302.87 142.98 142.98 0.004
Netherlands 54.52 21907.71 142.98 142.98 0.002
Egypt, Arab 12.51 69642.47 142.98 142.98 0.0002
Again in Saudi Arabia each of the country has an extremely low TII.
TII values lower as compared with India
RELATIVE COMPETITIVE ADVANTAGE
United Arab Emirates India’s Export to the Market World's Export to the market
Onion Total Agriculture Onion Total Agriculture Rel. CA
India 410.593 84930.633 557.769 142568.161 1.23
Competitor's export to UAE World's Export to the market
Competitors Onion Total Agriculture Onion Total Agriculture Rel. CA
Ethiopia 11.607 23443.105 557.769 142568.161 0.12
Netherlands 135.569 34194.423 557.769 142568.161 1.02

130
Canada
India’s Export to the Market World's Export to the market
Onion Total Agriculture Onion Total Agriculture Rel. CA
India 76.19 5585.44 11853.62 2118889.81 2.43
Competitor's export to UAE World's Export to the market
Competitors Onion Total Agriculture Onion Total Agriculture Rel. CA
United States 11730.29 2048281.60 11853.62 2118889.81 1.02
European
Union 47.13 65022.76 11853.62 2118889.81 0.13
Saudi Arabia India’s Export to the Market World's Export to the market
Onion Total Agriculture Onion Total Agriculture Rel. CA
India 67.728 18302.879 134.756 109853.063 3.02
Competitor's export to UAE World's Export to the market
Competitors Onion Total Agriculture Onion Total Agriculture Rel. CA
Netherlands 54.522 21907.713 134.756 109853.063 2.02
Egypt, Arab 12.506 69642.471 134.756 109853.063 0.14
The Trade intensity index analysis substantiated by Relative Competitive Advantage analysis
indicates advantageous position of India vis a vis other competing suppliers in all the identified major
markets.
TARIFFS
Tariff and Non Tariff barriers for Onions in Identified Markets Major Markets Import tariff NTM % NTM
United Arab Emirates 0% 0%
Canada 0% 84.6% Authorization for Plant Health Protection
Saudi Arabia 12.0% 100%
Testing, Inspection and Quarantine
Requirements
Presence of Special Safeguard Duty
Country Volume Trigger Price Trigger
United Arab Emirates NO NO
Canada NO NO
Saudi Arabia NO NO
There is no special Safeguards duty present in Any Market

131
SUBSIDY
Subsidy on Onion in identified markets
Markets Product Specific Non Product Specific Green Box S&D Currency
UAE none none 34,00,000 90,00,000 US$ million
Canada none none US$ million
Saudi Arabia none none none none (billion Rp) Special and Differential Treatment – "Development Programs
Above are the various subsidies available in each market.
Tariff Rate Quota Structure
Tariff Rate Quota Structure of Onion in major export destinations
Markets TRQ Quantity (MT) In quota - Duty Out Quota - Duty
UAE No No No
Canada No No No
Saudi Arabia No No No
There is no Tariff Rate Quota present in any market.
Considering the fact that all the three markets are depicting positive growth in exports and have good
bilateral trade strength as compared with their competitors in the same market, absence of subsidies,
TRQs and special safeguard duty, three prospective markets for Onion export from the state of
Andhra Pradesh could be UAE, Canada and Saudi Arabia.
Strategies to boost Onion Export
Onion Village
The concept of developing the onion villages may help increase the export of onion. The provision of
financial assistance to exporters to complete in the international market may also be looked into.
Export on regular basis not only helps in getting foreign exchange earnings but also allows farmers to
get remunerative price for their produce thereby encouraging them to sustain the production and
availability of onions. Government should in fact have long term export policy and should even
introduce contract production system in suitable pockets.

132
Quality standards for export
The quality standards of onion have been fixed by Agmark although now it is not mandatory to obtain
Agmark certificate for onion export. It is necessary to maintain the quality by observing the standards.
The grades, big, medium, small and mixed are followed for different types of onions which depend on
requirements from importing country. It is observed that Middle East countries demand light red to
dark red colour, European countries and Japan demand yellowish /brown colour onions having mild
pungency, 3-4 cm sized onions are preferred in Bangladesh, 4-6 cm sized are preferred in Middle East
and Far East, while European and Japan prefer 6-7 cm sized onions. Rose onions of 2.5 - 3.5 cm size
and multiplier onions of bigger size with attractive red colour bulblets are preferred for export.
European countries and Japan prefer yellow big-sized onions. The demand in these countries is from
February and up to May and therefore Andhra Pradesh onion exporters should try to fulfill the
demand during this period like in case of onion growers from Nasik area of Maharashtra.
The bulbs selected for export should be reasonably uniform in shape , size, colour and pungency. They
should be mature ,solid, reasonably firm with tough clinging skin, thoroughly cured and dried outer
scales free from dirt and other foreign material. Defective, diseased, damaged bulbs caused by seed
stem, tops, roots, moisture, dry sunscald, sun burn, sprouting, mechanical or other injuries and
staining, free from moulds, soft rot and insect attack should not be used for export. The trained
labourer are thus required for grading and packing of onions for exports. The packing size for export
varies from 8 to 25 kg depending on requirement of onion by importing country. Although jute mesh
bags are used for export, if there is no restriction for their use due to environmental pollution
problems in some countries, plastic-wooven bags since are reusable and attractive, should be
introduced.
India is presently exporting onions to mainly Gulf countries, Far East countries, Bangladesh, and Sri
Lanka where there is not much scope to increase the quantity as some countries have also started their
own production. The scope, however, exists for diversifying the market to European countries and
Japan. These countries do not prefer strong and pungent onions. In these countries, yellow onions
having mild pungency, bigger bulb size with thick fleshy layers are preferred. Similarly, there is a
scope for exporting dehydrated onions as many processing units under export-oriented unit schemes
have been installed in India. These are not presently running to their installed capacity mainly for
want of raw material. Thus, there is a scope for development of varieties suitable for dehydration.

133
Constraints in onion export
There are some constraints seen in onion exports and suggestions to overcome these problems so that
onion export from the state of AP is not only continued but maybe increased :
Suggestions for improvement
• Popularization of improved varieties, quality seed production and distribution, expansion of
area in non- traditional pockets and contract production for export.
• Planning for contract production for export market expansion of area and production of kharif
onion for early harvesting.
• Unawareness of proper post harvest practices and quality. Training of farmers and others
involved in onion production, post-harvest management and marketing.
• Packing material used is not attractive. Introduction of attractive, eco-friendly packages,
consumer packages etc.
• Electrically-ventilated containers for export of yellow onions to Europe . Adequate transport
with reasonable rates, synchronize the rail/road transport with schedule of vessel and
providing insulated wagons.
• Developing more ventilated storage godowns for onions. Providing handling sheds and make
available modified containers with proper ventilation
• To develop market intelligence for different seasons, quality of produce and corresponding
season crop in other competing countries.
STRATEGY FOR INCREASING EXPORT
The strategies suggested to improve the export of onions are :
• Production and distribution of quality seed of improved varieties in adequate quantities by
following seed village concept.
• Development of disease and insect pests resistant, heat / moisture stress tolerant varieties by
taking such work at NRC for Onion and Garlic.
• Development of biological control measures against pests and disease by taking up work with
NRC for Onion and Garlic and NHRDF.
• Development of yellow coloured hybrid and OPs for export to European and Japanese
markets by popularizing the technology for production during late-kharif based on work
undertaken by NHRDF and adopting contract production.
• Development of bigger bulblet varieties in multiplier onion.
• Training of farmers, traders and exporters involved in onion production, handling and
marketing.
• Creation of adequate curing and storage facilities at field level and at ports.
Popularizing various onion products in export markets developing varieties suitable for various
processed products.

134
ONION PRODUCTION IN ANDHRA PRADESH
Region/District-wise Area and Production of Onion in Andhra Pradesh
(2002-2003 to 2006-2007)
(Area in Hect. & Production in M.Ts.)
2002-03 2003-04 2004-05 2005-06 2006-07
District Area
Produ-
ction Area
Produ-
ction Area
Produ-
ction Area
Produ-
ction Area
Produ-
ction
Srikakulam 1541 23901 1129 16935 1620 25920 1831 31127 1620 27540
Vijaya Nagaram 620 9616 395 5925 300 4800 300 5100 855 14535
Vishakhapatnam 540 8375 221 3315 445 7120 470 7990 450 7650
East Godavari 372 5770 303 4545 208 3328 370 6290 550 9350
West Godavari 1 16 0 0 4 64 0 0 0 0
Krishna 223 3459 92 1380 8 128 179 3043 0 0
Guntur 1576 24444 867 13005 843 13488 1699 28883 650 11050
Prakasam 211 3273 95 1425 0 0 0 0 700 11900
Nellore 79 1225 77 1155 860 13760 0 0 0 0
Coastal Area 5163 80078 3179 47685 4288 68608 4849 82433 4825 82025
Chittoor 671 10407 518 7770 601 9616 430 7310 509 8653
Cuddapa 3954 61327 2662 39930 3147 50352 3459 58803 2080 35360
Anatapuram 1545 23963 1381 20715 0 0 500 8500 528 8976
Karnool 11655 180769 10849 162735 13349 213584 16050 272850 16050 272850
Rayalaseema
Region 17825 276466 15410 231150 17097 273552 20439 347463 19167 325839
Andhra Region 22988 356544 18589 278835 21385 342160 25288 429896 23992 407864
Mehaboob
Nagar 3202 49663 2246 33690 3574 57184 3574 60758 2674 45458
Ranga Reddy 2618 40605 2224 33360 358 5728 862 14654 759 12903
Hyderabad 0 0 0 0 0 0 0 0 0 0
Medak 3454 53572 3551 53265 3500 56000 3522 59874 3522 59874
Nizamabad 1524 23637 1042 15630 1820 29120 355 6035 355 6035
Adilabad 599 9290 547 8205 3641 58256 3670 62390 1226 20842
Karim Nagar 688 10671 654 9810 720 11520 806 13702 806 13702
Warangal 213 3304 175 2625 274 4384 0 0 296 5032
Khamam 4 62 3 45 120 1920 134 2278 134 2278
Nalgonda 12 186 18 270 22 352 0 0 0 0
Telangana
Region 12314 190990 10460 156900 14029 224464 12923 219691 9772 166124
Andhra Pradesh 35302 547534 29049 435735 35414 566624 38211 649587 33764 573988

135
Trend Analysis for Salad beetroot, salsif, celeriac, radish & sim edible roots fresh or chilled
Table 2 Trend in exports for 070690
Code 2003 2004 2005 2006 2007 2008
CAGR
070690 117701.1 166504.5 152837 226423.8 263593.9 330584.6 22.94
The CAGR from the year 2003 to 2008 is 22.94. The overall trend shows a high positive growth rate
during that period. The exports have been consistently increasing apart from 2005 where they fell to
15283 US $ mn.
Figure 4 India’s export to the world
It can be seen from the above graph that India’s exports have been continuously increasing apart from
the year 2005. The growth has been tremendous from 117701 US $ mn to 330584.64 in 2008.
Radish [Radish [Radish [Radish [070690]070690]070690]070690]

136
Revealed Comparative Advantage of 070690
RCA for Radish
The RCA values have been quite low starting from .04 in the year 2003 and increasing to .12 in the year
2008. This shows that India’s strength vis-a-vis world is quite weak. The strength however has
increased from 2003 to 2008.
India’s export World export
Radish
Total
Agriculture Radish Total Agriculture RCA
2003 117701.12 296871.65 1271288.62 26636644.7 8.30
2004 166504.49 364224.70 1457308.74 30187384.07 9.46
2005 152836.96 537491.59 1450810.18 32293223.39 6.32
2006 226423.77 609294.18 1766911.72 37184264.96 7.82
2007 263593.91 632880.05 2198338.90 42953816.81 8.13
2008 330584.64 683739.68 2110591.91 40211871.08 9.21

137
Major Export Destination
Major Export Destinations are:
Pakistan
Bangladesh
Malaysia
United Arab Emirates
MARKET FLUCTUATIONS
2003 2004 2005 2006 2007 2008
Bangladesh Bangladesh Bangladesh Bangladesh Bangladesh Bangladesh
Malaysia Malaysia Malaysia Malaysia Malaysia Malaysia
Sri Lanka
United Arab
Emirates Sri Lanka
United Arab
Emirates
United Arab
Emirates
United Arab
Emirates
United Arab
Emirates Sri Lanka
United Arab
Emirates Sri Lanka Sri Lanka Sri Lanka
Nepal Bahamas, The Pakistan Pakistan Pakistan Philippines
INDIA’S TII
Bangladesh
Year
Market's Export
from India of 6
digit
Market's
Export from
India of 2 digit
Market's Export
from World 6
digit
Market's Export
from World 2
digit
TII
2003 42934.665 73682.946 42934.665 169098.842 2.29
2004 76359.206 111562.055 76359.206 203002.386 1.81
2005 61870.719 131809.635 61870.719 209632.394 1.59
2006 71719.077 123763.658 71719.077 262692.466 2.12
2007 88026.852 105162.724 88026.852 339348.18 3.22
2008 133666.527 137560.889 133666.527 265463.202 1.92
Malaysia
Year
Market's Export
from India of 6
digit
Market's
Export from
India of 2 digit
Market's Export
from World 6
digit
Market's Export
from World 2
digit
TII
2003 31546.457 33894.73 50110.925 191542.012 3.55
2004 31644.749 33596.562 55232.94 227554.997 3.88
2005 35465.906 43444.411 64986.826 266132.631 3.34
2006 54865.894 62071.292 81848.591 353317.254 3.81
2007 52359.406 54398.383 94874.985 389454.313 3.95
2008 67818.733 69328.153 91988.354 390391.838 4.15

138
United Arab Emirates
Year
Market's Export
from India of 6
digit
Market's
Export from
India of 2 digit
Market's Export
from World 6
digit
Market's Export
from World 2
digit
TII
2003 13033.242 27077.266 19070.617 172167.992 4.34
2004 21166.311 40922.252 26996.229 179877.944 3.44
2005 15630.118 41197.899 21518.415 257031.925 4.53
2006 34311.771 81988.955 38248.562 363027.674 3.97
2007 46846.066 91305.676 56276.237 426330.857 3.88
2008 39287.293 84930.633 44447.69 460260.239 4.79
Pakistan
Year
Market's Export
from India of 6
digit
Market's
Export from
India of 2 digit
Market's Export
from World 6
digit
Market's Export
from World 2
digit
TII
2003 779.987 52.317 58586.399 0
2004 1.72 2200.907 3.998 73272.47 14.32
2005 6351.49 28304.464 6568.336 139344.475 4.76
2006 16080.538 34635.066 19035.201 219060.309 5.34
2007 5611.22 53127.752 5701.565 186495.373 3.45
2008 4570.244 68818.789 4600.001 202686.982 2.92
COMPETITOR’S TII
Competitor's export to market World's Export to market
Bangladesh Radish Total Agri Radish Total Agri TII
India 133666.527 137560.889 133666.527 265463.202 1.92
Turkey 171.6 305.115 133666.527 265463.202 1.11
Thailand 0.089 499.413 133666.527 265463.202 0.0003
Malaysia Radish Total Agri Radish Total Agri TII
India 67818.733 69328.153 91988.354 390391.838 4.15
Netherlands 10443.261 11966.943 91988.354 390391.838 3.70
China 6740.486 231863.702 91988.354 390391.838 0.12
UAE Radish Total Agri Radish Total Agri TII
India 39287.293 84930.633 44447.69 460260.239 4.79
Pakistan 2482.421 6894.893 44447.69 460260.239 3.72
Egypt 908.335 23847.943 44447.69 460260.239 0.39
Pakistan Radish Total Agri Radish Total Agri TII
India 4570.244 68818.789 4600.001 202686.982 2.92
China 29.757 47682.79 4600.001 202686.982 0.027
India better off than other competing suppliers

139
RELATIVE COMPARATIVE ADVANTAGE
Bangladesh
Country’s export to market World's Export to market
Radish Total Agri Radish Total Agri RCE
India 133666.527 137560.889 133838.216 138365.417 1.004
Turkey 171.6 305.115 133838.216 138365.417 0.58
Thailand 0.089 499.413 133838.216 138365.417 0.00019
Malaysia
India 67818.733 69328.153 85002.48 313158.798 3.60
Netherlands 10443.261 11966.943 85002.48 313158.798 3.21
China 6740.486 231863.702 85002.48 313158.798 0.10
UAE
Country’s export to market World's Export to market
Radish Total Agri Radish Total Agri RCE
India 39287.293 84930.633 42678.049 115673.469 1.25
Pakistan 2482.421 6894.893 42678.049 115673.469 0.97
Egypt 908.335 23847.943 42678.049 115673.469 0.10
Pakistan
India 4570.244 68818.789 4600.001 116501.579 1.68
China 29.757 47682.79 4600.001 116501.579 0.015
Relative competitive advantage of India better off than these other suppliers in identified export
markets.
Tariff and Non Tariff barriers for Radish in Identified Markets
Other Tariff where ever
applicable Major
Markets
Import tariff
Tariff description
Tariff
rate
NTM
%
NTM
Statutory Rate 100%
Instructional
Surcharge 3% Bangladesh
25%
VAT 15%
0%
Malaysia 0% 100%
Testing, Inspection and Quarantine
Requirements
UAE 0% 0% 0% 0% -
Customs Duty 35%
Product Characteristics requirement
to protect humans
Pakistan
0%
Sales Tax
15%
100%
Labeling requirement to protect
human health

140
Presence of Special Safeguard Duty
Country Volume Trigger Price Trigger
Bangladesh NO NO
Malaysia NO NO
United Arab Emirates NO NO
Pakistan NO NO
Tariff Rate Quota Structure for Radish in major export destinations
Markets
TRQ Quantity (METRIC
TONS)
In quota -
Duty
Out Quota -
Duty
Bangladesh No No No
Malaysia No No No
UAE No No No
Pakistan No No No
SUBSIDIES
Markets Product Specific Non Product Specific Green Box S&D* Currency
Bangladesh Not Applicable 40.18 n/a n/a (billion Rp)
Malaysia n/a n/a 756 217 US$ million
United Arab Emirates n/a 34,00,000 90,00,000 US$ million
Pakistan 3.66 n/a n/a n/a * Special and Differential Treatment – Development Programs
Conclusion
Radish Exporters from Andhra Pradesh should majorly concentrate on finding the buyer in the order
of UAE first since the bilateral trade strength of UAE for Indian radish is much higher than that of
Malaysia and Pakistan. Also there is least competition in UAE from other suppliers and import duties
are also zero along with the absence of any type of non tariff barriers. Bangladesh on the other hand
has highest import duty levels along with other type of tariffs like Statutory Rate, Instructional
Surcharge and VAT. Malaysia has 100% SPS on all its 8 digit tariff lines along with ASEAN
preferential duty rates for other competing ASEAN countries and also special and differential
developmental subsidies due to which exporters from India/ AP would loose on the price
competitiveness.

141
Banana is one of the world’s most important food crops. In India, banana crop accounts for 2.8 per
cent of agricultural GDP. It is an important crop for subsistence farmers, and ensures year-round
security for food or income. Edible bananas are of two types—cooking bananas, known as plantations
which can be considered starchy vegetables, and the fruit bananas.
Developed countries are the destination for export of bananas. Around onefifth of globally produced
bananas are exported from the developing countries to the developed countries. Latin America and
Caribbean account for bulk of exports. Philippines is the only Asian country listed among top
exporters of banana in the world. Though India is the largest producer of bananas in the world with a
whopping 23 per cent share, the country’s international banana exports are negligible.
Although one-third of the total fruit production in India constitute banana, its share in the world
banana exports is negligible, largely due to wastage (around 40%), poor handling and lack of proper
post harvest management. However, for banana, besides as a fresh fruit export, potential also lies in
exports in processed forms, and as fibre. Some of the processed food products that are increasingly
gaining importance in the domestic as well as international markets are banana wafers, banana figs,
banana pulp, banana juice and banana flour/powder.
Banana wafers and dehydrated ripe banana, popularly known as banana figs manufactured in the
small and cottage scale sectors are quite prevalent and popular as snack food. Demand for banana
powder and pulp is also increasing. Banana powder and pulp is largely used in the baking and
confectionery, and baby food industries.
Maharashtra accounts for 25% of banana production in India, followed by Tamil Nadu (20%), Gujarat
(15%), Karnataka (10%) and Andhra Pradesh (10%).
Banana [070990]Banana [070990]Banana [070990]Banana [070990]

142
Trend in Exports
There has been an increasing trend in the exports of 070990 with a CAGR of 29% over the period 2003-
08. It can be seen that the growth has been really high 2005-06 region as the export figures zoomed
from US$18.59 to US$44.06 which is a growth of a phenomenal 137%.
Table 1
Trend in Exports for 070990 (US$ mn)
Code 2003 2004 2005 2006 2007 2008 CAGR
70990 13.39 15.61 18.59 44.06 46.90 48.43 29%
RCA
The increasing trend is not just in the absolute values of the exports in this product category. The RCA
values reveal the increasing comparative advantage of Indian exports vis-à-vis World exports in
070990.
Table 2
Comparative Advantage of Banana
Year India's exports India's total exports World's exports World's total exports RCA
2003 13.39 324.57 1687.95 26665.51 0.65
2004 15.61 360.68 1859.40 30182.20 0.70
2005 18.59 570.05 2113.45 32319.23 0.50
2006 44.06 622.35 2596.00 37185.49 1.01
2007 46.90 632.88 2868.64 42938.02 1.11
2008 48.43 683.74 2458.22 39926.02 1.15

143
Major Export Destinations for Banana from AP
The top five destination which can be considered for banana exports are as follows:
• United Arab Emirates
• United Kingdom
• Qatar
• Kuwait
• Saudi Arabia
Table 3
Major Export Destinations for 070990
Partner Name 2003 2004 2005 2006 2007 2008 CAGR
United Arab Emirates 2963.438 2773.834 5450.86 10746.321 12550.616 12805.15 34.00
United Kingdom 1994.664 3310.981 2575.985 11045.761 11926.872 8862.032 34.75
Qatar 523.341 528.076 779.656 2850.179 3408.55 4923.197 56.56
Kuwait 830.003 1328.983 1325.037 2453.903 3237.871 4805.445 42.08
Saudi Arabia 1663.925 1795.211 1966.984 5915.536 5116.197 4581.459 22.45
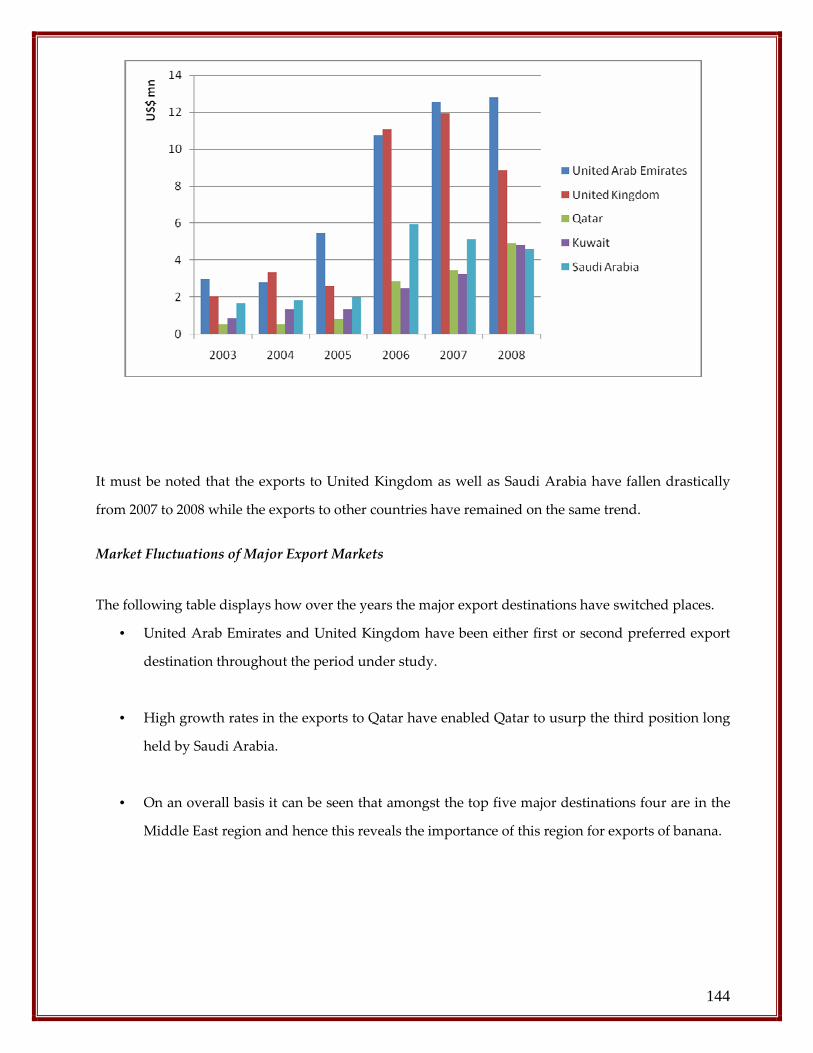
These are the top 5 destinations according to the export figures of 2008 with exports to UAE leading
the pack with US$12.8 mn followed by exports to United Kingdom at US$8.86 mn. However, it must
be noted that over five years the CAGR value stand highest for Qatar at 56.56% where the exports
have grown from US$0.52 mn to US$4.9 mn surpassing Kuwait and Saudi Arabia which have grown
at 42.08% and 22.45% respectively.
144
It must be noted that the exports to United Kingdom as well as Saudi Arabia have fallen drastically
from 2007 to 2008 while the exports to other countries have remained on the same trend.
Market Fluctuations of Major Export Markets
The following table displays how over the years the major export destinations have switched places.
• United Arab Emirates and United Kingdom have been either first or second preferred export
destination throughout the period under study.
• High growth rates in the exports to Qatar have enabled Qatar to usurp the third position long
held by Saudi Arabia.
• On an overall basis it can be seen that amongst the top five major destinations four are in the
Middle East region and hence this reveals the importance of this region for exports of banana.

145
Market Fluctuation
2003 2004 2005 2006 2007 2008
United Arab
Emirates
United
Kingdom
United Arab
Emirates
United
Kingdom
United Arab
Emirates
United Arab
Emirates
United
Kingdom
United Arab
Emirates
United
Kingdom
United Arab
Emirates
United
Kingdom
United
Kingdom
Saudi Arabia Saudi Arabia Saudi Arabia Saudi Arabia Saudi Arabia Qatar
Nepal Kuwait Bahrain Qatar Qatar Kuwait
Kuwait Nepal Kuwait Kuwait Kuwait Saudi Arabia
Trade Intensity Index for banana with respect to Major Export Markets
United Arab Emirates
The trade intensity index with UAE has been fairly stable over the years meeting an average of 1.3. As
can be seen from the figure below the trend has been fairly constant over the last few years.

146
United Kingdom
The trade intensity index with UK has been growing over the years touching a high of 4.19 in the year
2007 and 3.79 in 2008. As can be seen from the figure below the trend has been fairly increasing over
the last three years. Furthermore, if 2005 is regarded as an outlier year then the linear increase seems
to work out in this case.
Saudi Arabia
The trade intensity index with Saudi Arabia has been growing over the years touching a high of 5.80
in the year 2007 and 5.15 in 2008. This TII is highest amongst other market destinations. As can be seen
from the figure below the trend has been fairly increasing over the last few years.

147
Qatar
The trade intensity index with Qatar has been growing over the years with 2008 having a higher TII of
2.83 than 2007 which is contrary to the trends seen in other export destinations. As can be seen from
the figure below the trend has been fairly increasing over the last three years.
Kuwait
The trade intensity index with Kuwait has grown steeply over the last few years with 2008 having a
very high TII of 4.14 which is much more than the average TII of 1.77 seen over the last five years.

148
Competitor Analysis
The following table lists down the five major competitors considered for each of the markets. The
competitors have been chosen according to their vicinity to the Indian export figures to these markets
as we consider these countries more intense rivals to the position of India.
We further saw as to what is the current market share of Indian exports in each of these destinations
(as can be seen from the table below). It can be seen that Indian exports command highest market
share in the Kuwait market at 43% approximately followed by 33% and 34% in Qatar and Saudi
Arabia respectively. It is however in the UK market that it commands a very small 2.41% of market
share showing an immense potential that lies in the UK market which Indian exports can tap.
UAE UK Saudi Arabia Qatar Kuwait
24.21% 2.41% 33.70% 32.88% 42.79%
2004 2005 2006 2007 2008
UAE UK Saudi Arabia Qatar Kuwait
Netherlands Kenya Greece Netherlands Netherlands
Egypt, Arab Rep. France Egypt, Arab Rep. United Arab Emirates Egypt, Arab Rep.
Thailand Netherlands Netherlands France Sri Lanka
France Cyprus Jordan Egypt, Arab Rep. United States
Kenya Panama Sri Lanka Sri Lanka United Arab Emirates

149
Trade Intensity Index of Competitors
United Arab Emirates
Four out of the five major competitors have very high TII values when compared to the TII value that
India holds in respect to the United Arab Emirates. While India has a TII value of 1.3 for the current
year its competitors stand in the range of 5.8 to 7.3 and hence this shows that it would be tough for
India to penetrate the UAE market with these competitors standing in the way.
United Kingdom
For this country, the two competitors having a TII more than India are Kenya and Panama. 85%
of the Kenyan exports to UK in the 07 category are for the product 070990. And hence the very high
value for the TII between Kenya and UK. On the other hand, Panama’s export of Product 070990 to
UK stands comparable to India and thus is the closest competitor.

150
Saudi Arabia
The two major competitors that have a very high TII with Saudi Arabia are Greece and Jordan with the
values of 19.87 and 14.31 respectively which stands much higher than the TII value of 5.15 that India
holds with respect to Saudi Arabia.
Qatar
Three major competitors have TII higher than that of India namely, Netherlands, France and
Sri Lanka that hold the values of 2.95, 3.80 and 4.37 respectively as in comparison to the 2.83 that India
holds in the product category 070990 with respect to Qatar.

151
Kuwait
India stand second highest amongst all its competitors to the export market of Kuwait with the TII
value of 4.14 being slightly behind than that of Netherlands which has a TII value of 4.49. Hence,
clearly India has a steadily strengthened its position in the Kuwait market accompanies with the rising
trend in exports as well as the rising TII values of the years.
Relative Competitive Advantage for 070990 vis-à-vis other Suppliers in Major Markets in 2008
United Arab Emirates
India has one of the least Relative competitive advantage vis-à-vis the other competitors. It has an RCE
value of 0.5 as compared to an average 2.48 RCE value shared by Netherlands, Thailand, France and
Kenya. (See the RCE table attached in the appendix)
United Kingdom
India has an RCE value of 2.73 and stands third in the overall ranking behind Kenya and Panama with
4.96 and 4.26 respectively. It must be noted that both the countries also have higher TII values than
India for this export destination.

152
Saudi Arabia
For this market, India has an RCE value of 2.96 which stand much lower than the value of 11.83 that
Greece.
Qatar
For this market, India has an RCE value of 1.36 as compared to 2.36 that Sri Lanka holds and 2.05 that
France holds.
Kuwait
India has the 2nd highest RCE value of 2.83 in this market after Netherlands which holds an RCE value
of 3.52 and thus is similar to the trend that we say while calculating TII of India’s competitors with
respect to Kuwait.

153
Tariff and Non Tariff barriers for Banana in Identified Markets
Major
Markets
Import
tariff
Other Tariff where ever
applicable
NTM
%
NTM
Tariff
description
Tariff
rate
UAE NA NA NA NA
UK NA NA NA NA
Saudi
Arabia
MFN Rates 12.00% 100% Testing, Inspection or quarantine
requirements
Qatar NA NA NA NA
Kuwait NA NA NA NA
Amongst the five destination markets namely, UAE, UK, Qatar, Saudi Arabia and Kuwait it was seen
that the only country that which has import tariff applicable is that of Saudi Arabia. Saudi Arabia
applies a MFN rate of 12% to the imports under this category of products. It is also the only country
amongst the lot to have 100% Non tariff mechanism which it applies to the “Testing, Inspection or
quarantine requirements”
FTA/PTA
Amongst the five destination markets namely, UAE, UK, Qatar, Saudi Arabia and Kuwait, India does
not hold any Free Trade or Preferential Trade agreement with any of them.
Country FTA/PTA Rate
UAE None -
UK None -
Saudi Arabia None -
Qatar None -
Kuwait None -

154
Tariff Rate Quota Structure in major export destinations
No tariff quotas are applied in any of the export destinations for product 070990.
Tariff Rate Quota Structure of 070990 in major export destinations
Markets TRQ Quantity (METRIC TONS) In quota - Duty Out Quota - Duty
UAE No No No
UK No No No
Saudi Arabia No No No
Qatar No No No
Kuwait No No No
Presence of Special Safeguard Duty
No Special safeguard duty is present in any of the export destinations for product 070990.
Presence of Special Safeguard Duty
Country Volume Trigger
Price
Trigger
UAE NO NO
UK NO NO
Saudi
Arabia NO NO
Qatar NO NO
Kuwait NO NO
Subsidy Structure
While none of the markets have product specific subsidies applicable. It must be noted that UK and
Saudi Arabia have Non Product Specific subsidies existing. In the case of UK, the NPS subsidies have
been taken as applicable to the notifications sent by the EEC.
Markets Non
Product
Specific
Green Box Special and
Differential
Treatment –
"Development
Programs"
Currency Year
UAE 0 3400000 9.000,000 (Dh) 2000/01
UK 728.4 22130.3 21520.8 Mio ECU 1996/97
Saudi Arabia 838.4 674.296 0 (mn SRls) 2006
Qatar 0 0 0 Rial 2004
Kuwait 0 0 0 Dinar -

155
Green Box subsidies are applicable to UAE, UK as well as Saudi Arabia and do not exist in either
Qatar or Kuwait. It must be noted that Kuwait and Qatar are the regions also where Indian exports
have faced highest growth over last 5 years.
Strategy for Promotion of Banana Export from Andhra Pradesh
Of course, the shipping companies are offering service in the form of refrigerated containers for
banana exporters. The specialised containers would enable farmers to transport the produce from
farms to international destinations, while increasing the shelf-life of bananas up to three weeks. Reefer
containers provide a cost-effective logistics solution for fruits and other perishables. Banana
cultivation is facing problems like non-availability of standardised, good-quality planting material and
quality certification of plant material. Though banana is a highly perishable crop, currently no
insurance facility is available for farmers. Air tariffs for banana are also very high. There is an urgent
need for standardisation, certification and rapid multiplication for yielding good-quality material
through tissue culture. Through tissue culture, it would be possible to multiply government
assistance, tissue-culture companies can achieve economies of scale and this can bring down the cost
of planting materials. The insurance facility for farmers is also important. There are centers for
research in banana in Andhra Pradesh which can further be developed for these purposes.

156
Appendix
Table 4: Trade Intensity Index for Banana with respect to Major Export Markets
India's export World Export
Year 070990 07 070990 07 TII
2003 2.96 33.01 12.91 178.11 1.24
2004 2.77 37.20 13.50 176.16 0.97
2005 5.45 44.74 22.64 260.58 1.40
2006 10.75 97.45 32.27 378.46 1.29
2007 12.55 91.31 44.18 426.33 1.33
TII UAE
2008 12.81 84.93 52.90 460.41 1.31
India's export World Export
Year 070990 07 070990 07 TII
2003 1.99 10.79 221.79 2481.69 2.07
2004 3.31 13.84 253.77 2811.19 2.65
2005 2.58 14.17 309.47 3076.26 1.81
2006 11.05 26.90 390.40 3468.52 3.65
2007 11.93 23.47 472.83 3885.75 4.18
TII UK
2008 8.86 18.94 368.17 2979.97 3.79
India's export World Export
Year 070990 07 070990 07 TII
2003 1.66 11.35 10.35 106.38 1.51
2004 1.80 12.28 14.02 130.29 1.36
2005 1.97 14.52 14.16 142.57 1.36
2006 5.92 19.72 17.75 277.54 4.69
2007 5.12 18.13 17.03 349.81 5.80
TII Saudi Arabia
2008 4.58 18.30 13.59 279.75 5.15
India's export World Export
Year 070990 07 070990 07 TII
2003 0.52 2.06 8.45 31.31 0.94
2004 0.53 2.92 4.82 35.15 1.32
2005 0.78 4.30 13.22 45.17 0.62
2006 2.85 7.26 10.71 56.28 2.06
2007 3.41 6.70 16.20 73.89 2.32
TII Qatar
2008 4.92 8.68 14.97 74.40 2.82
India's export World Export
Year 070990 07 070990 07 TII
2003 0.83 5.20 7.89 68.09 1.38
2004 1.33 7.43 7.44 70.03 1.68
2005 1.33 9.62 24.10 91.55 0.52
2006 2.45 12.03 21.92 122.72 1.14
2007 3.24 10.57 23.06 132.19 1.76
TII Kuwait
2008 4.81 12.05 11.23 116.52 4.14

157
TII with other suppliers
UAE Competitor 's
export of 070990
Competitors's
Total Export of 07
World 's export of
070990
World 's export
of 07
TII
Netherlands 22.84 34.19 52.90 457.70 5.78
Egypt, Arab
Rep.
3.53 23.85 52.90 457.70 1.28
Thailand 3.05 4.10 52.90 457.70 6.44
France 2.84 4.05 52.90 457.70 6.06
Kenya 2.51 2.98 52.90 457.70 7.27
UK Competitor 's
export of 070990
Competitors's
Total Export of 07
World 's export of
070990
World 's export
of 07
TII
Kenya 151.81 178.52 368.17 2837.48 6.55
France 58.68 290.27 368.17 2837.48 1.56
Netherlands 29.84 1038.86 368.17 2837.48 0.22
Cyprus 10.40 27.79 368.17 2837.48 2.89
Panama 8.88 12.17 368.17 2837.48 5.62
Saudi
Arabia
Competitor 's
export of 070990
Competitors's
Total Export of 07
World 's export of
070990
World 's export
of 07
TII
Greece 4.08 4.08 13.59 270.04 19.87
Egypt, Arab
Rep.
2.62 69.64 13.59 270.04 0.75
Netherlands 0.76 21.90 13.59 270.04 0.69
Jordan 0.42 0.58 13.59 270.04 14.31
Sri Lanka 0.42 2.00 13.59 270.04 4.14
Qatar Competitor 's
export of 070990
Competitors's
Total Export of 07
World 's export of
070990
World 's export
of 07
TII
Netherlands 6.02 9.06 14.97 66.46 2.95
United Arab
Emirates
1.65 9.36 14.97 66.46 0.78
France 0.67 0.78 14.97 66.46 3.80
Egypt, Arab
Rep.
0.65 6.04 14.97 66.46 0.48
Sri Lanka 0.43 0.44 14.97 66.46 4.37
Kuwait Competitor 's
export of 070990
Competitors's
Total Export of 07
World 's export of
070990
World 's export
of 07
TII
Netherlands 3.44 6.94 11.23 101.77 4.49
Egypt, Arab
Rep.
1.68 18.69 11.23 101.77 0.81
Sri Lanka 0.45 1.21 11.23 101.77 3.40
United
States
0.36 8.29 11.23 101.77 0.39
UAE 0.21 8.48 11.23 101.77 0.22

158
Relative Competitive Advantage for 070990 vis-à-vis other Suppliers in Major Markets in 2008
UAE Competitor 's
export of
070990
Competitors's
Total Export of
07
All Competitor
's Export of
070990
All
Competitor 's
Export of 07
Rel.
Comp.
Adv.
Netherlands 22.84 34.19 47.57 154.10 2.16
India 12.81 84.93 47.57 154.10 0.49
Egypt, Arab
Rep.
3.53 23.85 47.57 154.10 0.48
Thailand 3.05 4.10 47.57 154.10 2.41
France 2.84 4.05 47.57 154.10 2.27
Kenya 2.51 2.98 47.57 154.10 2.72
UK Competitor 's
export of
070990
Competitors's
Total Export of
07
All Competitor
's Export of
070990
All
Competitor 's
Export of 07
Rel.
Comp.
Adv.
Kenya 151.81 178.52 268.48 1566.55 4.96
France 58.68 290.27 268.48 1566.55 1.18
Netherlands 29.84 1038.86 268.48 1566.55 0.17
Cyprus 10.40 27.79 268.48 1566.55 2.18
Panama 8.88 12.17 268.48 1566.55 4.26
India 8.86 18.94 268.48 1566.55 2.73
Saudi
Arabia
Competitor 's
export of
070990
Competitor’s
Total Export of
07
All Competitor
's Export of
070990
All
Competitor 's
Export of 07
Rel.
Comp.
Adv.
India 4.58 18.30 8.30 98.20 2.96
Greece 4.08 4.08 8.30 98.20 11.83
Egypt, Arab
Rep.
2.62 69.64 8.30 98.20 0.45
Netherlands 0.76 21.90 8.30 98.20 0.41
Jordan 0.42 0.58 8.30 98.20 8.52
Sri Lanka 0.42 2.00 8.30 98.20 2.47
Qatar Competitor 's
export of
070990
Competitors's
Total Export of
07
All Competitor
's Export of
070990
All
Competitor 's
Export of 07
Rel.
Comp.
Adv.
Netherlands 6.02 9.06 14.35 34.36 1.59
India 4.92 8.68 14.35 34.36 1.36
United
Arab
Emirates
1.65 9.36 14.35 34.36 0.42
France 0.67 0.78 14.35 34.36 2.05
Egypt, Arab
Rep.
0.65 6.04 14.35 34.36 0.26
Sri Lanka 0.43 0.44 14.35 34.36 2.36

159
Kuwait Competitor 's
export of
070990
Competitors's
Total Export of
07
All Competitor
's Export of
070990
All
Competitor 's
Export of 07
Rel.
Comp.
Adv.
India 4.81 12.05 6.14 43.60 2.83
Netherlands 3.44 6.94 6.14 43.60 3.52
Egypt, Arab
Rep.
1.68 18.69 6.14 43.60 0.64
Sri Lanka 0.45 1.21 6.14 43.60 2.66
United
States
0.36 8.29 6.14 43.60 0.31
United
Arab
Emirates
0.21 8.48 6.14 43.60 0.17

160
GGGGrape cultivation is one of the most remunerative farming enterprises in India. Grapes occupies fifth
position amongst fruit crops with cultivation of over an area of 34,000 hectares and production of 1.08
MT from an area of 0.04 Million ha. Grape is grown under a variety of soil and climatic conditions in
three distinct agro-climatic zones, namely, sub-tropical, hot tropical and mild tropical climatic regions
in India. The major varieties of grapes grown in India are, Thomson Seedless, Sonaka, Anab-e-Shahi,
Perlette, Banglore blue, Pusa seedless, Beauty seedless etc. Maharashtra occupies the first position
with a production of 0.68 MT of grapes, followed by Karnataka. Andhra Pradesh
The Chittoor is the major district in the mid tropical region where the Grapes are grown in Andhra
Pradesh. Besides, in the hot tropical region in Andhra Pradesh, Grapes are grown in around 10,000
acres in the state in the districts of Ranga Reddy, Medak and parts of Mahbubnagar districts as
compared to approximately one lakh acre in Maharashtra. Although Andhra Pradesh falls behind MS
and Karnataka in grape production, but still this is a major fruit for the state in terms of rural
population dependent on it. Though grapes are grown in Chittoor and Anantapur districts also, the
seed variety, Dilkush or Sharad, or seedless Taj Ganesh are mainly meant for domestic consumption.
Therefore this section of the report tries to explore the export prospects of the grapes and raisins from
AP and assists grape exporters to identify right markets for their fresh and processed grapes. The
section also suggests strategies for export development of grapes from the state.
Grapes [080610]Grapes [080610]Grapes [080610]Grapes [080610]
161
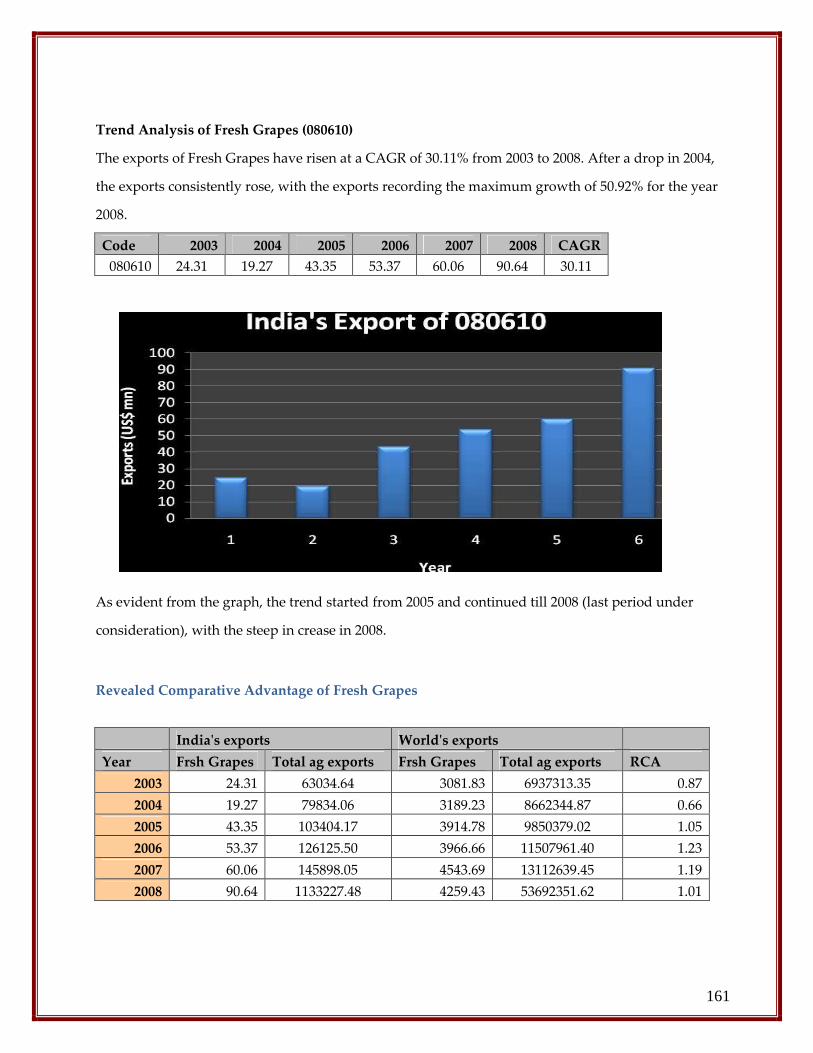
Trend Analysis of Fresh Grapes (080610)
The exports of Fresh Grapes have risen at a CAGR of 30.11% from 2003 to 2008. After a drop in 2004,
the exports consistently rose, with the exports recording the maximum growth of 50.92% for the year
2008.
Code 2003 2004 2005 2006 2007 2008 CAGR
080610 24.31 19.27 43.35 53.37 60.06 90.64 30.11
As evident from the graph, the trend started from 2005 and continued till 2008 (last period under
consideration), with the steep in crease in 2008.
Revealed Comparative Advantage of Fresh Grapes
India's exports World's exports
Year Frsh Grapes Total ag exports Frsh Grapes Total ag exports RCA
2003 24.31 63034.64 3081.83 6937313.35 0.87
2004 19.27 79834.06 3189.23 8662344.87 0.66
2005 43.35 103404.17 3914.78 9850379.02 1.05
2006 53.37 126125.50 3966.66 11507961.40 1.23
2007 60.06 145898.05 4543.69 13112639.45 1.19
2008 90.64 1133227.48 4259.43 53692351.62 1.01

162
Figure 5 RCA for 080610
As for the figures depicted above, India gained competitiveness in the Fresh Grapes market in the
world, post 2005 when its RCA value increased from 0.66 in 2004 to 2005. Since then, India has
displayed revealed comparative advantage in the exports of grapes consistently, with the figure
dropping to 1.01 by the end of 2008.
Major Export Destinations for Fresh Grapes
Approximately, 2.5 percent (22,000 t) of fresh grapes are exported to the Middle East and European
countries as of now. This section will explore the possibilities of export market diversification for
grape and raisin export from Andhra Pradesh.
Partner Name 2003 2004 2005 2006 2007 2008 CAGR
Bangladesh 142.02 606.548 2587.443 4764.899 8652.273 11446.371 140.58
Belgium 250.429 826.032 1070.448 3317.478 2625.527 855.591 27.85
Netherlands 5090.784 3853.734 14486.334 17164.885 18156.255 39639.126 50.75
United Arab
Emirates 4256.413 4679.273 7174.752 7750.402 7302.237 10096.385 18.86
United Kingdom 8828.144 5146.036 13054.562 13388.332 15354.358 18479.821 15.92

163
Of the major Export Destinations as depicted above, the exports to Bangladesh increased the most
over the period under review. In absolute terms, Netherlands is the biggest importer of Indian Fresh
Grapes. Belgium seems to be unattractive considering the low value of exports to it compared to the
other export destinations.
Below is the depiction of the market fluctuation in terms of value of exports of fresh grapes from India
to the markets.
Market Fluctuations of Major Export Markets
2003 2004 2005 2006 2007 2008
United
Kingdom
United
Kingdom Netherlands Netherlands Netherlands Netherlands
Netherlands
United Arab
Emirates
United
Kingdom
United
Kingdom
United
Kingdom
United
Kingdom
United Arab
Emirates Netherlands
United Arab
Emirates
United Arab
Emirates Bangladesh Bangladesh
Belgium Belgium Bangladesh Bangladesh
United Arab
Emirates
United Arab
Emirates
Bangladesh Bangladesh Belgium Belgium Belgium Belgium
United Kingdom slipped from the top export market in 2003 to second most attractive destination in
terms of value of exports. Going by value of exports Netherlands with the CAGR of 50.75% from 2003
to 2008 emerged as the top export destination for Indian Fresh Grapes. As for other destinations,
Bangladesh increased its attractiveness whereas decline in exports to Saudi Arabia pushed it to
number 4 slot in terms of value of exports during 2008.
Trade IntenTrade IntenTrade IntenTrade Intensity Index with Major Marketssity Index with Major Marketssity Index with Major Marketssity Index with Major Markets
Bangladesh India's export World Export
Year Frsh Grapes Total ag exports Frsh Grapes Total ag exports TII
2003 142.02 20338.352 2159.881 41502.423 0.13
2004 606.548 27040.788 3215.784 54362.305 0.38
2005 2587.443 25542.659 5373.14 64872.992 1.22
2006 4764.899 33787.354 7673.077 65795.779 1.21
2007 8652.273 29083.696 11546.96 81721.554 2.11
2008 11446.371 43839.99 15810.397 113599.879 1.88
India’s Trade Intensity Index (TII) with Bangladesh increased consistently peaking in 2007 before
falling to 1.88 in 2008.

164
Belgium
India's export World Export
Year Frsh Grapes
Total ag
exports Frsh Grapes
Total ag
exports TII
2003 250.429 8169.36 107596.499 1285353.66 0.37
2004 826.032 12840.373 118383.583 1526669.706 0.83
2005 1070.448 15715.967 141525.514 1796771.385 0.86
2006 3317.478 14946.813 136124.459 1878577.794 3.06
2007 2625.527 15344.177 135141.98 2012330.922 2.55
2008 855.591 16522.208 147026.894 1944817.771 0.68
India’s TII with Belgium decreased implying that India as a partner in exports of 080610 as compared
to the rest of the world has weakened over the period under review.
Netherlands India's export World Export
Year Frsh Grapes
Total ag
exports Frsh Grapes
Total ag
exports TII
2003 5090.784 58401.15 240595.484 2153122.327 0.78
2004 3853.734 76329.219 284926.349 2568617.022 0.46
2005 14486.334 124295.9 367960.022 3044976.206 0.96
2006 17164.885 132910.994 355062.15 3309568.527 1.20
2007 18156.255 113752.627 413969.945 3830359.157 1.48
2008 39639.126 158211.567 392881.319 3279036.797 2.09
Trading relationship with Belgium with regards to export of 080610 increased largely consistently over
the period with the value being 2.09 in 2009.
UAE India's export World Export
Year Frsh Grapes
Total ag
exports Frsh Grapes
Total ag
exports TII
2003 4256.413 47066.2 14649.526 556908.882 3.44
2004 4679.273 56490.379 14251.882 481703.906 2.80
2005 7174.752 81907.086 20174.688 525133.565 2.28
2006 7750.402 95889.005 24690.735 688986.507 2.26
2007 7302.237 112573.719 26480.526 536474.976 1.31
2008 10096.385 174317.925 28722.01 621714.502 1.25
India’s trade intensity in exports of 080610 to UAE decreased over time with the value decreasing
from 3.44 in 2003 to 1.25 in 2008.

165
UK India's export World Export
Year Frsh Grapes
Total ag
exports Frsh Grapes
Total ag
exports TII
2003 8828.144 36458.464 254761.63 2370387.744 2.25
2004 5146.036 42561.788 283165.301 2822510.685 1.21
2005 13054.562 58973.593 356783.915 3270182.03 2.03
2006 13388.332 53262.714 359559.379 3498413.467 2.45
2007 15354.358 53232.905 444920.677 4019689.341 2.61
2008 18479.821 55564.969 356240.666 3135911.784 2.93
India’s trade relation in comparison to rest of the world in export of 080610 remained roughly the
same. That is there was no major change in the intensity of trade relation between the two countries
over the period under the review. Looking at the markets on the whole, India’s trade intensity in the
exports of 080610 has declined over the period with many of its important export markets
Competitor’s Analysis in Each Market
In this section we will analyse the competition that Indian exporters face from exporters in different
countries in each of the destination markets. For the competitor analysis, the top seller to the market
and sellers immediately above and below (in terms of value of exports of 080610 to the market) are
considered.
Market: Bangladesh
The competitors to Indian exports and their exports value is depicted by the chart below:

166
As is depicted by the graph above, India is the predominant exporter to Bangladesh with United States
and Australia being distant second and third respectively. There is little competition to the exports of
080610 from India to Bangladesh. However, as for TII with Bangladesh Australia has the highest TII of
6.15 in 2008 followed by United States and India being last with a TII of 1.88 in 2008.
Market: Belgium
The competitors to Indian exports and their exports value is depicted by the chart below:
Clearly, Italy is the biggest exporter of Fresh Grapes to Belgium with the exports of 39154.97 ‘000 USD.
Competitors close to India are Israel and United Kingdom which are ahead of India and Turkey and
United States following India. Clearly, there is a stiff competition for Indian exports to the Belgium.

167
Even with regards to the TII, the top exporter (Italy) and the close competitors of India have a higher
TII than India. Thus the Trade intensity of India is smaller as compared to the trade intensity of
competitors with Belgium.
Market: Netherlands
The competitors to Indian exports and their exports value is depicted by the chart below:
South Africa is the biggest exporter of Fresh Grapes to Netherlands. As for close competitors to India,
in terms of value of exports, Italy and Greece follow closely with exports of 27988.2 thousand USD and
22923.77 thousand USD respectively.

168
As for TII, Greece has the highest TII with Netherlands with a value of 3.93 in 2008. Even though low
in comparison to the competitors, India a strong trade intensity with Netherlands with a value of 2.09
Market: United Arab Emirates
The competitors to Indian exports and their exports value is depicted by the chart below:
India is the leading exporter of Fresh Grapes to UAE with Unted States and South Africa as distant
second and third. Clearly, as depicted from the graph, there is notmuch competition to the exports
from India to UAE.

169
Although India’s TII with UAE is greater than 1 but Australia and Italy has a stronger TII with a value
of 2.27 and 3.58 for the year 2008.
Market: United Kingdom
The competitors to Indian exports and their exports value is depicted by the chart below:
Egypt is the biggest exporter of Fresh Grapes to the market with Italy, Netherlands, Germany and
Namibia being the closest competitors of India (in terms of value of exports).

170
India has a strong trade intensity index value of 2.93 for the year 2008, India’s competitor Namibia has
a strong tie in terms of its exports of Fresh Grapes to UK vis-a-vis its total exports to the country.
For detailed figures on Competitors’ exports in 2008 and their TII refer to Annexure I table 1 – Table 5
Relative Comparative Advantage: This section as part of the competitor’s analysis reveals the
comparative advantage of India and the competitors in various export markets.
Bangladesh
Competitor 's
export of
080610
Competitors’
Total Export
of 08
All Competitor
's Export of
080610
All Competitor
's Export of 08
Rel.
Comp.
Adv.
India 11446.37 43839.99 15116.41 49625.22 0.86
United States 1924.37 3744.23 15116.41 49625.22 1.69
Australia 1745.67 2041 15116.41 49625.22 2.81
As evident from the table, India’s Relative comparative advantage value is 0.86 which is lower than 1
and implying that with respect to all the competitors identified in the export market, India has no
comparative advantage and going by the values, Australia has the highest comparative advantage in
the exports of Fresh Grapes to Bangladesh.

171
Belgium
Competitor 's
export of
080610
Competitors’
Total Export
of 08
All Competitor
's Export of
080610
All Competitor
's Export of 08
Rel.
Comp.
Adv.
India 855.591 16522.208 42229.494 349729.608 0.43
Italy 39154.97 98147.06 42229.494 349729.608 3.30
Israel 941 12873 42229.494 349729.608 0.61
United Kingdom 882.262 4725.9 42229.494 349729.608 1.55
Turkey 280.471 72843.01 42229.494 349729.608 0.03
United States 115.2 144618.43 42229.494 349729.608 0.01
With respect to competitors in the export of Fresh Grapes to Belgium, India does not have a relative
comparative advantage. Italy has the maximum value of 3.3
Netherlands
Competitor 's
export of
080610
Competitors’
Total Export
of 08
All Competitor
's Export of
080610
All Competitor
's Export of 08
Rel.
Comp.
Adv.
India 39639.126 158211.567 289682.186 965110.597 0.83
South Africa 133903.87 381808.4 289682.186 965110.597 1.17
Italy 27988.2 88520.99 289682.186 965110.597 1.05
Greece 22923.77 48635.96 289682.186 965110.597 1.57
Brazil 65227.22 287933.68 289682.186 965110.597 0.75
Again as with the Bangladesh and the Belgium markets, India does not have a relative comparative
advantage (comparative advantage with respect to the exporters of the Fresh Grapes in that particular
market). Greece has the highest relative comparative advantage value of 1.57
United Arab
Emirates
Competitor 's
export of
080610
Competitors’
Total Export
of 08
All Competitor
's Export of
080610
All Competitor
's Export of 08
Rel.
Comp.
Adv.
India 10096.385 174317.925 26596.165 447418.925 0.97
United States 5980.12 138958.32 26596.165 447418.925 0.72
South Africa 4700.53 75358.43 26596.165 447418.925 1.05
Australia 3089.39 29452.07 26596.165 447418.925 1.76
Italy 1478.77 8943.74 26596.165 447418.925 2.78
Egypt 1250.97 20388.44 26596.165 447418.925 1.03
Although being the biggest exporter of Fresh Grapes to United Arab Emirates, India does not have a
relative comparative advantage in the Fresh Grapes exports to UAE market. Italy has the highest
relative comparative advantage with the value of 2.78 in the year 2008.

172
United Kingdom
Competitor 's
export of
080610
Competitors’
Total Export
of 08
All Competitor
's Export of
080610
All Competitor
's Export of 08
Rel.
Comp.
Adv.
India 18479.821 55564.969 356240.666 3135911.784 2.93
Italy 27167.91 273770.86 356240.666 3135911.784 0.87
Netherlands 25245.37 321062.13 356240.666 3135911.784 0.69
Germany 11305 66917 356240.666 3135911.784 1.49
Egypt 69424.2 100029.18 356240.666 3135911.784 6.11
Namibia 10812.79 10833.31 356240.666 3135911.784 8.79
In the exports to the market United Kingdom, India has tough competition from Egypt and Namibia.
India better off than these countries Countries giving competition to India in identified export
market
Tariff and Non Tariff measures on fresh grapes
The tariff and non Tariff as imposed by the importing countries on import of Fresh Grapes are given in
the following table:
Other Tariff where ever applicable
Major Markets
Import
tariff
Tariff description
Tariff
rate
NTM
%
NTM
Statutory Rate 100.0%
Infrastructural Surcharge 2.5%
Bangladesh 15% VAT 15.0% 0 -
European Union 14% 0 -
Note: Here the figures for the markets: Belgium, Netherlands and United Kingdom are indicated
under the head European Union as these countries form part of Custom Union and hence same trade
laws, rules and regulation.Clearly, as is evident from the table above there is no Non tariff measured
imposed by the export markets identified. As between the two markets, Bangladesh has a higher tariff
regime.
Preferential / Free Trade Agreement
The below table depicts any preferential / Free trade agreement that the identified exports market
have and the tariffs on fresh grapes under such arrangement.

173
Country FTA/PTA Rate
Tariff Line Agreement
080610.1005 Preference for Egypt 3.2%
Preference for Morocco 0.0%
Preference for Tunisia 3.2%
Preference for Algeria 0.0%
080610.1091
GSP rates 9.7%
Preference for ACP countries 0.0%
preference for Egypt 4.6%
Preference for Morocco 0.0%
Preference for Tunisia 4.6%
Preference for Algeria 0.0%
080610.1099
GSP rates 9.7%
preference for Egypt 4.6%
Preference for Morocco 0.0%
Preference for Tunisia 4.6%
Preference for Algeria 0.0%
080610.9000
GSP rates 12.2%
European Union
GSP for LDC 0.0%
European Union has agreements with various countries / regions and hence charges lower duty on
imports of Fresh Grapes from certain markets, giving them the advantage. India allows advantage
under the GSP (Global System of Preferences) agreement.
Tariff Rate Quotas, SSG and Tariff Escalation on Import of Fresh Grapes
Markets TRQ Quantity (METRIC TONS)
In quota -
Duty
Out Quota -
Duty
Bangladesh No No No
United Arab Emirates No No No
European
Community No No No
Clearly there are no TRQ imposed by the identified markets on the import of Fresh Grapes which a
healthy signal for the exporters.

174
Special Safeguard Mechanisms
Country
Volume
Trigger
Price
Trigger Period
Bangladesh NO NO NA
United Arab
Emirates NO NO NA
European
Community YES NO 21-jul-2006 to 20-nov-2007
As given in the table, European Community has often resorted to the imposition of Special Safeguard
duty on Volume Trigger to safeguard the interests of its domestic markets. Besides no special
safeguards have been imposed by Bangladesh and United Arab Emirates
Tariff Escalation
Since Fresh Grapes is a primary product there is no consideration for studying the tariff escalation
faced by the import of the commodity in the identified markets for exports.
Subsidies
Markets
Product
Specific
Non Product
Specific
Green
Box S&D Currency
Bangladesh NA 40.18 42.01 0.22
Million
USD
European
Community 112.7 573.5 20661.2 Not Applicable
Million
Euro
United Arab
Emirates
Not
Applicable Not Applicable 3400000 9000000 Dh
Special and Differential Treatment – "Development Programmes"
European Community had given a Product Specific subsidy of 112.7 Million Euro in 2001-2002, giving
an advantage to its farmers. Whereas both Bangladesh and UAE provide support to its domestic
markets in the form of Green Box Subsidy and Development Programmes, Bangladesh also provide
non product specific subsidy to its farmers.

175
Conclusion
Grape exports from India are growing at 30%. The RCA values have also risen from 0.87 to 1.01 in last
five years indicating the rising comparative advantage of India in grapes in the International market.
Out of the five major markets identified for fresh grapes export from AP, highest growth is seen for
Bangladesh followed by EU countries including Belgium, Netherlands and UK. UAE is another
market with 18% growth. Out of these, Netherlands and Bangladesh has witnessed a growing pattern,
while UAE is declining. Bilateral trade strength is also relatively better for EU countries; however,
fresh grapes from AP will have to face tough competition in European Union market from grapes
coming from Italy, Israel, South Africa and Australia. UAE received good quality grapes from Egypt
and Namibia.
EU again becomes difficult for AP exporters due to the presence of lot many number of FTAs with
Egypt, Morocco, Tunisia, Algeria and other ACP countries. Therefore while grape exporters from
Andhra Pradesh will be facing an import duty of 14% in EU markets, these competing suppliers will
face preferential duty rates of 3-4% and generalized system of preference duty rates of 12% thus
loosing the price competition in the EU market. EU also provides a lot of subsidies to its grape
farmers.Thus we conclude in recommending Middle East and Bangladesh as relatively easy markets
for AP grape exporters. Also since USA has depicted poor TII values depicting poor competetiveness
in these markets, USA can also be explored.

176
ANNEXURE : Trade Intensity Index for Competing suppliers in Identified Markets
Bangladesh
Competitor 's
export of 080610
Competitors’
Total Export of 08
Total export of
080610
Total export of
08 TII
India 11446.37 43839.99 15810.397 113599.879 1.88
United States 1924.37 3744.23 15810.397 113599.879 3.69
Australia 1745.67 2041 15810.397 113599.879 6.15
Belgium
Competitor 's
export of 080610
Competitors’
Total Export of 08
Total export of
080610
Total export of
08 TII
Italy 39154.97 98147.06 147026.894 1944817.771 5.28
Israel 941 12873 147026.894 1944817.771 0.97
United
Kingdom 882.262 4725.9 147026.894 1944817.771 2.47
India 855.591 16522.208 147026.894 1944817.771 0.68
Turkey 280.471 72843.01 147026.894 1944817.771 0.05
United States 115.2 144618.43 147026.894 1944817.771 0.01
Netherlands
Competitor 's
export of 080610
Competitors’
Total Export of 08
Total export of
080610
Total export of
08 TII
South Africa 133903.87 381808.4 392881.319 3279036.797 2.93
Brazil 65227.22 287933.68 392881.319 3279036.797 1.89
India 39639.126 158211.567 392881.319 3279036.797 2.09
Italy 27988.2 88520.99 392881.319 3279036.797 2.64
Greece 22923.77 48635.96 392881.319 3279036.797 3.93
United Arab
Emirates
Competitor 's
export of 080610
Competitors’
Total Export of 08
Total export of
080610
Total export of
08 TII
India 10096.385 174317.925 28722.01 621714.502 1.25
United States 5980.12 138958.32 28722.01 621714.502 0.93
South Africa 4700.53 75358.43 28722.01 621714.502 1.35
Australia 3089.39 29452.07 28722.01 621714.502 2.27
Italy 1478.77 8943.74 28722.01 621714.502 3.58
Egypt, Arab
Rep. 1250.97 20388.44 28722.01 621714.502 1.33
United
Kingdom
Competitor 's
export of 080610
Competitors’
Total Export of 08
Total export of
080610
Total export of
08 TII
Egypt, Arab
Rep. 69424.2 100029.18 356240.666 3135911.784 6.11
Italy 27167.91 273770.86 356240.666 3135911.784 0.87
Netherlands 25245.37 321062.13 356240.666 3135911.784 0.69
India 18479.821 55564.969 356240.666 3135911.784 2.93
Germany 11305 66917 356240.666 3135911.784 1.49
Namibia 10812.79 10833.31 356240.666 3135911.784 8.79

177
Trend Analysis of Dry Grapes (080620)
Code 2003 2004 2005 2006 2007 2008 CAGR
080620 0.08 0.71 0.34 0.28 0.16 4.55 123.12
Although the export of Dry Grapes has shown a considerable increase from 0.08 mn USD in 2003 to
4.55 mn USD in 2008, with an impressive CAGR of 123.12, they still account for very low proportion of
world export in Dry Grapes.
Figure 6 India’s export to the world
As evident from the graph, the exports first declined in the year 2005 up to the year 2007 before
recovering sharply in the year 2008. The export of Dry Grapes has shown an erratic trend over the
period with burst of growth and fall.
Dried Grapes [080620]Dried Grapes [080620]Dried Grapes [080620]Dried Grapes [080620]

178
Revealed Comparative Advantage of 080620
Year
India's
exports
India's total
exports
World's
exports
World's total
exports RCA
2003 0.08 63034.64 643.03 6937313.35 0.01
2004 0.71 79834.06 787.47 8662344.87 0.10
2005 0.34 103404.17 875.34 9850379.02 0.04
2006 0.28 126125.50 954.04 11507961.40 0.03
2007 0.16 145898.05 912.44 13112639.45 0.02
2008 4.55 1133227.48 986.18 53692351.62 0.22
Figure 7 RCA for 080620
As indicated by the figures, India does not have comparative advantage in the Dry Grapes exports in
the world. Although, India’s RCA value increased to 0.22 in 2008, it still does not have a strong
position in the Dry Grapes industry. Moreover, the increase in the exports for the year 2008 does not
show a trend that is sustained growth.

179
Major Export Destinations for Dried Grapes: raisins
Partner
Name 2003 2004 2005 2006 2007 2008 CAGR
Bangladesh - - - 5.772 13.873 148.278 406.85
Nepal 12.827 15.037 6.417 38.838 23.272 78.481 43.66
Philippines - 0.071 - 43.246 0.076 79.789 478.99
Singapore 0.018 0.151 0.023 0.002 0.999 13.401 275.30
Sri Lanka 19.271 - 10.622 - 1.757 141.016 48.89
Of the major Export Destinations as depicted above, the exports to Bangladesh is the most attractive
destination when both the growth and value in absolute terms is taken into consideration. Besides,
exports to the entire major destination depicted above, witnessed a considerable growth in the period
under review, with Philippines becoming an attractive destination on account of highest CAGR.
Below is the depiction of the market fluctuation in terms of value of exports of 080620 from India to
the markets.
Market Fluctuations of Major Export Markets
2003 2004 2005 2006 2007 2008
Bangladesh Bangladesh Bangladesh Bangladesh Bangladesh Bangladesh
Nepal Nepal Singapore Nepal Nepal Nepal
Singapore Singapore Nepal Singapore Singapore Singapore
Sri Lanka Sri Lanka Sri Lanka Sri Lanka Sri Lanka Sri Lanka
Philippines Philippines Philippines Philippines Philippines Philippines
There has been no major fluctuation in the share of export markets to the export of 080620 from India
with Bangladesh remaining the most attractive destination (in terms of value) throughout the period
under review followed by Nepal, Singapore, Sri Lanka and Philippines.

180
Trade Intensity Index with Major Markets
Bangladesh India's export World Export
Year 080620 08 080620 08 TII
2003 - 20338.352 180.095 41502.423 -
2004 - 27040.788 216.092 54362.305 -
2005 - 25542.659 2821.56 64872.992 -
2006 5.772 33787.354 47.179 65795.779 0.24
2007 13.873 29083.696 2613.046 81721.554 0.01
2008 148.278 43839.99 1881.1 113599.879 0.20
India’s Trade Intensity Index (TII) with Bangladesh reveals that the value of trade between the two
countries is less than as expected on the basis of their importance in the world trade.
Nepal
India's export World Export
Year 080620 08 080620 08 TII
2003 12.827 5876.779 73.139 11338.304 0.34
2004 15.037 8487.201 114.812 16334.852 0.25
2005 6.417 6648.813 88.942 16198.584 0.18
2006 38.838 7295.944 159.143 17349.604 0.58
2007 23.272 11635.237 275.912 32177.92 0.23
2008 78.481 13538.366 288.793 31289.203 0.63
Although India’s TII with the Belgium increased over the period, but largely 080620 is not an
important commodity of trade compared to importance of India’s trade with Nepal in the context of
world trade

181
Philippines
India's export World Export
Year 080620 08 080620 08 TII
2003 - 73.585 3068.273 68822.629 -
2004 0.071 28.117 3249.845 71794.886 0.06
2005 - 96.064 3317.462 78695.611 -
2006 43.246 86.442 4508.343 101705.251 11.29
2007 0.076 3.514 2004.826 122008.705 1.32
2008 79.789 164.97 3184.76 153106.789 23.25
With the drastic increase of India’s TII with Philippines with the value reaching 23.25 in 2008, the
value of trade between the two countries is greater than as expected on the basis of trading importance
of the 2 nations in the world trade.
India's export World Export
Year 080620 08 080620 08 TII
2003 0.018 5028.824 3027.499 205803.866 0.0002
2004 0.151 5619.505 3105.64 192159.584 0.0017
2005 0.023 7734.735 3907.662 188834.459 0.0001
2006 0.002 5936.839 3919.655 206093.758 0.0000
2007 0.999 7965.627 3868.284 244993.654 0.0079
Singapore 2008 13.401 9178.199 4246.92 262829.95 0.0904
Although India’s trade intensity with Singapore increased under the period under the review, it is still
smaller than the expectations on the basis of their importance in the world trade.

182
India's export World Export
Year 080620 08 080620 08 TII
2003 19.271 1470.523 124.385 19816.421 2.09
2004 - 860.509 201.962 16417.631 -
2005 10.622 1107.949 1255.586 19034.003 0.15
2006 - 1460.105 298.433 20537.563 -
2007 1.757 970.929 1155.831 22284.04 0.03
Sri Lanka 2008 141.016 1794.787 1685.095 26125.313 1.22
India’s trade of 080620 with Sri Lanka is greater than expectations on the basis of their importance in
the world trade.Looking at the markets on the whole, the value of the trade of between and the major
markets for 080620 is less favourable as expected on the basis of importance on the world trade.
Competitor’s Analysis in Each Market
In this section we will analyse the competition that Indian exporters face from exporters in different
countries in each of the destination markets. For the competitor analysis, the top seller to the market
and sellers immediately above and below (in terms of value of exports of 080620 to the market) are
considered.
Market: Bangladesh
The competitors to Indian exports and their exports value is depicted by the chart below:
Figure 3

183
As is depicted by the graph above, UAE is the predominant exporter to Bangladesh with China being
the closest competitor to India. There is intense competition to exports of 080620 to Bangladesh.
Even with regards to TII India’s TII is lower to its closest competitors China and Pakistan, with UAE
having a high TII value of 12.64 for the year 2008.
Market: Nepal
The competitors to Indian exports and their exports value is depicted by the chart below:
The only competitor to Indian exports of Dry Grapes to Nepal is from China with exports of China
nearly equal to 3 times the value of exports from India.

184
Even with regards to the TII China has higher value as compared to India.
Market: Philippines
The competitors to Indian exports and their exports value is depicted by the chart below:
United States is the biggest exporter of Dry Grapes to Philippines, with India being a minor player. As
for close competitors, South Africa and Thailand are close competitors to India in terms of value.

185
As for TII, India has the highest TII with Philippines with a value of 23.25 in 2008.
Market: Singapore
The competitors to Indian exports and their exports value is depicted by the chart below:
India is a very minor player in the Singapore, with United States the biggest exporter with a value of
3582.83 ‘000 USD and India’s export to Singapore of 13.401 ‘000 USD.

186
Greece has the highest value of TII (61.89) with Singapore for the year 2008 signifying the importance
of the commodity in the trading relations between thee 2 countries. Exports of Dry Grapes does not
form a significant proportion of India’s exports to Singapore as compare to the proportion of world’s
Grapes to its total exports of Fruits & Nuts to Singapore.
Market: Sri Lanka
The competitors to Indian exports and their exports value is depicted by the chart below:
UAE is the biggest exxporter of Dry Grapes to Sri Lanka, with India exporting around 11.6% of value
of UAE exports to Sri Lanka. China and Singaore are close competitors to India (in terms of value of
exports).

187
India has a strong trade intensity index value of 1.22 for the year 2008, India’s closest competitor
Singapore has a higher TII value of 2.29 with Sri Lanka.
For detailed figures on Competitors’ exports in 2008 and their TII refer to Annexure I table 1 – Table 5
Relative Comparative Advantage: This section as part of the competitor’s analysis reveals the
comparative advantage of India and the competitors in various export markets.
Table 10
Bangladesh
Competitor 's
export of
080620
Competitors’
Total Export of
08
All
Competitor 's
Export of
080620
All
Competitor 's
Export of 08
Rel.
Comp.
Adv.
United Arab
Emirates 1497.62 7154.89 1880.422 81948.7 9.12
China 202.25 27697.56 1880.422 81948.7 0.32
India 148.278 43839.99 1880.422 81948.7 0.15
Pakistan 30.459 1251.18 1880.422 81948.7 1.06
Singapore 1.815 2005.08 1880.422 81948.7 0.04

188
As evident from the table, India’s Relative comparative advantage value is 0.15 which is lower than 1
and implying that with respect to all the competitors identified in the export market, India has no
comparative advantage and going by the values, United Arab Emirates has the highest comparative
advantage in the exports of Dry Grapes to Bangladesh.
Nepal
Competitor 's
export of
080620
Competitors’
Total Export of
08
All
Competitor 's
Export of
080620
All
Competitor 's
Export of 08
Rel.
Comp.
Adv.
China 210.312 8840.06 288.793 22378.426 1.84
India 78.481 13538.366 288.793 22378.426 0.45
With respect to competitors in the export of Dry Grapes to Nepal, India does not have a relative
comparative advantage. China the biggest exporter and the only competitor has the relative
comparative advantage in the exports of the goods to that market with the value of 1.84
Philippines
Competitor 's
export of
080620
Competitors’
Total Export of
08
All
Competitor 's
Export of
080620
All
Competitor 's
Export of 08
Rel.
Comp.
Adv.
United States 2602.07 29097.88 3170.389 135586.46 3.82
China 387.816 102352.52 3170.389 135586.46 0.16
India 79.789 164.97 3170.389 135586.46 20.68
South Africa 75.201 1137.55 3170.389 135586.46 2.83
Thailand 25.513 2833.54 3170.389 135586.46 0.39
India has a high relative comparative advantage (value of 20.68) in the exports of the Dry Grapes to
Philippines where South Africa also has the relative comparative advantage but with the lower value
of 2.83.

189
Singapore
Competitor 's
export of
080620
Competitors’
Total Export of
08
All
Competitor 's
Export of
080620
All
Competitor 's
Export of 08
Rel.
Comp.
Adv.
United States 3582.83 48666 3651.928 91107.023 1.84
Taiwan, China 21.141 2463.05 3651.928 91107.023 0.21
Hong Kong, China 13.841 1106.78 3651.928 91107.023 0.31
India 13.401 9178.199 3651.928 91107.023 0.04
Australia 12.841 29685.12 3651.928 91107.023 0.01
Greece 7.874 7.874 3651.928 91107.023 24.95
Both in terms of export value and having relative comparative advantage India stands below in
rankings in the Singapore market for the exports of the Dry Grapes.
Sri Lanka
Competitor 's
export of
080620
Competitors’
Total Export of
08
All
Competitor 's
Export of
080620
All
Competitor 's
Export of 08
Rel.
Comp.
Adv.
United Arab
Emirates 1214.25 3355.72 1684.789 18450.264 3.96
China 217.024 12110.96 1684.789 18450.264 0.20
India 141.016 1794.787 1684.789 18450.264 0.86
Singapore 108.499 735.797 1684.789 18450.264 1.61
Germany 4 453 1684.789 18450.264 0.10
Vis-à-vis the competitors in the Sri Lankan Markey India does not have relative comparative
advantage, where United Arab Emirates has the highest relative advantage in the exports of Dry
Grapes to Sri Lanka.

190
Tariff and Non Tariff measures on 080620
The tariff and non Tariff as imposed by the importing countries on import of Dry Grapes are given in
the following table:
Major
Markets
Import
tariff Other Tariff where ever applicable
NTM
% NTM
Tariff description
Tariff
rate
Statutory Rate 100.0%
Infrastructural
Surcharge 2.5%
Supplementary Duties 2.5%
Bangladesh 37.5% VAT 15.0% 0.0%
Sri Lanka 25.0% 0.0%
Nepal 15.0% 0.0%
Philippines 3.0% 0.0%
0.0% Automatic License
Singapore 0.0% 100.0%
License to protect plant
health
Clearly, as is evident from the table 15, Bangladesh imposes the maximum import duty on the import
of Dry Grapes, besides other tariff that is applicable like VAT, Infrastructural Surcharge etc.
Philippines attract a very low tariff of 3% on import of Dry Grapes and also impose no NTMs.
Although Singapore does not impose any duty on the duty of Dry Grapes, however it has put up some
of the Non tariff measures.
Preferential / Free Trade Agreement
The below table depicts any preferential / Free trade agreement that the identified exports market
have and the tariffs on 080620 under such arrangement.
Country FTA/PTA Rate
Bangladesh None -
Sri Lanka None -
Nepal None -
Philippines ASEAN -
Singapore ASEAN -

191
As is evident from table 16 there is no preference given by the identified markets to any exporting
countries in terms of import tariffs.
Tariff Rate Quotas, SSG and Tariff Escalation on Import of 080620
Markets TRQ Quantity (METRIC TONS)
In quota -
Duty
Out Quota -
Duty
Bangladesh No No No
Sri Lanka No No No
Nepal No No No
Philippines No No No
Singapore No No No
Clearly there are no TRQ imposed by the identified markets on the import of Dry Grapes which a
healthy signal for the exporters.
Special Safeguard Mechanisms
Country
Volume
Trigger
Price
Trigger
Bangladesh NO NO
Sri Lanka NO NO
Nepal NO NO
Philippines NO NO
Singapore NO NO
As given in the table, no country has resorted to Special Safeguard Mechanisms to impose barriers to
import of Dry Grapes. It is a healthy signal with regards to all the markets under study.

192
Tariff Escalation
Import Duty Structure
Market Primary
Semi
Processed Processed
Bangladesh 37.5% 37.5%
Sri Lanka 25.0% 25.0%
Nepal 10.0% 15.0%
Philippines 10.0% 3.0%
Singapore 0.0% 0.0%
Semi Processed is Dry Grapes and Primary is Fresh Grapes
As can be seen, some tariff escalation is observed in the Nepalese markets.
Subsidies
Markets
Product
Specific
Non Product
Specific Green Box
Special and
Differential
Treatment –
"Development
Programmes" Currency
Bangladesh
Not
Applicable 40.18 42.01 0.22 Million USD
Sri Lanka
Not
Applicable Not Applicable 4132.71 1525.86
Million Sri
Lankan
Rupees
Nepal
Not
Applicable Not Applicable
Not
Applicable
Not
Applicable
Philippines
Not
Applicable Not Applicable 11040982 2866258 000 Pesos
Singapore
Not
Applicable Not Applicable
Not
Applicable
Not
Applicable
There is a high Green Box subsidy provided by Philippines, Bangladesh and Sri Lanka to its domestic
agriculture market. Besides, Bangladesh Government provides aid in the form of non product specific
subsidy to its farmers. These provide an edge to the farmers in Bangladesh, Sri Lanka and Philippines.

193
ANNEXURE I: Trade Intensity Index between major markets and other suppliers
Bangladesh
Competitor 's
export of 080620
Competitors’
Total Export of 08
Total export of
080620
Total export
of 08 TII
United Arab
Emirates 1497.62 7154.89 1881.1 113599.879 12.64
China 202.25 27697.56 1881.1 113599.879 0.44
India 148.278 43839.99 1881.1 113599.879 0.20
Pakistan 30.459 1251.18 1881.1 113599.879 1.47
Singapore 1.815 2005.08 1881.1 113599.879 0.05
Nepal
Competitor 's
export of 080620
Competitors’
Total Export of 08
Total export of
080620
Total export
of 08 TII
China 210.312 8840.06 288.793 31289.203 2.58
India 78.481 13538.366 288.793 31289.203 0.63
Philippines
Competitor 's
export of 080620
Competitors’
Total Export of 08
Total export of
080620
Total export
of 08 TII
United States 2602.07 29097.88 3184.76 153106.789 4.30
China 387.816 102352.52 3184.76 153106.789 0.18
India 79.789 164.97 3184.76 153106.789 23.25
South Africa 75.201 1137.55 3184.76 153106.789 3.18
Thailand 25.513 2833.54 3184.76 153106.789 0.43
Singapore
Competitor 's
export of 080620
Competitors’
Total Export of 08
Total export of
080620
Total export
of 08 TII
United States 3582.83 48666 4246.92 262829.95 4.56
Taiwan, China 21.141 2463.05 4246.92 262829.95 0.53
Hong Kong, China 13.841 1106.78 4246.92 262829.95 0.77
India 13.401 9178.199 4246.92 262829.95 0.09
Australia 12.841 29685.12 4246.92 262829.95 0.03
Greece 7.874 7.874 4246.92 262829.95 61.89

194
Sri Lanka
Competitor 's
export of 080620
Competitors’
Total Export of 08
Total export of
080620
Total export
of 08 TII
United Arab
Emirates 1214.25 3355.72 1685.095 26125.313 5.61
China 217.024 12110.96 1685.095 26125.313 0.28
India 141.016 1794.787 1685.095 26125.313 1.22
Singapore 108.499 735.797 1685.095 26125.313 2.29
Germany 4 453 1685.095 26125.313 0.14

195
1. Trend
India's Export to the World
2003 2004 2005 2006 2007 2008 CAGR
14.729 26.636 271.094 40.003 15.008 37.476 20.53
figs in Mil $
The trend is of a sharp increase in exports in 2005 and then again it bottomed out in 2007. Again in
2008 it rose slightly.
2. Revealed Competitive Advantage:
India's Export World Export
YEAR
Preserved
Citrus Total Agri Preserved Citrus Total Agri RCA
2003 14.729 84861.2 338155.341 24958165.93 0.012
2004 26.636 92286.715 363330.032 28188641.54 0.022
2005 271.094 154926.231 434568.634 30765153.1 0.123
2006 40.003 193771.264 485088.795 35218728.16 0.015
2007 15.008 197329.655 574615.606 43836079.57 0.006
2008 37.476 266477.73 526873.269 43911597.7 0.0119
Figs In Mil $
Preserved Citrus Fruits
[200830]

196
The RCA also shows the same trend as the trend of exports and thus we see it has come down to 0.012
in 2008.
3. Major Export Destinations:
Country 2003 2004 2005 2006 2007 2008 CAGR
UK 3.925 5.581 87.528 18.224 0.001 -87.366
UAE 8.957 20.349 7.818 1.011 -51.6723
USA 1.571 5.751 1.346 24.195 148.7997
United Kingdom is a market where the exports have practically become non existent which is a cause
of concern. On the other hand US is a very promising market.

197
4. Market Fluctuations:
2003 2004 2005 2006 2007 2008
UK UAE UK UK USA USA
UAE UK UAE UAE UAE UAE
USA USA USA USA UK UK
As we see there is heavy fluctuation in the markets with US coming up to dominant position in the
recent years while share of UK has declined.
5. India’s Trade Intensity Index with major markets:
UAE
India's export of
6 digit to market
India's export of
2 digit to market
World's Export of
6 digit to market
World's Export of
2 digit to market TII
2003 4650.887 70.721 124790.243 0
2004 8.957 3577.56 244.117 122922.98 1.26
2005 20.349 5857.419 2040.117 178357.913 0.30
2006 7.818 7581.459 2130.915 209854.452 0.10
2007 1.011 11335.64 2308.074 299854.922 0.01
2008 10390.515 2798.173 257520.384 0

198
United
Kingdom
India's export of
6 digit to market
India's export of 2
digit to market
World's Export of
6 digit to market
World's Export of
2 digit to market TII
2003 3.925 6438.725 35543.254 2048266.831 0.035
2004 5.581 6388.512 39063.958 2267940.061 0.050
2005 87.528 11399.349 40700.994 2325584.729 0.437
2006 18.224 15640.636 42268.885 2758702.797 0.0760
2007 0.001 16700.588 42036.427 3454306.624 4.92E-06
2008 19563.05 19565.195 3343836.551 0
United
States
India's export of
6 digit to market
India's export of 2
digit to market
World's Export of
6 digit to market
World's Export of
2 digit to market TII
2003 23418.563 117272.839 2952651.911 0
2004 24490.151 125256.125 3411643.107 0
2005 1.571 29976.807 144340.572 3705853.868 0.0013
2006 5.751 47779 179151.143 4157959.386 0.0027
2007 1.346 41497.442 212738.971 5269385.062 0.0008
2008 24.195 58702.257 241857.032 5247209.412 0.0089

199
As was expected TII with UK and UAE is going down rapidly while that with US has increased
exponentially. So the UK and UAE markets need to be considered properly for exports.
6. Competitor's TII(2007 only):
Market Name
United
Kingdom
Competitors
Competitor's
export of 6
digit to market
Competitor's
export of 2 digit to
market
World's Export
of 6 digit to
market
World's Export
of 2 digit to
market TII
Spain 18195.671 221158.751 42036.427 3454306.624 6.76
Hong
Kong(China) 1.272 1124.56 42036.427 3454306.624 0.092
Poland 0.773 63279.337 42036.427 3454306.624 0.001
Thailand 0.537 58868.823 42036.427 3454306.624 0.0008
Ghana 0.392 429.973 42036.427 3454306.624 0.074
India 0.001 16700.588 42036.427 3454306.624 4.92E-06
Market Name
United Arab
Emirates
Competitors
Competitor's
export of 6
digit to market
Competitor's
export of 2 digit to
market
World's Export
of 6 digit to
market
World's Export
of 2 digit to
market TII
China 1510.275 59626.237 2308.074 299854.922 3.29
Thailand 5.385 17724.532 2308.074 299854.922 0.039
Germany 4 4048 2308.074 299854.922 0.128
Korea, Rep. 1.206 102.242 2308.074 299854.922 1.53
Morocco 1.202 33.878 2308.074 299854.922 4.60
India 1.011 11335.64 2308.074 299854.922 0.011

200
Market Name United States
Competitors
Competitor's
export of 6 digit to
market
Competitor's
export of 2 digit to
market
World's Export
of 6 digit to
market
World's Export
of 2 digit to
market TII
China 128214.325 958213.248 212738.971 5269385.062 3.31
Italy 3.716 105926.111 212738.971 5269385.062 0.00086
Japan 1.915 16241.313 212738.971 5269385.062 0.0029
India 1.346 41497.442 212738.971 5269385.062 0.0008
Russian Fed. 0.947 4402.093 212738.971 5269385.062 0.0053
Chile 0.691 101201.186 212738.971 5269385.062 0.00017

201
As we see in all the three major markets , India’s TII is negligible compared to the topmost players and
even with the nearer competitors. So government initiatives need to be properly evaluated and used
for exporting to these markets.
7. Relative CA(2007):
Market Name
United
Kingdom
Competitors
Competitor's
export of 6
digit to market
Competitor's
export of 2 digit
to market
All
Competitior's
Export of 6 digit
to market
All
Competitior's
Export of 2 digit
to market Rel. CA
Spain 18195.671 221158.751 18198.646 361562.032 1.63
Hong
Kong(China) 1.272 1124.56 18198.646 361562.032 0.022
Poland 0.773 63279.337 18198.646 361562.032 0.0002
Thailand 0.537 58868.823 18198.646 361562.032 0.0001
Ghana 0.392 429.973 18198.646 361562.032 0.018
India 0.001 16700.588 18198.646 361562.032 1.19E-06

202
Market Name
United Arab
Emirates
Competitors
Competitor's
export of 6 digit to
market
Competitor's
export of 2 digit
to market
All
Competitior's
Export of 6 digit
to market
All
Competitior's
Export of 2 digit
to market Rel. CA
China 1510.275 59626.237 1523.079 92870.529 1.544
Thailand 5.385 17724.532 1523.079 92870.529 0.0185
Germany 4 4048 1523.079 92870.529 0.0602
Korea, Rep. 1.206 102.242 1523.079 92870.529 0.7192
Morocco 1.202 33.878 1523.079 92870.529 2.163
India 1.011 11335.64 1523.079 92870.529 0.0054
Market Name United States
Competitors
Competitor's
export of 6 digit
to market
Competitor's
export of 2 digit
to market
All Competitior's
Export of 6 digit
to market
All
Competitior's
Export of 2 digit
to market Rel. CA
China 128214.325 958213.248 128222.94 1227481.393 1.280
Italy 3.716 105926.111 128222.94 1227481.393 0.0003
Japan 1.915 16241.313 128222.94 1227481.393 0.0011
India 1.346 41497.442 128222.94 1227481.393 0.0003
Russian Fed. 0.947 4402.093 128222.94 1227481.393 0.0020
Chile 0.691 101201.186 128222.94 1227481.393 6.54E-05

203
With respect to its competitors, India stands in a disadvantaged position when it comes to these three
markets as can be seen from the graphs above.
8. Tariff and Non Tariff Measures:
Selected importers Import tariff NTM % NTM
United Kingdom 16% na
United Arab Emirates 5% na
United States 4% 100
9. FTA and PTA:
Country FTA/PTA Rate
United Arab Emirates None
United Kingdom None
Carribean basin economic recovery
act 0%
US-Canada FTA 0%
US-Israel FTA 0%
ANDEAN Trade Preference Act 0%
United States
US-Mexico Act 0%

204
10. TRQ:
Tariff Rate Quota Structure of 200830 in major export destinations
Markets TRQ Quantity (METRIC TONS) In quota - Duty Out Quota - Duty
United Kingdom No No No
United Arab Emirates No No No
United States No No No
11. Special safeguards :
Presence of Special Safeguard Duty
Country Volume Trigger Price Trigger
United Kingdom NO NO
United Arab Emirates NO NO
United States NO NO
12. Subsidies:
Subsidy Structure on 200830
in identified markets
Markets Product specific
Non Product
Specific
Green
Box
Special and
Differential
Treatment –
"Development
Programmes"
United
Kingdom NA NA NA NA
United Arab
Emirates NA NA
UAE
GB.pdf USA SD.pdf
United States NA USA NPS.pdf
USA
GB.pdf USA PS.pdf
13. Conclusions:
a) UK is a good market for the exports but due to high duties maybe exports are suffering .
b) UAE and US are comparatively better although we have to go a long way before we can
really make any headway in these markets.

205
FFFFruits and dried fruits constitute a wide dimension for Indian economy, because of the climatic
diversity in the country accounts to grow spectrum of fruits, fresh or dried. The fruits are considered
important by the horticulture board of India, mostly grown in the areas of Jammu & Kashmir,
Himachal Pradesh, hilly regions of north Uttar Pradesh, Tamil Nadu, Maharashtra, Karnataka,
Gujarat, Andhra Pradesh, Assam, Madhya Pradesh, Rajasthan, Punjab, Tripura, West Bengal and
Orissa. The fruits range to mango, banana, pineapple, oranges, grapes, apple, lemon etc. India is
world's largest producer of mango and banana and places 4th and 5th in pineapple and orange
production respectively.
An instance of a dried fruit under HS code 081340 is dried apricot or apricot oil that has plenty of
manufacturers in Andhra Pradesh.
Dry Fruits [081340]Dry Fruits [081340]Dry Fruits [081340]Dry Fruits [081340]

206
I. Trend Analysis of Other fruits (dried ones)
India's Export to the World
Code 2003 2004 2005 2006 2007 CAGR
081340 3009.00 2632.00 5542.00 6571.00 7966.00 27.56
Figs in '000 $
The CAGR from the year 2003 to 2007 is 27.56%. The overall trend shows a very positive growth rate
during that period. Except for the year 2004, the growth rate has been consistent.
It can be seen from the above graph that India’s export of HS code 081340 has been increasing at a
consistent rate except for the year 2004 when it witnessed a small decline.
Revealed Comparative Advantage for Dry Fruits
Year
India's
exports
India's total
exports
World's
exports
World's total
exports RCA
2003 3009.00 527514.00 260540.00 35859790.00 0.79
2004 2632.00 687592.00 235360.00 39224400.00 0.64
2005 5542.00 868298.00 254469.00 45723607.00 1.15
2006 6571.00 855428.00 290655.00 48939917.00 1.29
2007 7966.00 873448.00 367128.00 55824814.00 1.39
Figs In '000 $

207
The product had an RCA value of 0.8 in the year 2003. The value declined to 0.64 in the year 2004. It
can be observed that for these two years India was worse off than the world in exporting 081340. It
had a revealed comparative disadvantage as the value was less than 1. RCA in the year 2005 increased
considerably to 1.15. This shows that India gained comparative advantage and became better than
world in exporting this product. The RCA values for the years 2006 and 2007 were 1.29 and 1.38 which
shows that during these years India had gained in comparative advantage as values had been rising.
Over the years India’s comparative advantage in 081340 has increased.
Major Export Destinations
Partner Name 2003 2004 2005 2006 2007 2008 CAGR
Netherlands 16.458 12.77 41.24 6.753 43.237 NA 27.31
United Arab
Emirates 527.399 492.912 862.877 1918.286 2160.77 2101.27 42.27
Syrian Arab
Republic 133.385 122.823 849.946 1022.542 866.933 1169.02 59.66
Saudi Arabia 267.752 198.307 495.71 352.251 606.449 810.889 22.67
United Kingdom 171.939 304.305 577.926 431.545 445.923 549.653 26.90
India’s major export destinations for 081340 are Netherlands, UK, UAE, Saudi Arabia and Syrian Arab
Republic. The export to all these countries except UK declined during the period 2004.

208
The exports to Netherlands have not been consistent. It experienced a huge surge in year 2005,
followed by a huge decline in 2006, further accompanied by a big surge in 2007. The CAGR for the
product for the time period 2003 to 2007 was 27%.
UAE is among the countries that has shown consistent rise in Indian exports of 081340 over the years.
The interesting fact is that while the Indian exports fell to other markets in 2006, they rose significantly
(more than doubled) to UAE. The CAGR over the period 2003-08 has been 42.27%

209
Indian exports to Saudi Arabia have shown a rising trend across the years, with a sight decline in 2004
and 2006. The CAGR over the years has been substantial at 22.67%.
The exports to Syrian Arab Republic were not substantial in the years 2003 and 2004, but experienced
a momentous increase in the year 2005, and sustained at higher levels for the upcoming years. The
CAGR over the years has been 59.67%.

210
India’s export to UK has been consistently rising except for the significant decline in year 2006. The
CAGR for the year 2003 to 2008 has been 26.9%.
Market Fluctuation
2003 2004 2005 2006 2007
United Arab
Emirates
United Arab
Emirates
United Arab
Emirates
United Arab
Emirates
United Arab
Emirates
Saudi Arabia United Kingdom
Syrian Arab
Republic
Syrian Arab
Republic
Syrian Arab
Republic
United Kingdom Saudi Arabia
United
Kingdom
United
Kingdom Saudi Arabia
Syrian Arab
Republic
Syrian Arab
Republic Saudi Arabia Saudi Arabia United Kingdom
Netherlands Netherlands Netherlands Netherlands Netherlands
The graph above shows the ranking of selected markets over the years. It can be observed that UAE
has been consistent topper. Syria rose in its position substantially in 2005 and maintained its position
at number two. Netherlands has consistently remained the weakest destination out of the selected five
destinations. UK and Saudi Arabia have also managed to stay among top 4 positions over the years.

211
Competitors in Identified Export Markets
Figure 1: Competitor analysis in Netherlands
It can be seen from the above pie chart that Germany, Spain, US and France are major exporters to
Netherlands. India’s share (or that of any other nation than those mentioned above) in the exports of
081340 to Netherlands is very negligible.
Figure 2: Competitors Analysis: UAE
It can be seen from above graph that India has just 30% share in exports to UAE. Major competitors of
India are Thailand and Pakistan, although all the three players have more or less the same market
share in UAE.
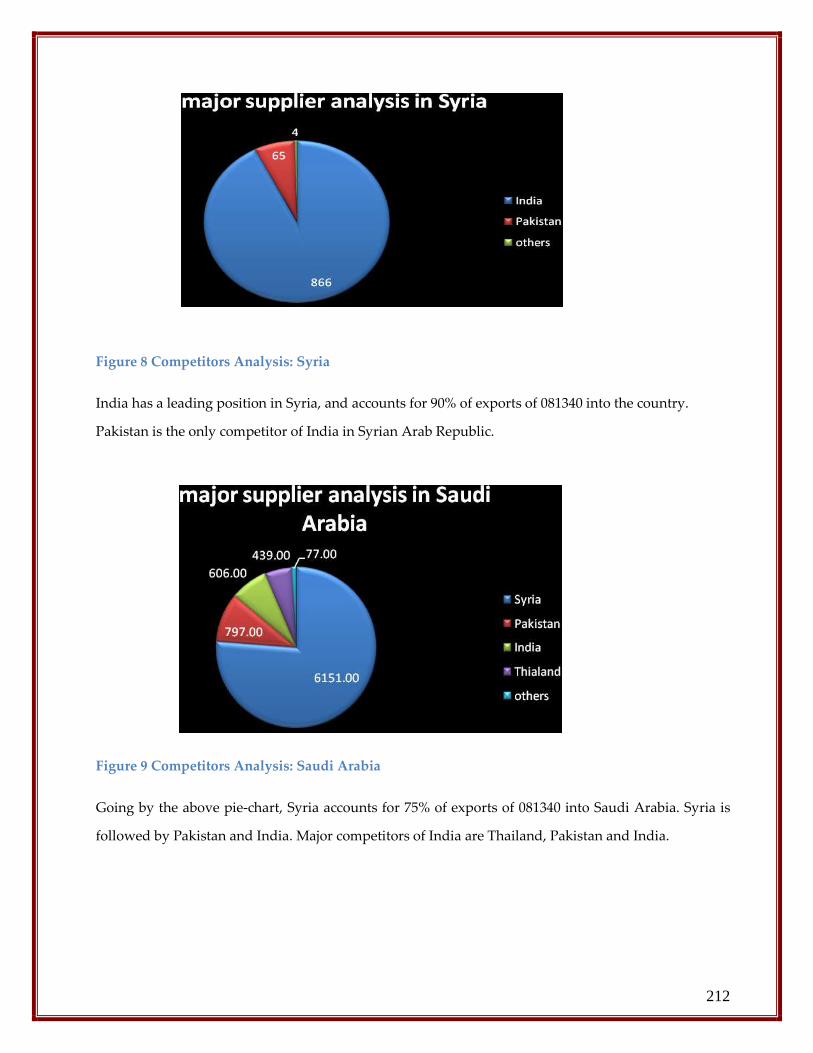
212
Figure 8 Competitors Analysis: Syria
India has a leading position in Syria, and accounts for 90% of exports of 081340 into the country.
Pakistan is the only competitor of India in Syrian Arab Republic.
Figure 9 Competitors Analysis: Saudi Arabia
Going by the above pie-chart, Syria accounts for 75% of exports of 081340 into Saudi Arabia. Syria is
followed by Pakistan and India. Major competitors of India are Thailand, Pakistan and India.

213
Figure 10 Competitors Analysis: UK
Germany, Spain, Italy and France have major share of exports in UK. These four nations together,
account for around 60% of exports into UK.
Trade Intensity Index with Major Export Destinations

214
India has achieved high TII values in Syria. This shows that India is performing relatively well
bilaterally with Syria then rest of the world at 2digit level. A very high value of 19 in the year 2004
shows over saturation in that market in that year. TII in Syria is on decline. India’s TII has always been
negligible in Netherlands. This shows that India is performing relatively worse bilaterally with Syria
then rest of the world at 2digit level. TII in other three markets, i.e., UAE, UK and Saudi Arabia have
been fluctuating between .5 and 3, though most of the times, they have been greater than 1.
II. TII: Analysis of Competitors
on a 6 digit level on 2 digit level
on a 6 digit
level on 2 digit level
Netherlands
Competitor 's
export
Competitor’s
Total Export
World
Export
World Total
Export TII
Germany 2022 120662 5967 3830130 10.76
Spain 888 454323 5967 3830130 1.25
US 855 187513 5967 3830130 2.93
France 839 211375 5967 3830130 2.55
In Netherlands, TII of Germany is quite high at 10.76. Even TII of Spain, US and France are higher than
India. India, unlike these competitors, has a low TII of .24 in Netherlands.
on a 6 digit level on 2 digit level
on a 6 digit
level on 2 digit level
United
Arab
Emirates
Competitor 's
export
Competitors's
Total Export World Export
World Total
Export TII
Pakistan 2905 17376 7530 536461 11.91
India 2297 112573 7530 536461 1.45
Thailand 2110 7950 7530 536461 18.91
In UAE, TII of India is much less than that of other competitors, viz, Pakistan and Thailand.
on a 6 digit level on 2 digit level
on a 6 digit
level on 2 digit level
Saudi
Arabia
Competitor 's
export
Competitors's
Total Export World Export
World Total
Export TII
Syria 6151.00 20525.00 8070.00 429261.00 15.94
Pakistan 797.00 8996.00 8070.00 429261.00 4.71
India 606.00 63639.00 8070.00 429261.00 0.51
Thialand 439.00 2032.00 8070.00 429261.00 11.49

215
In Saudi Arabia, TII of India is .51 (less than 1) unlike that of other competitors, viz, Syria, Thailand
and Pakistan. Syria has highest TII of 15.94 followed by Thailand and Pakistan.
on a 6 digit level on 2 digit level
on a 6 digit
level on 2 digit level
Syrian
Arab
Republic
Competitor 's
export
Competitors's
Total Export World Export
World Total
Export TII
India 866 8169 935 49910 5.66
Pakistan 65 347 935 49910 10.00
In Syrian Arab Republic, Pakistan is the only competitor of India, and has TII of 10, higher than that of
India’s TII of 5.66.
on a 6 digit level on 2 digit level
on a 6 digit
level on 2 digit level
United
Kingdom
Competitor 's
export
Competitors's
Total Export World Export
World Total
Export TII
Germany 6123 85195 36605 4019636 7.89
Spain 5652 689956 36605 4019636 0.90
Italy 4333 300695 36605 4019636 1.58
France 4096 357011 36605 4019636 1.26
In UK, India has low TII of 0.91. Although Germany has high TII of 7.89, Italy and France have TIIs
slightly greater than 1.
IX: RCE: Analysis of competitors
on a 6 digit
level on 2 digit level
on a 6 digit
level
on 2 digit
level
Netherlands
Competitor
's export
Competitors's
Total Export
All
competitors
Export
All
competitors
Total Export RCE
Germany 2022 120662 3448.237 530217.627 2.58
France 839 187513 3448.237 530217.627 0.69
Thailand 358 7517 3448.237 530217.627 7.32
China 186 100773 3448.237 530217.627 0.28
India 43.237 113752.627 3448.24 530217.63 0.06
In Netherlands, India has a very low RCE compared to its competitors stating that there is a long road
ahead to go.

216
on a 6 digit
level on 2 digit level
on a 6 digit
level
on 2 digit
level
United Arab
Emirates
Competitor
's export
Competitors's
Total Export
All
competitors
Export
All
competitors
Total Export RCE
Pakistan 2905 17376 7312 137899 3.15
India 2297 112573 7312 137899 0.38
Thailand 2110 7950 7312 137899 5.01
In UAE also, India has very low RCE, meaning that its exports of 081340 as a proportion to those of 08
are very low.
on a 6 digit
level on 2 digit level
on a 6 digit
level
on 2 digit
level
Saudi
Arabia
Competitor
's export
Competitors's
Total Export
All
competitors
Export
All
competitors
Total Export RCE
Syria 2022 120662 4604.00 973873.00 3.54
Pakistan 888 454323 4604.00 973873.00 0.41
India 855 187513 4604.00 973873.00 0.96
Thialand 839 211375 4604.00 973873.00 0.84
In Saudi Arabia, RCE of Syria is much greater than 1 at 3.54, while that of Pakistan, India and Thailand
is less than 1.
on a 6 digit
level on 2 digit level
on a 6 digit
level
on 2 digit
level
Syrian Arab
Republic
Competitor
's export
Competitors's
Total Export
All
competitors
Export
All
competitors
Total Export RCE
India 866 8169 935 49910 5.66
Pakistan 65 347 935 49910 10.00
In Syria, Pakistan is the only competitor of India. Although its RCE is greater than 1, but half of that of
Pakistan.
on a 6 digit
level on 2 digit level
on a 6 digit
level
on 2 digit
level
United
Kingdom
Competitor
's export
Competitors's
Total Export
All
competitors
Export
All
competitors
Total Export RCE
Germany 6123 85195 20649 1486189 5.17
Spain 5652 689956 20649 1486189 0.59
Italy 4333 300695 20649 1486189 1.04
France 4096 357011 20649 1486189 0.83
India 445 53332 20649 1486189 0.60

217
In UK also, India has a RCE much less than 1. While Germany has highest RCE of 5.17, Italy has a RCE
slightly greater than 1. The RCE of Spain and France are also less than 1.
III. Any FTAs or PTAs
Country FTA/PTA Rate
0813401000 Preference for S-Africa 4.4
0813401000 Preference for Morocco 2.8
0813403000 Preference for S-Africa 3.4
0813405000 Preference for Egypt 1
0813405000 Preference for Morocco 1
0813409515 Preference for Morocco 1.2
0813409520 Preference for Morocco 1.2
Netherlands and
UK
0813409590 Preference for Morocco 1.2
UAE None
Syria None
Saudi Arabia None
As shown above, Netherlands and UK have preference for South Africa, Morocco, Egypt for certain
products at 10 digit level. The rates applicable on 081340 in FTAs are given in the figure. The product
is not covered in any FTA by other countries.

218
IV. TARIFF BARRIERS AND NTMs
ad valorem tariff barrier NTM % Description
Saudi Arabia 5.00% 0%
United Kingdom 1.00% 12.50% prior surveillance
Syria 26.00% na
Netherlands 1.00% 12.50% prior surveillance
United Arab
Emirates 5.00% na
As shown above, the tariffs in Syria are very high. Besides, there are non-tariff barriers in UK and
Netherlands in the form of prior surveillance requirements.
The above table shows other tariff barriers on some products at 10 digit level in EU.
SAFEGUARD DUTIES
Presence of Special Safeguard Duty
Country Volume Trigger Price Trigger
UK NO NO
Netherland NO NO
Syria NO NO
Saudi Arabia NO NO
United Arab Emirates NO NO
No safeguard duties are applicable to the product 081340 in any of the above market destinations.
Other tariff
barriers
European
Union 0813401000 0813403000 0813405000 0813409515 0813409520 0813409590
Description
Ad-valorem
Equivalent
MFN Rate 4.7 6.4 2 2.4 2.4 2.4
GSP Rate 0 4.4
GSP for LDC 0
Saudi Arabia
MFN Rate 12

219
V. Tariff escalation and TRQs
dry grapes fresh grapes
grape
wine
Market Primary Input Semi Processed Processed
Netherlands 0.60% 8.97% 5.98%
Saudi
Arabia
0.00% 0.00% 0.00%
Syrian Arab
Republic
30.00% 30.00% 117.41%
United
Arab
Emirates
0.00% 0.00% 50.00%
United
Kingdom
0.60% 8.97% 5.98%
As shown above, there is highest tariff escalation in Syrian Arab Republic, followed by UAE.
Tariff quotas were not invoked by any countries during the years 2003 to 2007 on 200899.
XII: SUBSIDY STRUCTURE
Subsidy Structure on 081340 in identified markets
Markets
Product
Specific
Non
Product
Specific
Green
Box
Special and
Differential
Treatment –
"Development
Programmes" Currency Year
United
Kingdom
Applicable
(on
apricots) 938 20404
MILLION
EUROS
2002-
03
UAE
Not
Applicable 900000 900000 (Dh)
2000-
01
Netherlands
Applicable
(on
apricots) 938 20404
MILLION
EUROS
2002-
03
Saudi
ARABIA
Not
Applicable 834 674
MILLION
SRI 2006
Syria
Not
Applicable

220
As can be seen from the above table that product specific subsidy was given to some items that come
under other fruits (dried nes), say, apricots, in UK and Netherlands. No product specific subsidy was
given in the other markets to 081340. So a producer need not worry exporting 081340 to these
countries. The exporter should keep an eye over Non Product Specific support, Green Box support
and Special Treatment given by the countries to agricultural sector as whole to have an overall idea of
support given by national governments to agricultural sector. A very high support can affect the
Exporter adversely as his product may not remain competitive in that country.
CONSTRAINTS IN GRAPE PRODUCTION DEVELOPMENT
Grape is cultivated over an area of 34,000 hectares with an annual production of 1,000,000 tonnes.
Although, the returns per unit area of land are very high with grape cultivation, the area under grapes
is not expanding fast owing to the high initial cost of establishing the vineyards and high recurring
cost of production. The risk of losing a crop due to unprecedented changes in weather is also very
high. Since the highest productivity in grapes has been achieved, efforts are needed to extend grape
cultivation to newer areas. Soil and water salinity and drought are the impediments in this direction,
for which suitable rootstocks are to be identified.
Although grape cultivation is considered as highly remunerative, the area under grapes is confined to
only 34,000 hectares due to the following constraints.
a) Heavy initial investment for establishing a vineyard.
b) High recurring costs in vineyard management.
c) Narrow variety base and lack of diversity in utilization of the germplasm available in grape
growing countries.
d) High risk of losing the crop due to unprecedented changes in weather.
e) Soil and water salinity in Maharashtra and drought in the hot tropical areas.
f) Short period available for ripening in the north.
g) Very low proportion of export quality grapes.
h) Wine is not a popular drink at present.
i) Marketing problems in table grapes.

221
Strategies to boost Grape Export from Andhra Pradesh
AP has the distinction of achieving the highest productivity in grapes in the world, with an average
yield of 30 t/ha.
a) Sustaining productivity and minimizing risks in grape cultivation is possible because of the
availability of a variety of agro-climatic regions suitable for grape cultivation for table, raisin and wine
grapes.
b) Technologies to achieve high productivity are currently available.
c) Scope for double cropping in certain regions and harvesting round the year in certain varieties is
practically feasible.
d) Technologies to produce export quality grapes and quality raisins are available.
There is a need to diversify the uses of grapes. Currently more than 80 percent of the produce is used
for table purposes. The major bulk of the produce is harvested in March-April, but as cold storage
facilities are currently inadequate there are frequent market gluts. Diversification of uses as wine/juice
and export of table grapes can ease the marketing problems. Maintenance of quality of table grapes by
crop regulation is the priority consideration to increase exports. For the survival of the grape industry
in India, the produce should be quality and cost competitive. Future efforts are to be concentrated in
this direction.
State had to strictly abide by EurepGap standards following the rejection of some containers by
importers owing to pesticide residues. As the cost of certification was high at Rs 70,000, the exporters
have urged the National Horticulture Board to raise subsidy levels from 30 per cent to 50 per cent.
Besides adherence to global standards, exporters are also required to go in for sample testing at
certified laboratories like Vimta Labs in the city.
Sampling needs to be carried out for chemical/ residues with cost for the tests pegged around Rs 8,000
per hectare.With exporters starting to use bio-pesticides, production costs have started to spiral and
therefore cost effective ways of complying to these standards needs to be formulated.
Potential for the agri export zone (AEZ), especially set up a year ago for grapes in the three grape-
growing districts, except for a cold storage linkage in the area, there was no perceptible benefit from
carving out a special zone for grapes. State may like to have a relook on the same.

222
GOVERNMENT POLICIES AND PLANS FOR RESEARCH AND DEVELOPMENT OF GRAPES
The Government of India is supporting the grape industry of the country in the following ways:
a) Encourage and support the farmers for establishing the vineyards and installing drip irrigation
systems by providing soft loans and subsidies.
b) Provide research support to sustain the productivity of grapes under adverse situations.
c) Promote and support the export of fresh grapes by training the growers and providing soft loans
and subsidies for pre-cooling and cold storage facilities.
Research on grapes is carried out by the Indian Council for Agricultural Research (ICAR) Institutes
and State Agricultural Universities at different centres under the All India Coordinated Research
Project on Grapes. The National Research Centre for Grapes (ICAR) located at Pune, Maharashtra is
the focal point for conducting and coordinating the research activities on grapes throughout the
country. WTO cell of AP can keep a regular update on the research findings and explore new uses of
grapes to cater to the demands of the identified markets.

223
Mangoes are one of the most important and popular Asian fruits. India is the main producer,
growing more than half of the world's supply. Mango, the most important fruit of India, is grown in
an area of 1.23 million ha with an annual production of 10.99 million tonnes, which accounts for 63 per
cent of the total world production. The mango accounts for 22.06 per cent of total area under fruit and
23.93 per cent of total fruit production in the country. There are thought to be 24 major cultivars in the
Indian sub-continent, and possibly a thousand lesser-known varieties that are often only available
locally and not widely marketed. Some of the more well-known varieties include alphonso,
banganapalli, langra, malda, mulgoa, totapuri, chausa and dashehari.
Though Uttar Pradesh has the largest area of 0.27 million hectares under mango, Andhra Pradesh is
India's second largest producer of mangoes. It has the highest productivity of 12 tonnes per hectare.
While Andhra Pradesh produces 3.07 million tonnes of mango, U.P., Bihar and Karnataka produce
2.39, 1.79 and 0.92 million tonnes, respectively. Varieties grown in the state of Andhra Pradesh
includes Banganpalli, Bangalora,Cherukurasam, Himayuddin & Suvarnarekha.
Andhra Pradesh continues to be the leading producer in the country enabling India to account for 63
per cent of world production. However, the country still occupies only third position in total mango
exports. This section of the report will assist the mango exporters of Andhra Pradesh the current status
of exports from the state, profitability of business in fresh mango versus the processed varieties of
mango and to identify the right export markets for the same. The commodities handled here are as
follows:
080450 Mangoes fresh
080450 Mangoes sliced dried
080450 Mango pulp
081290 Mango slices in brine
200980 Mango juice
200899 Mango squash
Mango: Fresh and Processed [080450]

224
Trend in Exports of Fresh Mango from India (US Million $)
2003 2004 2005 2006 2007 2008 CAGR
72873.83 93346.4 115644.3 153379.3 162723.1 214580.9 24%
Mango exports are growing at a positive rate of 24% for last five years from 72 bn$ to 214 bn US$.
Exports of 080450
0
50000
100000
150000
200000
250000
2003 2004 2005 2006 2007 2008
Exports
This rising trend in exports of fresh mango is a positive sign for the mango exporters from Andhra
Pradesh as it indicates the acceptance of Indian mangoes in the international market.
Commodity
Code
Commodity
Name 2003 2004 2005 2006 2007 2008 Growth
08045040 Mango pulp 1.31 52.7 70.24 82.26 111.71 126.66 149.50
20089911 Mango squash 0.22 1.06 1 0.63 1.52 12.2 123.25
08045030
Mangoes sliced
dried 0.23 3.23 2.29 2.46 2.42 1.88 52.23
08129010
Mango slices in
brine 1.8 5.16 5.36 2.51 4.56 3.59 14.81
08045020 Mangoes fresh 17.43 24.07 19.94 28.93 31.35 31.66 12.68
20098010 Mango juice 3.39 2.71 3.49 2.87 1.67 0.87 -23.82
Source: India Trades 2008
As witnessed in the table above, amongst all the forms of mango, India exports fresh mangoes in
highest quantity, however, growth rate for last five years has been highest in case of processed mango
products including mango pulp (149.50%), followed by mango squash (123.25%), sliced mango and
dried mango products indicating the shift of consumer demands from primary to processed mango

225
products. However, since the comparative advantage of fresh mango is highest, mango exporters from
AP should concentrate on the exports of fresh mango but also gradually look in to the shifts in the
consumer demands in most of the developed country markets. Below is described such shifts in major
preferred markets.
In Australia, the mango season overlaps Christmas. Mangoes are eaten for breakfast during this
period and the first box of mangoes is auctioned off for charity. In the Philippines, unripe mango
is eaten with bagoong. Dried strips of sweet, ripe mango (sometimes combined with seedless
tamarind to form Mangorind) are also popular, with those from Cebu exported worldwide.
Mangoes are also used to make juices, mango nectar, and as a flavoring and major ingredient in
ice cream and sorbetes. Guimaras produces a delicious mango.
In Mexico, mango is used to make juices, smoothies, ice cream, fruit bars, raspados, aguas frescas,
pies and sweet chili sauce, or mixed with chamoy, a sweet and spicy chili paste. It is popular on a
stick dipped in hot chili powder and salt or also as a main ingredient in fresh fruit combinations.
In Central America (Guatemala, El Salvador, Honduras, Nicaragua and Costa Rica), mango is
either eaten green with salt, pepper and hot sauce, or ripe in various forms. Only in Costa Rica,
ripe mangoes are called manga to differentiate them. In Guatemala, toasted and ground pumpkin
seed (called Pepita) with lime and salt are the norm when eating green mangoes. In Colombia
mango is also eaten either green with salt and/or lime, or ripe in various forms.
Pieces of mango can be mashed and used as a topping on ice cream or blended with milk and ice
as milkshakes. In Thailand and other South East Asian countries, sweet glutinous rice is flavored
with coconut then served with sliced mango as a dessert. In other parts of South-east Asia,
mangoes are pickled with fish sauce and rice vinegar. In Indonesia and Thailand, green mango is
sold by street vendors with sugar and salt and/or chili, or used in a sour salad called rujak or
rojak in Indonesia and Singapore. Green mangoes can be used in mango salad with fish sauce
and dried shrimps. In Taiwan, mango is a topping that can be added to shaved ice along with
condensed milk

226
Revealed Comparative Advantage of Fresh Mango
India's export World's export
Fresh Mango Total fruit Fresh Mango Total fruit RCA
2003 72873.83 527514.2 515090.3 34840427 9.34
2004 93346.4 687592.3 567589.8 40297580 9.64
2005 115644.3 868298.1 642428.8 46962590 9.74
2006 153379.3 855428.5 730671.7 50378119 12.36
2007 162723.1 873448.2 950253.2 57555091 11.28
2008 214580.9 1133227 1009059 53692352 10.08
The analysis of comparative advantage for last five years depicts a very high RCA values ranging
between 9.34 in 2003 to as high as 12.36 by 2006 and a slight decline due to recession in USA in 2007
and 2008. This rate of growth of the comparative advantage values is highly encouraging for the
mango growers and exporters for it determines the growing importance of Indian mangoes in the
international market as compared to our competing suppliers.
Major Export Destinations
Major export destinations for last five years vary from fresh mango to mango products. The only
constant market across all forms of mango and mango products is UK. Japan accepts processed forms
of mango pulp and mango sliced dried with growth as high as 91.86%, Netherlands accepts mango
slices in brine and mango squash. UAE accepts fresh mango and mango pulp. Saudi Arabia accepts
Mango slice dried, Mango pulp and mango slices in brine. New emerging markets are in the form of
Yemen and Angola.
Mango Products Major Export Destinations
Fresh Mangoes Nepal, UK, USA, UAE
Mango Slices dried Japan, Saudi Arabia, UK
Mango Pulp Saudi Arabia, UAE, Yemen, Japan
Mango slices in Brine Saudi Arabia, Netherlands, UK
Mango Squash USA, Netherlands, Ukraine, UK
Mango Juice UK, Angola

227
Trends in Export to Major Export destinations across Mango and Mango products
Mangoes fresh [8045020]
2003 2004 2005 2006 2007 2008 Growth
Nepal 0.08 0.53 0.6 0.73 1.56 1.58 81.60
UK 1.1 1.57 1.66 1.21 2.52 4.92 34.93
USA 0.22 0.29 0.04 0.1 0 0.49 17.37
UAE 7.67 10.64 6.46 16.5 14.53 15.71 15.42
Source: CMIE, India Trades, 2009
Mangoes sliced dried [08045030]
2003 2004 2005 2006 2007 2008 Growth
Japan 0.01 0.01 0.02 0.09 0.11 0.26 91.86
Saudi Arabia 0.02 0.24 0.66 0.38 0.82 0.3 71.88
UK 0.14 0.22 0.29 0.31 0.25 0.15 1.39
Mango pulp [0845040]
2003 2004 2005 2006 2007 2008 Growth
Saudi Arabia 0.05 16.1 20.92 23.12 29.85 29.41 258.02
UAE 0.03 3.77 5.95 7.18 8.85 9.92 219.06
Netherlands 0.28 6.1 7.81 8.89 18.64 19.22 132.98
Yemen 3.91 7.06 7.14 9.54 10.69
Japan 0 1.28 2.86 3.6 5.78 8.67
Mango slices in brine [08129010]
2003 2004 2005 2006 2007 2008 Growth
Netherlands 0.09 0.89 0.36 0.03 0.34 0.73 51.99
Saudi Arabia 0.29 0.82 2.44 1.46 2.08 1.83 44.55
UK 0.74 1.06 1.14 0.3 0.77 0.76 0.53
Mango squash [20089911]
2003 2004 2005 2006 2007 2008 Growth
USA 0.01 0.09 0.04 0 0.03 0.78 139.01
Netherlands 0.1 0.03 0.03 0.68 4.52 114.30
UK 0.18 0.3 0.4 0.33 0.73
Mango juice [20098010]
2003 2004 2005 2006 2007 2008 Growth
UK 0.07 0.24 0.04 0.14 0.07 0.12 11.38
Angola 0.01 0.01 0.14

228
Market Fluctuations of Major Export Markets for Fresh Mangoes
2003 2004 2005 2006 2007 2008
Saudi Arabia Saudi Arabia Saudi Arabia Saudi Arabia Saudi Arabia Saudi Arabia
United Arab
Emirates
United Arab
Emirates
United Arab
Emirates
United Arab
Emirates
United Arab
Emirates
United Arab
Emirates
Bangladesh Netherlands Netherlands Netherlands Netherlands Netherlands
Netherlands Bangladesh Yemen Yemen Yemen United Kingdom
Kuwait Yemen Bangladesh Bangladesh United Kingdom Yemen
Saudi Arabia is the constant topmost market for fresh mangoes and exporters from Andhra Pradesh
can explore the same. UAE has been the next best market for last so many years. Amongst the EU
market, Netherlands is the market to be looked at. Export diversification possibility can be explored in
Yemen.
Trade Intensity Index for Fresh Mangoes in identified MarketsTrade Intensity Index for Fresh Mangoes in identified MarketsTrade Intensity Index for Fresh Mangoes in identified MarketsTrade Intensity Index for Fresh Mangoes in identified Markets
Saudi Arabia UAE Netherlands Yemen Bangladesh
2003 7.08 5.86 3.69 3.08 2.03
2004 6.34 4.05 4.65 1.52 1.99
2005 5.18 3.88 3.24 3.34 2.52
2006 5.97 5.02 5.24 3.10 1.94
2007 4.48 3.28 5.98 3.43 2.78
2008 4.28 2.61 4.21 2.56 2.58 Source: Author’s CalculationsSource: Author’s CalculationsSource: Author’s CalculationsSource: Author’s Calculations
Bilateral trade strength for Fresh Mangoes has been highest with Saudi Arabia, followed by 5.98 in
Netherlands and 5.86 in UAE, 3.43 in Yemen. Poorest bilateral trade strength is seen in case of
Bangladesh.
Saudi Arabia
India's Competitors TII RCE
India 4.28 2.10
Kenya 5.27 2.59
Yemen 2.56 1.26
Pakistan 4.06 1.99
Egypt 0.33 0.16
UAE 0.51 0.25
Tough competition from Kenya

229
United Arab Emirates
India's Competitors TII RCE
India 2.61 1.37
Pakistan 4.01 2.11
Kenya 8.21 4.31
Egypt 1.00 0.53
Australia 0.36 0.19
South Africa 0.10 0.05
Netherlands
India's Competitors TII RCE
India 4.21 1.97
Brazil 4.47 2.09
Peru 6.02 2.82
France 0.91 0.43
Belgium 0.20 0.09
Israel 2.95 1.38
Yemen
India's Competitors TII RCE
India 0.11 1.05
Egypt 2.41 22.08
Bangladesh
India's Competitors TII RCE
India 2.58 1.50
Australia 0.03 0.02
Pakistan 0.33 0.19
India with better competitiveness than other suppliers. Tough competition for India
Tough competition from Pakistan and Kenya
Tough competition from Brazil and Peru
Tough competition from Egypt
No competition

230
Tariff and Non Tariff barrier for Fresh Mango in Major Markets
Other Tariff where ever applicable
Major
Markets Import tariff Tariff description
Tariff
rate NTM % NTM
Saudi Arabia 12 - - 100%
Testing, inspection or quarantine
requirements to protect human
health
Statutory Rates 100
MFN Rates (General exemption) 25
Infrastructural surcharge 2.5
Bangladesh 29.2 Value added tax 15 0%
UNCTAD TRAINS database, 2009
Amongst the two markets, it is a surprising combination. Saudi Arabia where the import tariff is
lower, the non tariff barrier is 100% in terms of testing, inspection or quarantine requirements to
protect human health. Bangladesh where there is no non tariff barrier, the import duty rates are as
high as 29.2 with additional taxes in the form of statutory rates, infrastructural surcharge and value
added tax.
Country FTA/PTA
Saudi Arabia None
UAE None
Netherlands None
Yemen None
Bangladesh None
Subsidy structure for Fresh Mangoes in major markets
Markets Product Specific Non Product Specific Green Box S&D Currency
Saudi Arabia None 838.84 674.296 NA million SRIs
UAE None NA 2,500,000 3,500,000 Dhs
Netherlands None NA NA NA NA
Yemen None NA NA NA NA
Bangladesh None 40.18 42.01 0.22 US $ million
None of these markets extend subsidies on mangoes specifically. However, a lot of green box and
special subsidies are extended in Saudi Arabia and UAE.

231
Strategy to boost Mango Exports from Andhra Pradesh
India continues to be the leading producer in the world accounting for 63 per cent of world
production. However, India occupies only third position in total mango exports. Exports from India
accounts for 0.11 per cent of the total domestic production as against about 4 per cent in case of other
exporting countries like Mexico, Philippines and Venezuela. Indian exports are confined mostly to
Gulf countries, USSR, and UK.
Though there is a vast potential for export to western countries, constraints like suitability of a few
varieties for exports, pests and disease problems, high freight charges, limited cargo space and high
packing cost have restricted the expansion of the exports from India. Removal of some of the
constraints will increase the potential for exports to USA and Japan. Research efforts are also needed
for prolonging the shelf life of fruit so that it could be made available for longer period in the
international market.

232
Annexure: Trade Intensity Index for Fresh Mangoes in Identified MarketsAnnexure: Trade Intensity Index for Fresh Mangoes in Identified MarketsAnnexure: Trade Intensity Index for Fresh Mangoes in Identified MarketsAnnexure: Trade Intensity Index for Fresh Mangoes in Identified Markets
India's Export to market Word's export to the market
Saudi Arabia Mango Total fruit Mango Total fruit TII
2003 17188.729 33158.981 22474.816 307101.64 7.08
2004 22460.841 39937.534 28678.547 323091.182 6.34
2005 25469.716 45344.821 38218.24 352430.035 5.18
2006 30968.249 52945.265 41271.635 421475.72 5.97
2007 33243.166 63639.44 50001.845 429261.833 4.48
2008 51035.275 83576.557 75425.858 529257.082 4.28
India's Export to market Word's export to the market
UAE Mango Total fruit Mango Total fruit TII
2003 13212.351 47066.2 26683.782 556908.874 5.86
2004 11674.725 56490.379 24600.731 481703.898 4.05
2005 23048.907 81907.086 38099.191 525133.549 3.88
2006 26093.129 95889.005 37349.845 688986.505 5.02
2007 25069.879 112573.719 36412.258 536461.548 3.28
2008 36340.163 174317.925 49626.99 621714.471 2.61
India's Export to market Word's export to the market
Netherlands Mango Total fruit Mango Total fruit TII
2003 6073.124 58401.15 60613.694 2153122.288 3.69
2004 9347.908 76329.219 67621.291 2568617.035 4.65
2005 10151.183 124295.9 76834.215 3044976.206 3.24
2006 22097.853 132910.994 104993.109 3309568.504 5.24
2007 21359.092 113752.627 120271.99 3830130.053 5.98
2008 26360.863 158211.567 129759.894 3279036.769 4.21
India's Export to market Word's export to the market
Yemen Mango Total fruit Mango Total fruit TII
2003 3029.828 4195.961 3138.831 13381.666 3.08
2004 7608.983 8400.784 7608.983 12774.658 1.52
2005 7528.864 8110.023 7580.77 27267.278 3.34
2006 9400.541 9697.734 9405.707 30045.396 3.10
2007 11249.435 11942.454 11314.054 41247.82 3.43
2008 11865.109 12214.937 12088.44 31907.512 2.56
India's Export to market Word's export to the market
Bangladesh Mango Total fruit Mango Total fruit TII
2003 7951.395 20338.352 7989.129 41502.415 2.03
2004 8908.964 27040.788 8980.355 54362.303 1.99
2005 7246.335 25542.659 7298.63 64872.982 2.52
2006 9238.376 33787.354 9266.464 65795.783 1.94
2007 5321.442 29083.696 5386.532 81721.554 2.78
2008 10479.396 43839.99 10533.446 113599.873 2.58

233
Saudi Arabia
India's Competitors
Competitor's export
of 080450 to market
Competitor's
export of 08 to
market
World's Export
of 080450 to
market
World's Export of
08 to market TII RCE
India 51035.28 83576.56 75425.86 529257.08 4.28 2.10
Yemen 9792.72 26860.34 75425.86 529257.08 2.56 1.26
Pakistan 5444.10 9413.90 75425.86 529257.08 4.06 1.99
Egypt, Arab Rep. 4699.89 98792.77 75425.86 529257.08 0.33 0.16
United Arab Emirates 2732.30 37724.90 75425.86 529257.08 0.51 0.25
Kenya 1210.85 1611.44 75425.86 529257.08 5.27 2.59
United Arab Emirates
India's Competitors
Competitor's
export of
080450 to
market
Competitor's
export of 08 to
market
World's Export
of 080450 to
market
World's Export
of 08 to market TII RCE
India 36340.16 174317.93 49626.99 621714.47 2.61 1.37
Pakistan 5970.27 18649.94 49626.99 621714.47 4.01 2.11
Kenya 3855.09 5882.72 49626.99 621714.47 8.21 4.31
Egypt, Arab Rep. 1634.62 20388.44 49626.99 621714.47 1.00 0.53
Australia 841.11 29452.07 49626.99 621714.47 0.36 0.19
South Africa 592.06 75358.43 49626.99 621714.47 0.10 0.05
Netherlands
India's Competitors
Competitor's
export of 080450
to market
Competitor's
export of 08 to
market
World's
Export of
080450 to
market
World's
Export of 08
to market TII RCE
Brazil 50913.43 287933.68 129759.89 3279036.77 4.47 2.09
India 26360.86 158211.57 129759.89 3279036.77 4.21 1.97
Peru 25098.06 105267.59 129759.89 3279036.77 6.02 2.82
France 6686.70 185293.78 129759.89 3279036.77 0.91 0.43
Belgium 4987.75 623352.17 129759.89 3279036.77 0.20 0.09
Israel 4143.00 35474.00 129759.89 3279036.77 2.95 1.38

234
Yemen
India's Competitors
Competitor's
export of 080450
to market
Competitor's
export of 08 to
market
World's
Export of
080450 to
market
World's
Export of 08
to market TII RCE
Egypt, Arab Rep. 222.71 243.71 12088.44 31907.51 2.41 22.08
India 11865.11 273770.86 12088.44 31907.51 0.11 1.05
United Arab Emirates 0.63 18018.03 12088.44 31907.51 0.00 0.00
Bangladesh
India's Competitors
Competitor's
export of 080450
to market
Competitor's
export of 08 to
market
World's
Export of
080450 to
market
World's
Export of 08 to
market TII RCA
Australia 5.31 2041.00 10533.45 113599.87 0.03 0.02
India 10479.40 43839.99 10533.45 113599.87 2.58 1.50
Pakistan 38.39 1251.18 10533.45 113599.87 0.33 0.19
Singapore 0.03 2005.08 10533.45 113599.87 0.00 0.00
Thailand 9.38 9623.58 10533.45 113599.87 0.01 0.01
United Arab Emirates 0.95 7154.89 10533.45 113599.87 0.00 0.00