Embed Size (px)
Citation preview

Approved by USDA’s World Agricultural Outlook Board
Fruit and Tree Nuts Outlook: September 2021 Jaclyn Kramer, coordinator Skyler Simnitt and Linda Calvin
U.S. Production of Major Noncitrus Fruit Forecast to Rise in 2021 The 2021/22 marketing year is underway for many noncitrus fruit crops. USDA’s National Agricultural
Statistics Service (NASS) forecast 2021 apple, grape, peach, cranberry, and sweet and tart cherry
production up but forecast pear production down. For many crops, the impact of record high heat in
some areas and California’s on-going drought is uncertain. Producer prices fluctuated throughout 2021
but are generally slightly above 2017–19 levels. The 2020/21 U.S. citrus season finished with declines
in all citrus commodities except California tangerines, likely contributing to higher citrus prices for the
season. U.S. tree nut supplies in 2021/22 are forecast down from last year’s record. Smaller crops of
almonds and walnuts due to severe weather and drought conditions are likely to increase grower prices
for these crops.
100
110
120
130
140
150
160
January April July October
1982=100
Index for prices received by producers for fresh fruit
Source: U.S. Department of Labor, Bureau of Labor Statistics.
2020
Average 2017-192021
Economic Research Service | Situation and Outlook Report
FTS-373 | September 29, 2021
In this report: Price Outlook Noncitrus Fruit Outlook Citrus Fruit Outlook Tree Nuts Outlook Commodity Highlight: Almonds Special Article: Fresh Fruit Availability Expands

2 Fruit and Tree Nuts Outlook: September 2021, FTS-373, September 29, 2021
USDA, Economic Research Service
Price Outlook Fruit and Tree Nut Grower Price Index Remains High
Fruit grower prices started high in the beginning of 2021 and despite a drop in March 2021,
remained strong. The Bureau of Labor Statistics producer price index for fresh fruit was 139.8
(1982 = 100) for August 2021, down 1.4 percent from last year and down 0.43 percent from July
2021. The USDA, National Agricultural Statistics Service (NASS) grower price index for fruit and
tree nuts was 131.5 (2011 = 100) for July 2021, up 1.8 percent from June 2021 but down 10
percent from July 2020. Higher lemon, grapefruit, apple, grape and pear prices more than offset
lower peach, strawberry, and orange prices compared to a year ago (table 1).
Some factors behind the grower price movements for selected fresh-market fruit are as follows:
• A reduction in grapefruit supply largely due to Winter Storm Uri in Texas (February 2021)
likely put upward pressure on grower prices.
• All lemon prices increased as a result of record low supplies.
• The U.S. Apple Association (USApple) reports an 18.8-percent decrease in fresh-market
apple holdings in June 2021 compared to June 2020 that may keep grower prices
Table 1--Monthly fruit prices received by growers, United States Year-to-year change
Commodity 2020 2021 2020 2021 June July ---------------------------------Dollars per box ---------------------------- Percent
Citrus fruit: 1
Grapefruit, all 13.80 23.72 16.13 22.98 71.9 42.5 Grapefruit, fresh -- -- -- -- -- -- Lemons, all 19.50 28.94 21.01 31.78 48.4 51.3 Lemons, fresh 27.49 36.04 30.29 37.74 31.1 24.6 Oranges, all 16.15 11.09 15.53 13.79 -31.3 -11.2 Oranges, fresh 22.37 19.42 19.41 18.36 -13.2 -5.4
---------------------------------Dollars per pound ----------------------------Noncitrus fruit: Apples, fresh 2 0.586 0.718 0.600 0.735 22.5 22.5 Grapes, fresh 2 1.315 1.505 1.140 1.205 14.4 5.7 Peaches, fresh 2 0.595 0.635 0.655 0.605 6.7 -7.6 Pears, fresh 2 0.525 0.665 0.670 0.715 26.7 6.7 Strawberries, fresh 1.080 1.310 1.990 1.300 21.3 -34.7-- Insufficient number of reports to establish an estimate.1 Equivalent on-tree price.2 Equivalent packinghouse-door returns for CA, MI, NY, and PA (apples only), OR (pears only), and WA (apples, peaches, and pears). Prices as sold for other States.Note: Beginning with the February 2020 estimates, all monthly price estimates for the noncitrus fruits are derived exclusively from data provided by USDA’s Agricultural Marketing Service (AMS) and reflect free on board shipping point basis. Previously these estimates were based on a combination of survey data and information from AMS.Source: USDA, National Agricultural Statistics Service, Agricultural Prices.
June July

3 Fruit and Tree Nuts Outlook: September 2021, FTS-373, September 29, 2021
USDA, Economic Research Service
strong. Prices could decrease, however, if the USDA, NASS forecast of a large 2021/22
Washington State crop is realized.
• July 2021 California strawberry shipments were 13 percent higher than a year ago and
led to lower prices.
• Peach prices were up in June 2021 from 2020 but decreased in July 2021 as more
supplies entered the market.
Consumer Price Index for Fresh Fruit Up
The Bureau of Labor Statistics Consumer Price Index (CPI) for fresh fruit was reported at 372.2
(1982-84 = 100) in August 2021, up from 358.8 in August 2020 (table 2). The CPI for fresh fruit
increased in 2021 from January to August. Retail prices for strawberries and grapes were up
relative to August 2020 prices. The same reasons for the increase in grower prices likely caused
retail prices to go up. One reason for the rise in fresh fruit CPI may be the reopening of the
foodservice industry and less fruit going to retail. High demand and low supply of citrus likely
increased the citrus CPI.
Table 2--U.S. monthly Consumer Price Index for fresh fruit and retail prices for selected fruit, 2020-212020 2021 2020-21 change
Commodity Unit July August July August July August ----------------- 1982-84 = 100 ----------------- --- Percent ---
Fresh fruit 353.7 358.8 372.0 372.2 5.2 3.7Apples 330.3 333.7 350.0 352.3 6.0 5.6Citrus fruit 264.3 267.0 272.5 277.5 3.1 3.9
--- Dollars --- --- Dollars --- --- Percent ---Fresh: Navel oranges Pound -- -- -- -- -- -- Grapefruit Pound -- -- -- -- -- -- Lemons Pound -- -- -- -- -- -- Red Delicious apples Pound na na na na na na Bananas Pound 0.580 0.576 0.594 0.589 2.4 2.3 Peaches Pound -- 2.088 -- -- -- -- Anjou pears Pound -- -- -- -- -- -- Strawberries 1 12-oz. pint 2.020 2.214 2.256 2.434 11.7 9.9 Thompson seedless grapes Pound 2.121 2.183 2.177 2.326 2.6 6.6na = not available. -- Insufficient marketing to establish a price.1 Dry pint. Source: U.S. Department of Labor, Bureau of Labor Statistics.

4 Fruit and Tree Nuts Outlook: September 2021, FTS-373, September 29, 2021
USDA, Economic Research Service
Noncitrus Fruit Outlook The Northwest Heat Dome Introduces Production Uncertainty
During the Northwest heat dome in late June and early July, growers experienced high
temperatures in Washington, Oregon, Idaho, Nevada, Montana, California, and parts of Western
Canada. In Wenatchee, Washington, one of the main tree fruit production areas, temperatures
reached a record 113 degrees on June 30, 29 degrees above normal (figure 1). Between June
25 and July 1, 6 out of 7 days reached 100 degrees or more. Highs reached 100 again on July
7. The normal highs for these days, based on data from 1991 to 2020, ranged from 82 to 87
degrees. Portland International Airport reached 116 degrees on June 28th. Many growers think
they could have lower production, smaller sizes, more sunburn damage, and/or internal fruit
damage. Complete harvest totals are not available for most crops yet, and the full impact of the
heat remains to be seen, although many factors affect production besides heat. Even after
harvest, there will be some uncertainty about how stored fruit will hold up. Many factors affect
how heat can affect tree fruit, including hours of direct sunlight, topography, tree architecture,
availability of overhead cooling or shade cloth to mitigate heat damage, and type of fruit.
The heat was hard on workers in the orchards and fields. One nursery worker in Oregon died
while moving irrigation pipes on June 26, a day when the temperature reached 104 degrees.
Washington and California have workplace regulations regarding outdoor heat exposure for
workers (Minnesota is the only other State with this kind of regulation). Washington modified its
regulations by emergency rule in 2021 to add more requirements for training, breaks, and
shade. Oregon, already in the process of developing regulations regarding heat, issued a
temporary rule on July 8.

5 Fruit and Tree Nuts Outlook: September 2021, FTS-373, September 29, 2021
USDA, Economic Research Service
Apple crop forecast up, but Washington growers are watching the crop for signs of heat damage: USDA, NASS estimated the total 2021/22 season (August–July) apple harvest to be
10,525 million pounds, up 3 percent from 2020/21 but down 5 percent from 2019/20 (figure 2).
The biggest apple producing States are Washington, New York, Michigan, and Pennsylvania.
Increases in predicted production in Washington, Virginia, Pennsylvania, and Oregon outweigh
predicted losses in California, Michigan, and New York. In contrast, the U.S. Apple Association
forecast the 2021 apple harvest to be 8.2 percent lower than the USDA, NASS estimate.
Even with record high temperatures in Washington during the summer, the USDA, NASS
August 1 production estimate for the 2021/22 Washington crop was up 7 percent from the
previous year to 7,400 million pounds. The latest Washington State Tree Fruit Association’s
fresh estimate was 124.8 million 40-pound boxes—an average crop—up 2.3 percent from last
year. Washington growers are watching their crop for any evidence of heat damage which could
reduce the yield below forecast levels. With high tariffs on apples in India and China as well as
challenging overseas shipping conditions, the export market will probably remain sluggish,
pushing more apples into the domestic market and exerting downward pressure on prices.
These same conditions led to a 10 percent decrease in 2020/21 exports compared with
2019/20.
USDA, NASS estimated New York 2021/22 production to be 3 percent lower than last season
and Michigan production to be down 18 percent because of frost damage and poor pollination
due to cold weather. USDA, NASS estimated Pennsylvania 2021/22 production up 10 percent
from the previous season, California was estimated down 32 percent, Oregon up 9 percent, and
Virginia up 10 percent. Declines in New York and Michigan, which together accounted for 38
5060708090
100110120Degrees Fahrenheit
Figure 1
Actual Normal high (1991-2020)Source: U.S. National Oceanic and Atmospheric Administration, National Weather Service.
Wenatchee, Washington, 2021 daily temperatures and normal high temperatures,

6 Fruit and Tree Nuts Outlook: September 2021, FTS-373, September 29, 2021
USDA, Economic Research Service
percent of all processed apples in 2021, could put upward pressure on processing prices. Last
year, Washington accounted for 45 percent of processed apples. In Washington, processing is
generally a residual market but with the potential damage due to heat, more fruit could go to
processing, and put downward pressure on processing prices.
U.S. pear crop forecast similar to last year with losses in Washington and gains in Oregon and California: In early June, before the heat dome in the Pacific Northwest, USDA
NASS predicted the 2021/22 (July–June) pear harvest to be 670,000 tons, down less than 1
percent from the previous season but lower than the 2017–19 crop (figure 3). Washington, the
largest pear producer in 2020/21, is expected to have 19 percent less production than the
previous year. Production in Oregon and California is expected to be up 10 percent and 39
percent, respectively, in spite of earlier production problems, which included drought in
California and freezes and/or stinkbug damage in Oregon. In previous years, the combined
volume of California and Oregon in both the fresh and processed markets was about equal to
Washington’s fresh and processing production. The Northwest heat wave may have some
negative impact on production levels, but growers are waiting to see the whole harvest before
trying to assess any damage. Most pear trees are traditional trees—tall with large canopies
2
3
4
5
6
7
8
9
10
11
12Processed Fresh
Figure 2U.S. apple production forecast up in 2021/22Billion pounds
* USDA, Economic Research Service projection.Source: USDA, National Agricultural Statistics Service, Noncitrus Fruit and Nuts Summary, various issues.

7 Fruit and Tree Nuts Outlook: September 2021, FTS-373, September 29, 2021
USDA, Economic Research Service
providing shade; this may protect pears to some degree compared with new apple orchards,
which are trained into a fruiting wall with little shade and with leaves pruned to maximize
sunlight to the fruit.
Overall U.S. grape crop and California table-type grape production forecast up: The 2021
U.S. grape harvest in California and Washington—the only two States remaining in the USDA,
NASS annual grape enumeration since 2018— is expected to be 6.47 million tons, up 9 percent
from 2020, despite drought in California and high-heat conditions in both States. The harvest of
California table-type grapes, which can be harvested for table grapes or juice, is expected to be
1.2 million tons, up 8 percent from last year. The California Table Grape Commission forecast
the table grapes harvest to be 0.97 million tons (1,947.5 million pounds) in 2021, up 1.5 percent
from the previous year.
The California table grape industry also experienced high heat this year. The Coachella Valley,
in Southern California along the border with Mexico, completed its early-season harvest.
Shipments from Coachella were down 17 percent this year compared to last year, and some
industry observers believe that was due to the heat (figure 4). Shipments from Central California
from May through August were 9 percent higher than last year, but the harvest will continue into
December. So, the overall impact of the heat and other factors that can affect yield are not yet
known (USDA, Agricultural Marketing Service shipment data compiled September 14, 2021).
0.00
0.05
0.10
0.15
0.20
0.25
0.30
0.35
0.40
0
200
400
600
800
1,000
1,200
1,400
1,600
1,800
2017 2018 2019 2020 2021f
California Oregon Washington All-pear grower pricef = forecastSource: USDA, National Agricultural Statistics Service, Noncitrus Fruit and Nuts 2020 Summaryand Crop Production (August 2021 issue).
Dollars per pound
Figure 3U.S. pear crop in 2021 forecast down slightly from a year agoMillion pounds

8 Fruit and Tree Nuts Outlook: September 2021, FTS-373, September 29, 2021
USDA, Economic Research Service
Imports from Mexico, the main competitor to California in the early part of the season, were
down 2 percent from May through August but total shipments (domestic and imported) during
the same period were about 6 percent higher in 2021 than last year. California table grape
prices were up every month compared with last year.
Peach production forecast up in top three States: In 2021, the total peach crop is expected
to be up 13 percent from the year before (including fresh-market freestone peaches and
processing clingstone peaches). If realized, this will be the biggest peach crop since 2017
(figure 5). In 2020, the biggest fresh-market producers were, in declining order, California (59
percent), South Carolina (21 percent), and Georgia (9 percent). The 2021 California freestone
production forecast is 270,000 tons, up 23 percent from the previous year despite drought and
high temperatures. The California freestone peach industry is expecting a good crop this year
with the harvest ending in mid-October. South Carolina is forecast up 10 percent and Georgia
up 8 percent despite weather problems in both regions.
USDA, NASS only reports clingstone peach production for processing for California. The 2021
forecast is 240,000 tons, down 3 percent from the previous year. In contrast, the California
Canning Peach Association reports their total 2021 crop was 225,476 tons, down 9 percent from
last year’s harvest. The Canning Cling Peach Association, the cooperative bargaining
association in the cling peach industry, reported the 2021 base price agreement was ratified
with processors at $518 per ton, up 4 percent from last year.
0
50
100
150
200
250
300
350
May-20 May-21 Jun-20 Jun-21 Jul-20 Jul-21 Aug-20 Aug-21
Figure 4Domestic and imported table grape shipments for the May through August period, 2020 and 2021
Central California South California Chile Mexico
Million pounds
Source: USDA, Agricultural Marketing Service, Market News, Movement data.

9 Fruit and Tree Nuts Outlook: September 2021, FTS-373, September 29, 2021
USDA, Economic Research Service
NASS predicts cranberry production about the same as last year: The USDA, NASS
August forecast for the 2021 U.S. cranberry production was up less than 1 percent from last
year. NASS forecast that the two largest producers, Wisconsin and Massachusetts, will have
production increases of 1 percent and 2 percent, respectively. The Cranberry Marketing
Committee is expecting a lower level of production compared with last year.
Prices generally declined since 2008 as production expanded (figure 6). In 2017 and 2018, the
Cranberry Marketing Committee used volume control regulations authorized in its Federal
Marketing Order to try to reduce the volume of fruit on the market. Ending stocks declined 39
percent from 2016 to 2018 and the 2018 price edged higher. With lower production in 2019 and
2020 and lower stocks, prices increased. With the Cranberry Marketing Committee expecting
another low production year and lower carry-in-stocks, prices may increase this year.
0
200
400
600
800
1,000
1,200
1,400
1,600
2017 2018 2019 2020 2021f
California freestone California clingstoneSouth Carolina GeorgiaOther States
Figure 5U.S. peach production to increase in 2021
Million pounds
f = forecastSource: USDA, National Agricultural Statistics Service, Noncitrus Fruit and Nuts 2020 Summary and Crop Production (August 2021 issue).

10 Fruit and Tree Nuts Outlook: September 2021, FTS-373, September 29, 2021
USDA, Economic Research Service
Sweet and tart cherry production forecast up: The 2021 NASS June forecast for sweet
cherries was 369,000 tons, up 14 percent. Washington State accounted for 62 percent of
production in 2020, with California at 21 percent, and Oregon at 17 percent.
USDA, NASS forecast California sweet cherry production to be up 20 percent, despite warm
winter weather. According to the California Cherry Board, fresh-market sweet cherry shipments
were 91,827 tons, their highest level ever. Despite large volume, fruit sizes were very small
because of the heat, and prices, therefore, were lower than expected. USDA, NASS forecast
Washington sweet cherry production to be up 19 percent despite cold winter weather. Total
Washington cherry harvest numbers are not yet available since the last fruit is harvested in
August, but they could be lower than expected due to the high heat. Oregon had a warm spring
with low precipitation, which reduced expected yield down 13 percent. Cherries were the only
Washington and Oregon tree fruit harvested in late June and early July during the heat dome.
Cherry growers tried various strategies to protect the harvesters and fruit from the heat,
including shorter workdays or switching some workers to night harvest.
Cherry exports from May–July 2021 were up 14 percent from a year ago, the first pandemic
year, but down 7 percent from 2019 and down 24 percent from the high in 2017. Exports to
Canada, Korea, Japan, and Mexico were up, but down to China and Taiwan. High retaliatory
tariffs continue to impede export shipments to China.
For tart cherries, almost exclusively used for processing, USDA, NASS forecast the 2021
harvest at 142 million pounds, up 2 percent from the previous year. The 2020 crop, however,
0
10
20
30
40
50
60
70
0
2,000
4,000
6,000
8,000
10,000
12,000
Figure 6U.S. total cranberry production and average grower priceThousand barrels Dollars per barrel1
f = forecast1 1 barrel = 100 pounds.Source: USDA, National Agricultural Statistics Service, Noncitrus Fruits and Nuts Summary, various issues and Crop Production (August 2021 issue).
ProductionPrice

11 Fruit and Tree Nuts Outlook: September 2021, FTS-373, September 29, 2021
USDA, Economic Research Service
was small: down 47 percent from 2019 and the third-lowest production level since 2000.
Michigan is the largest producer of tart cherries and in 2020 accounted for 50 percent of
production, followed by Utah (21 percent), Washington (15 percent), Wisconsin (7 percent), and
New York (7 percent). USDA, NASS predicted Michigan, New York, and Wisconsin to have
lower production for 2021, with Utah and Washington predicted higher (figure 7). USDA, NASS
forecast Michigan production to be down 5 percent due to frosts and freezing temperatures as
well as drought. Timely rain increased Michigan production beyond expectations. The Cherry
Industry Administration Board reported Michigan production up 40 percent from its initial
estimate and national production up 24 percent. Higher domestic production will put downward
pressure on prices. Frozen tart cherry stocks coming into January 2021 were down 35 percent
from the previous year, which will reduce downward pressure on prices. Imports from January
through July for 2021 were up 48 percent from the year before, but imports are generally a small
share of domestic availability. Exports, which are also small, were up 21 percent from a year
ago.
01020304050607080
Michigan Utah Washington Wisconsin New York
Million pounds
Figure 7U.S. tart cherry forecast by State
2020 2021fNote: f = forecast.Source: USDA, National Agricultural Statistics Service, Crop Report (June 2021).
12 Fruit and Tree Nuts Outlook: September 2021, FTS-373, September 29, 2021
USDA, Economic Research Service
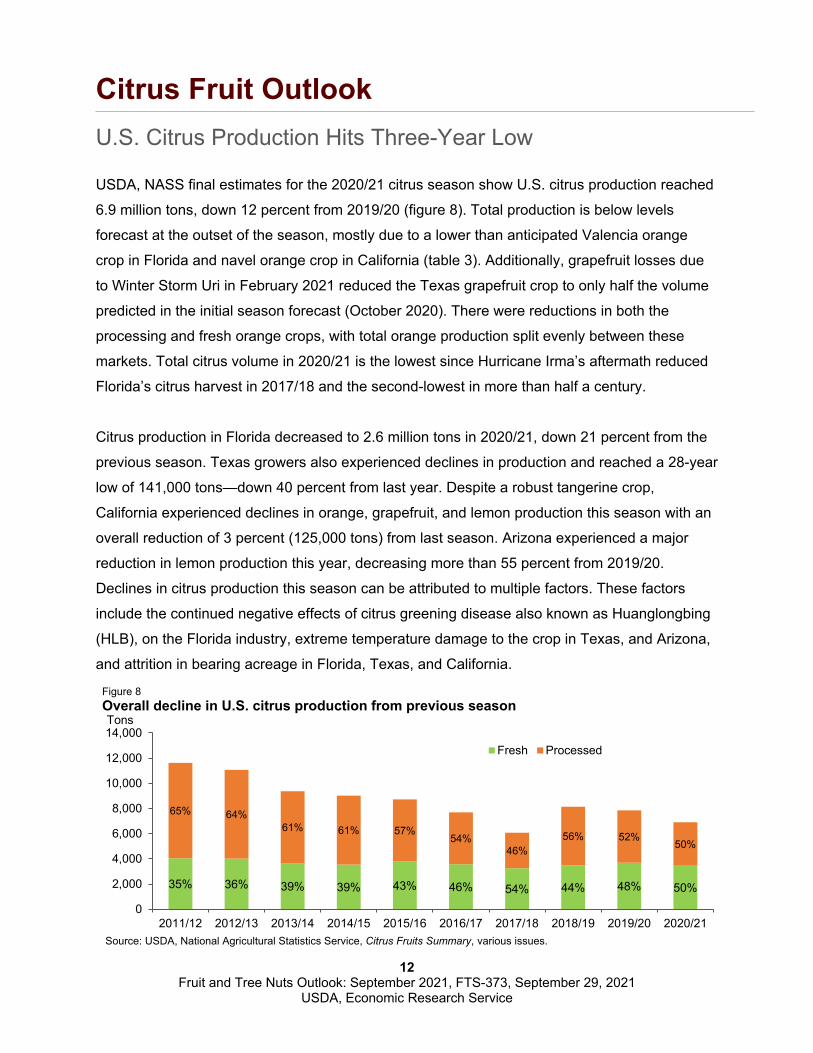
Citrus Fruit Outlook U.S. Citrus Production Hits Three-Year Low
USDA, NASS final estimates for the 2020/21 citrus season show U.S. citrus production reached
6.9 million tons, down 12 percent from 2019/20 (figure 8). Total production is below levels
forecast at the outset of the season, mostly due to a lower than anticipated Valencia orange
crop in Florida and navel orange crop in California (table 3). Additionally, grapefruit losses due
to Winter Storm Uri in February 2021 reduced the Texas grapefruit crop to only half the volume
predicted in the initial season forecast (October 2020). There were reductions in both the
processing and fresh orange crops, with total orange production split evenly between these
markets. Total citrus volume in 2020/21 is the lowest since Hurricane Irma’s aftermath reduced
Florida’s citrus harvest in 2017/18 and the second-lowest in more than half a century.
Citrus production in Florida decreased to 2.6 million tons in 2020/21, down 21 percent from the
previous season. Texas growers also experienced declines in production and reached a 28-year
low of 141,000 tons—down 40 percent from last year. Despite a robust tangerine crop,
California experienced declines in orange, grapefruit, and lemon production this season with an
overall reduction of 3 percent (125,000 tons) from last season. Arizona experienced a major
reduction in lemon production this year, decreasing more than 55 percent from 2019/20.
Declines in citrus production this season can be attributed to multiple factors. These factors
include the continued negative effects of citrus greening disease also known as Huanglongbing
(HLB), on the Florida industry, extreme temperature damage to the crop in Texas, and Arizona,
and attrition in bearing acreage in Florida, Texas, and California.
35% 36% 39% 39% 43% 46% 54% 44% 48% 50%
65% 64%61% 61% 57%
54%46%
56% 52%50%
0
2,000
4,000
6,000
8,000
10,000
12,000
14,000
2011/12 2012/13 2013/14 2014/15 2015/16 2016/17 2017/18 2018/19 2019/20 2020/21
Tons
Figure 8Overall decline in U.S. citrus production from previous season
Fresh Processed
Source: USDA, National Agricultural Statistics Service, Citrus Fruits Summary, various issues.

13 Fruit and Tree Nuts Outlook: September 2021, FTS-373, September 29, 2021
USDA, Economic Research Service
The U.S. citrus crop was valued at $3.3 billion in 2020/21. This amounts to a 2-percent
decrease in value of production from 2019/20. Despite lower production, the decrease in value
was minimal due to higher average prices in 2020/21.
U.S. citrus fresh-market crop smaller in 2020/21: U.S. citrus production for the fresh market
was estimated at 3.45 million tons in 2020/21, down 6 percent from the previous season, with
Table 4--Citrus: Utilized production, 2018/19 to 2020/211
Utilized2018/19 2019/20 2020/21 2018/19 2019/20 2020/21
Oranges: Early/midseason and navel: California 42,000 43,300 40,600 1,680 1,732 1,624 Florida3 30,400 29,650 22,700 1,368 1,334 1,022 Texas 2,210 1,150 1,000 94 49 43 Total4 74,610 74,100 64,300 3,142 3,115 2,688 Valencia: California 10,200 10,800 9,500 408 432 380 Florida 41,450 37,750 30,100 1,865 1,699 1,355 Texas 290 190 50 12 8 2 Total 51,940 48,740 39,650 2,286 2,139 1,737 All oranges 126,550 122,840 103,950 5,428 5,254 4,425 Grapefruit: California 4,200 4,700 3,900 168 188 156 Florida 4,510 4,850 4,100 192 206 174 Texas 6,100 4,400 2,400 244 176 96 All grapefruit 14,810 13,950 10,400 604 570 426 Tangerines and mandarins: California 26,500 22,400 28,100 1,060 896 1,124 Florida4 990 1,020 890 47 48 42 All tangerines and mandarins 27,490 23,420 28,990 1,107 944 1,166 Lemons: Arizona 1,350 1,800 800 54 72 32 California 23,700 25,300 21,300 948 1,012 852 All lemons 25,050 27,100 22,100 1,002 1,084 884 All citrus5 193,900 187,310 165,440 8,140 7,853 6,901 1 The crop year begins with bloom of the first year shown and ends with completion of harvest the following year.2 Net pounds per box: oranges in California (CA)-80 (75 prior to the 2010-11 crop year), Florida (FL)-90, Texas (TX)-85;
grapefruit in CA-80 (67 prior to the 2010-11 crop year), FL-85, TX-80; lemons-80 (76 prior to the 2010-11 crop year); tangerines and mandarins in CA-80 (75 prior to the 2010-11 crop year), FL-95.3 Includes Temples. Beginning in 2016/17, Temples included in tangerines and mandarins for Florida.4 Beginning in 2016/17, tangelos are included in tangerines and mandarins for Florida.5 Totals may not be equivalent to the sum of the categories due to rounding.
Crop and State Utilized
---- 1,000 boxes2 ---- ----1,000 tons ----
Source: USDA, National Agricultural Statistics Service, Citrus Fruits 2021 Summary (August 2021).

14 Fruit and Tree Nuts Outlook: September 2021, FTS-373, September 29, 2021
USDA, Economic Research Service
smaller fresh-market crops of oranges (down 11 percent), grapefruit (down 15 percent), and
lemons (down 6 percent). Representing just under half of all U.S. citrus production for the fresh
market, the fresh-market orange crop decreased from the previous season to 1.68 million tons
due to smaller crops in California, Florida and Texas. With a supply contraction and robust
demand, prices increased. Overall, the average equivalent-on-tree price for a box of fresh
oranges increased from $16.57 in 2019/20 to $21.43 in 2020/21 due to higher prices in
September through May. Furthermore, lower exports this season (a decrease of 8 percent) are
indicative of higher domestic demand. Exports to South Korea, Canada, and Hong Kong (the
top three export markets for U.S. oranges) were all down by 12, 15, and 20 percent,
respectively.
U.S. imports of fresh oranges in 2020/21 (November through July) were down 6 percent, from
the same period last year. Although fresh orange imports from Mexico were up 8 percent there
were marked decreases in imports from Chile and South Africa, the second- and third-largest
suppliers of fresh oranges to the United States.
Florida continues to lead in grapefruit production in 2020/21: Florida led other States in
grapefruit production this season, with Florida growers producing a combined 174,000 tons for
the fresh and processed markets. California came in second producing 156,000 tons, while
Texas was third at 96,000 tons. This marks a 46-percent decrease in Texas grapefruit
production from last season and is less than half (49 percent) of the volume forecast at the
outset of the 2020/21 season. This reduction was largely due to Winter Storm Uri, which
touched down in Texas in mid-February 2021; the storm occurred at a time when less than half
of the Texas grapefruit crop had been harvested. Lower production quantities in Florida
compared to last season can be attributed to the ongoing effects of citrus greening disease, with
grapefruit-bearing acreage decreasing in Florida by 16 percent year over last. Lower production
levels of grapefruit in California this season—a decrease of 17 percent (800,000 boxes)—can
mostly be attributed to prolonged drought in the San Joaquin Valley.
As might be expected given historically low domestic production levels this season, imports of
fresh grapefruit from September through July 2020/21 were up by 31 percent from the same
period last year while exports were down by 17 percent. Despite these changes in trade from
last season, total domestic availability is 17 percent below last season at only 1.41 pounds per
capita. With the decrease in total supply this season, average prices rose with an on-tree
equivalent price of $25.19 per box in 2020/21 compared with $17.96 in 2019/20.

15 Fruit and Tree Nuts Outlook: September 2021, FTS-373, September 29, 2021
USDA, Economic Research Service
U.S. lemon crop in 2020/21 lowest in 5 years: U.S. growers produced 884,000 tons of lemons
in 2020/21, the smallest lemon crop since 2016/17. Eighty percent of these lemons (710,000
tons) went to the fresh market, a 6 percent decrease in quantity from 2019/20. Although most
U.S. lemons are grown in California, Arizona growers typically supply about 5 percent of the
U.S. crop. Both California and Arizona had smaller crops this year, with a 2-percent volume
decline in fresh market lemons in California and a 50-percent volume decline in the same
category in Arizona. The large decrease in the Arizona crop can be attributed to higher fruit drop
and lower sizing than expected, as well as the decreasing yields among aging lemon groves in
the State. The sizing and drop issues in Arizona this season can be attributed to near-record
high temperatures in the Yuma valley during spring 2020, when the future 2020/21 lemon crop
was at a nascent stage and highly susceptible to heat damage. Likely in response to the smaller
crop, fresh lemon imports to the United States this season (August through July 2019/20) were
up by 66 million pounds (22 percent) from last season. Argentina, Mexico and Chile remain the
main suppliers of lemons to the U.S. market and together supply 97 percent of lemon imports.
Correspondingly, U.S. fresh lemon exports this season lagged 16 percent behind 2019/20,
reaching the lowest level in 30 years. Higher imports and reduced exports offset lower domestic
production levels, resulting in a slight increase in per capita availability of fresh lemons in the
United States over last year. This led to U.S. grower prices increasing from $27.76 in 2019/20 to
$29.86 in 2020/21, a 7-percent increase.
Larger U.S. tangerine crop in 2020/21: Production of U.S. tangerines, mandarins, and
tangelos (collectively referred to hereafter as tangerines) for the fresh market reached its
second highest level in 50 years at 788,000 tons this season due to a larger crop in California.
Imports of tangerines were down slightly in the 2020/21 season, 3 percent, from last season’s
record high, with 835 million pounds imported primarily from Chile, Peru, and Morocco. Exports
of fresh tangerines were up this year, with a 9-percent (10 million pound) increase from
2019/20. Canada, Japan, and Mexico remained the three largest export markets for U.S.-grown
tangerines. Near-record high domestic production this season led to the highest-per capita
availability of tangerines on record of 6.95 pounds.
Greater per capita availability of fresh citrus may suggest increased purchases during the pandemic: Total availability of fresh citrus (oranges, lemons, limes, grapefruit, and
tangerines), which is a proxy for consumption, peaked at a record 8,861 million pounds in the
2019–20 season, after which it only slightly decreased to 8,856 million pounds (still above pre-
pandemic levels) (figure 9). Per capita availability of fresh citrus fruit increased by 7 percent

16 Fruit and Tree Nuts Outlook: September 2021, FTS-373, September 29, 2021
USDA, Economic Research Service
between 2018/19 and 2020/21 to 26.7 pounds in 2020/21, the second highest per capita
availability in 37 years which may suggest increased purchases of these fruits during the
pandemic. Imports accounted for a record 36 percent of availability during the 2020/21 season,
with imports of limes alone accounting for nearly half (48 percent) of all fresh citrus imports,
followed by tangerines (45 percent), and oranges (13 percent). On a related note, purchases of
orange juice temporarily surged during the first few months of the coronavirus (COVID-19)
pandemic in the United States during the 2019/20 marketing season, with some suggesting the
pandemic reinvigorated consumer interest in orange juice for its perceived immunoenhancing
properties. Similar concerns and perceptions may be motivating consumers’ purchase decisions
regarding fresh citrus.
The majority of U.S. citrus went to processing in 2020/21: In 2020/21, 57 percent of U.S.
citrus went to the processing market, most of which was oranges. Florida produced 81 percent
of all U.S oranges for processing, while California and Texas produced the remainder. Florida
and Texas had smaller orange crops for the processing market in 2020/21 compared with
2019/20. Florida’s production was 22 percent below last season, while Texas’s production was
down 26 percent. California orange production for the processing market was up 8 percent, with
an increase over last season of 44,000 tons of navel and early mid-season oranges going to
processing. A total of 329 million gallons of orange juice were produced domestically in the
United States in 2020/21, 27 percent below production from last season. This marks the lowest
01,0002,0003,0004,0005,0006,0007,0008,0009,000
Million pounds
Grapefruit Lemons Limes Oranges Tangerines Imports
Figure 9Total availability of fresh citrus remains high in 2020/21
Source: USDA, Economic Research Service calculations.

17 Fruit and Tree Nuts Outlook: September 2021, FTS-373, September 29, 2021
USDA, Economic Research Service
production volume of orange juice in over 50 years, excluding 2017/18 when Hurricane Irma
reduced the Florida Valencia crop by up to 30 percent.
U.S. orange juice imports in 2020/21 (October through July) were up by 104 million gallons (30
percent) from the same period last season. This increase in orange juice imports from 2019/20
may be due to slightly lower-than-average beginning stocks (417 million gallons), but also due
to larger crops in Brazil and Mexico compared with last year. Brazil and Mexico remain the
primary suppliers of orange juice to the U.S. market accounting for 54 percent and 35 percent,
respectively, of the orange juice imported. U.S. exports of orange juice for 2020/21 decreased
over last season by 10 percent (4.3 million gallons). Canada remains the primary export market
for U.S.-produced orange juice, accounting for 70 percent of exports. The Dominican Republic
and South Korea were the second- and third-largest purchasers of U.S. orange juice accounting
for 11 and 3 percent of U.S. exports, respectively.
U.S. grapefruit for processing is down in 2020/21: U.S. grapefruit production for the
processing market reached the lowest levels in 50 years at 151,800 tons down 39 percent from
the 2019/20 season (October through September). This decrease can be attributed to lower
production levels in all major producing States, especially in Texas, which was hard hit by
Winter Storm Uri.
U.S. import levels of grapefruit juice this season (2.07 million gallons) are down 58 percent from
last year (2019/20) in the period from October to July. The primary suppliers of grapefruit juice
to the United States were Mexico, South Africa, and Spain. Grapefruit juice exports are up
slightly this season (3 percent) for the period from October to July 2020/21. The three top export
markets for U.S. grapefruit juice from October to July 2019/20 were Canada, Japan, and the
Netherlands. While grapefruit juice exports are up slightly from the 2019/20 at 5.2 million
gallons, they remain below levels observed previously in the decade, which is consistent with
declining U.S. production.

18 Fruit and Tree Nuts Outlook: September 2021, FTS-373, September 29, 2021
USDA, Economic Research Service
U.S. Citrus Production 2021/22 Likely Below 2020/21 Levels
USDA, NASS will release initial 2020/21 forecasts for all-citrus production in the United States in
October 2021. The 2021–22 California Navel Orange Objective Measurement Report released
September 10 by the USDA, NASS Pacific Regional Office predicted navel orange production in
California at 70 million 40-pound cartons, down 14 percent from the previous year. This forecast
decrease in production is most likely due to a reduction in fruit set and size, and, to a lesser
extent, bearing acreage.
The results of the first orange and grapefruit maturity tests for Florida’s 2021/22 season were
published by USDA, NASS on September 10. Sampled fruit included early oranges (which
include navels), mid-season oranges (mostly Valencias), and red and white seedless grapefruit.
The survey showed that all oranges have lower unfinished juice per box for 2021/22 but slightly
higher solids compared with the same time last season. Unfinished juice refers to preprocessed
juice content before pulp and other solids are removed. Grapefruit (both red and white seedless)
have unfinished juice and solids roughly equivalent to 2020/21.
Citrus greening disease remains a threat to citrus grove health and productivity across all
producing States. In Florida, where greening is rampant, total bearing acreage decreased by
another 3 percent this season to 369,300 acres. In the other citrus-producing States, greening is
less prevalent yet can lead to higher production costs, especially as infected trees are removed
and/or replaced. In 2020/21, there was also a decrease in total bearing acreage of California
citrus of 2,000 acres, or less than 1 percent, over last season due to reduced navel and
Valencia orange acreage. Bearing acreage in Arizona and Texas remained steady with 2019/20
levels at 7,300 and 23,800 acres, respectively. Assuming present trends continue, total
production in 2021/22 can be expected to be below 2020/21 levels.

19 Fruit and Tree Nuts Outlook: September 2021, FTS-373, September 29, 2021
USDA, Economic Research Service
Tree Nuts Outlook Almond and Walnut Forecast to Decline
The 2021/22 domestic season has begun for most tree nuts. Almond and walnut production is
forecast to decline. In California, almond and walnut orchards faced harsh weather conditions
and an on-going drought. In the previous season (2020/21), record production of most U.S. tree
nuts, along with large beginning stocks, contributed to overall record supplies and generally
lower grower prices (table 4). Overall, exports increased despite tariffs and port issues,
including port congestion, shipping delays and container shortages in California. The
marketable quantity of all U.S. tree nuts, led by almonds, walnuts, and pistachios, was
estimated at 4.5 billion pounds (shelled basis) in 2020/21, up 24 percent from the previous
season. The production may be reduced in the 2021/22 season as a result of the alternate
bearing nature of tree nuts.
Almond crop expected to decline in 2021/22: The 2020/21 (August–July) almond production
was the largest on record, over 3 billion pounds and valued at $5.6 billion. California’s average
yield was 2,490 pounds per acre, a 320-pound increase from the previous year. Strong
international demand led to a 30-percent increase in U.S. exports in 2020/21 compared with
2019/20, including shipments to the top markets of India and China. The large supply and high
ending stocks, likely lowered grower prices in 2020/21.
The 2021 California Almond Objective Measurement Report, released by USDA, NASS in July
2021, forecast a 2.80-billion-pound crop (shelled basis) for the 2021/22 season, a 10 percent
decrease in production from the previous season. Bearing acreage increased in 2021 but due to
low water allocation and record high temperatures in June the crop did not develop as well as
expected, reducing nut set per tree. The forecast smaller crop and strong demand should put
upward pressure on 2021/22 grower prices.
Walnut production forecast to decline in 2021/22: 2020/21 (September–August) was a
record year for walnut production, at 785,000 tons, with bearing acres of 380,000, up 4 percent
from last season. This volume drove U.S. walnut grower prices to their lowest level since 2008
(table 5, reported on shelled basis). Combined with abundant supplies and international
demand, exports grew 25 percent from last season. The 2021 California Walnut Objective
Measurement Report, released by USDA, NASS on September 1, forecast walnut production to
decline to 1.34 billion pounds (or 670,000 tons) on an in-shell basis, down 15 percent from last

20 Fruit and Tree Nuts Outlook: September 2021, FTS-373, September 29, 2021
USDA, Economic Research Service
year. A high degree of frost damage and the on-going drought decreased nut sets per tree,
likely supporting 2021/22 walnut grower prices.
Hazelnut production forecast on par with 2020/21: As of September 2021, the Hazelnut
Marketing Board projected Oregon’s production to be 62,600 tons for 2021/22 (July–June). The
Hazelnut Marketing Board released its annual Subjective Yield Survey, conducted in mid-July.
Some growers project growth, while others expect a decrease due to an ice storm in February,
and heat and drought in the summer months. In May 2021, the USDA, NASS Noncitrus Fruit
and Nuts 2020 Summary estimated 2020 hazelnut production at 63,000 tons, on high-bearing
acres and average yield. Oregon’s hazelnut 2021/22 production is estimated to be less than one
percent lower than the 2020/21 harvest. High carryover stocks in 2020/21 will likely put
downward pressure on hazelnut grower prices this season.
Record high U.S. pistachios in 2020/21: U.S. production rose 41 percent from the previous
season (September–August) to over 1 billion pounds (in-shell basis), or 525 million pounds
(shelled basis) in 2020/21. Pistachios are an alternate-bearing crop, and the 2020/21 season
was an “on” year for California. In addition, favorable weather, increases in bearing acres, and
new plantings led to a record for pistachio production, valued at $2.87 billion.
U.S. exports (September through July) were up 21 percent from the same period last season,
with higher volumes to China and Germany, top foreign markets for U.S. pistachios. Imports
although very small —roughly 1 percent of the U.S. pistachio market in 2020/21— are up this
season. U.S. imports are expected to increase roughly 100 percent compared with the previous
season due to higher shipments from Turkey. A record-setting domestic crop will leave 2020/21
ending stocks at above-average levels, putting downward pressure on grower prices.
Lower pecan prices in 2020/21: Domestic pecan production in 2020/21 (October–September)
is expected to be 13 percent higher than last season to 153 million pounds (shelled basis).
Georgia’s production increased, making it the top supplier again. Freezing temperatures earlier
in the season lowered yields in other top-producing States, including Arizona, New Mexico, and
Oklahoma. Increasing domestic supply and above-average beginning stocks, drove down
2020/21 grower prices from the previous season. U.S. exports to China were up this season
through July, likely a result of high Chinese demand, and low pecan prices. USDA, NASS will
release the initial U.S. pecan production forecast for the 2021/22 season in its October 2021
Crop Production report.
Smaller macadamia nut crop for 2020/21: Hawaii’s macadamia production in declined
2020/21, as growers reported disease and labor shortages, putting upward pressure on 2020/21

21 Fruit and Tree Nuts Outlook: September 2021, FTS-373, September 29, 2021
USDA, Economic Research Service
grower prices. The smaller crop and higher prices slowed export volumes to several markets,
including Hawaii’s top export markets—China, Japan, and Canada. Shelled Imports, largely
from South Africa, Kenya, and Australia, declined in 2020/21.
Table 4--Tree nuts: Supply, utilization, and grower price in the United States, by commodity and marketing year, 2016/17-2020/21Loss Utilization Season-
Utilized and Marketable Beginning Total Ending Per averageSeason 1 production exempt 2 production 3 Imports stocks supply stocks Exports Domestic capita grower price
Pounds $/lbAlmonds2016/17 2,140,000 46,984 2,093,016 26,585 412,001 2,505,017 398,677 1,436,349 669,991 2.07 2.392017/18 2,270,000 54,734 2,215,266 32,523 398,677 2,646,466 359,013 1,534,858 752,596 2.31 2.532018/19 2,280,000 55,821 2,224,179 32,282 359,013 2,615,476 318,319 1,524,772 772,383 2.36 2.502019/20 2,560,000 59,809 2,500,191 26,318 318,319 2,844,828 450,122 1,611,200 783,506 2.38 2.452020/21 P 3,115,000 70,187 3,044,813 21,625 450,122 3,516,560 608,137 2,092,588 815,834 2.46 1.83Hazelnuts2016/17 35,106 741 34,365 11,508 211 46,084 3,106 25,372 17,605 0.05 1.352017/18 25,600 85 25,515 13,775 3,106 42,396 1,401 20,039 20,956 0.06 1.152018/19 40,800 261 40,539 16,764 1,401 58,704 6,524 20,622 31,557 0.10 0.902019/20 35,200 278 34,922 13,522 6,524 54,968 3,724 21,786 29,458 0.09 0.962020/21 P 48,854 1,182 47,672 10,539 3,724 61,936 7,166 27,032 27,738 0.08 1.05Pecans2016/17 127,935 - 127,935 132,637 55,633 316,205 69,489 103,655 143,062 0.44 2.592017/18 141,146 - 141,146 137,100 69,489 347,734 80,081 113,472 154,182 0.47 2.332018/19 103,600 - 103,600 166,009 80,081 349,690 87,953 93,892 167,844 0.51 1.752019/20 134,701 - 134,701 153,759 87,953 376,413 103,045 96,667 176,701 0.54 1.842020/21 P 152,679 - 152,679 137,967 103,045 393,692 84,192 115,056 194,443 0.60 1.43Walnuts2016/17 608,431 883 607,548 15,731 56,571 679,850 49,372 446,957 183,521 0.57 0.932017/18 557,143 884 556,259 12,740 49,372 618,370 56,046 399,256 163,068 0.50 1.252018/19 601,476 886 600,591 2,556 56,046 659,192 58,504 419,333 181,355 0.55 0.682019/20 559,240 854 558,386 2,680 58,504 619,570 54,521 387,819 177,231 0.54 0.952020/21 P 685,381 873 684,508 1,933 54,521 740,961 62,000 483,564 195,397 0.59 0.61Macadamias2016/17 19,081 17,478 na 36,558 na 13,327 23,231 0.07 1.002017/18 22,261 21,107 na 43,367 na 9,978 33,389 0.10 1.102018/19 16,037 28,114 na 44,150 na 7,325 36,825 0.11 1.192019/20 18,490 25,483 na 43,973 na 8,844 35,129 0.11 1.202020/21 P 17,945 18,517 na 36,461 na 5,578 30,884 0.09 1.24Pistachios2016/17 446,299 - 446,299 1,363 51,133 498,795 126,769 231,847 140,179 0.43 1.682017/18 226,915 226,915 1,585 126,769 355,269 39,548 179,090 136,631 0.42 1.692018/19 487,457 - 487,457 1,284 39,548 528,289 65,247 303,577 159,465 0.49 2.652019/20 370,725 - 370,725 1,628 65,247 437,600 72,078 207,612 157,910 0.48 2.812020/21 P 524,822 - 524,822 3,317 72,078 600,217 142,637 251,764 205,816 0.62 2.75Other nuts2016/17 - - - 491,927 - 491,927 - 124,291 367,637 1.13 - 2017/18 - - - 519,958 - 519,958 - 138,514 381,444 1.17 - 2018/19 - - - 473,195 - 473,195 - 117,694 355,501 1.08 - 2019/20 - - - 532,551 - 532,551 - 106,343 426,208 1.29 - 2020/21 P - - - 511,832 - 511,832 - 80,620 431,211 1.30 - Total2016/17 3,376,852 48,609 3,328,244 697,229 575,549 4,601,024 647,413 2,381,797 1,571,811 4.85 - 2017/18 3,243,064 55,704 3,187,361 738,837 647,413 4,573,611 536,089 2,395,209 1,642,263 5.042018/19 3,529,370 56,967 3,472,403 720,219 536,089 4,728,711 536,547 2,487,232 1,704,931 5.20 - 2019/20 3,678,356 60,941 3,617,415 755,941 536,547 4,909,903 683,490 2,440,270 1,786,143 5.42 - 2020/21 P 4,544,681 72,242 4,472,439 705,729 683,490 5,861,659 904,132 3,056,202 1,901,325 5.74 - P = Preliminary. 1 Season begins in July for hazelnuts, macadamias, and other tree nuts (includes Brazil, pignolias, chestnuts, cashews, and mixed nuts); August for almonds; September for pistachios and walnuts; and October for pecans. 2 Utilized production minus marketable production, which includes inedibles and noncommercial usage. 3 Marketable production is used to calculate consumption.Source: USDA, Economic Research Service calculations.
----------1,000 pounds (shelled basis) ----------

22 Fruit and Tree Nuts Outlook: September 2021, FTS-373, September 29, 2021
USDA, Economic Research Service
Commodity Highlight: Almonds Jaclyn Kramer
Americans consume more almonds than any other tree nut. U.S. per capita availability grew 200
percent from 0.8 pounds per person in the 2000/01 season (August–July) to a record high of 2.5
pounds per person in 2020/21. U.S almond production has steadily grown as demand, both
domestic and foreign, soars. The United States is the world’s leading almond producer. In 2020,
U.S. almond production reached a record high of over 3.1 billion pounds, valued at $5.6 billion.
On the production side, the expansion of U.S. almond production is likely due to a combination
of an increase in acres, precision irrigation management systems, the use of mechanical
harvesting, and new varieties. The record high production in the past three years coincided with
lower prices (figure A1).
Overall yield is trending upward. The fluctuation in yield from year to year is due to the
alternative-bearing cycle of almonds (figure A2). The 2021 forecast yield is 2,110 pounds per
acre, a reduction from the 2020 yield of 2,490 pounds per acre. California’s bearing acreage for
2021 is an estimated 1.33 million acres, a slight increase from 1.25 million bearing acres in
2020.
0
0.5
1
1.5
2
2.5
3
3.5
4
4.5
0
500
1000
1500
2000
2500
3000
3500
Dollars per poundMillion pounds
Figure A1U.S. almond production and grower prices, 2000-2021
Note: f= forecast.Source: USDA, Economic Research Service using USDA, National Agricultural Statistics Service data.

23 Fruit and Tree Nuts Outlook: September 2021, FTS-373, September 29, 2021
USDA, Economic Research Service
Almonds are a high-value crop, attracting producers that switched to growing almonds from
other commodities. With a tight labor market, another possible reason for a shift to almond
production is the reduced demand for labor. Almonds are almost all harvested by mechanical
trunk shakers and later picked up by mechanical carts, requiring less labor for harvesting than
other crops.
Nearly all U.S. commercially produced almonds are from California. Fresno, Kern, Stanislaus,
Merced, and Madera are the leading almond-producing counties. These five counties, located in
the Central Valley, accounted for 73 percent of the total bearing acreage in 2020. Dry and warm
weather and ideal soil conditions provide excellent bloom conditions for almond trees in Central
California.
The almond harvest is typically August to October. USDA, NASS 2021 California Objective
Measurement Report, released in July 2021, estimated that 2021/22 almond production will
decline 10 percent to 2.8 billion pounds. Production was affected by low water levels due to
below average rainfall and low snowpack levels, in addition to warm weather in June 2021.
The current drought in California emphasizes the resources necessary for almond production.
Tree nuts require more water than all other California tree crops. The University of California,
Davis (UC Davis) reported that roughly 40 inches of water per acre is needed annually to grow
almonds. That is the third highest water use per acre in California for tree fruit, exceeded only
by pistachios and walnuts. While the industry’s adoption of advanced precision irrigation
0
500
1,000
1,500
2,000
2,500
3,000
0
2
4
6
8
10
12
14Pounds100,000 acres
Figure A2Almond bearing acreage and yield per acre, 2000 to 2021
Bearing acreage Non-bearing acreage Yield (pounds per acre)Note: f = forecast.Source: USDA, Economic Research Service using USDA, National Agricultural Statistics Service and Almond Board of California Data.

24 Fruit and Tree Nuts Outlook: September 2021, FTS-373, September 29, 2021
USDA, Economic Research Service
systems aids in improving yields and conserving water, the current drought in California
presents a challenge for many almond growers. Water availability is causing some growers to
make tough decisions, including removing almond trees.
Almond production also requires pollination. In the winter months, when almond flowers bloom,
bees are brought to the orchards. UC Davis reported last year that over 80 percent of U.S.
beehives were used to pollinate almond orchards. With colony collapse disorder, the future of
bee health may pose a challenge to the growth of the almond industry.
Over the last two decades, the United States exported 60 percent of the almond crop. U.S.
exports reached an all-time high of over 2 billion pounds in the 2020/21 season (table A1).
Exports are up 6 percent this season from the prior season despite port and trade disruptions.
The rise of exports is due to international demand from markets including, India, China, Spain,
the Netherlands, Germany, Japan, and Hong Kong. Almond shipments to China are up 154
percent compared to last season after a reduction in shipments since 2018/19 as a result of
retaliatory tariffs. Last year, the reduction in retaliatory tariffs, down from 55 percent to 25
percent, and lower almond prices, stimulated exports to China.
Imports are small, just 3 percent of domestic availability in 2020/21. Imports reached 22 million
pounds in the 2020/21 season compared with less than 1 million in 2000/01. Australia and
Spain supply about 70 percent of U.S. almond imports annually. Australia production has been
increasing however future growth is constrained due to water scarcity. Production in Spain is
also slowing. Imports from Spain are mostly organic almonds to help meet U.S. demand and
specialty Marcona almonds. The United States both exports and imports almonds from Spain.
Slowed growth in foreign production and strong domestic and international consumption will
continue to keep U.S. almonds in demand. California’s bearing acres continue to rise, although
growth in non-bearing acres has slowed. This growth in California’s overall almond acres comes
despite the challenges and rising costs growers face in a State known as the world’s leading
supplier of almonds.

25 Fruit and Tree Nuts Outlook: September 2021, FTS-373, September 29, 2021
USDA, Economic Research Service
Table A1 --Almonds: Supply and utilization (shelled basis), by marketing year, 2000/01-2020/21Domestic consumption
Marketing Beginning Marketable Total Ending Per year 1/ stocks production 2/ Imports supply Exports stocks 3/ Total capita
--Million pounds-- Pounds
2000/01 175.9 677 0.4 853 513 107.3 232.7 0.822001/02 107.3 801 0.8 909 586 80.9 242.1 0.842002/03 80.9 1,070 1.9 1,153 674 162.0 316.9 1.092003/04 162.0 1,018 2.8 1,183 699 148.9 335.2 1.152004/05 148.9 965 5.7 1,120 713 137.7 269.3 0.912005/06 137.7 879 9.2 1,025 728 112.2 184.7 0.622006/07 112.2 1,086 8.1 1,207 768 133.9 304.9 1.012007/08 133.9 1,349 7.1 1,490 891 231.2 367.0 1.212008/09 231.2 1,582 4.2 1,817 980 413.7 423.6 1.382009/10 413.7 1,364 5.6 1,783 1,031 321.3 431.0 1.402010/11 321.3 1,612 8.1 1,941 1,188 254.0 499.3 1.612011/12 254.0 1,990 15.9 2,259 1,358 335.2 566.2 1.812012/13 335.2 1,854 39.4 2,229 1,281 317.2 630.8 2.002013/14 317.2 1,949 33.9 2,301 1,337 350.6 613.1 1.932014/15 350.6 1,812 31.2 2,194 1,269 376.6 547.8 1.712015/16 376.6 1,857 31.8 2,265 1,272 412.0 580.5 1.802016/17 412.0 2,093 26.6 2,532 1,436 398.7 696.6 2.072017/18 398.7 2,215 32.5 2,646 1,535 359.0 752.6 2.312018/19 359.0 2,224 32.3 2,615 1,525 318.3 772.4 2.362019/20 318.3 2,500 26.3 2,845 1,611 450.1 783.5 2.382020/21 450.1 3,045 21.6 3,517 2,093 608.1 815.8 2.461/ Marketing season begins August 1 for almonds. 2/ Utilized production minus inedibles and noncommercial useage. 3/ Stock figures from the Almond Board of California. Source: USDA, Economic Research Service using National Agricultural Statistical Service and U.S. Department of Commerce, Bureau of the Census data.

26 Fruit and Tree Nuts Outlook: September 2021, FTS-373, September 29, 2021
USDA, Economic Research Service
Special Article Fresh Fruit Availability Expands in the United States
Jaclyn Kramer
Year-round demand for fresh fruit, increased interest in healthier diets, and a general rise in
population drove change in the produce industry. For many fresh fruit commodities, U.S.
production is growing to meet demand while imports are expanding. Greater supply benefits
U.S. consumers but may hurt domestic producers if they face increased competition from
imports during the U.S. production season. This article examines trends in annual import
availability and changes in seasonal shipment patterns for five fresh fruit commodities—
avocados, blueberries, table grapes, strawberries, and watermelon between 2008 and 2010 to
2018 to 2020.
Per capita availability of blueberries from all sources grew the most among these five
commodities—up 132 percent from 0.96 pounds per person in 2008–10 to 2.23 pounds per
person in 2018–20. Avocado per capita availability increased from an average of 5 pounds per
person in 2008–10 to 8 pounds per person in 2018–20. U.S. availability of fresh strawberries,
the most consumed berry, grew 22 percent from 2008–10 to 7 pounds per person in 2018–20.
Fresh table grape and watermelon per capita availability trended flat over the last two decades.
Fresh table grape availability has been about 8 pounds per person since 2008–10, while
watermelon per capita availability ranged from 14 to 16 pounds per person.
In 2018–20, imports played a larger role in domestic availability for four of the five fruit than they
did in 2008–10 (figure SA1). For table grapes, the import share of availability declined slightly
because imports were down in 2018. Import shares ranged from 18 percent for strawberries to
90 percent for avocados. The import share of domestic availability depends on changes in
imports and changes in domestic production. Imports can be from the foreign operations of U.S.
firms, many of them are large U.S. grower/shippers. These firms may import to increase
supplies in months when their own production may be too low to meet their buyers’ demands or
to reduce production costs. Smaller growers, which may not have the ability to optimize profit
across national boundaries, may face more pressure from import competition.

27 Fruit and Tree Nuts Outlook: September 2021, FTS-373, September 29, 2021
USDA, Economic Research Service
Strawberries
U.S. strawberry production grew 16 percent from 2008–10 to 2018–20, to roughly 2 billion
pounds (figure SA2). Strawberries are primarily grown in California (about 90 percent) and
Florida (about 8 percent). Some California growers ship strawberries every month, most ship
during April to October. Florida growers supply fresh strawberries mainly from December to
May. Comparing shipments from the last decade shows Florida’s production from 2018-20 is
higher in December through March. Central California’s production increased every month
except March. Shipments from the South California region declined every month but May.
Producers in the southern region were affected by more imports from Mexico during their
season and they operate in an area with high-cost land. Production in that area declined, with
some moving to other parts of California with lower land prices or to Mexico.
0102030405060708090
100
Avocados Blueberries Strawberries Table grapes Watermelons
Percent
Figure SA1U.S. imports share of domestic availability, 2008-10 to 2018-20
2008-10 2018-20
Note: import share = U.S. imports/total domestic availability.

28 Fruit and Tree Nuts Outlook: September 2021, FTS-373, September 29, 2021
USDA, Economic Research Service
Strawberry imports increased over 127 percent from 2008–10 to 2018–20. Over 99 percent of
fresh strawberry imports are produced in Mexico. The majority of import shipments arrive
between November and March, with some smaller shipments in other months. The increase in
Mexican strawberry shipments may be due to increased plantings, and the use of tunnel
production to better control the growing environment.
With imports growing much faster than domestic production, the import share of availability rose
rapidly —from 8 percent of strawberries available in 2008–10 to nearly 20 percent in 2018–20.
Annual imports reached a record high in 2020 of over 430 million pounds. Imports overlap with
domestic supply in the winter and early spring months, directly competing with Florida as well as
Southern California, where production seems to have experienced the most impact from
imports.
Blueberries
U.S. blueberries are produced in many States, unlike strawberries which are mainly grown in
California and Florida (figure SA3). Since 2008–10, fresh U.S. blueberry production increased
55 percent. In 2008–10, the largest U.S. producers of fresh-market blueberries were New
Jersey and Michigan. California, Washington, and Florida were smaller producers. In 2018–20,
California, Georgia and Oregon were the largest suppliers; smaller producers included Florida,
Michigan, New Jersey, North Carolina, and Washington. In 2008–10, most shipments occurred
between April through September. In 2018–20, the season extended to every month although
shipments outside of the March–September season are small. California has year-round
0
50
100
150
200
250
300Million pounds
Figure SA2Fresh strawberry shipments, 2008-10 to 2018-20
Central California South California Florida Mexico
2008-10 2018-20
Source: USDA, Agricultural Marketing Service, Market News, Movement data.

29 Fruit and Tree Nuts Outlook: September 2021, FTS-373, September 29, 2021
USDA, Economic Research Service
production, with very little in the winter. Florida’s production peaks from May to June, which
leads to production in Georgia, North Carolina, and New Jersey. Blueberry production in
Michigan, Oregon, and Washington then follows, with the largest shipments from July to
September.
Imports of fresh blueberries rose over 200 percent between 2008–10 and 2018–20. In 2010,
Chile was the main foreign supplier of fresh blueberries to the United States during the U.S. off-
season. Since 2010, Chile lost market share of the U.S. fresh blueberry market to Mexico and
Peru. In 2020, about 80 percent of U.S. blueberry imports came from three countries: Peru,
Mexico, and Chile (figure SA4). Peru’s blueberry exports increased rapidly; in 2019, Peru
became the leading supplier of U.S. blueberry imports— accounting for 40 percent of U.S. fresh
blueberry availability. Peru’s shipments supply the U.S. market in the fall months. Imports from
Mexico increased on average 500 percent from 2008–10 to 2018–20. Mexico’s shipments are
the largest in the spring months.
0
5
10
15
20
25Million pounds
Figure SA3Fresh domestic blueberry shipments, 2008-10 to 2018-20
California Michigan New Jersey Northwest Southeast
2008-10 2018-20
Note: Northwest = Oregon and Washington, Southeast = Florida, Georigia and North Carolina.Source: USDA, Agricultural Marketing Service, Market News, Movement data.

30 Fruit and Tree Nuts Outlook: September 2021, FTS-373, September 29, 2021
USDA, Economic Research Service
Fresh blueberry per capita availability has grown over 130 percent since 2008–10. With imports
growing faster than domestic production, Imports comprised 61 percent of U.S. blueberry
availability in 2018–20—up from 47 percent in 2008-10. In 2008-10, Chile was the main supplier
of fresh blueberries to the United States in the off-season. Since then, Mexico shipments grew
in the winter and early spring months competing with California and Florida. Peru’s shipments
increased in the fall months, overlapping with the end of U.S. season production from Michigan,
Washington and Oregon.
Increases of imports of seasonal and perishable fruit, including blueberries, led to a hearing with
testimony from different sides in 2020. At the request of the U.S. Trade Representative, the U.S.
International Trade Commission (USITC) opened an investigation in 2020 to determine whether
fresh, chilled, or frozen blueberries were entering the United States in such increased quantities
as to be a substantial case of serious injury, or the threat of serious injury, to the U.S. blueberry
industry. In March 2021, the USITC decided that imports did not seriously injure the domestic
industry, citing increased acreage, production, employment, productivity, shipments, and
investments as evidence to the contrary. The USITC looks at the entire industry, not a group of
seasonal producers to determine injury.
Watermelons
Watermelons are consumed more than any other melon in the United States—per capita
availability, from all sources, ranged from 14 to 16 pounds per person over the last two decades
(figure SA5). U.S. production decreased 10 percent between 2008–10 and 2018–20.
Watermelon is another crop that is produced in many States, including Florida, Georgia, Texas,
0
10
20
30
40
50
60
70Million pounds
Figure SA4Fresh domestic and import blueberry shipments, 2008-10 to 2018-20
Chile Mexico Peru United States
2008-10 2018-20
Source: USDA, Agricultural Marketing Service, Market News, Movement data.

31 Fruit and Tree Nuts Outlook: September 2021, FTS-373, September 29, 2021
USDA, Economic Research Service
California, South Carolina, and Arizona. Domestic shipments are primarily April to October. The
majority of watermelons consumed are produced domestically.
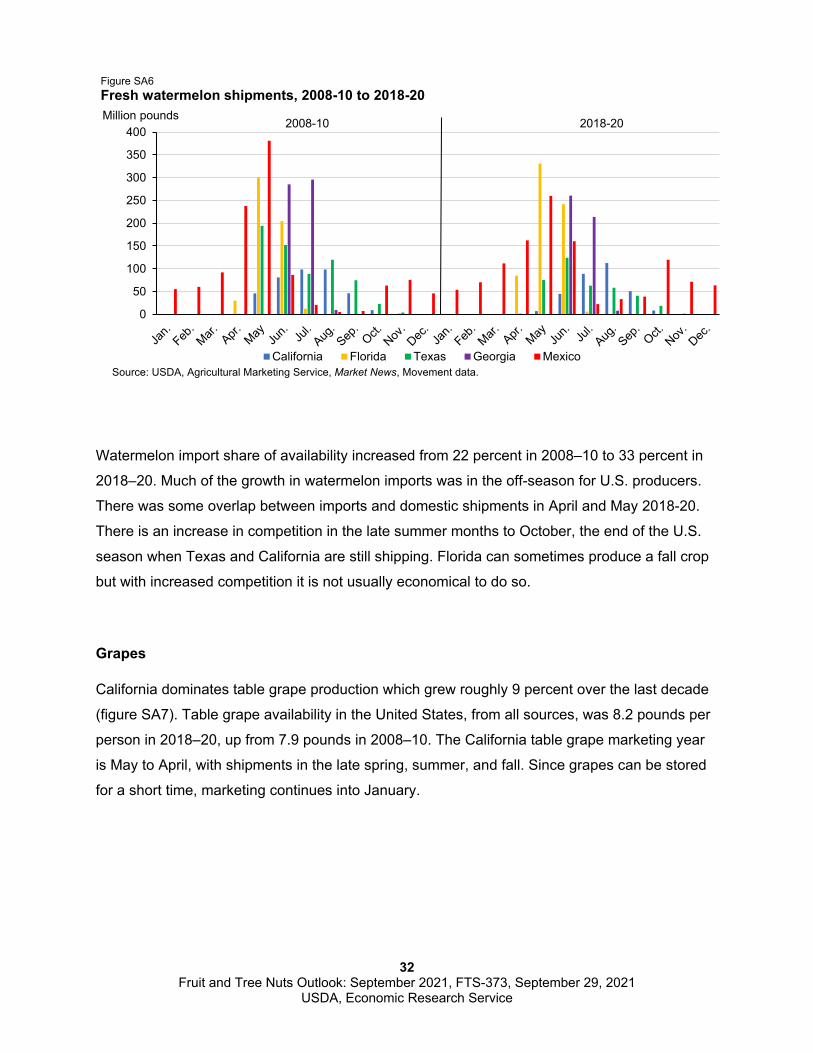
Watermelon imports have grown 63 percent from 2008–10 to 2018–20. U.S. imports reached a
record high 1.73 billion pounds in 2019. In the past two decades, over 80 percent of watermelon
imports came from Mexico. One reason Mexico is the leading supplier to the United States may
be transportation costs, since watermelons contain a lot of water and are heavy. In 2018-20, the
main Mexican season runs from October through June and shipments peak in May (figure SA6).
Foreign suppliers like to extend their season to Memorial Day, since is the most popular day for
U.S. watermelon consumption, after the 4th of July. October watermelon imports from Mexico
grew larger in the 2018-20 period compared to a decade before.
024681012141618
0
1,000
2,000
3,000
4,000
5,000
6,000Pounds per personMillion pounds
Figure SA5U.S. watermelon market
Imports Net production* Per capita useNet Production* = Total Production minus exports.Source: USDA, Economic Research Service.
32 Fruit and Tree Nuts Outlook: September 2021, FTS-373, September 29, 2021
USDA, Economic Research Service
Watermelon import share of availability increased from 22 percent in 2008–10 to 33 percent in
2018–20. Much of the growth in watermelon imports was in the off-season for U.S. producers.
There was some overlap between imports and domestic shipments in April and May 2018-20.
There is an increase in competition in the late summer months to October, the end of the U.S.
season when Texas and California are still shipping. Florida can sometimes produce a fall crop
but with increased competition it is not usually economical to do so.
Grapes
California dominates table grape production which grew roughly 9 percent over the last decade
(figure SA7). Table grape availability in the United States, from all sources, was 8.2 pounds per
person in 2018–20, up from 7.9 pounds in 2008–10. The California table grape marketing year
is May to April, with shipments in the late spring, summer, and fall. Since grapes can be stored
for a short time, marketing continues into January.
0
50
100
150
200
250
300
350
400Million pounds
Figure SA6Fresh watermelon shipments, 2008-10 to 2018-20
California Florida Texas Georgia Mexico
2008-10 2018-20
Source: USDA, Agricultural Marketing Service, Market News, Movement data.

33 Fruit and Tree Nuts Outlook: September 2021, FTS-373, September 29, 2021
USDA, Economic Research Service
Table grape imports grew 9 percent over the last decade. Many countries export fresh grapes to
the United States, including Chile, Peru, and Mexico. In 2008-10, table grape imports were
contra-seasonal to California’s shipments. Chile was the dominant off-season supplier to the
U.S. market in 2008–10. Over time, imports from Peru and Mexico, which are both closer to the
U.S. market than Chile, have grown. Peru could overtake Chile as the dominant supplier in the
2021/22 season due to the rapid year-over-year growth in shipments. Peru’s advantages
include dry, favorable weather conditions, labor availability, and adoption of advanced drip
irrigation systems. Mexico’s table grape exports reached a record high in the 2019/20 season,
declining slightly the following season. Mexico’s production is mainly in Sonora, where growers
are planting newer varieties, that may allow for an earlier harvest.
Imports from Chile tend to peak in the spring before U.S. production starts and before Mexico
shipments. Chile’s shipments declined in January as Peru provides more grapes to the U.S.
market. Mexico shipments peak in June, leading into California’s season. Peru starts exporting
in November and December, which is toward the end of California’s season.
With domestic production and imports increasing almost equally, the import share of the
availability for grapes has remained almost unchanged since 2008–10, down 2 percent.
Harvesting seasons are lengthening in the United States and abroad as growers try to capture
the high prices at the beginning and end of the season. U.S. early season shipments in May
through June from the Coachella Valley in Southern California declined 23 percent between
0
100
200
300
400
500
600
700
Jan. Mar. May Jul. Sept. Nov. Jan. Mar. May Jul. Sept. Nov.
Million pounds
Figure SA7Grape shipments by major suppliers, 2008-10 to 2018-20
Central California South California Chile Mexico Peru
Source: USDA, Agricultural Marketing Service, Market News, Movement Data.
2008-10 2018-20

34 Fruit and Tree Nuts Outlook: September 2021, FTS-373, September 29, 2021
USDA, Economic Research Service
2008–10 and 2018–20 as imports of grapes from Sonora, Mexico, continued later in the spring
and into early summer. Shipments from the San Joaquin Valley, which begin in late June or
early July and end in January, increased despite additional imports from Mexico and Peru.
Avocados
California, the main U.S. producer, harvests avocados year-round. Since avocados can mature
on the tree for an extended period, U.S. growers look for opportunities to balance fruit quality
with market conditions, and often when there is less price pressure from Mexican imports. From
2018–20, peak imports from Mexico occurred from May through July. California avocado
production decreased 9 percent from 2008-10 to 2018-20. Some reasons behind the decline
include a wildfire in 2017 that destroyed orchards, and mandatory water reductions in certain
avocado production areas, that encouraged some growers to abandon orchards or reduce tree
size to reduce water needs.
Mexico is the leading global supplier of avocados, with over 80 percent of Mexico’s avocado
exports shipped to the United States. Between 2008–10 and 2018–20 imports from Mexico
increased 260 percent. Mexico ships avocados every month, but fewer in the summer months
(figure SA8). Mexico’s exports to the United States have grown, likely due to increases in area
planted in Michoacán, the main avocado production area in Mexico and the only State allowed
to export to the United States because of phytosanitary issues. The USDA Foreign Agricultural
Service reported that Mexico growers are working to improve yields to meet U.S. demand. Peru
is the second-largest foreign supplier after Mexico; in 2018–20, roughly 7 percent of U.S.
imports came from Peru. Peru’s good growing conditions, combined with an increase in
plantings, will likely continue to increase the country’s exports. Peru’s harvest usually peaks
from May to July.
With domestic avocado production declining 9 percent and imports overall increasing 199
percent, the import share of availability for avocados has increased 28 percent to 90 percent in
2018-20. U.S. growers plan their shipments around Mexican shipments. Now Peruvian imports
are arriving during the summer when U.S. growers have traditionally shipped their fruit. With the
large increase in per capita consumption, up 88 percent, prices have been adequate to support
U.S. growers.

35 Fruit and Tree Nuts Outlook: September 2021, FTS-373, September 29, 2021
USDA, Economic Research Service
Summary
In the last decade, U.S. consumer demand for fruit increased, and domestic production and
imports expanded. Over time, U.S. growers and foreign suppliers to the U.S. market have tried
to expand their seasons to target high prices that often exist between seasons. In 2018–20,
there is more supply in the beginning and end of the U.S. and import season, creating an
overlap. The supply changes are likely shifting seasonal prices.
Import share depends on changes in both domestic production and imports. Import share is a
measure of imports in domestic availability, but it does not tell the whole story. For instance,
avocados have the highest import share, yet the California avocado industry is managing the
increase of imports because of the large growth in per capita consumption which raised prices
for all producers. In some cases, import share has barely changed, as in the case of table
grapes, but certain parts of the grape industry are affected by imports. The Coachella Valley is
one example of where domestic production declined because of the competition of imports from
Mexico.
There are new foreign suppliers in the U.S. market in the last decade for several commodities,
which changed the market dynamics from the earlier period. Chile was the traditional off-season
supplier of table grapes and blueberries to the U.S. markets. Peru’s exports of table grapes and
blueberries grew rapidly and pose more competition to U.S. growers. Peru’s supplies tend to
enter the market when the U.S. table grape and blueberry season tapers off, capturing higher
0
50
100
150
200
250
Million pounds
Figure SA8 Fresh avocado shipments, 2008-10 to 2018-20
California Mexico Peru
2008-10 2018-20
Source: USDA, Agricultural Marketing Service, Market News, Movement data.

36 Fruit and Tree Nuts Outlook: September 2021, FTS-373, September 29, 2021
USDA, Economic Research Service
seasonal prices when there is less supply in the U.S. market. Mexico is a new supplier for
blueberries. New avocado imports from Peru compete against U.S. shipments in the summer
when Mexican shipments are typically the lightest.
Imports are not always from “foreign” operations and don’t always hurt U.S. producers. Imports
are often organized by American firms. Some firms, often large U.S. grower/shippers, choose
where to produce in what seasons to maximize profits over an international operation. Smaller
firms may not have the resources to organize international operations, leaving them more
vulnerable to potential import competition.

37 Fruit and Tree Nuts Outlook: September 2021, FTS-373, September 29, 2021
USDA, Economic Research Service
Suggested Citation Kramer, Jaclyn, Skyler Simnitt, and Linda Calvin (2021), Fruit and Tree Nuts Outlook:
September 2021, FTS-373, U.S. Department of Agriculture, Economic Research Service,
September 29, 2021.
Use of commercial and trade names does not imply approval or constitute endorsement by USDA.
In accordance with Federal civil rights law and U.S. Department of Agriculture (USDA) civil rights regulations and policies, the USDA, its Agencies, offices, and employees, and institutions participating in or administering USDA programs are prohibited from discriminating based on race, color, national origin, religion, sex, gender identity (including gender expression), sexual orientation, disability, age, marital status, family/parental status, income derived from a public assistance program, political beliefs, or reprisal or retaliation for prior civil rights activity, in any program or activity conducted or funded by USDA (not all bases apply to all programs). Remedies and complaint filing deadlines vary by program or incident.
Persons with disabilities who require alternative means of communication for program information (e.g., Braille, large print, audiotape, American Sign Language, etc.) should contact the responsible Agency or USDA's TARGET Center at (202) 720-2600 (voice and TTY) or contact USDA through the Federal Relay Service at (800) 877-8339. Additionally, program information may be made available in languages other than English.
To file a program discrimination complaint, complete the USDA Program Discrimination Complaint Form, AD-3027, found online at How to File a Program Discrimination Complaint and at any USDA office or write a letter addressed to USDA and provide in the letter all of the information requested in the form. To request a copy of the complaint form, call (866) 632-9992. Submit your completed form or letter to USDA by: (1) mail: U.S. Department of Agriculture, Office of the Assistant Secretary for Civil Rights, 1400 Independence Avenue, SW, Washington, D.C. 20250-9410; (2) fax: (202) 690-7442; or (3) email: [email protected].
USDA is an equal opportunity provider, employer, and lender.