Embed Size (px)
Citation preview

Frost & Sullivan
Aerospace, Defence & Security Practice
CEO 360 Assessment of the Global Security Market
2012
Presented to

1,800 employees 40 Office Locations 32 Countries
Milan Sophia Antipolis
Paris
London Oxford
Frankfurt
Warsaw
Tel Aviv
Dubai
Cape Town Buenos Aires
Bogotá
São Paulo
Mexico City
San Antonio, TX
Mountain View, CA New York, NY
Toronto
Beijing
Chennai
Kuala Lumpur
Mumbai
Bangalore
Kolkata
Delhi
Singapore
Shanghai
Sydney
Seoul
Tokyo
Moscow
Istanbul
Auckland
Bangkok
Jakarta
Pune Hong Kong
Shenzen
Frost & Sullivan: Global Footprint
3
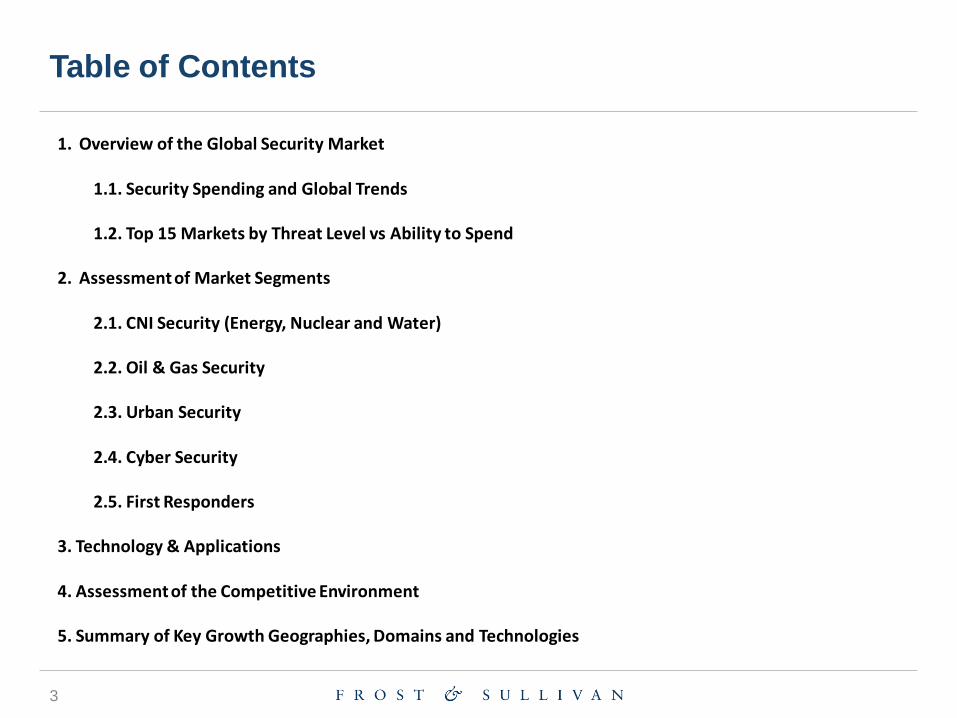
Table of Contents
1. Overview of the Global Security Market 1.1. Security Spending and Global Trends 1.2. Top 15 Markets by Threat Level vs Ability to Spend 2. Assessment of Market Segments
2.1. CNI Security (Energy, Nuclear and Water) 2.2. Oil & Gas Security 2.3. Urban Security 2.4. Cyber Security 2.5. First Responders 3. Technology & Applications 4. Assessment of the Competitive Environment
5. Summary of Key Growth Geographies, Domains and Technologies

Integrated Security one of the major Global Trends
Integrated Security
Increasing Innovation
Smart Architecture & Management
New Energy
Aging PopulationImproved IT Backbone
Increased Technological Sophistication
Shift in Global Balance of Power
Green Buildings
Preventative Healthcare
Top Ten Future Trends Affecting Security
$ B
illio
ns
Global Civil Security Spending by Region, 2010 - 2020
0153045607590
105120135150165180195210
2010 2011 2012 2013 2014 2015 2016 2017 2018 2019 2020
46 50 53 54.5 55 56 58 60 61 65 66
32 36 37 38 38.5 40 44 45 46 47 483032 33 34 36 40 42 45 47 48 50
810 11 12 14 15
17 19 20 22 25
45 6 8 9 8
88 9
1015
North America EuropeAPAC (Including India and China) Middle EastSouth America
Top Ten Global Trends
Frost & Sullivan estimates the global security market size at $140 billion currently and expects it to reach $200 billion by the year 2020. The growth is primarily driven by the US and emerging regions such as APAC and Middle East. This excludes cyber security spending.
The global security spend is calculating the spend across several security segments such as airports, mass transport, Oil & Gas, Utilities, Borders, Seaport and Maritime Security. The spending includes both government and private spending on these segments.
5
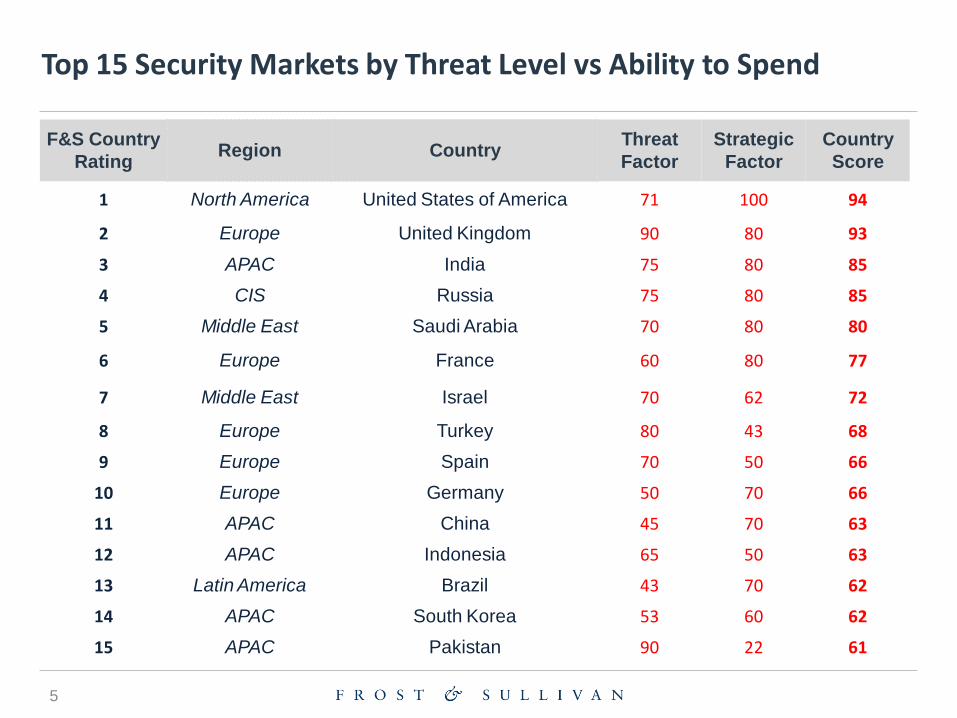
F&S Country
Rating Region Country
Threat
Factor
Strategic
Factor
Country
Score
1 North America United States of America 71 100 94
2 Europe United Kingdom 90 80 93
3 APAC India 75 80 85
4 CIS Russia 75 80 85
5 Middle East Saudi Arabia 70 80 80
6 Europe France 60 80 77
7 Middle East Israel 70 62 72
8 Europe Turkey 80 43 68
9 Europe Spain 70 50 66
10 Europe Germany 50 70 66
11 APAC China 45 70 63
12 APAC Indonesia 65 50 63
13 Latin America Brazil 43 70 62
14 APAC South Korea 53 60 62
15 APAC Pakistan 90 22 61
Top 15 Security Markets by Threat Level vs Ability to Spend

6
Security Spending by Threat Domains
CNI leads the way in terms of security spending however overall revenue contribution is slightly reducing, followed by border security and airport security, primarily driven increased threats. Oil & Gas security is also seen as a key growth segment in the next decade. CNI includes utilities sectors such as Energy and Water.
8.7%
14%
12.9%
11.6% 19.8%
14.5%
10%
4.5%
4%
% Spending by Domains, 2011
Maritime Oil & Gas Border Security
Mass Transport CNI Airports
Seaports CBRN Defence Large Events
8.2%
12.3%
13.4%
13.7% 17.4%
19.6%
7.8%
4.3% 3.4%
% Spending by Domains, 2020
Maritime Oil & Gas Border Security
Mass Transport CNI Airports
Seaports CBRN Defence Large Events

Critical National Infrastructure Security

Critical Infrastructure to Maintain Healthy Levels of Growth During Downturn
Infrastructure: Government-backed
projects to prove resilient to economic recession
Education is a reactive market – recent shootings in
throughout Europe and North America to maintain high level of growth
Government: National and International
organizations (IATA, ICAO, EUROCONTROL) are unwilling to reduce security investments in favour of cost cutting.
Gaming and Casinos
Low - Negative (5%-5%-)
High (10%<)
CA
GR
for
Ve
rtic
al M
arke
ts
Medium (5-10%)
Large
Market Size of Vertical Markets
Medium
Small 1>$) billion)
Growing Segments
Healthcare: driven by government projects in
Europe and North America
Banking and Finance: Security spend will remain
important for banks, but overall market will struggle.
Commercial: Retail sales are falling
worldwide, branches are closing and security investment will suffer.
Residential: Historically underperforming
the other verticals, the residential market has proven resilient during the economic recession

9
Critical National Infrastructure Security
Global CNI Security Market, 2010 - 2020
0
5
10
15
20
25
30
35
40
45
2010 2011 2012 2013 2014 2015 2016 2017 2018 2019 2020
9,108 9,21 9,56 9,85 10,23 10,47 10,98 11,47 11,98 12,52 13,068
6,336 6,52 6,89 7,05 7,45 7,83 8,2 8,56 8,93 9,32 9,504 5,94 6,23 6,65 6,98 7,37 7,85 8,43 8,7
9,1 9,45 9,9
1,584 1,87 1,93 2,08
2,24 2,65
3,1 3,78
4,1 4,67
4,95
1,13 1,78
1,96 2,46
2,87 3,1
3,22 2,83
2,91 2,99
3,02
North America Europe APAC (Including India and China) Middle East South America
Re
ven
ue
($ B
illi
on
s)
North America and Europe to lead the way in CNI security spending – driven by heightened threat perception and government assets increasingly seen as favourable targets for terrorist threats. The market is expected to grow from $24 billion in 2010 to approximately $40 billion in 2020 with more than 50% of the spending driven by NA and EU. On a longer run with increased IP penetration , APAC will emerge as a key growth region.

Nuclear Plants
Nuclear Power
2010 2020 2015
Key Impact/Opportunities
1) Focus on safety
2) Life extensions
- up to 20 years = (€500
million)
- new plant = €5 - €6 billion
3) New equipment orders =
approximately 60 pressure
vessels ordered in the next five
years, despite Fukushima
Number of Reactors Planned and Under Construction
Fukushima Accident Start of UK nuclear build
2nd Wave of Gen III+ construction
442 reactors in operation 480+ reactors operational
Source: PRIS, Frost & Sullivan
Global Safety Reviews
65 reactors under construction
Finalised construction of ITER

Power Plant Decommissioning
Power Plant Decommissioning
2010 2020 2015
Key Impact/Opportunities
1) Obvious point decommissioning = need for
replacement plants
- Europe – gas likely to play a key role
- Baseload power needed
- Middle East – gas
- Africa – mixture
2) Potential revenues from remediation work to restore
sites/prepare sites for new development
- Nuclear €300 million per reactor
- Opps for specialist waste companies/EPC players
that could expand
Likely Decommissioning In Selected Regions, 2010 - 2020
First of substantial wave of gas-fired plant closures
Closure of substantial coal-fired capacity in Europe to comply with the
Large Combustion Plant Directive
Gradual closure of nuclear-fired power stations in Europe
and North America
Source: Frost & Sullivan
0
10
20
30
40
50
60
70
80
90
Europe Eastern Europe & Russia
Middle East Africa
Cap
acit
y D
eco
mm
issio
ned
(G
W)

Oil & Gas Security

Oil and Gas Infrastructure Security Market - Revenue
Forecast by Region
0,00
5,00
10,00
15,00
20,00
25,00
30,00
35,00
2011 2012 2013 2014 2015 2016 2017 2018 2019 2020 2021
2011 2012 2013 2014 2015 2016 2017 2018 2019 2020 2021
Africa 0,68 0,71 0,74 0,78 0,81 0,85 0,89 0,94 0,98 1,03 1,08
Europe (including Russia) 1,89 2,00 2,11 2,23 2,36 2,49 2,63 2,77 2,93 3,09 3,27
South America 1,42 1,52 1,63 1,75 1,88 2,01 2,16 2,31 2,48 2,66 2,87
Asia Pacific 4,56 4,83 5,11 5,40 5,72 6,05 6,40 6,77 7,16 7,58 8,02
Middle East 3,59 3,81 4,05 4,30 4,57 4,85 5,15 5,47 5,81 6,17 6,55
North America 6,16 6,44 6,72 7,02 7,32 7,65 7,98 8,33 8,70 9,08 9,48
Re
ven
ue
($ B
illio
n)
Oil and Gas Infrastructure Security Revenue Forecast by Region: Global, 2011–2021
Note: All figures are rounded. The base year is 2011. Source: Frost & Sullivan analysis.
Key Takeaway: South America will be the region with greatest growth in security spending followed by Middle East
and Asia pacific

Oil and Gas Infrastructure Security Market - Revenue Forecast
by Segment
0,00
5,00
10,00
15,00
20,00
25,00
30,00
35,00
2011 2012 2013 2014 2015 2016 2017 2018 2019 2020 2021
2011 2012 2013 2014 2015 2016 2017 2018 2019 2020 2021
Security Services 3,30 3,48 3,67 3,87 4,08 4,30 3,78 3,99 4,21 4,44 4,69
Cyber Security 1,28 1,35 1,43 1,50 1,59 1,67 3,03 3,19 3,37 3,55 3,75
Perimeter Security 2,38 2,51 2,65 2,79 2,95 3,11 2,77 2,93 3,09 3,26 3,44
Access Control 1,83 1,93 2,04 2,15 2,27 2,39 2,27 2,39 2,53 2,67 2,81
Surveillance 3,85 4,06 4,28 4,51 4,76 5,02 5,80 6,12 6,46 6,81 7,19
Screening & Detection 3,11 3,28 3,46 3,65 3,85 4,06 3,53 3,72 3,93 4,15 4,38
Command & Control 2,56 2,70 2,85 3,01 3,17 3,35 4,03 4,26 4,49 4,74 5,00
Re
ven
ue
($ B
illio
n)
Note: All figures are rounded. The base year is 2011. Source: Frost & Sullivan analysis.
Key Takeaway: Surveillance will continue to dominate the oil and gas infrastructure security market while cyber
security will have the highest growth rate

Key Trends
• Increasing infrastructure developments in oil and gas sector and evolving threats to critical infrastructures will drive the Global oil and gas infrastructure security market.
• Upstream segment in oil and gas will provide maximum opportunities to suppliers of security systems due to increase in exploration and production activity globally. North America will offer greatest opportunities in security followed by Asia Pacific. Middle East and Asia Pacific regions will see maximum need for security in downstream segment.
• South America will experience greatest growth in security spending followed by Middle East and Asia pacific. Surveillance will continue to dominate the oil and gas infrastructure security market while cyber security will have the highest growth rate
• Pipeline monitoring & surveillance along with pipeline leak detection systems are in great demand
globally with increasing pipeline construction. • Total oil and gas infrastructure security market is expected to increase from $ 18.31 billion in 2011
to $31.27 billion by 2021

Urban Security (Safe Cities)
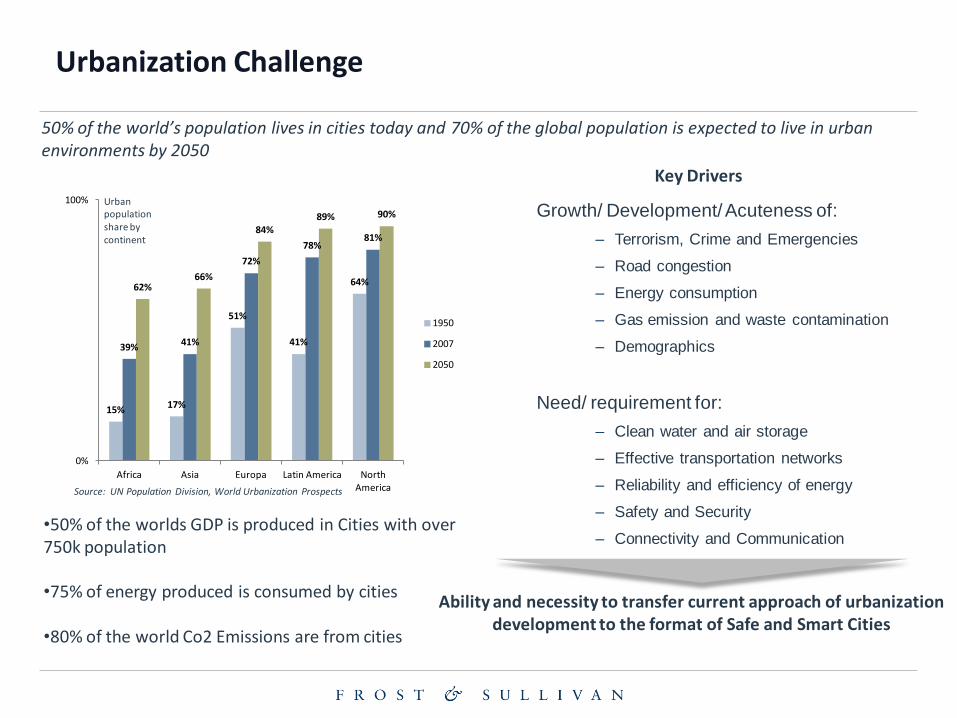
Urbanization Challenge
Source: UN Population Division, World Urbanization Prospects
15% 17%
51%
41%
64%
39% 41%
72%
78% 81%
62% 66%
84% 89% 90%
0%
100%
Africa Asia Europa Latin America North America
1950
2007
2050
50% of the world’s population lives in cities today and 70% of the global population is expected to live in urban environments by 2050
Growth/ Development/ Acuteness of:
– Terrorism, Crime and Emergencies
– Road congestion
– Energy consumption
– Gas emission and waste contamination
– Demographics
Need/ requirement for:
– Clean water and air storage
– Effective transportation networks
– Reliability and efficiency of energy
– Safety and Security
– Connectivity and Communication
Key Drivers Urban population share by continent
Ability and necessity to transfer current approach of urbanization development to the format of Safe and Smart Cities
•50% of the worlds GDP is produced in Cities with over 750k population
•75% of energy produced is consumed by cities
•80% of the world Co2 Emissions are from cities

• Security becomes more critical as cities and their infrastructure evolve;
• Cities get bigger (urbanisation) = more and more anonymous threats;
• Increasing pressure on Local authorities to cope with expected and unexpected security threats against citizens
• Large number of potential end-users with real budget is another key driver and a challenge at the same time
• Technology adoption and penetration allows us to think about a connected Safe City
0
5
10
15
20
25
30
35
40
45
(3) (1) 1 3 5 7 9 11 13 15 17 19 21 23
19.Seoul20. Miami15.Hong Kong
13.Philadelphia
* Size of the bubble – GDP 2025
5. Chicago 7.Paris
Po
pu
lati
on
(m
illio
n) 1.
Tokyo
2.New York
3. Los Angeles
4. London
10.Buenos Aires
17. Moscow14. Beijing
Ranking based on population and GDP
New definition of Megacity ‘25
U.N. definition
of Megacity ‘09
11.Mumbai
16. Delhi
9.São
Paulo
6.Mexico
City 8. Shanghai 12. Osaka-
Kobe
18. Guangzhou
Top 20 Megacities in 2025Top 20 Megacities in 2025
* Size of the bubble – GDP 2009
* Cities with current or future plans to become Safe Cities
Top 20 Megacities and Safe Cities Projects Top 20 Megacities and Safe Cities Projects -- Ranking (Global), 2009 Ranking (Global), 2009 -- 20252025
Note: All figures are rounded; the base year is 2009. Source: Frost & Sullivan
50% Of The Top 20 Megacities In 2025 Will Be From The Developing Countries
Why are we talking about Cities?

Integrated Solutions
Reliability
Centralised & Remote
Control
Scalable Response
Safe City can be defined as:
(1) An initiative to integrate security solutions across stakeholder groups in a given city to enhance response to security and safety incidents…
(2) The implementation of reliable and all-coverage security measures to counter incidents that a city and its inhabitants are susceptible to…
(3) A combination of civic partners (law enforcement, businesses, and residents) to maintain order and create stability in cities by deploying advanced security systems…
(4) Security concept where key entities of a city work together to identify and act in real-time to security threats of any scale and time
+
+
+
Safe City is a plan to enhance public security and welfare by deploying networked security systems across several entities in a society to optimise the necessary response from detection to action
Safe City
Defining Safe Cities
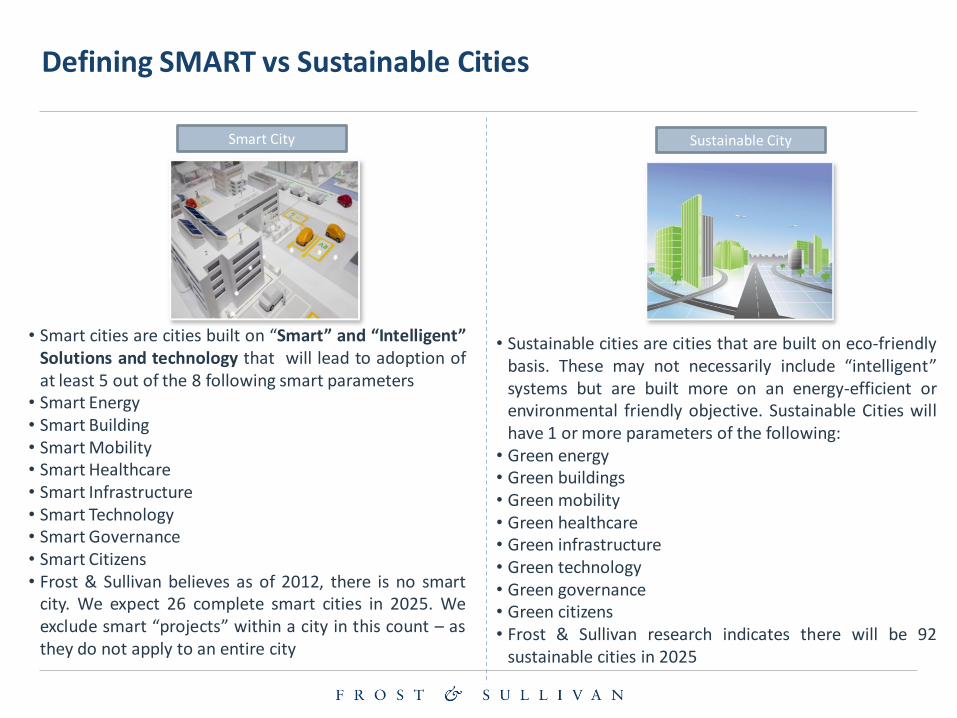
Defining SMART vs Sustainable Cities
Smart City Sustainable City
• Smart cities are cities built on “Smart” and “Intelligent” Solutions and technology that will lead to adoption of at least 5 out of the 8 following smart parameters
• Smart Energy • Smart Building • Smart Mobility • Smart Healthcare • Smart Infrastructure • Smart Technology • Smart Governance • Smart Citizens • Frost & Sullivan believes as of 2012, there is no smart
city. We expect 26 complete smart cities in 2025. We exclude smart “projects” within a city in this count – as they do not apply to an entire city
• Sustainable cities are cities that are built on eco-friendly basis. These may not necessarily include “intelligent” systems but are built more on an energy-efficient or environmental friendly objective. Sustainable Cities will have 1 or more parameters of the following:
• Green energy • Green buildings • Green mobility • Green healthcare • Green infrastructure • Green technology • Green governance • Green citizens • Frost & Sullivan research indicates there will be 92
sustainable cities in 2025

How SMART drives SAFE and Vice-Versa
SMART Mass Transport: Multimodal Transport Hubs Providing Excellent Air, Rail, Road Connectivity to Other Mega Cities.
SMART Technology:Intelligent Communication Systems Connecting Home, Office, iPhone and Car
on a Single Wireless IT Platform.
Satellite Towns: Main City Centre Will Merge with Several Satellite
Towns to Form ONE BIG MEGA CITY.
SMART Cars: At least 10% of Cars will be Electric Vehicles. Free Fast Charging Stations at Every Half Mile.
SMART GRID: Infrastructure to Enable Real Time Monitoring of Power Flow and Provide Energy Surplus Back to the Grid.
SMART Energy: 20%of Energy Produced in the City Will be Renewable(Wind, Solar etc).
SMART Buildings: At least 50% of Buildings Will be Green and Intelligent Built
with BIPV; 20% of the Buildings Will be Net Zero Buildings.
Source: Google Images
‘SAFE’
‘SAFE’

Integration is the Key Enabler and the biggest Challenge to “Creating” a Safe or SMART city
Implications
• It demands the procurement of new systems.
• It increases workload by sharing responsibility across different operators.
• It is a long-term commitment that is susceptible to governance chance and political agenda.
City Infrastructure
Energy Transport Communications
City Users
Inhabitants (People)
Visitors (People)
Businesses (People & Infras.)
City Operators
Law Enforcers (Fire, Police, etc.)
Service Providers (medical, wastage, etc.)
Infrastructure Operators
Safe City
Key Elements

Access Control, Video Surveillance Intrusion
Detection, Biometrics, Perimeter and
Occupancy Sensors, Fire Alarm Panels,
Detection Devices (Smoke/Heat/Gas/Flame),
Fire suppression, Notification and Evacuation
Energy Logistics, Distribution
Channels (electricity, water, gas),
Utility Monitor, Heat, Lighting,
Back-Up Power, Leakage Monitor
Voice/Video/Data, Audio Visual,
Structured Cabling, TCP/IP/BAS
Protocols, Remote VPN Access,
Computer Logon, Network Access
Logon, Firewalls, Managed
Security Services, Mobile Security,
Security Infrastructure
Building Automation, Building Control, Networked
Systems, Crisis Management Solution (power,
infrastructure damage, evacuation)
Traffic Control & Monitoring
(rail, underground, buses,
personal vehicles), 24/7 Supply
Management (logistics)
Integrated Fire Department,
Police and Medical Services,
Centralised and Remote
Command and Control,
Scalable Decision Making
Process
Communication Infrastructure is Critical and is the Backbone for Scalability
EnergyManagement
EnergyManagement
EnergyManagement
Physical Security
and Safety
Physical Security
and Safety
Physical Security
and Safety
Physical Security
and Safety
Logical Security
andCommunications
Logical Security
andCommunications
Logical Security
andCommunications
ResponseManagement
ResponseManagement
ResponseManagement
MobilityManagement
MobilityManagement
MobilityManagement
Universal Communication
Universal Communication
BuildingManagement
BuildingManagement
BuildingManagement

Operating a Safe or SMART City: The Challenge of “WHOvsHOW”–
Multi – Agency Co - Operation is Critical for Successful City Operations
Energy
Transport
Communications
Citizens (People)
Visitors (People)
Businesses (People & Infras.)
City Operators
Law Enforcers (Fire, Police, etc.)
Service Providers (medical, wastage,)
Infrastructure Operators
EnergyManagement
EnergyManagement
EnergyManagement
MobilityManagement
MobilityManagement
MobilityManagement
City Operators
City GovernanceCity Governance
CentralisedOperatorCentralisedOperator
Law Enforcers(Fire, Police, etc)Law Enforcers(Fire, Police, etc)
Infrastructure OperatorsInfrastructure Operators
Logical Security
andCommunications
Logical Security
andCommunications
Logical Security
andCommunications
ResponseManagement
ResponseManagement
ResponseManagement
Universal Communication
Universal Communication
BuildingManagement
BuildingManagement
BuildingManagementPhysical
Security and Safety
Physical Security
and Safety
Physical Security
and Safety
Physical Security
and Safety
Service Providers(medical, wastage, etc)
Service Providers(medical, wastage, etc)
City Users
City Infrastructure
City Operators
The WHO The HOW
City Infrastructure
City Users

Technology Strategy
Urbanisation Culture
Security & Safety Threat
Safe City Index: Identifying Safe City Opportunities Key Index Factors
Economic Power
Security & Safety Threat examines the extent of possible terrorist attacks, natural disasters, and crime. This factor is of crucial importance to distinguish the need for safe city projects.
Economic Power is one of the main criteria that influences the safe city index. It allows us to distinguish the cities with the healthiest economies and predict the future development of cities.
Technology Strategy is another critical aspect of the safe city index because it allows us to distinguish what state the city is in regarding technological procurement.
Urbanisation Culture allows us to study the way the city is growing. This factor will have a great effect on the extent of the project and the future of safe city technology procurement.
Safe City
Index
Source: Frost & Sullivan analysis.

New
York
Los
Angeles
London
Tokyo Shanghai
Beijing
Osaka
Seoul Hong
Kong
Singapore
Moscow
São
Paulo
Chicago
Guangzhou
Washington
D.C.
Atlanta
San
Francisco
Miami
Detroit
Houston
Bangkok Rio de
Janeiro
Dallas
Philadelphia
Toronto
Mumbai
Sydney
Melbourne
Seattle Istanbul
Pittsburgh
San
Diego Tampa
Phoenix Denver
Buenos
Aires Minneapolis
Madrid Busan
Tianjin Metro
Manila
Paris
Fukuoka
Chongqing
St.
Petersburg
Milan
Cairo Cleveland
Manchester
St.
Louis
Monterrey
Vienna
Jakarta
Baltimore
Boston
Cities with high safe city adoption possibilities and likely to go for Integrated Surveillance Deployment
Cities with very high safe city adoption possibilities and likely to adopt Integrated Surveillance & Response Capabilities
Cities sure of adopting safe city programs & provide very high revenue possibilities through adoption of integrated Detection, Management, and Response
Healthy Economy Strong Economy Powerful Economy
Ex
tre
me
Ce
rta
inty
Hig
h
Ce
rta
inty
Str
on
g
Ce
rta
inty
Source: Frost & Sullivan analysis.
Mexico
City
Johannesburg
The Safe City Index (continued)

CNI
Public Safety
Commercial
Residential
System Integration Technology Cyber/Network
Network Security
Residential Integrators & Service Providers
Information Technology Commercial Integrators & Building
Technology
Security Technology Providers
Defence Integrators
Defence Integrators
Communication Providers
The figure below highlights the complexities of the competitive landscape in relation to safe city solutions but also opportunities. Competition, partnerships, and future acquisition will occur across application and solution areas.
Competitive Environment – “A Fuzzy Picture”
Source: Frost & Sullivan analysis.

The following is a non-exhaustive list of organisations that are respective leaders in their field. The list is not an indication of market share but players that have demonstrated strong security credentials and/or public safety expertise.
Source: Frost & Sullivan analysis.
Safe City Solution
C3I: AGT International, Northrop Grumman, Lockheed Martin, L3 Communications, Frequentis, Unisys, Avaya, NSN, Selex
Elsag, Sepura, Rohde & Schwarz, Motorola, Siemens, Thales, EADS, Rohill,
Mer Systems, Intergraph
Sensors: ShotSpotter, Lenel, Harris
Services and System Integrators: AGT International, Cisco, Raytheon, Lockheed Martin, Cassidian, Thales, BAE Systems, IBM, Alcate-Lucent, Frequentis, Mer Group, AIS
Network & Storage: EMC, IBM, Nexsan, Hewlett Packard,
Cisco, HDS, NetApp, Dell, Sun Microsystems, Pivot3, Intransa, Vico,
Kintronics, QNAP, Veracity, Avaya, Alctatel Lucent, Huawei, NSN,
Motorola, Airware, Seupra, NEC, Fujitsu, among others
Video: Cisco, Pelco, Axis, Panasonic, Bosch, Sony, Toshiba, Samsung, IQinVision,
Verint
Next Generation: UAV, UAS, GIS
Analytics & Integration: AGT International, ObjectVideo, Nice, Cieffe, Viasys, ioimage, Verint, Vidsys,
Avigilon, Arcont Vision, Axxon
What is Included in a Safe City and Who is Providing it?

Smart Cities Now and Tomorrow
Europe
37% North America
34% Asia Pacific
21%
Middle East
6%
Latin America
2%
Worldwide spending in technologies for
Smart City programs development
>100 active and upcoming Smart City projects worldwide
Current Smart Cities Mapping
$bn
8
39
0
10
20
30
40
2012 20XX 2017
About $115bn in cumulative spending is expected during 2012 – 2017 period
CAGR 30%
Smart Cities Selection
"Smart Growth“ concept has emerged in the last 10–20 years
driven by "new guard" urban planners, innovative architects,
visionary developers, community activists and historic
preservationists. There are many institutions engaged in
Smart City selection, which apply similar approach to 6
aforementioned elements, but with different criteria.
Sum-up of existing Smart City projects
Two types: “Greenfield”and“Brownfield”
Population in size of less 1.5 millions of citizens
Presence of major initiator (often a Grid company)
Community of different stakeholders
Sufficient “room” for smart mobility and grid issues
Proper and convenient territory allocation
Government support (legal and financial)
Set of prepared investors
Different Diagnostics
Final Scoring
Participator application
Short listing

Selected Smart Cities in 2025
Toronto
San Francisco
Vancouver
Paris
New York
London Berlin
Barcelona
Amsterdam
Seattle
Tokyo
Singapore
Calgary
Chicago
Los Angeles
Vienna
Copenhagen
Oslo
Seoul
Beijing
Tianjin Wuhan
Helsinki
Sydney
Shenzhen
Over 26 Global Cities to be “Complete” SMART Cities by 2025 - More than 50% of Smart cities of 2025 will be from Europe and N. America
Source: Forbes Smart City List, Innovation City Index, Specific Smart Project Websites for Each City, Frost & Sullivan
Stockholm
Photo Credits: Dreamstime, willgoto.com, tanamatales.com, sol-group.net

Rio Investment in Mobility
Planned Investments – Greater Rio de Janeiro – 2009 - 2016
High Speed Rail 40 %
BRT, Metro 13 %
Highways 18 %
Airports 6 %
Other 23 % Main Projects Time Frame
International Airport Tom Jobim 2013
5 BRT Lines 2012
Metro Line 4 Construction 2014
5 Road Projects 2013
Public Transportation Program – Rio de Janeiro, 2010 - 2014
Rio’s huge investment in mobility infrastructure to accommodate and growing and wealthier population requires smart solutions
Ch
alle
nge
In
vest
men
t
2000 2010 2020 (f)
Rio de
Janeiro
Cars 1,356,574 1,848,776 2,480,550
Motorcycles 81,997 231,580 357,739
Number of Vehicles – Greater Rio de Janeiro, 2000-2020
1990 2010
Rio de
Janeiro
Highway 64.8 50.0
General
road 24.2 14.4
Average Speed During Peak Hours – Rio de Janeiro, 1990 – 2010
(km/hr)

Rio Operations Centre
Operations Centre
People Governance
Environment
Economy
Mobility Living
Traffic and Transport
Data and Input Examples Output Examples
Weather
Energy
Crowd
Water
Services
Service Improvement
Optimisation of Traffic Flows
Better City Governance
Effective Disaster Response
Better Event Management
Crime Prevention & Analysis
The response and action is only as good as the quality of the data inputs and the concept of operations – what next?

Cyber Security

34
Cyber Security Spending
0
20
40
60
80
100
120
140
160
2010 2011 2012 2013 2014 2015 2016 2017 2018 2019 2020
15,5 20 25 30 40 50 60 65 70 81 85
11,7 15
17 20
23 26
28 30
31 33 35
10 11
12 14
16
17 18
19 20
21 22
1,5 2
3 4
4
4
5 5
5
5 5
1,3 2
2,5 3
4
5
6 7
7,5
8 8
North America Europe APAC (Including India and China) Middle East South America
Global Cyber Security Market, 2010 - 2020
• The Cyber Security Market is witnessing a threefold increase from $40 billion in 2010 to over $150 billion in 2020.
• The US alone is expected to spend about $50 Billion by 2015 on Cyber Security.
• Spending patterns by end user segments (such as Governments, Military , Non Military and Private Sector) are very unclear at the moment and can be identified once the market matures and evolves further.
• However, the Government (Military and Non Military Sectors) are likely to be leaders in spending.
Re
ven
ue
($ B
illi
on
s)

Overall Spending Remains High Due to Regulations and Compliance Restrictions
Managed Security Services As the financial claimant changed in the last 18 months, many organizations understood that having a managed security service is a main cost reduction opportunity and a real option due to the maturity level that most MSSPs have reached.
Security Infrastructure More and more organizations understand that investing in a security infrastructure will benefit the organization in the long run. organizations that "patch" different security solutions suffer from high security costs while having the need to always upgrade their systems.
Firewall/ IPsec VPN As most organizations value the ability to work remotely, both for the employees and for business partners, the need for security systems that enable monitoring/enforcing and authenticating the different incoming and outgoing transactions is growing in steady numbers.
Mobile Security As mobile fobs enable the use of financial applications, the need to secure these application and the mobile fobs themselves grows. Mobile security is an up and rising trend that is backed up be a number of products that are close to reach maturity. This trend will grow in the upcoming years and will take a main role in the information security market
Hig
h G
row
th
Low
Gro
wth
Low Economic Impact High Impact
Note: Size represents relative value of markets
• Growing awareness on and need for information security within the small and medium enterprises (SMEs)
• SaaS approach is becoming standard information security platform for enterprise.
• Cost reduction and enhanced ROI driving consolidated security management solutions
• Mobile security as a global trend

Physical Cyber Convergence: Integrated Infrastructure
Evolution of Convergence between Physical Systems and IT Systems
Bridging the Integration Gap
Physical Systems
Information Technology
(IT)
IT champions drive integration to narrow the expertise gap.
Open protocols overriding legacy
2010 2020 2030
Integrated Security Systems
Wireless Controls and Sensors
Smart-Grid Integration
Automated Demand Response Programs and Smart-grid Applications
Information Modelling
Automated Commissioning and Energy Management
The need for interconnecting facilities and accessing real-time
data is driving convergence
36

37
31%
31%
25%
8% 5%
Cyber Security - Spending by Solution
Segments, 2011
Network Security Security Ops
Data Security Identity & Access Control
Endpoint Security
Since the Internet boom and subsequent bust in 2000, operational IT spending in most industries has consistently increased in response to the growing global economy and to the emergence of new regulations forcing companies to invest in technology to meet their updated obligations.
The current spending on information protection indicates that Network Security, Security Operations and Data Security are the areas of highest spend. However, research indicates that Identity and Access Control, followed by Data Security are the fastest growing segments at the rate of 20% each year.
Trends in Cyber Security Spending
38%
3%
27%
2%
4%
26%
Cyber Security Spending by Regions, 2011
North America South America Western Europe
Eastern Europe Middle East & Africa Asia Pacific

Note: All figures are rounded. The base year is 2011. Source: Frost & Sullivan analysis.
IT Segment - Expenditure Forecast
Key Takeaway: While Managed/monitoring services will continue to be the most appealing, cloud based services will gain traction in the market gradually
IT Segment Expenditure Forecast Global, 2011-2016, CAGR = 18.1%
2011 2012 2013 2014 2015 2016 2017 2018 2019 2020 2021
Consulting Services 1 545,7 1 847,0 2 214,5 2 644,9 3 150,5 3 706,2 4 373,2 5 160,4 6 383,2 7 529,6 8 882,1
Cloud Based Services 1 389,3 1 655,2 1 978,7 2 360,7 2 894,3 3 401,7 4 008,1 4 722,8 5 925,7 6 981,7 8 226,3
Managed/Monitoring Services 3 730,2 4 442,7 5 308,3 6 327,9 7 254,8 8 523,5 10 042,6 11 832,8 13 288,6 15 662,3 18 460,7
0
5000
10000
15000
20000
25000
30000
35000
40000
Ex
pe
nd
itu
re ($
Mil
lio
ns)
Year

Note: All figures are rounded. The base year is 2011. Source: Frost & Sullivan analysis.
IT Segment - Percent Expenditure by Vertical Market
Key Takeaway: The commercial market holds the greatest market share, however the biggest contracts will likely come from Banking and Finance, and the government market.
Global MSS market: Percent Expenditure by Vertical Market Global, 2011
Others 6,8%
Commercial 31,7%
Industrial 17,5%
Government / CIP 15,2%
Banking and Finance 28,8%

40
• Utilise technologies to develop end to end cyber security solutions
• There is always a human element in any security breach. Provide human factors training within
end user organisations.
• Expand marketing efforts to roll out tools/solutions to support different intelligence assets
• Provision of scientific research to plug shortages in organisations.
• Adapt business model to work as a consultant alongside the customer to ensure security
requirements are properly implemented. Audit capabilities serve as an entry point to
opportunities in security.
Cyber Security

First Responders
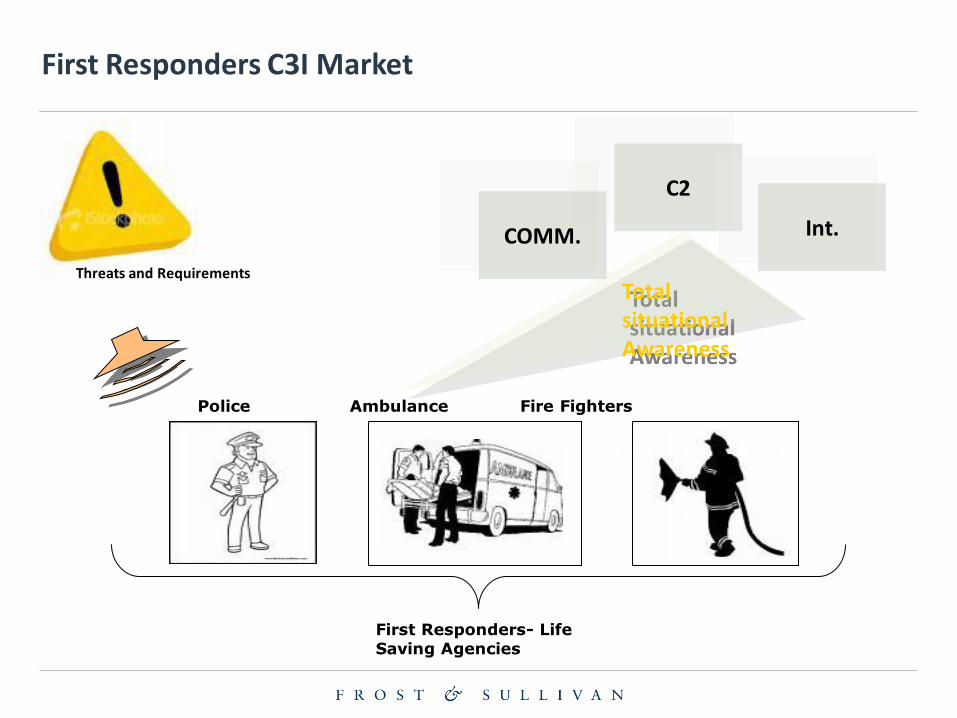
First Responders C3I Market
Threats and Requirements
First Responders- Life Saving Agencies
Police Ambulance Fire Fighters
C2
COMM. Int.
Total situational Awareness

What does Interoperability have to offer?
Emergency Medical Service
Fire Brigade Law Enforcement
Communication
Command and Control
Surveillance
Network Management Centre Integrated
Preventive Responsive
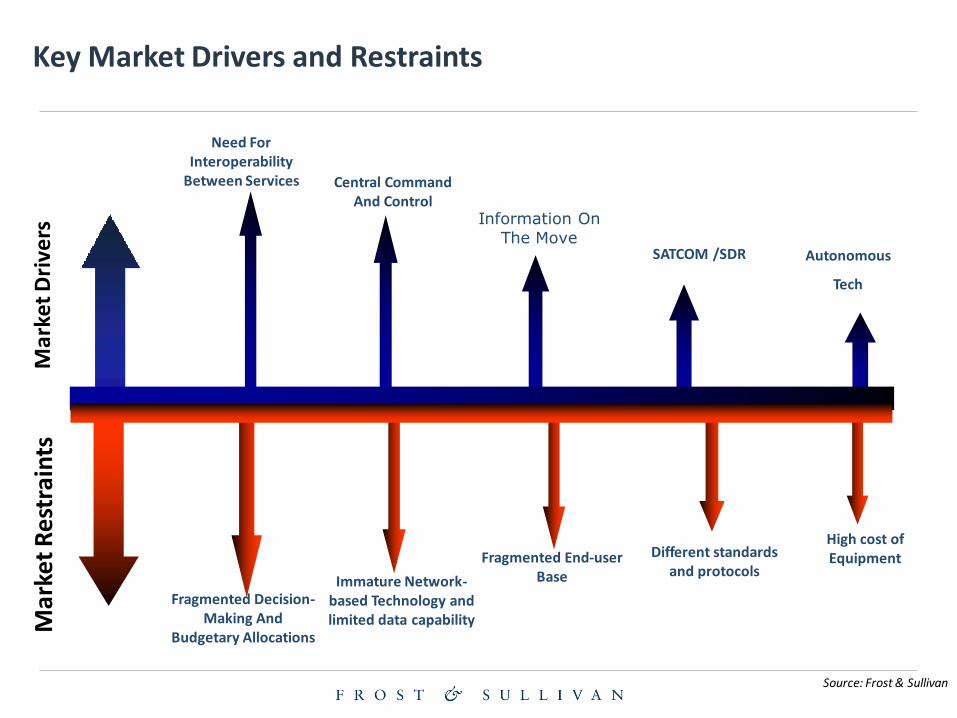
Key Market Drivers and Restraints M
arke
t D
rive
rs
Res
trai
nts
SATCOM /SDR Autonomous
Tech
Need For Interoperability
Between Services Central Command And Control
Information On The Move
Mar
ket
Res
trai
nts
Res
trai
nts
Different standards and protocols
Fragmented Decision-Making And
Budgetary Allocations
Fragmented End-user Base
High cost of Equipment
Immature Network-based Technology and limited data capability
Source: Frost & Sullivan

TETRA System is setting the standard for
countries across Europe
Radio-SATCOM interface is overcoming
bandwidth limitations
SATCOM Terminals are increasingly being
deployed as Comm. System on the move
Higher bandwidth are used for first responders
market
Integration of C2 system with the Comm.
System is the stepping stone for interoperable
first responders C3I market
Integration of SoS under an overarching
network is the ultimate solution forward for
an interoperable first responders C3I market
C3
Radio SATCOM
C2 Network
First Responder’s C3I Market: Key Industry Trends
Key Industry Trends

The video surveillance market is evolving from
CCTVs to more complex systems involving
computers, IP and intelligent video motion
analysis.
The global demand CCTV systems is
shifting from conventional to IP-based
CCTV surveillance.
The market would increasingly use S/MUAVs as
part of surveillance asset.
Integration of surveillance systems with communications, one being video
surveillance. The real-time videos on mobile phones, eg,Blackberries would be a cheaper
cost.
Surveillance
Video CCTV
UAV Integration
First Responder’s C3I Market: Major Industry Trends
Key Industry Trends (Contd…)

C3I Market Revenue Attractiveness Grid
The Total EU Market is
expected to be worth approx
$17.5 billion between 2010 to
2018.
High Low Medium
Market Openness
Rev
enu
e G
row
th
UAV
Video
Network Solutions
SATCOM
CCTV
Radio
Attractiveness Index
Source: Frost & Sullivan
Communications
Intelligence
C2
First Responders’ C3I Market Share
Communications
Intelligence
C2
Communications
Intelligence
C2
First Responders’ C3I Market Share

Technology & Applications

Emerging Technologies Sustaining Future Growth of the Security Industry
IP Storage (SAN/NAS/DAS) High Resolution
Cameras
Hig
h G
row
th
Low
Gro
wth
Mature Technology Emerging Technology
SaaS (Security/Software as a
Service)
Electronic Access Control
Biometrics
IP Cameras
DVRs/NVRs
Video Analytics
Biometrics is increasingly becoming standard in converged applications for banking and government
Video analytics is still paying for initial disappointment for over-promising and underperforming
Analogue Cameras
Intrusion Detection
Integration Software
The growing importance of integration of security systems with other building management systems has led to the growth of PSIM solutions. Increasingly used to protect critical infrastructure, PSIM has gained some traction in commercial security as well.
The SAAS market is seeing a shift from a traditional security space to a more IT centric industry. The competitive space is being decided by the service providers flexibility in gaining expertise in networking and deploying IP systems
RFID
IP-surveillance and the use of multi-mega pixel technology has driven growth for IT storage solutions (SAN/NAS/DAS), reducing the cost per GB of storage and enabling end users to record and store more video at lower operational cost
Note: Size represents relative size of the total market in 2011

Big Data and Open Source Intelligence requirements drive the
need for advanced data analytics capabilities in security
50

Competitive Assessment

Surveillance Competitive Environment
Capability
High
Low
Market Penetration High Low
Honeywell
Bosch
Axis Indigo Vision
Mobotix
Geuterbruck
Gunnebo
Siemens Panasonic
Sony Samsung
Challenger Leader Contender Specialist
GE Security
Cisco
Security Market: Competitive Landscape for Surveillance, (Global), 2011
Source: Frost & Sullivan analysis.
HIK Vision
Milestone Systems

Screening Competitive Environment
Capability
High
Low
Market Penetration High Low
Smiths Detection
Nuctech
Rapiscan
L-3 Communications
Challenger Leader Contender Specialist
Morpho Thru Vision
Security Market: Competitive Landscape for Screening, (Global), 2011
Source: Frost & Sullivan analysis.
ICX Technologies

Perimeter Security Competitive Environment
Capability
High
Low
Market Penetration High Low
Senstar Inc
Southwest Microwave
Fiber SenSys
Future Fiber Technologies
Magal S3
GE Interlogix Asia Ltd.
Gallagher
Challenger Leader Contender Specialist
GM Advanced Fencing Technologies
RBTec
ST Electronics
Security Market: Competitive Landscape for Perimeter Security, (Global), 2011
Fiber Net
Source: Frost & Sullivan analysis.
Salto Systems
AGT International

Access Control Environment
Capability
High
Low
Market Penetration High Low
ARINC
Siemens
HID Global
Panasonic International
Bosch Security
Lenel
G4 Tech
Challenger Leader Contender Specialist
Digital Persona
Honeywell
CEM Systems
Security Market: Competitive Landscape for Access Control, (Global), 2011
Source: Frost & Sullivan analysis.

C2 Competitive Environment
Security Market: Competitive Landscape for C2, (Global), 2011
Capability
High
Low
Market Penetration High Low
Alcatel Lucent
Axis Communications
Siemens
UTC Fire & Security
Honeywell International
Bosch Security
Cisco Systems Inc.
SITA
Challenger Leader Contender Specialist
ARINC
Source: Frost & Sullivan analysis.
Atos
Harris corporation
Motorola
Thales
AGT International

Integration Competitive Environment
Security Market: Competitive Landscape for Integration, (Global), 2011
Capability
High
Low
Market Penetration High Low
CNL Systems
ARINC
Siemens HID Global
Panasonic International
IBM
SAIC
G4 Tech
Challenger Leader Contender Specialist
Niscayah
Honeywell
Ultra Electronics
Source: Frost & Sullivan analysis.
SAP
Raytheon
Thales
Cassidian
Accenture
Cap Gemini
Selex Elsag
BAE Saab
Wipro
AGT International
LM
Northrop Grumman

Mergers & Acquisitions Activity
2008
2012
IT & Services OEM
L-1 Identity Solutions
GE Homeland Protection
Market Cap: $15.5B Avg. Acquisition: IT (n/a) / OEM ($700M)
BOTTOM LINE: Security
SNPE Materiaux Energetiques
SDU Identification
JV: Sagembat Defence
JV: Snecbat Engine
2008
2012
IT & Services OEM
Narus
Tapestry Solutions
Exmeritus
Kestrel
Digital Receiver Technology
Solutions Made Simple
Argon
Ravenwing
Vought (South Carolina facility)
Global Aeronautica
Insitu
Summit Design
Market Cap: $58B Avg. Acquisition: IT ($870M) / OEM ($540M)
2008
2012
IT & Services OEM
Sparta (Cobham Analytics)
MMI Research (Cobham Surveillance)
Corp Ten
Safelife Systems Trivec-Avant
Telerob
Market Cap: $4B Avg. Acquisition: IT ($150M) / OEM ($80M)
2008
2012
IT & Services OEM
MTC Technologies
BVT Surface Fleet
Diamond Detectors
Advanced Ceramics Research
Fairchild Imaging
Oasys Technology
Atlantic Marine
Market Cap: $16B Avg. Acquisition: IT ($400M) / OEM ($40M)
BOTTOM LINE: Cyber security BOTTOM LINE: Communication
Services
Argotek
Global Microwave Systems
Thrane & Thrane
RVision
BOTTOM LINE: Maintenance Services / Cyber security
Tenixtoll Defence Logistics
BHA Aero Composite Parts
Detica

Summary & Conclusion
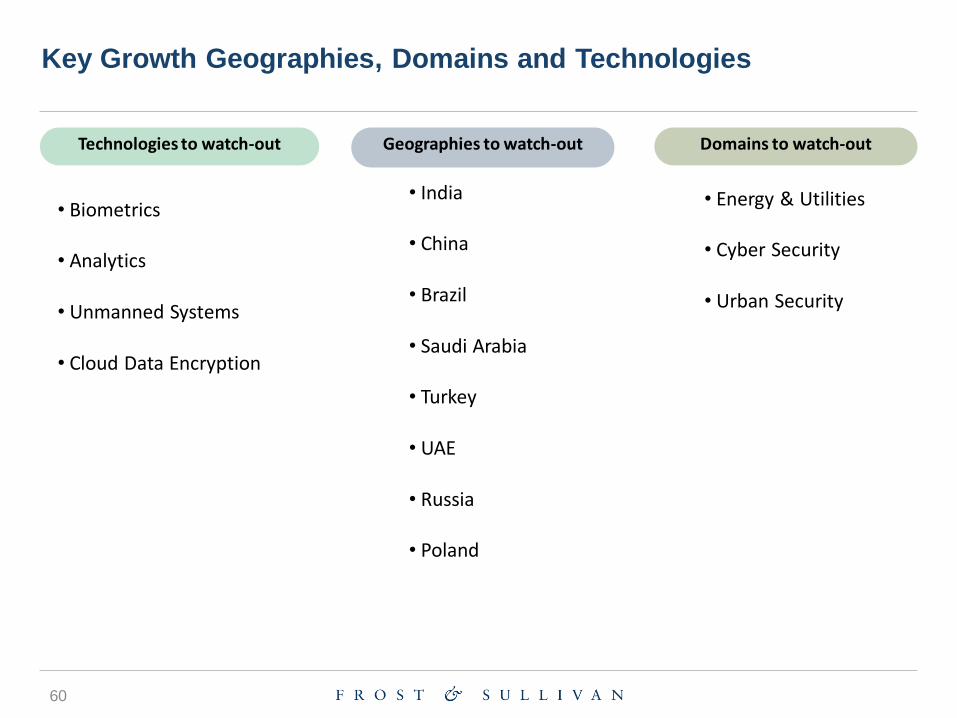
Key Growth Geographies, Domains and Technologies
60
Technologies to watch-out Geographies to watch-out Domains to watch-out
• Biometrics • Analytics • Unmanned Systems
• Cloud Data Encryption
• India
• China
• Brazil
• Saudi Arabia • Turkey
• UAE • Russia
• Poland
• Energy & Utilities
• Cyber Security
• Urban Security

Thank You