Embed Size (px)
Citation preview

Three Emerging Priorities for Evidence-Based Enrollment Management
Frontiers in Enrollment Analytics
ENROLLMENT SERVICES

All industries are rapidly becoming data industries, and higher education is no exception. The key question is no longer whether analytics should guide the fundamentals of our work but how we should undertake the difficult task of building out the requisite capabilities. This report offers guidance on that ambition for enrollment leaders specifically, describing the near future of evidence-based enrollment management and steps schools can take to make that vision a reality.

1Frontiers in Enrollment Analytics
TABLE OF CONTENTS
A Data and Analytics Imperative for Enrollment Leaders 2
Enrollment Analytics Capabilities Diagnostic 30
How We Support Enrollment Leaders 34
Three Emerging Priorities for Evidence-Based Enrollment Management
Turn Data into Insight 15
Overcome Data Silos 7
Turn Insight into Action 23
1
2
3
LEGEND
The main section of this report includes three primary types of information, labeled with the icons below. Keep an eye out for these as you’re reading, to help quickly orient yourself.
Problem background
Best practice case study
Next stage of evolution

2 Enrollment Services
Enrollment Management Turned Upside Down
A New Unpredictability
EAB’s ongoing interaction with enrollment leaders across the country has shed new light on a familiar preoccupation—yield rate.
The specific concern is increased unpredictability. Gone are the days when simply applying historical conversion rates to your admit pool could tell you whether you were on track to meet your enrollment goals. Disruptions at every stage of the recruitment pipeline, from inquiry to deposit, have turned our formerly more predictable world upside down.
Adverse Impact
This lack of predictability carries several negative implications for enrollment leaders.
One is increased cost to recruit. Not being able to accurately guess which students will enroll, many schools find themselves trying to maintain intensive engagement with an ever-growing prospect pool—an expensive proposition.
While many institutions are missing headcount and revenue targets (upwards of 43% for private institutions), some schools have been landing unintentionally large freshman classes, with negative consequences for class-section sizes, housing, and other aspects of student life.
A DATA AND ANALYTICS IMPERATIVE FOR ENROLLMENT LEADERS
3Frontiers in Enrollment Analytics
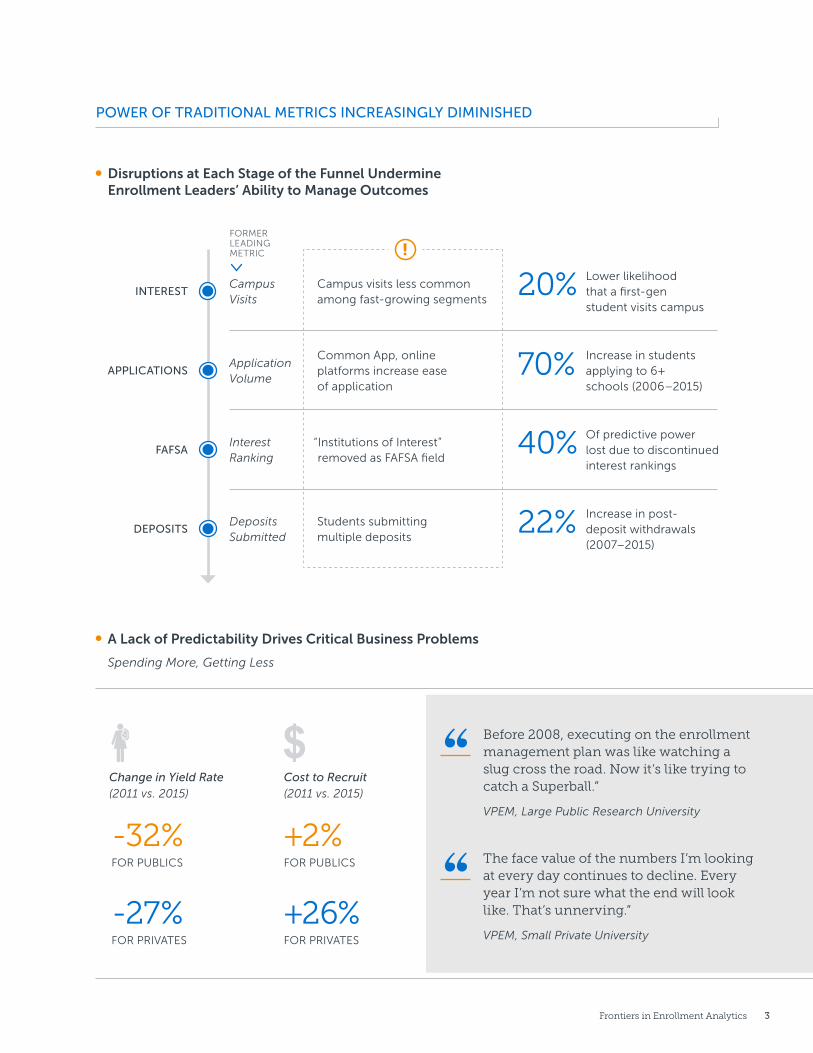
POWER OF TRADITIONAL METRICS INCREASINGLY DIMINISHED
Disruptions at Each Stage of the Funnel Undermine Enrollment Leaders’ Ability to Manage Outcomes
A Lack of Predictability Drives Critical Business Problems
Spending More, Getting Less
INTERESTCampus Visits
Campus visits less common among fast-growing segments
FAFSA“Institutions of Interest” removed as FAFSA field
Interest Ranking
APPLICATIONSCommon App, online platforms increase ease of application
Application Volume
DEPOSITSStudents submitting multiple deposits
Deposits Submitted
Lower likelihood that a first-gen student visits campus
20%
Increase in students applying to 6+ schools (2006–2015)
70%
Of predictive power lost due to discontinued interest rankings
40%
Increase in post-deposit withdrawals (2007–2015)
22%
FORMER LEADING METRIC
Change in Yield Rate(2011 vs. 2015)
Cost to Recruit(2011 vs. 2015)
FOR PUBLICS
-32%
FOR PRIVATES
-27%
FOR PUBLICS
+2%
FOR PRIVATES
+26%
Before 2008, executing on the enrollment management plan was like watching a slug cross the road. Now it‘s like trying to catch a Superball.”
VPEM, Large Public Research University
The face value of the numbers I’m looking at every day continues to decline. Every year I’m not sure what the end will look like. That’s unnerving.”
VPEM, Small Private University

4 Enrollment Services
Learning from Consumer-Marketing Innovators
A Perennial Problem
Higher education is, of course, not the first industry to face declining growth and the imperative to more effectively engage and convert prospects. Organizations that have successfully risen to the challenge have often done so by better leveraging behavioral data and engagement analytics. One noteworthy example is Starbucks.
Learning from Starbucks
Starbucks’ challenge in recent years has been that its per-store customer growth has not kept pace with the number of new locations it has been opening.
Several years into this negative trend, Starbucks launched its mobile app and soon thereafter realized it was amassing a wealth of customer data. To make the most of this data, Starbucks hired its first director of analytics and business intelligence, who built a team to model customer behavior and reveal engagement insights.
Implications for EM
The analogy with student recruitment is clear—enrollment leaders are also sitting on an enormous amount of data regarding past and current student behaviors and preferences. The question is, What can we do to harness those insights and be more thoughtful and targeted in the ways we engage prospective students?

5Frontiers in Enrollment Analytics
ACTIVE USERS17M
TRANSACTIONS PER WEEK90M
OF SALES VIA APP IN 201520%
STARBUCKS USING DATA AND ANALYTICS TO DRIVE GROWTH
Customer Growth Not Keeping Pace with Store Expansion
Store Growth versus Customer Growth
Digital Investments Reveal Customer Data-Mining Opportunity
New Analytical Capabilities Support Improved Customer Engagement
A treasure trove of consumer data
Starbucks mobile app introduced
2012
18,06619,767 21,366
23,04323,445
2013 2014 2015 2016
Daily Customers per Store
Total Scores
563 474
Customer Behavioral Modeling
Identify prospects based on analysis of past customer behavior and engagement patterns
Customer Scoring
Customer engagement differs based on score category and desired outcome (e.g., regain lost customer, increase spend, retain loyal customer)
Customer-Activity Alerts
Geo-mapping technology enables baristas to know customer’s proximity, ensuring beverage is fresh when customer arrives

6 Enrollment Services

7Frontiers in Enrollment Analytics
Overcome Data Silos1

8 Enrollment Services
Data Disconnects Stand in the Way of Answers
A Fallow Resource
All schools gather data on students they’re recruiting, from FAFSA-filing information, at the most basic end of the spectrum, to digital media interactions for more advanced enrollment teams.
At the same time, few schools are getting the most out of this valuable resource.
This is because data schools gather on students typically lives in multiple locations—the CRM and SIS, at a minimum, but often in a dozen or more additional sources.
The resulting problem is that data from these systems cannot usually be easily combined.
This siloing of information can make it difficult to answer basic questions such as what percentage of admitted students have filed FAFSAs.
Untenable Work-Arounds
While most schools can, if pressed, combine data from different systems, few are able to do it in a way that is scalable and affordable. Either the required data must be exported manually for analysis—a cumbersome and time-consuming process—or automated links must be built out between systems, a process that depends on high-cost and in-demand technical skills.
PROBLEM BACKGROUND

9Frontiers in Enrollment Analytics
“ARTISANAL” ANALYSIS ALL TOO COMMON
Data silos...
…create cumbersome, unscalable work-arounds
Admissions data
Financial aid data
Key enrollment-related data sources are often in inconsistent formats and/or lack automated connections
File sent to admissions team
Financial aid analyst loads file and cross-references with aid filing status
“What percentage of our admitted students haven’t filed FAFSAs?”
Analyst outputs Excel file of admitted students from admissions system
File sent to financial aid team
Admissions analyst loads list, applies non-filer flag to appropriate student records

10 Enrollment Services
BEST PRACTICE CASE STUDY
Automating Key Connections
Far-Reaching Automation
The material at right shows how Miami University overcame the data-silos challenge described on the preceding page.
As shown, Miami built out automated data extracts from Banner, Slate, and more than 20 additional sources, setting them up to load directly into Tableau. Once in Tableau, the data can be combined and cross-referenced at will, generating a practically unlimited range of descriptive reports and analyses.
Secrets of Miami’s Success
Several factors explain Miami’s success in building out this extensive data infrastructure.
One is the commitment of Miami’s senior enrollment leadership to data-driven decision-making.
Another, related factor is that Miami’s enrollment team includes staff with advanced data and analytics capabilities, such as Visual Basic scripting, database automation, Tableau reporting, and statistical modeling.
Last but not least, Miami was willing and able to make the substantial up-front investment needed for building out the capabilities described above. As shown at right, the effort required more than 400 hours of highly skilled staff members’ time.

11Frontiers in Enrollment Analytics
BROADLY SCOPED DATA INTEGRATION
Building Out Automated Links to Bridge Data Silos
Key System Components
A Heavy Lift
Banner
CSV file
Slate
CSV file
Other
CSV file
20+ data sources, including external ones such as IPEDS
Data dictionaries, validation, authentication, anti-duplication
Extracts automated via macros and Visual Basic scripts
CSV files, used as an intermediate file format, automatically loaded into Tableau
Data integrated via Tableau reporting: prospects + inquiries + applications + deposits + financial aid + student life
Of staff time required to build out automated data integration; required skills included Visual Basic scripting,
Access automation, and advanced Tableau reporting
400+ hours

12 Enrollment Services
Agile Data Integration, at Scale
Envisioning the Near Future
The preceding page profiled an institution that has made significant strides in spanning data silos.
This page extends and generalizes that example, extrapolating a next stage of evolution for the integration of diverse data sources in enrollment analytics.
Adaptable Infrastructure
One certainty for the foreseeable future is accelerated expansion in the range of data sources that might be fed into enrollment analytics—a trend ensured by the rapid, ongoing development of digital communication channels in recruitment marketing, including social media and SMS.
In order to make the most of these new data sources, enrollment leaders will need to develop an agile and adaptive data infrastructure capable of accommodating them.
This requires, first and foremost, the ability to quickly build out automated links between data sources and the locations in which they are aggregated for analysis (data warehouses for some institutions; reporting frameworks, such as Tableau, for others).
The key associated challenge—especially for smaller institutions—will be that of accessing the (often hard to come by) technical expertise required.
NEXT STAGE OF EVOLUTION

13Frontiers in Enrollment Analytics
A FAST AND FLEXIBLE FUTURE FOR ENROLLMENT ANALYTICS
Ensuring Expansive Data Capture
Making the Most of a Growing Range of Data Sources
Ensuring an Adaptive Data Infrastructure
Ability to Quickly Establish Connections Is Key
Editing existing links
Automated links can be rapidly modified to reflect alterations in data sources
Creating new links
New data sources can be quickly and painlessly integrated into reporting and analysis
SMS interactions
Name-buy data
Web-page interactions
Social media interactions
Population and demographic data
Consumer- database info
Financial aid info
Parent interactions

14 Enrollment Services

15Frontiers in Enrollment Analytics
Turn Data into Insight2

16 Enrollment Services
Struggling to Wrestle Insights from Data
Room for Improvement
A common preoccupation among enrollment leaders is that of ascertaining how their data and analytics capabilities compare with those of their peers.
In answering that question, it is helpful to consider the two axes shown in the graphic at right—the range of enrollment variables analyzed, and the sophistication of analytics methods used.
The nation’s colleges and universities mostly fall in the lower left quadrant, covering only a modest range of variables in their analyses and focusing primarily on descriptive (rather than predictive or prescriptive) analytics. To give an example of the limits schools in this quadrant face, most would struggle to accurately forecast the likelihood that they will hit their enrollment targets for the current year.
A Personnel Problem
The main factor limiting schools’ data and analytics efforts is cost. Especially for smaller institutions, securing access to the necessary talent can be prohibitively expensive. It is no exaggeration to say that, in the case of hiring data scientists, colleges and universities are competing with the likes of Facebook and Amazon.
PROBLEM BACKGROUND

17Frontiers in Enrollment Analytics
MANY COLLEGES HAMSTRUNG BY TALENT SHORTAGES
A Limited Repertoire
Many Schools Are Constrained on Both Breadth and Sophistication of Analytics
Data-Science Expertise Is a Rare Resource
One Organization’s Perspective (from Out of Industry)
BASIC QUALIFICATIONS: SENIOR DATA SCIENTIST
Bro
adN
arro
w Least analytically advanced
Analytical Sophistication
Most colleges and universities fall into this quadrant
Most analytically advanced
Descriptive Predictive Prescriptive
Increase in compensation for senior data scientist role (2015 versus 2018)
27%
Ran
ge
of
Var
iab
les
An
alyz
ed
• Bachelor’s degree in a quantitative social science or STEM field
• 5+ years professional experience
• Experience with machine learning techniques
• Experience with quantitative modeling
• Substantial experience with statistics and the scientific method
• Ability to perform self-directed, hypothesis-driven research
“To stay competitive in the data science field, we’re having to pay senior-level staff $130K or more. For star performers it’s more like
$225K. And even then we’re seeing positions stay unfilled for 200 days or more.”
Director, Staffing and Recruitment

18 Enrollment Services
BEST PRACTICE CASE STUDY
Leveraging an Expansive Analytical Toolkit
Data-Driven Decisions
Profiled here is the case of Northeastern University, which overcame the challenges described on the preceding page to develop industry-leading data and analytics capabilities.
The material at right shows two especially powerful aspects of Northeastern’s approach—its advanced modeling capabilities and its incorporation of real-time data querying into enrollment leadership strategy sessions.
At the heart of Northeastern’s larger data and analytics effort is, in the words of Vice President of Enrollment Management Sundar Kumarasamy, “building a reporting framework that enables our clients to ask the next set of questions.”
Senior Sponsorship
As in the case of Miami University (profiled elsewhere in this report), Northeastern’s acquisition of advanced analytics capabilities depended on a commitment at the senior-most levels of the organization to data-driven decision-making.
This commitment included the willingness to make extraordinary investments in staff with deep math, statistics, data modeling, and enrollment backgrounds, including an assistant vice president of enrollment analytics and strategy.

19Frontiers in Enrollment Analytics
ADVANCED ENROLLMENT ANALYTICS IN ACTION
Sophisticated Data Modeling Plus Flexible Drill-Down Analysis
Advanced statistical analysis and data modeling used to inform enrollment strategy
• CHAID analysis
• Bootstrapping
• Monte Carlo analysis
• Decision-tree analysis
• Nested regression models
• Sensitivity analysis
Real-time drill-downs into data during enrollment leadership meetings (using Tableau)
• High-level review of key enrollment metrics
• Identification of anomalies
• Flexible, interactive interrogation of data to reveal root causes
• Projection of impact for proposed courses of action
Advanced analyses influence drill-downs and vice versa
Enrollment Data Scientist
Enrollment Leadership Team
CASE IN POINT
Redistributing Financial Aid for High Achievers
Disappointing enrollment of high-ability, low-income (HALI) students noted in enrollment trend reports
Predictive modeling suggests that spreading scholarship dollars more evenly across HALI admits would boost enrollment
New scholarship policy implemented, ROI improvement evident across all key quality and revenue metrics

20 Enrollment Services
Everyday Rocket Science
Expanded Application
The preceding page gave an example of an institution that has integrated cutting-edge analytics seamlessly into enrollment leadership.
This page extends and generalizes that example, envisioning a future in which the most advanced mathematical, statistical, and modeling techniques available inform a broad range of important questions that enrollment leaders face in their day-to-day work.
Four Characteristics
Four forms of advanced data science (shown at right) are of particular interest in this context.
First are dynamically updated predictive models. In contrast to standard models, which are locked to a particular point in time, dynamic models evolve together with changing market conditions and revise their predictions accordingly.
Second are approaches that flexibly incorporate new data sources as they become available.
Third are continuously refined prospect segments, created automatically and on the fly based on behavioral data gathered on students through recruitment interactions.
Fourth are context-aware analytics, which interpret an institution’s enrollment results relative to local and regional trends.
NEXT STAGE OF EVOLUTION

21Frontiers in Enrollment Analytics
MACHINE LEARNING FOR CORE ENROLLMENT QUESTIONS
Critically important enrollment questions…
…answered through advanced data science
Understanding individual prospects
“Will Sara Anderson accept our offer of admission?”
Understanding aggregate performance
“Why are our deposits down?”
Understanding student segments
“Are we on track to meet our diversity goals?”
Understanding which levers to pull
“Am I allocating financial aid to the right students?”
Bayesian statistics
Digital interactions
Machine learning
National data sets
Four characteristics of advanced enrollment analytics
Representative innovation drivers
Dynamically updated predictive models
Predictive models are updated continuously to reflect changing market conditions and new information on prospect behaviors
Ever-expanding range of model inputs
New sources of data, e.g., from student interactions on social media, are quickly and flexibly incorporated into modeling
Continuously refined prospect segments
Data from interaction with prospective students is continually analyzed to identify patterns; observed patterns used as the basis for prospect segments that shift as behaviors change over time
Context-aware analytics
Data from local and regional markets is used to help understand trends seen at the level of the individual institution
In an era of rapidly changing student behaviors, regional and national perspectives (including benchmarking with peer institutions) are an especially important tool for understanding a school’s recruitment performance.

22 Enrollment Services

23Frontiers in Enrollment Analytics
Turn Insight into Action3

24 Enrollment Services
Inconsequential Analytics
Barriers to Impact
Even schools that have cleared the hurdles already described in this report can find themselves at a loss when it comes to translating into action the insights generated through their enrollment analytics. Four factors are typically at the root of the problem.
First is analytics velocity. If it takes you a few days—or even just a few hours—to get an answer to every question you ask, it’s unlikely that you’ll be able to sustain the momentum required for getting actionable answers out of your data.
Second is a best practice knowledge deficit. Few enrollment teams have the resources required to seek out best practices for every particular recruitment challenge they’re facing.
Third is an enrollment-analytics disconnect. It’s rare for individuals with advanced analytics capabilities to also have deep knowledge of the enrollment terrain. Lack of close coordination between these two areas of expertise can result in analyses performed having poor actionability.
Fourth is limited accessibility of insights generated. If key players in your organization, from senior leadership to frontline staff, cannot easily access results of your analytics, insights you’ve generated are likely to go unseen and unused.
PROBLEM BACKGROUND

25Frontiers in Enrollment Analytics
MANY SCHOOLS STRUGGLE TO CAPITALIZE ON INSIGHTS
Common Barriers to Action
The question always is ‘What do we do with the information?’ What we really need are action
steps to tell us how to change our behavior.”
VPEM, Small Private Institution
Insufficient analytics velocity
Data yields insight most readily when it can be queried flexibly and iteratively, in real time, with the answer to one question immediately prompting the next question
Best practice knowledge deficit
Few enrollment leaders have the resources required to rapidly and consistently discover best practices that map to particular challenges they are facing
Analytics-enrollment disconnect
Few institutions have staff with deep backgrounds in both enrollment and data science; disconnects between the two areas of expertise can result in misguided or inaccurate analyses produced
Poor end-user access to analytics
Initiative is required to turn insights generated by enrollment analytics into results; many institutions struggle to consistently get actionable information in front of those best positioned to use it (including counselors and other frontline staff)
?

26 Enrollment Services
BEST PRACTICE CASE STUDY
Putting Insight to Work
Integrated Prospect Scoring
Shown here are steps that Whitehaven University* took to ensure that insight generated through its data and analytics work drive concrete results.
An important part of their approach is a regression model, which, factoring in an unusually rich array of inputs, including CRM interactions data, assesses any given student’s likelihood to enroll. Output of the model is fed into Whitehaven’s CRM and thereby made available for use by the admissions team in its day-to-day work.
Large Impact, Large Effort
Whitehaven’s approach enabled more efficient deployment of recruitment resources, reducing cost while also helping the school bring in its largest class in 30 years.
The broader effort did, however, require a considerable up-front investment of institutional resources, including six months’ worth of four admissions FTEs’ time.
The effort also depended on Whitehaven’s unusual circumstance of having an associate vice president for enrollment management and an enrollment analyst in IR who were both skilled in statistical modeling. Estimates by Whitehaven staff put the market value of work done by these two individuals alone at more than $100,000.
* Pseudonym.

27Frontiers in Enrollment Analytics
ANALYTICS SHAPE RECRUITMENT STRATEGY
Integrated Prospect Scoring Boosts Enrollment Outcomes
Model Developed to Predict Student Likelihood to Enroll
OUTPUT
Some of the 50+ variables tested for the model:
A focus on boosting on-the-fence students’ likelihood to enroll
• Personicx segmentation cluster
• County where student resides
• Academic interest
• Midsize city preference
• Campus environment preference
• Student behavioral data
Prospective Students Assigned Likelihood-to-Yield Score
ACTION Score bands associated with specific follow-up protocols
RESULT
Scores loaded into CRM, for easy access by counselors and updated daily
Least likely to enroll
Most likely to enroll
Reduction in mailing costs40% Increase
in NTR$1M Return on investment12%
On the fence CommittedIntensive outreach
A Major Effort
Of staff time across six months required to build out integrated predictive modeling approach 4 FTEs
* Pseudonym.
Whitehaven University
*

28 Enrollment Services
NEXT STAGE OF EVOLUTION
A Seamless Path from Diagnosis to Intervention
Aiming for Broad Utility
The approach profiled on the preceding page depends on a predictive model designed to produce one form of self-evidently actionable output.
The next stage of evolution for action-oriented analytics is an approach that supports a much broader range of use cases. The graphic at right shows what that looks like.
At-Will Analytics
Two features of this approach merit special mention.
First, it allows a “lay” user—say, an enrollment leader without SQL or other specialized reporting skills—to query the data interactively. In doing so, it helps bridge the gap between enrollment and data expertise that commonly impedes enrollment teams’ analytics efforts.
Second, the system this approach uses contains a comprehensive spectrum of data from many different sources, enabling a broad range of analyses to be performed through a single portal.
These two factors taken together support rapid, flexible insight generation across the enrollment pipeline, allowing users to forecast performance and quickly discover specific root-cause problems to be addressed, thereby closing the loop between analytics and action.

29Frontiers in Enrollment Analytics
THE POWER OF EAB’S UNIFIED PLATFORM
Combining the Functionality of a Dashboard, Predictive Analytics Engine, and Business-Intelligence Tool
9:37 a.m. Check of current admit volume shows 9% increase versus same time last year
9:49 a.m. Predictive-analytics enrollment forecast shows projected deficit of 80 students
10:05 a.m. Viewing applicant pool by geographical origin shows large increase in admits from the Southwest versus last year
10:22 a.m. Viewing last year’s pipeline by region shows low yield rate for students from the Southwest
10:41 a.m. Review of web-browsing stats for this year’s admits from the Southwest shows high traffic on financial aid pages
11:02 a.m. Admits from the Southwest viewed by predicted likelihood to enroll
11:40 a.m. Key factors influencing likelihood to enroll for on-the-fence students identified—unmet need and campus visit are top two factors
12:11 p.m. Names of admits in the “less likely to enroll” category flagged for intensive outreach, including affordability and campus visit direct-marketing campaigns
Querying the data to identify root-cause problems
Informing potential solutions
Launching associated workflows
Monitoring enrollment vital signs

30 Enrollment Services
Where Does Your Team Fall on the Enrollment Analytics Maturity Spectrum?
Enrollment Analytics Capabilities Diagnostic
How to Use This Diagnostic
This page and the three that follow present a self-test to help you assess where your institution falls on the enrollment analytics maturity spectrum. As you read through the points listed, ask yourself to what extent your organization’s practice matches the descriptions provided, and check those that apply. After completing the diagnostic, tally the total number of items you’ve checked; an assessment key at the end of the diagnostic will show you where you fall on the spectrum, based on your total score.

31Frontiers in Enrollment Analytics
OVERCOMING DATA SILOS
Data Sources
¨ We integrate historical data on our admitted, enrolled, and non-yielding students into our analytics
¨ We reliably capture data from digital interactions with prospective students, from our earliest contact with them
¨ We know which of our school’s web pages any given prospective student has visited, and that data is integrated into our analytics
¨ We supplement data we gather on students and parents with information from national consumer databases
Data Integrity
¨ Definitions used in our enrollment data are consistent from year to year
¨ Our enrollment team includes a staffer responsible for data management, including data definitions and data integrity
¨ We have a comprehensive data dictionary covering enrollment-related data elements
Data Automation
¨ Key enrollment data from our CRM, SIS, financial aid system, and a wide range of additional data sources is automatically fed into a combined, queryable data repository
¨ We are able to build new automated links between data sources (or edit existing ones) in under two weeks, at a cost of less than $3,000 per link
Total checks:
1

32 Enrollment Services
TURNING DATA INTO INSIGHT
Analytics Inputs
¨ We are constantly adding new data elements to our analyses, to compensate for the reduced predictive power of legacy metrics and take advantage of the rich data streams generated by digital channels
¨ Our analysis incorporates contextual information, such as benchmarks from peer schools and nationwide trends
Analytical Repertoire and Techniques
¨ Our data and analytics repertoire includes descriptive reporting, predictive analytics, and prescriptive analytics
¨ Our enrollment analytics incorporate advanced math, statistics, and machine learning (e.g., Bayesian statistics and decision-tree analysis)
Personnel
¨ Our enrollment team includes a data analyst experienced in quantitative modeling and machine learning techniques
¨ The staff who do our advanced data modeling and analytics have deep enrollment expertise
¨ Our analytics team reports up through the enrollment organization
Total checks:
2

33Frontiers in Enrollment Analytics
TURNING INSIGHT INTO ACTION
Data-Driven Enrollment Leadership
¨ Our data scientist is a member of our enrollment leadership team
¨ We have regular enrollment leadership meetings in which data is queried interactively, in real time, to inform strategy and operations decisions
Accessibility of Advanced Analytics
¨ We have a single enrollment management data and analytics portal that combines the following functions: dashboard, drill-down analysis, reporting, and workflow management
¨ Output of our predictive models is built into metrics shown in our enrollment dashboard
¨ “Lay persons” without significant SQL or equivalent skills are able to easily perform analyses with tools we provide
Action-Orientation
¨ Our counselors have easy access to continuously updated scores that rate each prospective student’s likelihood to enroll and succeed
¨ Our enrollment management portal links outputs of our analyses with concrete steps that our staff (including counselors) can take to increase students’ likelihood to enroll
Total checks:
INTERPRETING YOUR SCORE
Sum of checks assigned across all three categories:
Score Range Enrollment Analytics Maturity Stage
0–8 EarlyYour institution has yet to implement many or most of the practices we’ve found to drive exceptional enrollment analytics. This suggests the potential for large, rapid performance improvements.
9–16 IntermediateYour institution is functioning at a moderately advanced level but is missing significant opportunities associated with best practices you’ve not yet implemented. Significant room for improvement on results is likely.
17–23 AdvancedYour institution is functioning at an unusually high standard. Further gains in performance are possible but will require extraordinary levels of focus and innovation to be realized.
3

34 Enrollment Services
Pipeline Analytics: Advanced Enrollment Data Science at Your Fingertips
How We Support Enrollment Leaders
Client Data
Sourced from SIS, CRM, financial aid systems,
and recruitment partners, updated daily
EAB Data
National benchmarks for college-bound student behavior, based on 1.2B+ annual interactions
Forecast Accuracy
Will we meet our enrollment and revenue goals?
Prospect Engagement
Which prospects are ripe for high-touch outreach?
Campaign Opportunity
Where should we course-correct?
Performance Insights
What levers can I pull to improve performance?
EAB Data Science Team
Institution-Specific Predictive Analytics Engine
Real-Time Predictive Models, Customized for You
Stage-to-stage conversion likelihood
Enrollment likelihood
Retention likelihood
Recommendations to improve performance

35Frontiers in Enrollment Analytics
Get Ahead of the Market with Enrollment Management Forum
Your Enrollment Success, Powered by Enrollment Intelligence (EI)
Fueled by the market’s largest data asset, our Enrollment Services offering combines prescriptive analytics, smart recruitment marketing, and strategic advisory support to help colleges fulfill their enrollment mission. Every day, we use data from 350+ clients and 1.5+ billion student interactions to give you real-time visibility into competitive market dynamics, shifting student trends, and proven practices so you can engage and enroll your most desired students.
Research has always been at the heart of EAB. Today, our approach to harnessing higher education best practices has three core tenets: investigation, insight delivery, and the ignition of transformative action on campus. Enrollment Management Forum does this exclusively for enrollment leaders to help them address their unique challenges.
LEARN MORE eab.com/enrollmentintelligence
Strategic Advisory Support from expert practitioners to guide your recruitment strategy and counsel you at key decision points
Prescriptive Analytics to provide real-time visibility and actionable insights about market trends, student behaviors, and key performance metrics
Smart Recruitment Marketing to engage students and parents in the right channels, with the right messages, at key moments across the recruitment journey
Your enrollment success powered by EI
Get Smart About the Future
Strategic Research on Critical Enrollment Topics:
• Impact of the economy on enrollment
• Students of the future
• Frontier marketing practice
• Forecasting and strategic enrollment planning
Accelerate Frontline Implementation
• Initiatives activation and kick-off working groups and committees
• Enrollment strategy collaboratives
• On-demand advice on hot topics
Advance Cross-Campus Change
• On-campus strategy intensives
• Board, cabinet, and division presentations
• Enrollment strategy gap analysis

36 Enrollment Services
At EAB, our mission is to make education smarter and our communities stronger. We harness the collective power of more than 1,300 schools, colleges, and universities to uncover and apply proven practices and transformative insights. And since complex problems require multifaceted solutions, we work with each school differently to apply these insights through a customized blend of research, technology, and services.

LEGAL CAVEAT
EAB Global, Inc. (“EAB”) has made efforts to verify the accuracy of the information it provides to members. This report relies on data obtained from many sources, however, and EAB cannot guarantee the accuracy of the information provided or any analysis based thereon. In addition, neither EAB nor any of its affiliates (each, an “EAB Organization”) is in the business of giving legal, accounting, or other professional advice, and its reports should not be construed as professional advice. In particular, members should not rely on any legal commentary in this report as a basis for action, or assume that any tactics described herein would be permitted by applicable law or appropriate for a given member’s situation. Members are advised to consult with appropriate professionals concerning legal, tax, or accounting issues, before implementing any of these tactics. No EAB Organization or any of its respective officers, directors, employees, or agents shall be liable for any claims, liabilities, or expenses relating to (a) any errors or omissions in this report, whether caused by any EAB organization, or any of their respective employees or agents, or sources or other third parties, (b) any recommendation by any EAB Organization, or (c) failure of member and its employees and agents to abide by the terms set forth herein.
©2018 by EAB. All Rights Reserved • eab.com
Project DirectorTom Cakuls
Senior DirectorDana Strait, PhD
DesignerSarah Ostrander
Sources
Page 3: “Yield Rates Are Declining—Why?,” Academic Impressions, May 11, 2016, https://www.academicimpressions.com/yield-rates-are-declining-why/; EAB analysis of EPDP data; Eric Hoover and Sara Lipka, “Enrollment Goals Remain Elusive for Small Colleges,” The Chronicle of Higher Education, December 11, 2016, https://www.chronicle.com/article/Enrollment-Goals-Remain/238624; “Cost of Recruiting an Undergraduate Student,” Ruffalo Noel Levitz (2013 and 2016 editions); EAB interviews and analysis.
Page 5: Clint Boulton, “Starbucks’ CTO brews personalized experiences,” CIO, April 1, 2016, https://www.cio.com/article/3050920/analytics/starbucks-cto-brews-personalized-experiences.html; “Here’s how Mobile Order & Pay could lift Starbucks,” Business Insider, November 7, 2016, http://www.businessinsider.com/heres-how-mobile-order-and-pay-could-lift-starbucks-2016-11; Josh Horwitz, “Starbucks is opening more than a store a day in China and only plans to get faster there,” Quartz, March 28, 2017, https://qz.com/943502/in-china-theres-starbucks-and-then-theres-everything-else/; Brielle Jaekel, “Starbucks AI barista further reduces human interaction, shifts mobile ordering,” Retail Dive, accessed May 18, 2017, https://www.retaildive.com/ex/mobilecommercedaily/starbucks-ai-barista-further-reduces-human-interaction-shifts-mobile-ordering.
Page 27: Randall Langston and David Loreto, “Seamless Integration of Predictive Analytics and CRM Within An Undergraduate Admissions Recruitment and Marketing Plan,” Strategic Enrollment Management Quarterly 4, No. 4 (2017): 161.
EAB research and analysis.

Washington DC | Richmond | Birmingham | Minneapolis
P 202.747.1000 | F 202.747.1010 | eab.com
36198