Embed Size (px)
Citation preview

Frontal and Facial Flatness of Major Human PopulationsTSUNEHIKO HANIHARA*Department of Anatomy, Saga Medical School, Saga 849-8501, Japan
KEY WORDS anatomically modern humans; geographicalvariation; craniofacial features; origins of modern humans
ABSTRACT In the present study, the frontal and facial features of 112populations from around the world are compared in terms of frontal and facialflatness measurements. Univariate analyses and canonical correlation analy-sis were applied to six indices representing flatness of frontal and facial bones.The deep infraglabellar notch, marked prognathism, and flat frontal boneshow distinctive Australian/Melanesian characters among recent popula-tions. Very flat faces in the transverse plane are the most common condition ineastern Asians. Some subSaharan Africans share similar characteristics withAustralians in terms of marked prognathism and flat frontal bones in thesagittal plane on the one hand, and with eastern Asians on the other hand, forflat nasal and zygomaxillary regions. These results are not necessarilyinconsistent with the evidence for regional continuity. The examination ofrelationships between frontal and facial flatness through canonical correla-tion analysis reveals a significant association between morphological featuressuch as a deep infraglabellar notch, prognathism, flat frontal bone, and flatfaces in the transverse plane. In this context, together with the generalizedfeatures of the late Pleistocene fossil record, the features of Australianshaving transversely projecting faces and of eastern Asians showing weakinfraglabellar notchs, ortho-/mosognathism, and rounded frontal bones can beinterpreted as a differential retention of ancestral traits of anatomicallymodern humans. This may allow us to suppose that the frontal and facialflatness features treated herein can be explained by the hypothesis of a singleorigin of anatomically modern humans. Am J Phys Anthropol 111:105–134,2000. r 2000 Wiley-Liss, Inc.
Features relating to facial flatness haveoften been selected for studies of interpopu-lation variation (Debets, 1951; Oschinsky,1962; Alekseev and Debets, 1964; Yamagu-chi, 1973, 1980; Alekseev, 1979; Bulbeck,1981; Rak, 1986; Trinkaus, 1987; Gill et al.,1988; Pope, 1991, 1992; Ishida, 1992).
Recent eastern Asian faces contrast mark-edly with many European and even NewWorld contemporaries (Woo and Morant,1934; Yamaguchi, 1973; Brues, 1977; Alek-seev, 1979; Ishida, 1992). Eastern Asiansexhibit midfaces with more anteriorly situ-ated frontal processes of zygomatic bonesand more or less flat nasal bones. Flatness of
frontals in the sagittal plane, a deep andnarrow infraglabellar notch, and markedprognathism are distinctive traits character-izing Australians and Melanesians (Weiden-reich, 1951; Thorne and Wolpoff, 1981; Wol-poff et al., 1984; Baba, 1993, 1995; Lahr,1996). SubSaharan Africans show, on aver-age, pronounced facial prognathism (in terms
Grant sponsor: Ministry of Education, Science and Culture ofJapan; Grant numbers: 10115204 and 09839003; Grant sponsor:Japanese Society for the Promotion of Science.
*Correspondence to: Tsunehiko Hanihara, Department ofAnatomy, Saga Medical School, 5-1-1 Nabeshima, Saga 849-8501, Japan. E-mail: [email protected]
Received 14 September 1998; accepted 19 August 1999.
AMERICAN JOURNAL OF PHYSICAL ANTHROPOLOGY 111:105–134 (2000)
r 2000 WILEY-LISS, INC.

TABLE 1. Samples used in this study
Sample name Brief information
Japan1 Japanese Recent people from the central part of Main-Island Japan, around Tokyo, and Tohoku dis-
trict (Univ. of Tokyo,1 Tohoku Univ.2)2 Ainu Recent Ainu in Hokkaido, Japan; the majority of individuals examined were collected by Y.
Koganei in 1888–1889, but the sample includes specimens collected later (Univ. ofTokyo,1 Sapporo Medical University3)
3 Jomon Prehistoric people in Japan, ca. 5,300–2,300 years B.P. from the eastern part of Main-Is-land Japan (Univ. of Tokyo)
East Asia4 Northern Chinese Northern part of China, mainly from Liaoning Prefecture (Univ. of Tokyo, Kyoto Univ.,4
Natural History Museum4)5 Southern Chinese Chinese from south of the Cheng River (Natural History Museum, Musee de l’Homme6)6 Koreans Recent Koreans, mainly from south Korea (Univ. of Tokyo, Kyoto Univ.)
Northeast Asia7 Mongolians Recent people from Mongolia (Musee de l’Homme)8 Northeast Asians Recent people from northeast Asia; Buryats, Amur-basin population, Yakut, and other
native northeast Siberians (Natural History Museum, Musee de l’Homme)9 Chukchis Recent Chukchis from the Arctic region of northeast Asia (Musee de l’Homme)
Mainland SoutheastAsia
10 Vietnamese Recent Vietnamese from Tonkin District (Musee de l’Homme)11 Laos-Cambodia Recent people from Laos and Cambodia (Musee de l’Homme)12 Thailand Recent Thailanders from around Bangkok (Natural History Museum, Musee de l’Homme,
Univ. of Sydney7)13 Myanmar Recent inhabitants in Burma (now called Myanmar) (Natural History Museum, Univ. of
Cambridge8)14 Malay Recent Malayans from Malay Peninsula, not including Sarawak people (Natural History
Museum, Univ. of Cambridge, South Australian Museum9)15 Early SE Asians Mesolithic and neolithic Malay from Gua Cha site; neolithic Laos from Abri-Sous Roche de
Tam-Nang Anh; neolithic Vietnamese from Tonkin, Lang-Cuom, Dong Thuoc, Keo Phay,Pho Binh Gia (Univ. of Cambridge, Musee de l’Homme)
Island Southeast Asia16 Sumatra Recent inhabitants of Sumatra Island (Natural History Museum)17 Javanese Recent inhabitants of Java Island (Natural History Museum, Univ. of Cambridge, Musee
de l’Homme)18 Borneans Native inhabitants of Borneo Island, mainly the so-called Land Dayaks, but including
Iban (Sea Dayaks) (Natural History Museum, Univ. of Cambridge, Musee de l’Homme,Univ. of Sydney, South Australian Museum)
19 Philippines Recent native inhabitants of the Philippines, Tagalog and other tribes from Luzon andMindanao Islands (Natural History Museum, Univ. of Cambridge, Musee de l’Homme)
20 Celebes-Molucca Recent inhabitants of the Celebes and Molucca Islands (Natural History Museum, Univ. ofCambridge)
21 Lesser Sunda Recent inhabitants of the Lesser Sunda Islands: Timor, Bali, Sumbawa, and Flores Islands(Natural History Museum, Univ. of Cambridge, Musee de l’Homme)
22 Andamanese Recent inhabitants of the Great Andaman Islands, Jarawa and other tribes (AndamanNegrito groups), including a few sample from Little Andaman Island (Natural HistoryMuseum, Univ. of Cambridge Musee de l’Homme)
23 Nicobarese Recent native people from the Nicobar Islands (Natural History Museum, Univ. of Cam-bridge, Musee de l’Homme)
24 PhilippineNegritos
Recent Philippine Negritos, Aeta, Agta, and other tribes from Luzon Island (Natural His-tory Museum, Musee de l’Homme)
New World25 Eskimos Recent indigenous people from Greenland and northeast Canada (Greenland Eskimos and
Canadian Inuit) (Natural History Museum, Univ. of Cambridge, Musee de l’Homme)26 Subarctic Native Americans from the subarctic culture area, Canada (Natural History Museum,
Univ. of Cambridge)27 Northwest
AmericaNorthwest coast of Canada, Native Americans from the Plateau, Great Basin, and South-
west culture areas (Natural History Museum, Univ. of Cambridge, Musee de l’Homme)28 California Native Americans from California (Natural History Museum, Univ. of Cambridge)29 Northeast
AmericaNative Americans from the Great Plains, Northeast, and Southeast culture areas (Natural
History Museum, Univ. of Cambridge)30 Mesoamerica Native Americans from Mexico, including a few samples from Colombia and Ecuador
(Natural History Museum, Univ. of Cambridge)31 Caribians Native Americans from the Carib Islands, including a few samples from Venezuela and
Guyana (Natural History Museum, Univ. of Cambridge)32 Peruvians Cerro del Oro, Huacho, Pisagua, and other regions (Natural History Museum)33 Fuegians-
PatagoniansTerra del Fuego and Patagonia region, southernmost part of South America (Natural His-
tory Museum, Univ. of Cambridge, Musee de l’Homme)(continued)
106 T. HANIHARA

TABLE 1. (continued)
Sample name Brief information
Micronesia34 Mariana Recent Chamorros from Guam, Saipan, and Tinian Islands (Musee de l’Homme)35 Caroline Recent Ponape Islanders, including a few other Caroline Islanders (Musee de l’Homme,
Univ. of Tokyo)Polynesia
36 Hawaii Recent native Hawaiians; mainly from Oahu Island (Natural History Museum, Univ. ofCambridge)
37 Easter Recent Easter Islanders (Natural History Museum, Univ. of Cambridge, Musee de l’Homme)38 Marquesas Early Marquesans from Uahuka Island (ca. 2,000 years B.P.) and recent Marquesas
Islanders (B.P. Bishop Museum,10 Natural History Museum, Musee de l’Homme)39 Society Recent Society Islanders, mainly from Tahiti (Natural History Museum, Musee de l’Homme)40 Cook Recent Cook Islanders, mainly from Mangaia (Natural History Museum, Kyoto Univ.)41 Tonga-Samoa Recent Tongans and Samoans (Australian Museum,11 Univ. of Sydney, South Australian
Museum, Natural History Museum, Univ. of Cambridge, Musee de l’Homme)42 Maori Recent aboriginal populations from New Zealand (Australian Museum, Univ. of Sydney,
South Museum, Natural History Museum, Univ. of Cambridge)43 Moriori Recent aboriginal populations of Chatham Island (Australian Museum, Univ. of Sydney,
South Australian Museum, Natural History Museum, Univ. of Cambridge)Melanesia
44 Fiji Recent aboriginal Fijians (Australian Museum, Natural History Museum, Univ. of Cam-bridge, Musee de l’Homme)
45 New Britain Recent inhabitants of New Britain Islands (Australian Museum, Univ. of Sydney, SouthAustralian Museum, Natural History Museum, Univ. of Cambridge)
46 Vanuatu Recent inhabitants of New Hebrides Islands (Australian Museum, Univ. of Sydney, SouthAustralian Museum, Natural History Museum, Univ. of Cambridge)
47 New Caledonia Recent New Caledonia Islanders (Australian Museum, Univ. of Sydney, South AustralianMuseum, Natural History Museum, Univ. of Cambridge)
48 New Ireland Recent New Ireland people (Australian Museum, Univ. of Sydney, South AustralianMuseum, Natural History Museum)
49 Santa Cruz Recent inhabitants of Santa Cruz Islands (Australian Museum, Univ. of Sydney, SouthAustralian Museum, Natural History Museum)
50 Solomon Recent inhabitants of Solomon Islands (Australian Museum, Univ. of Sydney, South Aus-tralian Museum, Natural History Museum, Univ. of Cambridge)
51 Torres Strait Recent inhabitants of the islands of the Torres Strait (Natural History Museum, Univ. ofCambridge, Musee de l’Homme)
52 Papua NewGuinea
Purari River delta, Fly River delta, Sepik River delta, and other regions (AustralianMuseum, Univ. of Sydney, South Australian Museum, Natural History Museum)
Australia53 New South
WalesRecent Australian Aborigines from the coastal region of New South Wales (Australian
Museum, Natural History Museum, Univ. of Cambridge, Musee de l’Homme)54 South Australia Recent Australian Aborigines living near Adelaide (South Australian Museum, Natural
History Museum, Univ. of Cambridge, Musee de l’Homme)55 Murray River Mainly from the Roonka site, but including a recent sample from Murray River basin,
South Australia (South Australian Museum, Natural History Museum, Univ. of Cam-bridge, Musee de l’Homme)
56 Queensland Recent Australian Aborigines from Queensland (Natural History Museum, Univ. of Cam-bridge, Musee de l’Homme)
57 WesternAustralia
Recent Australian Aborigines from Western Australia (Natural History Museum, Univ. ofCambridge, Musee de l’Homme)
58 Tasmania Recent Tasmanian Aborigines (Natural History Museum, Univ. of Cambridge, Musee del’Homme)
Indian Subcontinent59 Tibetans Native Tibetans, mainly from Tibetan soldiers of the late 19th century (Natural History
Museum, Univ. of Cambridge)60 Nepalese Sunwar and other regions; lowlanders, Nepal (Natural History Museum, Univ. of Cambridge)61 Assam-Sikkim Mishme, Naga, Thado, Kuki, Singho, Lepcha, and other tribes; Darjeeling, Assam, Sikkim
Districts, Northeast India (Natural History Museum)62 Bangladesh-
BhutanRecent inhabitants of Bangladesh and Bhutan (Natural History Museum)
63 Bengal-Bihar Hindu people, Musselman from the west Bengal District, natives of Patna and otherregions of the Province of Bihar, Koa and others from Cuttack, Province of Orissa (Natu-ral History Museum)
64 Punjab-Kashmir Musselman, Peshwar, Hindu low-caste, Mohammedan, Punjab, and Kashmir Districts,Northwest India and Pakistan (Natural History Museum)
65 Delhi-NorthwestIndia
Native Indians from around Delhi and those from Northwest India (Natural HistoryMuseum)
66 Madras Native Indians from around Madras, Province of Tamil Nadu, mainly Dravidians;Malabar coast of India, Province of Karnataka, including Tamil, southern part of India(Natural History Museum, South Australian Museum)
67 Veddah Recent Veddahs from Ceylon Island, Sri Lanka (Natural History Museum, South Austra-lian Museum)
(continued)
107FRONTAL AND FACIAL FLATNESS

TABLE 1. (continued)
Sample name Brief information
Central-West Asia68 Afghanistan Kelati, Pecheen Valley and other regions, natives of Afghanistan (Natural History
Museum)69 Palestine Tell Duweir (Lachish), Bronze and Iron Age, ca. 5,000–3,000 years B.P., Palestine, Israel
(Natural History Museum)70 Turkey Hellenistic and Roman periods, Constantinople and other places, Turkey (Natural History
Museum)71 Cyprus Hellenistic and Roman period, Cyprus Islands (Natural History Museum)
Europe72 Greece Recent Greece from several locations (Natural History Museum)73 Ancient Greece Ancient Greece from Sigeum, Cyrene, Samos, Corfu, Athens, Greece (Natural History
Museum)74 Italians Frosinone, Rome, Sicily, Otaranto, etc. recent Italian soldiers (Natural History Museum)75 Ancient Italians From before the Christian period to 4–5 the century A.D.; Etruria, Naples, Rome, and
other places (Natural History Museum)76 Russians Recent Russians, Don Cossack soldiers, Odessa (Natural History Museum, Univ. of Cam-
bridge)77 Hungarians Ancient Churchyards at Buda-Pest, Magyar, Buda-Pest (Natural History Museum)78 Czech Charvaty, Central Moravia, Czechoslovakia (South Australian Museum, Natural History
Museum)79 Finland Saarijarvi, Birkala, Kides, Carelia (Natural History Museum)80 Norwegians Recent Norwegians, probably seamen (Natural History Museum)81 Swedish Medieval graves at Stockholm; Calacarlian (Kopperberg, central Sweden) (Natural His-
tory Museum)82 Lapps Lycksele, on the River Umea, province of Westerhotten; ancient Lapps found at Morten-
suoes, Norway (Natural History Museum, Musee de l’Homme)83 Holland Friesland, Province of Groningen, Province of Gelderland, Province of Noord (Natural His-
tory Museum)84 German Munchen, Hessian soldiers, Holstein, Saxon regiment, Leipzig, Germany (Natural History
Museum, Univ. of Cambridge)85 French Ouchy, Upnor near Chatham, Lower Brittany, soldiers in the Army of Napoleon, recent
French people, France (Natural History Museum, Univ. of Cambridge, Musee del’Homme)
86 Ancient French Gaulish, Gallo-Roman, and Frankish Merovingian times (418–752 A.D.) (Natural HistoryMuseum)
87 Spain-Portugal Basque from Zaraus, Province of Guipuscoa, and other regions in Spain, and prehistoricSpanish: Genista cave no. 3, Gibraltar, Albama de Granada, stone age Spain; recent Por-tuguese from Corunna, Oporto (Natural History Museum)
U.K. series88 Ensay Late medieval to post mediaeval periods, Scotland, excavated at Ensay Island (Natural
History Museum)89 Repton St. Wystans, Repton, Derbyshire, northeast region of England, medieval era (Natural His-
tory Museum)90 Poundbury Late Roman period, Poundbury, southwest England (Natural History Museum)91 Spitalfields-1 Mid-Victorian, Christ Church, Spitalfields, eastern region of London, England (Natural
History Museum)92 Spitalfields-2 Pre-17th century, Spitalfields (Univ. of Cambridge)93 Neolithic UK Lan Hill, Skend Leby, Kennet, Littleton Drew, Rodmarton, Rotherham, and other places
(Univ. of Cambridge)North Africa
94 Badari Ancient Egyptians from Badari, ca. 5,000–4,000 years B.P. (Univ. of Cambridge)95 Naqada Predynastic Egyptians from Naqada, ca. 5,000–4,000 years B.P. (Univ. of Cambridge)96 Gizeh 26th–30th Dynasty, 664–343 B.C., Gizeh, Egypt (Univ. of Cambridge)97 Kerma Dinka near Omdurman, Deruish, 12th–13th Dynasty of Nubia, Kerma (Univ. of Cambridge)98 Early Nubia Island of Hesa and Biga, early Christian or Christian date, Nubia (Univ. of Cambridge)99 Recent Nubia Recent populations from Sesebi, Nubia (Natural History Museum)
100 Morocco Tenerife, Orotaua, Guanche, Canary Islands, Morocco (Natural History Museum)SubSaharan Africa
101 West Africa Recent people from west Africa; Senegal, Gambia, Guinea, Sierra Leone, Liberia, andIvory Coast (Natural History Museum)
102 Nigeria-1 Ibo, northern Nigeria, west Africa (Natural History Museum, Univ. of Cambridge)103 Nigeria-2 Ashanti, northern Nigeria, west Africa (Natural History Museum, Univ. of Cambridge)104 Gabon Fernand Vaz River, recent people from Gabon (Natural History Museum)105 Congo Recent people from Congo (Natural History Museum, Univ. of Cambridge)106 Somalia Erigavo District, Ogaden Somali, Darod Kuhar, Burao District, Somalia (Univ. of Cam-
bridge)107 Kenya Nairobi, Teita Hills, Bantu-speaking people, Kenya (Univ. of Cambridge, Natural History
Museum)108 Tanzania Haya from Musira Island, Lake Victoria, Kikunga cave, and Ikurunga Cave, Tanzania
(Univ. of Cambridge, Natural History Museum)(continued)
108 T. HANIHARA

of the gnathic index), with more or less flatfaces comparable to some eastern Asians(Bulbeck, 1981; Groves, 1989; Howells, 1989;Stringer, 1989; Lahr, 1996).
Throughout the course of human evolu-tion, craniofacial characters, including fron-tal and facial flatness, have changed indifferent groups, and thus differing degreesof these features are observed among recenthuman populations (Lahr, 1994, 1995, 1996;Lahr and Wright, 1996). According to Lahr(1996), there has been a process of change incraniofacial dimensions in modern humansthat has produced the traits identified inmost recent groups, although the specificfeatures are not universal either temporallyor geographically.
In the present study, following the pioneer-ing studies by Howells (1973, 1989, 1995)and Lahr (1994, 1995, 1996), three aspectsof the relationship between levels of frontaland facial flatness are examined: 1) theregional distribution of frontal and facialflatness; 2) possible phylogenetic interpreta-tions of the variation found; and 3) implica-tions for the current debate about modernhuman origins, as tested by Lahr and Wright(1996).
MATERIALS AND METHODS
The samples used here consist of 112prehistoric and recent populations from ma-jor geographical areas in the world. Table 1provides sample names and brief back-ground information for each sample. All ofthe samples are of male crania.
Six indices were calculated to evaluatefrontal and facial flatness: 1) glabella-opis-
thocranion/nasion-opisthocranion (M1/M1d)for evaluating the magnitude of the infragla-bellar notch; 2) alveolar index, basion-prosthion/basion-nasion (M40/M5) for prog-nathism; 3) sagittal-frontal index, sagittalfrontal chord/sagittal frontal arc (M29/M26)for frontal flatness in the sagittal planetentatively; and three facial flatness indicesdefined by Yamaguchi (1973) as follows: 4)frontal index, nasion subtense/inner bior-bital breadth (No. 43c/M43(1)); 5) simoticindex, simotic subtense/simotic chord (No.57a/M57); and 6) zygomaxillary index, zygo-maxillary subtense/zygomaxillary chord (No.46c/No. 46b). Descriptions for each measure-ment are given under the appropriate Mar-tin (M) number by Brauer (1988). The sub-tenses were not measured directly but werecalculated from three sides of triangle mea-sured by 0.1 mm, applying trigonometricformulae (Yamaguchi, 1973; see also Hani-hara et al., 1999). In this study, frontalflatness represented by the frontal index iscalled fronto-orbital flatness to avoid confu-sion with frontal flatness in the sagittalplane.
The relationship between a set of trans-verse facial flatness variables and the flat-ness of frontals represented by the glabellarindex, frontal index in the sagittal plane, aswell as gnathic index was analyzed throughcanonical correlation analysis. Before apply-ing canonical correlation analysis, the nor-mal distribution of the six indices was exam-ined for four samples having more than 100individuals. The test for normal distributionwas performed using k-statistics based onthe skewness and kurtosis of the distribu-
TABLE 1. (continued)
Sample name Brief information
109 Uganda Ankole, Basia native, Mt. Elgon (Natural History Museum, Univ. of Cambridge)110 Malawi Angoni, Lake Nyasa (Natural History Museum, Univ. of Cambridge)111 South Africa Zulu and Kaffir, Pietremanitzburg, Natal, and other places South Africa (Natural History
Museum, Univ. of Cambridge)112 Khoi-San Recent Bushmen and Hottentots from South Africa (Natural History Museum, Univ. of
Cambridge)1 Univ. of Tokyo: Department of Anthropology, Faculty of Science, University of Museum; Tokyo, Japan.2 Tohoku Univ.: Department of Anatomy, School of Medicine; Sendai, Japan.3 Sapporo Medical Univ.: Department of Anatomy, School of Medicine; Sapporo, Japan.4 Kyoto Univ.: Department of Zoology, Faculty of Science; Kyoto, Japan.5 Natural History Museum: Department of Palaeontology; London, U.K.6 Musee de l’Homme: Department of Anthropology; Paris, France.7 Univ. of Sydney: Department of Anatomy and Histology, Faculty of Medicine; Sydney, Australia.8 Univ. of Cambridge: Department of Biological Anthropology, Duckworth Laboratory; Cambridge, U.K.9 South Australian Museum: Department of Anthropology; Adelaide, Australia.10 B.P. Bishop Museum: Department of Anthropology; Honolulu, HI.11 Australian Museum: Department of Anthropology; Sydney, Australia.
109FRONTAL AND FACIAL FLATNESS

TABLE 2. Mean and standard deviation (S.D.) for M1,1 M1d,2 and (M1/M1d) p 1003
Sample name N
M1 M1d M1/M1d (%)
Mean S.D. Mean S.D. Mean S.D.
Japanese 131 182.1 5.91 179.3 5.88 101.6 0.68Ainu 35 187.3 4.86 184.0 4.41 101.8 0.73Jomonese 33 184.0 7.49 180.9 7.31 101.7 0.77Northern Chinese 49 181.9 5.39 178.8 5.71 101.4 0.63Southern Chinese 65 180.6 6.46 178.1 6.31 101.4 0.65Koreans 23 179.6 6.98 174.8 7.46 101.9 0.80Mongolians 32 180.9 6.34 178.4 6.08 101.4 0.69Northeast Asians 17 179.9 5.50 177.7 5.37 101.2 0.56Chukchis 12 186.2 5.44 183.7 5.12 101.4 0.75Vietnamese 23 179.0 5.13 176.3 4.96 101.6 0.67Laos-Cambodia 21 175.6 5.05 172.2 4.64 102.0 0.72Thailand 18 177.1 6.00 173.4 6.24 102.1 1.05Myanmar 88 176.6 6.39 173.8 6.11 101.6 0.81Malay 44 175.3 7.72 172.6 7.57 101.6 0.69Early-SE Asians 20 186.1 6.39 183.2 6.40 101.9 0.97Sumatra 12 176.9 5.53 174.3 6.09 101.5 0.71Javanese 61 176.9 5.56 174.0 5.53 101.7 0.82Borneans 72 180.3 6.37 177.2 6.16 101.8 0.73Filipinos 76 178.0 6.09 175.2 5.79 101.6 0.68Celebes-Molucca 28 175.3 7.70 172.5 7.71 101.7 0.65Lesser Sunda 9 179.3 6.80 175.8 6.70 102.0 0.77Andamanese 49 169.1 5.37 167.4 5.00 101.1 0.63Nicobarese 20 181.7 6.09 176.8 6.08 102.7 0.66Negritos 17 171.6 6.20 169.4 6.18 101.3 0.40Eskimos 77 189.6 6.72 185.6 6.42 102.2 0.79Subarctic 22 186.6 5.34 183.6 5.15 101.7 0.78Northwest America 20 184.8 8.90 182.5 8.16 101.3 0.93California 31 181.8 8.74 179.1 8.61 101.5 0.85East America 24 185.9 4.48 182.6 4.30 101.8 0.59Mesoamerica 16 178.2 8.55 175.9 8.39 101.3 0.61Caribians 18 181.1 6.88 178.7 6.82 101.3 0.74Peruvians 64 174.6 5.73 172.2 5.64 101.4 0.69Fuegian-Patagonian 37 189.1 6.51 185.1 6.36 102.2 0.71Mariana 22 182.5 5.53 179.6 5.84 101.6 0.79Caroline 11 185.2 8.34 181.1 7.58 102.3 0.72Hawaii 71 183.8 6.53 180.3 5.78 101.9 0.87Easter 64 192.1 5.61 186.7 5.23 102.9 0.81Marquesas 56 186.3 6.91 183.0 6.53 101.8 0.80Society 46 184.9 5.63 181.7 5.39 101.8 0.81Cook 14 180.8 6.51 177.6 6.46 101.8 0.73Tonga-Samoa 16 178.3 5.22 174.5 3.45 102.2 0.74Maori 111 186.7 6.25 183.0 6.04 102.0 0.72Moriori 70 187.0 5.56 184.1 5.21 101.5 0.75Fiji 42 189.4 6.59 183.9 7.06 102.5 0.86New Britain 58 183.5 5.86 178.4 5.76 102.9 0.78Vanuatu 25 185.7 5.16 181.4 4.91 102.4 0.60New Caledonia 37 185.0 6.11 181.2 5.74 102.3 0.87New Ireland 26 182.4 6.44 178.0 6.16 102.5 0.78Santa Cruz 16 185.3 5.81 181.1 5.06 102.3 0.91Solomon 57 181.9 5.43 177.4 5.21 102.5 0.86Torres Strait 55 185.0 6.85 180.9 6.40 102.3 0.73Papua New Guinea 152 179.7 5.95 176.3 5.70 101.9 0.81New South Wales 56 187.6 6.12 182.2 5.81 103.0 0.87South Australia 122 188.5 6.21 182.9 6.01 103.1 0.83Murray River 45 188.8 7.10 182.7 6.93 103.1 0.86Queensland 20 183.2 6.94 178.4 6.36 102.7 0.79Western Australia 22 184.9 7.04 180.4 6.58 102.5 0.70Tasmania 11 184.5 7.46 178.8 7.28 103.2 0.91Nepalese 30 179.1 6.30 176.3 5.77 101.6 0.74Tibetans 56 178.5 8.16 175.9 7.89 101.5 0.68Bangladesh-Bhutan 26 178.4 5.62 175.5 5.43 101.7 0.78Assam-Sikkim 37 177.7 5.87 174.8 5.47 101.7 0.67Bengal-Bihar 76 177.5 6.22 174.6 6.06 101.7 0.67Punjab 73 184.1 5.86 181.2 5.66 101.6 0.55Delhi-NW India 33 178.8 7.49 175.6 7.55 101.9 0.72Madras 97 177.1 6.46 173.6 6.20 102.0 0.70Veddah 16 177.7 6.61 174.6 6.47 101.8 0.66Afghanistan 29 183.6 7.22 180.6 6.95 101.7 0.62
(continued)
110 T. HANIHARA
tion pattern for each index. Four of the 6indices are normally distributed. The indi-ces for estimating the depth of the infragla-bellar notch and the level of frontal flatnessin the sagittal plane are not normally distrib-uted.
RESULTSUnivariate analyses
The basic statistical results of the sixindices for each sample are given in Tables2–7. Figures 1–6 show the principal featuresof the variations among 112 populationsamples in the six indices.
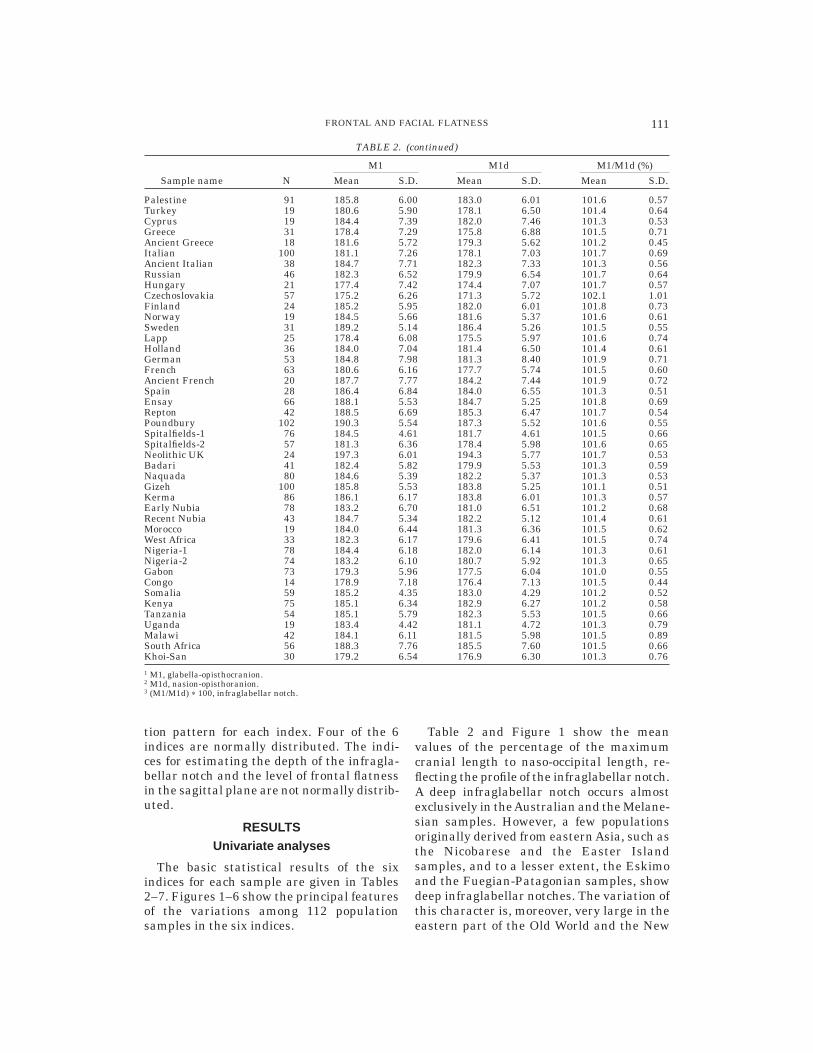
Table 2 and Figure 1 show the meanvalues of the percentage of the maximumcranial length to naso-occipital length, re-flecting the profile of the infraglabellar notch.A deep infraglabellar notch occurs almostexclusively in theAustralian and the Melane-sian samples. However, a few populationsoriginally derived from eastern Asia, such asthe Nicobarese and the Easter Islandsamples, and to a lesser extent, the Eskimoand the Fuegian-Patagonian samples, showdeep infraglabellar notches. The variation ofthis character is, moreover, very large in theeastern part of the Old World and the New
TABLE 2. (continued)
Sample name N
M1 M1d M1/M1d (%)
Mean S.D. Mean S.D. Mean S.D.
Palestine 91 185.8 6.00 183.0 6.01 101.6 0.57Turkey 19 180.6 5.90 178.1 6.50 101.4 0.64Cyprus 19 184.4 7.39 182.0 7.46 101.3 0.53Greece 31 178.4 7.29 175.8 6.88 101.5 0.71Ancient Greece 18 181.6 5.72 179.3 5.62 101.2 0.45Italian 100 181.1 7.26 178.1 7.03 101.7 0.69Ancient Italian 38 184.7 7.71 182.3 7.33 101.3 0.56Russian 46 182.3 6.52 179.9 6.54 101.7 0.64Hungary 21 177.4 7.42 174.4 7.07 101.7 0.57Czechoslovakia 57 175.2 6.26 171.3 5.72 102.1 1.01Finland 24 185.2 5.95 182.0 6.01 101.8 0.73Norway 19 184.5 5.66 181.6 5.37 101.6 0.61Sweden 31 189.2 5.14 186.4 5.26 101.5 0.55Lapp 25 178.4 6.08 175.5 5.97 101.6 0.74Holland 36 184.0 7.04 181.4 6.50 101.4 0.61German 53 184.8 7.98 181.3 8.40 101.9 0.71French 63 180.6 6.16 177.7 5.74 101.5 0.60Ancient French 20 187.7 7.77 184.2 7.44 101.9 0.72Spain 28 186.4 6.84 184.0 6.55 101.3 0.51Ensay 66 188.1 5.53 184.7 5.25 101.8 0.69Repton 42 188.5 6.69 185.3 6.47 101.7 0.54Poundbury 102 190.3 5.54 187.3 5.52 101.6 0.55Spitalfields-1 76 184.5 4.61 181.7 4.61 101.5 0.66Spitalfields-2 57 181.3 6.36 178.4 5.98 101.6 0.65Neolithic UK 24 197.3 6.01 194.3 5.77 101.7 0.53Badari 41 182.4 5.82 179.9 5.53 101.3 0.59Naquada 80 184.6 5.39 182.2 5.37 101.3 0.53Gizeh 100 185.8 5.53 183.8 5.25 101.1 0.51Kerma 86 186.1 6.17 183.8 6.01 101.3 0.57Early Nubia 78 183.2 6.70 181.0 6.51 101.2 0.68Recent Nubia 43 184.7 5.34 182.2 5.12 101.4 0.61Morocco 19 184.0 6.44 181.3 6.36 101.5 0.62West Africa 33 182.3 6.17 179.6 6.41 101.5 0.74Nigeria-1 78 184.4 6.18 182.0 6.14 101.3 0.61Nigeria-2 74 183.2 6.10 180.7 5.92 101.3 0.65Gabon 73 179.3 5.96 177.5 6.04 101.0 0.55Congo 14 178.9 7.18 176.4 7.13 101.5 0.44Somalia 59 185.2 4.35 183.0 4.29 101.2 0.52Kenya 75 185.1 6.34 182.9 6.27 101.2 0.58Tanzania 54 185.1 5.79 182.3 5.53 101.5 0.66Uganda 19 183.4 4.42 181.1 4.72 101.3 0.79Malawi 42 184.1 6.11 181.5 5.98 101.5 0.89South Africa 56 188.3 7.76 185.5 7.60 101.5 0.66Khoi-San 30 179.2 6.54 176.9 6.30 101.3 0.761 M1, glabella-opisthocranion.2 M1d, nasion-opisthoranion.3 (M1/M1d) p 100, infraglabellar notch.
111FRONTAL AND FACIAL FLATNESS

TABLE 3. Mean and standard deviation (S.D.) for M5,1 M40,2 and (M40/M5) p 1003
Sample name N
M5 M40 M40/M5 (%)
Mean S.D. Mean S.D. Mean S.D.
Japanese 138 101.4 4.64 97.0 5.28 95.8 3.62Ainu 34 106.0 3.75 102.9 4.89 96.9 3.60Jomonese 29 103.3 7.20 101.7 8.05 98.1 4.60Northern Chinese 48 100.2 3.31 96.7 4.64 96.6 4.01Southern Chinese 64 99.3 4.03 96.0 4.91 96.7 4.32Koreans 27 99.7 4.40 95.6 4.96 95.5 4.22Mongolians 32 99.7 4.24 96.8 5.35 97.2 4.72Northeast Asians 17 99.6 4.65 98.6 4.51 99.0 2.64Chukchis 12 105.3 4.01 103.4 5.13 98.2 4.36Vietnamese 23 100.4 3.89 97.2 5.17 96.8 3.05Laos-Cambodia 42 97.9 3.75 95.8 4.52 98.0 3.84Thailand 30 99.1 3.84 97.4 4.16 98.4 4.15Myanmar 102 98.8 4.29 96.7 5.03 98.1 3.74Malay 50 97.9 4.70 97.6 4.98 99.3 4.22Early-SE Asians 7 101.0 5.20 97.3 5.94 97.9 2.90Sumatra 13 99.9 5.81 98.3 4.73 98.6 5.05Javanese 62 100.0 3.75 99.1 3.89 99.2 3.39Borneans 67 99.4 3.89 97.4 4.95 97.9 3.97Filipinos 76 100.3 4.30 98.4 4.52 97.7 4.39Celebes-Molucca 29 99.0 3.26 99.0 4.41 100.1 3.39Lesser Sunda 12 98.7 3.23 96.5 4.48 97.9 4.59Andamanese 49 93.4 3.39 93.2 3.50 100.0 3.65Nicobarese 19 98.0 3.84 98.3 3.75 101.2 4.23Negritos 18 95.1 4.85 93.1 6.28 97.9 4.13Eskimos 77 104.9 4.13 103.2 4.43 98.3 3.63Subarctic 23 103.9 5.10 101.0 5.35 97.8 3.47Northwest America 51 99.9 4.50 101.0 5.77 101.2 4.44California 35 99.7 4.94 99.1 6.08 99.2 3.30East America 25 103.9 3.89 100.4 5.23 97.1 3.93Mesoamerica 25 97.2 4.22 97.0 5.07 99.8 4.83Caribians 20 98.4 4.42 97.5 4.78 99.1 4.25Peruvians 91 98.8 3.91 98.3 4.55 99.6 3.59Fuegian-Patagonian 38 104.8 4.16 102.1 4.39 97.5 3.67Mariana 21 103.5 3.93 99.2 5.17 96.1 3.31Caroline 11 103.8 5.04 101.9 5.07 98.3 4.42Hawaii 72 105.2 4.41 101.8 4.50 96.8 3.43Easter 57 111.1 3.49 106.4 4.39 95.6 3.74Marquesas 52 103.9 4.22 102.6 4.33 98.9 3.08Society 42 104.8 4.53 102.3 3.77 97.7 3.63Cook 13 103.2 4.15 100.7 5.31 97.2 3.23Tonga-Samoa 17 104.4 4.85 100.5 4.79 96.4 2.95Maori 108 104.4 3.97 100.9 4.65 96.7 3.72Moriori 68 104.6 3.66 101.7 4.40 97.2 3.05Fiji 36 102.4 4.25 102.9 3.51 101.3 3.53New Britain 57 100.5 3.96 105.3 5.02 104.9 4.00Vanuatu 25 100.7 3.79 106.0 5.26 105.3 3.91New Caledonia 38 102.0 3.63 106.0 4.39 103.7 3.18New Ireland 26 99.7 3.32 102.3 4.74 102.7 4.53Santa Cruz 16 99.1 3.70 103.6 4.58 105.4 3.80Solomon 53 99.8 3.75 100.3 3.90 100.5 4.64Papua New Guinea 147 99.0 3.89 101.2 4.93 102.4 3.86Torres Strait 56 101.2 3.63 106.3 4.68 105.1 3.53New South Wales 53 101.6 3.75 103.0 4.15 101.3 4.03South Australia 98 101.6 4.50 106.2 5.21 104.9 3.82Murray River 13 100.3 4.96 104.9 4.99 105.0 3.72Queensland 19 99.8 4.19 101.7 5.30 101.9 3.52Western Australia 21 99.7 4.66 102.3 3.40 102.4 4.86Tasmania 10 98.2 4.85 102.3 5.62 104.2 4.35Nepalese 30 98.1 4.42 95.2 5.34 96.8 3.87Tibetans 56 97.8 4.19 94.4 6.09 96.5 5.32Bangladesh-Bhutan 23 99.2 3.64 94.2 3.40 95.3 2.65Assam-Sikkim 40 97.7 4.05 95.0 4.38 97.3 3.16Bengal-Bihar 77 99.1 3.95 94.5 4.33 95.4 3.35Punjab 73 102.8 4.51 97.1 4.62 94.5 3.65Delhi-NW India 33 98.7 4.33 94.9 4.17 95.9 3.68Madras 100 98.1 4.59 95.6 4.65 97.5 3.69Veddah 16 98.7 4.38 94.2 4.53 95.6 3.78Afghanistan 37 102.9 4.19 100.7 5.45 97.7 3.76
(continued)
112 T. HANIHARA

World, covering almost all the range of theworldwide samples.
A variation of facial prognathism ex-pressed by the gnathic index is illustrated inFigure 2 (see also Table 3). The greatestprognathism is observed in the Australian/Melanesian samples, followed closely bysome of the subSaharan African samples.Regarding the other samples in the world,the samples from the eastern hemisphere ofthe Old World together with the New Worldsamples are more or less prognathic thanthose from the western hemisphere. The
Southeast Asian samples, especially fromthe insular part, are relatively prognathic.
The degree of frontal flatness in the sagit-tal plane was tentatively estimated by thesagittal-frontal index, as shown in Table 4and Figure 3. Among the 17 regional sam-ples, the Australian samples have, on aver-age, flat frontal bones. However, the South-east Asian Nicobarese sample shows theflattest frontals, followed by the three sam-ples from subSaharan Africa (the Congo, theTanzania, and the Khoi-San samples). Itshould be noted that the South Indian Dra-
TABLE 3. (continued)
Sample name N
M5 M40 M40/M5 (%)
Mean S.D. Mean S.D. Mean S.D.
Palestine 88 101.8 4.21 97.2 4.93 95.7 3.35Turkey 20 100.4 3.73 96.9 5.47 96.5 3.38Cyprus 17 100.8 4.72 94.6 4.30 93.6 2.59Greece 32 100.5 3.49 95.9 4.11 95.4 3.45Ancient Greece 17 100.4 4.49 93.9 3.93 93.0 3.92Italian 100 100.9 4.53 96.2 5.28 95.3 4.54Ancient Italian 30 101.7 4.70 94.5 4.83 93.0 4.12Russian 46 101.6 4.64 96.9 5.02 95.3 3.35Hungary 20 99.2 3.45 95.3 4.72 96.3 3.61Czechoslovakia 57 98.0 4.51 94.3 4.84 96.0 4.50Finland 24 101.5 4.64 97.4 4.66 96.1 3.65Norway 20 100.2 3.64 95.1 4.69 94.9 3.45Sweden 31 100.7 4.12 95.9 5.11 95.1 3.56Lapp 28 97.3 3.79 94.7 4.39 97.2 2.92Holland 36 99.0 4.93 94.5 5.57 95.6 4.05German 56 99.9 4.04 94.9 5.10 95.0 3.99French 60 98.7 4.44 93.6 5.07 94.9 3.98Ancient French 15 101.9 4.73 96.4 6.25 95.1 3.82Spain 25 102.8 4.10 97.1 4.09 94.5 4.29Ensay 64 100.0 3.71 93.9 4.40 93.9 3.62Repton 35 102.2 4.70 97.5 5.27 95.9 3.30Poundbury 100 101.6 4.88 94.9 5.78 93.4 3.83Spitalfields-1 77 98.6 3.63 91.6 5.01 92.9 3.79Spitalfields-2 57 100.6 3.94 96.4 4.65 95.9 3.73Neolithic UK 14 105.7 4.83 100.3 4.35 94.8 2.81Badari 39 99.1 4.15 96.6 4.54 97.6 4.50Naquada 80 101.7 3.83 97.6 4.31 96.0 3.58Gizeh 100 101.9 3.73 95.4 3.76 93.7 3.61Kerma 82 101.8 4.04 98.4 4.52 96.7 3.80Early Nubia 77 100.8 4.29 95.6 5.33 94.8 4.24Recent Nubia 41 101.9 3.98 100.2 5.99 98.5 5.44Morocco 18 99.7 4.84 93.7 4.82 93.8 3.93West Africa 33 101.4 4.49 104.0 6.08 102.6 3.90Nigeria-1 75 101.8 4.02 101.1 4.46 99.6 3.91Nigeria-2 71 101.7 4.33 103.9 5.04 102.2 4.45Gabon 73 99.8 3.99 101.5 4.83 101.8 4.02Congo 11 98.4 4.82 103.2 4.85 105.0 4.88Somalia 58 101.8 3.52 95.7 4.69 94.0 3.97Kenya 69 100.3 4.15 101.1 5.32 100.7 4.24Tanzania 53 101.3 4.21 105.3 4.53 104.1 4.45Uganda 18 100.2 3.72 103.4 4.53 103.2 3.15Malawi 41 101.4 4.47 102.4 5.44 101.0 3.72South Africa 56 103.2 4.99 103.6 6.84 100.4 4.64Khoi-San 29 96.2 4.50 95.5 6.68 99.3 5.431 M5, basion-nasion.2 M40, basion-prosthion.3 (M40/M5) p 100, alveolar index.
113FRONTAL AND FACIAL FLATNESS

TABLE 4. Mean and standard deviation (S.D.) for M26,1 M29,2 and (M29/M26) p 1003
Sample name N
M26 M29 M29/M26 (%)
Mean S.D. Mean S.D. Mean S.D.
Japanese 128 126.6 5.07 110.9 4.10 87.6 1.83Ainu 35 129.3 4.88 113.1 3.68 87.5 1.31Jomonese 36 126.3 5.54 111.2 4.66 88.1 1.34Northern Chinese 50 127.2 5.96 112.7 4.54 88.7 1.74Southern Chinese 66 126.8 5.70 111.5 4.15 88.0 1.45Koreans 26 126.9 5.22 111.7 4.15 88.1 1.31Mongolians 30 127.3 4.66 112.9 3.97 88.7 1.13Northeast Asians 17 125.9 6.52 111.9 5.23 88.9 1.12Chukchis 12 125.1 4.48 112.3 4.03 89.8 1.09Vietnamese 23 127.4 6.42 112.5 5.13 88.4 1.43Laos-Cambodia 43 125.2 5.72 109.8 3.68 87.8 2.16Thailand 30 128.0 6.08 112.6 4.55 88.0 1.56Myanmar 103 127.0 5.99 111.6 4.52 87.9 1.83Malay 50 126.2 6.28 111.3 4.76 88.2 1.60Early-SE Asians 21 129.5 7.45 113.1 5.80 87.4 1.74Sumatra 13 122.6 4.41 108.2 3.89 88.2 1.64Javanese 62 127.6 5.53 111.8 4.30 87.7 1.58Borneans 75 127.7 6.77 111.2 4.59 87.1 1.94Filipinos 77 127.0 5.91 111.9 4.80 88.1 1.20Celebes-Molucca 29 124.9 6.13 110.1 4.36 88.2 1.38Lesser Sunda 13 125.3 6.73 110.4 4.84 88.1 1.56Andamanese 50 121.4 6.21 107.2 4.79 88.4 1.82Nicobarese 19 127.8 7.04 110.0 4.98 86.1 1.60Negritos 18 123.7 4.59 108.4 3.43 87.6 1.76Eskimos 77 130.0 6.20 113.6 4.53 87.5 1.53Subarctic 23 126.1 4.98 113.0 3.88 89.5 1.57Northwest America 37 124.9 7.31 113.3 4.66 90.2 1.99California 42 124.7 6.50 111.5 4.68 89.2 2.23East America 28 127.9 5.08 113.7 3.54 88.8 1.84Mesoamerica 25 120.9 6.35 109.0 5.76 89.9 1.28Caribians 20 124.9 5.06 110.7 3.80 88.7 2.09Peruvians 84 119.3 5.59 107.4 4.40 90.1 1.71Fuegian-Patagonian 40 129.9 5.04 115.7 4.04 89.1 1.80Mariana 25 129.9 6.37 114.2 5.19 87.9 1.59Caroline 11 128.9 5.91 112.5 4.27 87.3 1.30Hawaii 72 131.3 5.99 116.1 4.50 88.5 1.53Easter 65 133.7 5.18 116.6 3.78 87.3 1.42Marquesas 57 131.5 6.69 116.4 5.22 88.6 1.52Society 46 129.9 5.49 114.9 3.88 88.5 1.72Cook 14 129.7 5.57 114.4 5.11 88.1 1.61Tonga-Samoa 19 129.3 6.42 114.3 5.28 88.4 2.12Maori 111 130.0 5.73 114.7 4.40 88.2 1.45Moriori 69 127.0 5.85 114.0 4.41 89.8 1.45Fiji 42 128.8 6.41 113.6 5.27 88.2 2.15New Britain 58 124.2 5.51 109.8 4.77 88.4 1.44Vanuatu 25 124.6 4.48 111.2 3.56 89.3 1.33New Caledonia 39 128.7 5.19 113.1 4.22 87.9 1.83New Ireland 26 124.2 7.16 109.7 5.25 88.4 1.83Santa Cruz 16 126.8 7.91 110.9 6.04 87.5 1.36Solomon 58 124.9 5.15 109.9 4.05 88.1 1.60Torres Strait 60 125.7 4.95 111.4 3.62 88.7 1.77Papua New Guinea 156 123.0 5.76 108.7 4.33 88.4 1.70New South Wales 57 131.5 5.76 114.0 4.86 86.9 1.62South Australia 128 128.3 6.31 111.7 4.64 87.2 1.84Murray River 37 128.5 6.19 111.2 4.86 86.7 1.47Queensland 20 129.4 6.63 112.3 4.66 86.8 1.31Western Australia 22 126.6 8.03 111.6 5.69 88.2 1.56Tasmania 12 126.2 5.37 110.3 4.00 87.4 1.65Nepalese 31 124.8 6.26 109.6 4.77 87.9 2.42Tibetans 57 125.4 6.48 109.9 4.76 87.7 1.49Bangladesh-Bhutan 27 127.7 7.59 111.4 5.89 87.3 1.77Assam-Sikkim 39 125.1 5.63 109.3 4.25 87.4 1.49Bengal-Bihar 77 125.7 6.02 109.9 4.37 87.4 1.84Punjab 73 126.2 6.70 110.9 5.16 87.9 1.66Delhi-NW India 34 124.9 7.05 108.4 5.52 86.9 2.02Madras 100 127.4 5.95 110.4 4.61 86.7 1.82Veddah 16 126.6 5.76 109.9 4.28 86.9 1.91Afghanistan 38 124.8 5.73 111.1 4.72 89.1 1.42
(continued)
114 T. HANIHARA

vidian sample together with the Veddah andthe northwest Indian samples have flatterfrontal bones than many of the Near East,north African, and European samples.The groups with the opposite condition, orrounded frontal bones, are, on average, NewWorld samples except for the Eskimo sam-ple, and the next the northeast Asiansamples. In this feature, again, the varia-tion is large in the eastern part of the OldWorld and the New World.
The next three presentations focus on thetransverse flatness of facial skeletons. Zygo-maxillary flatness may additionally assess
whether the prognathism examined in Fig-ure 2 and Table 3 is associated with the wholeface or restricted to the alveolar portion.
Figure 4 shows the variation of fronto-orbital flatness. The northeast Asian sam-ples, and to a lesser degree the east Asiansamples except for the Ainu, show the small-est mean values, i.e., the flattest faces infronto-orbital portion. The degree of fronto-orbital flatness is weaker in the Australian/Melanesian samples than in the east/north-east Asian samples. The series from south-east Asia exhibits intermediate values, indi-cating a roughly clinal variation. With the
TABLE 4. (continued)
Sample name N
M26 M29 M29/M26 (%)
Mean S.D. Mean S.D. Mean S.D.
Palestine 91 128.2 6.54 112.6 4.87 87.9 1.91Turkey 23 127.7 6.83 113.1 5.60 88.6 1.36Cyprus 19 127.1 4.34 112.9 3.84 88.8 1.14Greece 33 125.4 5.61 110.4 4.18 88.1 1.51Ancient Greece 19 126.5 4.78 111.6 3.22 88.3 1.23Italian 101 126.4 6.34 110.9 5.18 87.7 1.62Ancient Italian 38 127.5 5.89 112.3 4.54 88.1 1.75Russian 47 128.2 6.16 113.0 4.82 88.1 1.61Hungary 22 123.5 6.32 108.4 4.77 87.9 1.43Czechoslovakia 57 126.5 7.48 110.3 5.43 87.3 1.72Finland 24 130.3 5.86 115.9 7.20 88.1 1.47Norway 19 129.2 6.58 113.5 4.56 87.9 1.43Sweden 31 131.8 5.88 115.9 4.75 87.9 1.06Lapp 28 126.4 6.86 110.9 5.22 87.8 1.20Holland 36 126.9 6.33 111.8 4.82 88.1 1.56German 52 130.7 6.29 114.1 4.93 87.3 1.76French 63 126.9 4.75 111.8 4.11 88.1 1.68Ancient French 23 128.4 8.07 112.5 5.74 87.8 2.29Spain 28 129.4 6.86 113.8 5.36 87.9 1.71Ensay 66 128.6 5.82 111.6 4.83 86.9 1.70Repton 43 127.6 7.25 111.6 5.97 87.5 1.65Poundbury 102 129.9 5.32 112.8 4.13 86.9 1.79Spitalfields-1 82 129.6 5.58 112.7 4.45 87.0 1.88Spitalfields-2 57 127.3 6.25 111.7 4.95 87.8 1.53Neolithic UK 22 132.0 6.37 115.4 4.82 87.5 1.64Badari 40 126.4 5.16 110.4 4.11 87.4 1.90Naquada 80 127.1 5.16 111.2 4.16 87.5 1.32Gizeh 100 128.7 6.92 113.6 5.15 88.3 1.41Kerma 86 129.0 6.58 112.9 4.84 87.6 1.48Early Nubia 78 127.3 5.44 111.3 4.33 87.5 1.44Recent Nubia 43 128.0 5.54 112.1 3.87 87.7 2.07Morocco 19 128.0 4.88 111.5 4.03 87.1 1.40West Africa 34 126.6 6.80 110.8 5.33 87.5 2.20Nigeria-1 79 128.5 5.70 112.9 4.52 87.9 1.76Nigeria-2 73 126.4 6.58 110.5 5.13 87.5 1.77Gabon 73 127.6 6.63 111.7 4.65 87.6 1.73Congo 15 126.2 3.93 109.0 3.80 86.4 1.26Somalia 61 130.9 6.66 113.8 4.95 87.0 1.54Kenya 75 128.4 5.74 111.7 4.88 87.0 1.61Tanzania 55 128.6 6.35 111.0 4.45 86.4 1.89Uganda 19 128.4 4.88 111.2 4.26 86.6 1.49Malawi 42 130.1 6.80 113.1 5.30 86.9 1.66South Africa 57 131.6 5.92 114.4 4.60 87.0 1.62Khoi-San 30 128.6 6.44 111.1 5.23 86.4 1.741 M26, sagittal frontal arc.2 M29, sagittal frontal chord.3 (M29/M26) p 100, sagittal frontal index.
115FRONTAL AND FACIAL FLATNESS

TABLE 5. Frontal measurements (in mm) and indices
Sample name N
Chord Subtense Index
Mean S.D. Mean S.D. Mean S.D.
Japanese 138 96.2 3.92 15.3 2.28 15.9 2.17Ainu 35 100.0 3.62 17.9 2.29 17.9 1.98Jomonese 31 101.7 3.18 16.2 3.35 15.9 3.13Northern Chinese 56 96.0 3.65 15.2 2.12 15.8 1.92Southern Chinese 66 96.3 3.88 14.4 2.39 15.0 2.17Koreans 26 95.7 3.89 14.8 2.22 15.5 2.21Mongolians 33 97.3 3.68 13.8 2.32 14.1 2.19Northeast Asians 17 96.9 3.59 13.6 3.02 13.9 2.78Chukchis 12 101.3 3.48 15.0 2.24 14.8 2.12Vietnamese 24 96.8 3.70 15.9 2.77 16.4 2.57Laos-Cambodia 43 96.8 3.18 16.1 1.96 16.6 1.87Thailand 30 96.9 3.13 15.4 1.81 15.9 1.83Myanmar 102 97.6 3.67 17.2 2.32 17.6 2.37Malay 51 96.5 3.61 16.5 2.21 17.1 2.17Early-SE Asians 14 98.3 5.23 16.1 2.83 16.4 2.62Sumatra 13 96.9 3.91 17.5 1.97 18.0 1.87Javanese 62 98.0 3.72 16.8 2.19 17.2 2.06Borneans 72 96.9 3.80 16.4 2.31 16.9 2.26Filipinos 76 97.3 3.89 16.2 1.80 16.6 1.59Celebes-Molucca 28 96.1 3.50 16.0 2.36 16.7 2.21Lesser Sunda 13 98.0 5.88 17.7 2.08 18.0 1.65Andamanese 48 92.6 3.29 17.2 2.13 18.5 2.14Nicobarese 18 95.5 3.63 15.1 2.26 15.8 2.25Negritos 18 94.4 4.09 15.0 1.84 15.9 1.77Eskimos 77 99.1 3.03 14.8 2.43 14.9 2.34Subarctic 23 99.9 4.70 19.3 2.64 19.3 2.18Northwest America 52 100.6 4.82 18.5 2.46 18.4 2.37California 42 98.1 3.81 17.6 2.88 18.0 3.00East America 24 101.2 3.62 19.3 2.42 19.1 2.37Mesoamerica 30 97.9 4.37 17.0 3.26 17.3 3.15Caribians 21 99.8 3.43 18.8 2.76 18.8 2.65Peruvians 92 97.1 3.17 17.9 1.94 18.5 1.87Fuegian-Patagonian 40 101.7 3.47 18.1 2.25 17.9 2.19Mariana 24 98.1 3.14 16.3 2.49 16.6 2.41Caroline 10 98.2 3.04 17.5 3.04 17.8 2.93Hawaii 72 97.4 3.76 16.1 2.37 16.5 2.20Easter 59 98.2 3.30 17.9 2.35 18.2 2.20Marquesas 57 98.3 3.70 16.9 2.51 17.2 2.33Society 43 97.4 3.61 17.1 2.32 17.6 2.35Cook 15 99.9 2.98 17.7 2.77 17.7 2.67Tonga-Samoa 14 100.1 4.75 18.1 2.55 18.0 2.17Maori 109 98.3 4.10 16.8 2.26 17.1 2.12Moriori 70 98.2 3.19 17.7 2.33 18.0 2.27Fiji 32 97.5 4.00 17.6 2.49 18.1 2.28New Britain 57 100.6 3.44 16.6 2.42 16.5 2.27Vanuatu 25 100.5 4.06 19.6 2.83 19.4 2.58New Caledonia 38 99.2 4.55 17.8 2.68 17.9 2.37New Ireland 27 99.2 3.64 18.9 2.58 19.0 2.79Santa Cruz 16 98.9 2.58 19.9 1.58 20.2 1.37Solomon 57 97.8 3.84 18.1 2.56 18.5 2.45Papua New Guinea 156 96.4 3.86 18.3 2.67 18.9 2.71Torres Strait 60 101.3 3.56 18.9 2.65 18.7 2.37New South Wales 55 101.5 4.00 19.2 2.70 18.9 2.46South Australia 124 101.8 3.71 19.7 2.66 19.3 2.43Murray River 30 101.1 5.06 19.4 2.64 19.3 2.27Queensland 20 101.8 3.44 19.4 2.06 19.1 1.99Western Australia 21 102.1 4.33 19.1 2.94 18.6 2.60Tasmania 11 100.3 3.97 18.4 3.25 18.3 2.76Nepalese 31 96.0 2.74 19.3 2.65 20.1 2.79Tibetans 57 96.6 3.77 17.0 2.28 17.6 2.38Bangladesh-Bhutan 27 96.1 4.25 19.4 3.12 20.1 2.79Assam-Sikkim 40 96.8 3.77 16.2 2.67 16.7 2.65Bengal-Bihar 78 94.9 3.88 18.8 2.19 19.8 2.09Punjab 71 96.6 3.94 19.9 2.74 20.6 2.59Delhi-NW India 32 95.6 3.81 18.4 2.67 19.2 2.56Madras 100 95.5 3.64 18.8 2.39 19.7 2.25Veddah 16 92.7 4.35 19.3 2.55 20.8 2.34Afghanistan 38 97.9 4.42 19.7 2.34 20.1 2.05
(continued)
116 T. HANIHARA

possible exception of the Eskimo sample, theNew World samples show a less flattendfronto-orbital region, comparable to the Aus-tralian and the Melanesian samples. In thewestern hemisphere of the Old World, nosignificant difference in the degree of fronto-orbital flatness can be detected, showingprojecting faces.
The overall range of variation for thesimotic index is relatively large (Table 6 andFig. 5). The subSaharan African sampleshave very flat nasals, especially the Khoi-San sample. Of all the samples examined,the European samples show the highestnasals, followed by the Indian subcontinentsamples, the Oceanian samples, and very
significantly, the New World samples andthe Ainu sample from Japan. As is wellknown, the nasal form of Eskimos and, to alesser extent, Chukchis shows what hasbeen referred to as ‘‘pinched nasalia,’’ acondition which is characterized by a nar-row nasal chord and high subtense (Table 6).
As in the case of the frontal index, thenortheast Asian samples and to a lesserdegree the east Asian samples show thesmallest mean values of the zygomaxillaryindex, indicating the flattest faces in themidfacial region (Fig. 6). The Australian andthe Melanesian samples exhibit, on average,a high value of the zygomaxillary index,followed by the samples from the western
TABLE 5. (continued)
Sample name N
Chord Subtense Index
Mean S.D. Mean S.D. Mean S.D.
Palestine 91 96.5 3.39 18.3 2.42 19.0 2.40Turkey 22 99.9 2.93 17.7 2.79 17.7 2.71Cyprus 18 97.2 4.44 18.0 3.51 18.5 3.27Greece 33 97.5 3.83 18.4 2.97 18.9 2.59Ancient Greece 17 96.9 3.23 18.5 3.14 19.1 2.94Italian 100 98.2 3.21 19.2 2.40 19.5 2.30Ancient Italian 36 98.7 4.57 19.4 2.34 19.6 1.94Russian 43 98.4 3.81 19.3 2.86 19.5 2.42Hungary 21 96.8 3.83 18.4 2.91 19.0 2.69Czechoslovakia 55 97.8 3.28 18.5 2.56 18.8 2.37Finland 24 100.3 4.08 18.6 2.97 18.5 2.80Norway 19 97.9 2.95 18.4 1.67 18.8 1.69Sweden 31 98.9 3.88 19.3 2.36 19.5 2.35Lapp 27 97.0 4.34 16.3 2.32 16.8 2.26Holland 35 98.5 3.96 18.4 2.85 18.7 2.47German 53 99.1 3.81 19.5 2.60 19.7 2.38French 60 96.9 3.88 18.3 2.59 18.9 2.47Ancient French 23 99.5 4.23 17.8 2.10 17.8 1.74Spain 25 96.3 4.28 19.5 2.50 20.2 2.39Ensay 67 97.6 3.78 17.6 2.10 18.1 2.02Repton 41 99.3 3.96 17.9 2.61 18.0 2.36Poundbury 100 99.7 3.69 18.1 2.19 18.2 1.96Spitalfields-1 73 95.4 3.66 18.7 2.22 19.6 2.14Spitalfields-2 57 98.8 3.88 18.4 2.08 18.6 1.94Neolithic UK 20 97.7 3.90 18.7 3.04 19.1 3.04Badari 38 93.9 2.89 16.9 2.36 18.0 2.28Naquada 80 95.5 3.78 18.4 2.43 19.3 2.24Gizeh 100 96.0 3.69 18.8 2.38 19.5 2.23Kerma 84 97.0 3.36 18.3 2.31 18.9 2.52Early Nubia 78 95.8 3.71 18.7 2.47 19.5 2.37Recent Nubia 43 95.9 3.81 18.2 2.25 18.9 2.11Morocco 19 98.1 4.41 18.5 2.60 18.8 2.36Western Africa 34 100.5 3.61 19.3 2.12 19.2 1.94Nigeria-1 77 101.9 3.72 19.1 2.47 18.7 2.20Nigeria-2 71 99.7 3.65 18.1 2.26 18.2 2.12Gabon 72 99.6 3.92 18.4 2.53 18.4 2.25Congo 15 98.0 5.30 18.1 2.76 18.5 2.77Somalia 59 95.8 3.96 18.9 2.30 19.7 2.13Kenya 70 99.0 3.72 17.8 2.48 17.9 2.28Tanzania 50 99.8 4.04 18.3 3.03 18.3 2.81Uganda 20 99.0 3.92 18.6 2.07 18.8 2.03Malawi 38 99.7 3.71 17.8 2.28 17.8 2.17South Africa 56 102.4 4.43 19.1 2.60 18.6 2.36Khoi-San 29 96.2 3.33 16.0 2.63 16.7 2.56
117FRONTAL AND FACIAL FLATNESS

TABLE 6. Simotic measurements (in mm) and indices
Sample name N
Chord Subtense Index
Mean S.D. Mean S.D. Mean S.D.
Japanese 136 6.9 2.01 2.2 0.95 32.9 12.53Ainu 34 8.5 1.79 3.8 0.95 44.9 10.61Jomonese 30 9.7 1.95 4.0 1.25 41.4 9.23Northern Chinese 55 7.2 1.59 2.5 1.01 34.8 12.13Southern Chinese 66 7.5 1.90 2.1 0.95 28.2 10.97Koreans 26 7.6 1.78 2.3 0.94 30.8 13.02Mongolians 33 6.9 1.56 2.4 0.75 35.6 8.99Northeast Asians 17 7.3 2.13 1.8 1.02 24.4 13.60Chukchis 12 6.3 2.15 2.7 1.14 44.1 12.59Vietnamese 24 8.1 1.98 2.3 0.75 29.2 10.39Laos-Cambodia 42 8.1 1.63 2.3 0.76 27.9 7.59Thailand 30 8.0 1.52 2.8 0.87 35.3 10.13Myanmar 102 8.5 1.75 3.0 1.02 35.5 10.41Malay 51 7.9 1.64 2.9 0.94 36.4 10.54Early-SE Asians 14 8.9 2.16 2.5 0.76 29.1 7.52Sumatra 13 8.8 2.34 2.8 1.25 32.0 11.27Javanese 61 8.5 1.83 2.8 1.00 33.8 10.53Borneans 73 8.0 1.83 2.3 0.84 29.2 9.59Filipinos 75 8.4 2.11 2.7 1.04 32.3 9.60Celebes-Molucca 28 8.6 1.95 2.8 0.71 32.8 6.23Lesser Sunda 13 8.5 1.73 3.2 0.90 38.1 10.36Andamanese 47 9.1 2.14 2.6 1.04 27.4 8.96Nicobarese 17 8.9 1.49 2.7 0.96 30.3 11.02Negritos 18 8.2 1.87 2.2 1.01 27.9 10.80Eskimos 75 5.5 1.77 2.6 0.84 47.8 11.27Subarctic 22 8.4 2.14 3.9 1.16 46.4 9.37Northwest America 52 8.9 1.88 3.5 1.09 39.2 10.61California 43 8.9 1.73 3.3 0.87 37.5 9.67East America 26 9.1 2.01 4.3 0.97 47.6 10.88Mesoamerica 33 9.5 1.57 3.6 0.97 38.0 8.70Caribians 20 9.3 1.89 3.8 1.01 41.5 9.19Peruvians 91 9.4 1.62 4.0 0.88 43.1 10.44Fuegian-Patagonian 38 8.1 1.56 3.6 0.95 45.6 11.21Mariana 23 9.0 2.02 2.8 1.04 31.8 10.09Caroline 9 7.8 1.28 2.7 1.14 34.6 13.28Hawaii 71 7.2 1.62 2.5 0.91 34.6 11.72Easter 64 7.6 1.59 3.2 0.86 41.7 8.60Marquesas 57 7.1 1.71 2.9 0.93 41.2 10.13Society 44 7.6 1.33 3.1 0.89 41.1 11.03Cook 12 8.1 2.01 3.1 0.96 39.6 11.27Tonga-Samoa 13 8.0 1.48 3.6 0.71 45.6 10.24Maori 109 6.9 1.45 2.9 0.94 41.7 12.02Moriori 68 6.7 1.41 2.6 0.84 38.5 9.97Fiji 30 8.1 2.16 3.4 1.13 42.7 10.75New Britain 58 8.2 1.96 2.7 1.05 33.5 12.33Vanuatu 24 8.2 1.79 3.3 0.76 41.1 11.10New Caledonia 34 9.2 2.21 3.1 0.93 34.1 9.91New Ireland 25 7.4 2.18 3.4 0.94 46.8 12.23Santa Cruz 16 8.1 1.31 3.4 1.14 41.8 13.01Solomon 57 7.8 1.79 3.4 1.06 42.9 10.45Papua New Guinea 154 8.4 1.82 3.3 0.93 40.3 11.70Torres Strait 59 8.9 1.88 3.7 1.01 42.0 11.28New South Wales 54 9.3 1.98 3.8 0.86 42.3 12.38South Australia 98 9.9 1.77 4.0 0.95 41.5 9.11Murray River 17 9.3 2.30 3.5 1.04 38.2 11.62Queensland 19 10.0 2.37 3.6 0.86 37.3 10.29Western Australia 21 9.6 2.16 4.1 0.91 44.2 10.57Tasmania 12 8.0 1.45 3.7 1.30 44.6 11.52Nepalese 31 8.5 1.96 3.7 1.24 42.8 11.47Tibetans 56 7.3 1.78 2.7 0.88 38.0 11.46Bangladesh-Bhutan 27 8.6 1.98 3.6 0.97 42.8 9.99Assam-Sikkim 39 7.6 1.76 2.5 1.04 32.9 12.17Bengal-Bihar 77 8.4 1.66 3.5 0.90 42.3 10.89Punjab 72 9.0 1.80 4.0 1.10 45.1 10.86Delhi-NW India 32 8.5 1.63 3.5 1.14 42.3 13.20Madras 100 8.6 1.71 3.5 0.98 40.6 10.13Veddah 16 8.2 1.63 3.2 0.64 39.7 7.01Afghanistan 37 9.7 1.93 4.3 1.14 44.9 10.57
(continued)
118 T. HANIHARA
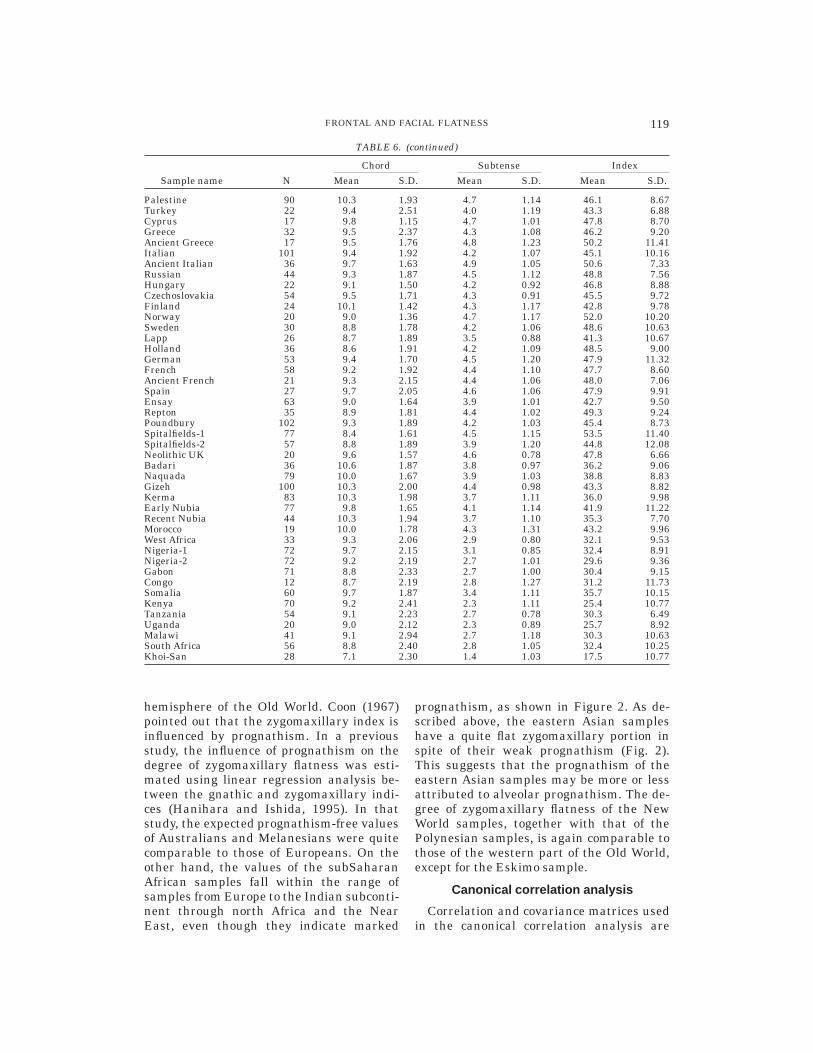
hemisphere of the Old World. Coon (1967)pointed out that the zygomaxillary index isinfluenced by prognathism. In a previousstudy, the influence of prognathism on thedegree of zygomaxillary flatness was esti-mated using linear regression analysis be-tween the gnathic and zygomaxillary indi-ces (Hanihara and Ishida, 1995). In thatstudy, the expected prognathism-free valuesof Australians and Melanesians were quitecomparable to those of Europeans. On theother hand, the values of the subSaharanAfrican samples fall within the range ofsamples from Europe to the Indian subconti-nent through north Africa and the NearEast, even though they indicate marked
prognathism, as shown in Figure 2. As de-scribed above, the eastern Asian sampleshave a quite flat zygomaxillary portion inspite of their weak prognathism (Fig. 2).This suggests that the prognathism of theeastern Asian samples may be more or lessattributed to alveolar prognathism. The de-gree of zygomaxillary flatness of the NewWorld samples, together with that of thePolynesian samples, is again comparable tothose of the western part of the Old World,except for the Eskimo sample.
Canonical correlation analysis
Correlation and covariance matrices usedin the canonical correlation analysis are
TABLE 6. (continued)
Sample name N
Chord Subtense Index
Mean S.D. Mean S.D. Mean S.D.
Palestine 90 10.3 1.93 4.7 1.14 46.1 8.67Turkey 22 9.4 2.51 4.0 1.19 43.3 6.88Cyprus 17 9.8 1.15 4.7 1.01 47.8 8.70Greece 32 9.5 2.37 4.3 1.08 46.2 9.20Ancient Greece 17 9.5 1.76 4.8 1.23 50.2 11.41Italian 101 9.4 1.92 4.2 1.07 45.1 10.16Ancient Italian 36 9.7 1.63 4.9 1.05 50.6 7.33Russian 44 9.3 1.87 4.5 1.12 48.8 7.56Hungary 22 9.1 1.50 4.2 0.92 46.8 8.88Czechoslovakia 54 9.5 1.71 4.3 0.91 45.5 9.72Finland 24 10.1 1.42 4.3 1.17 42.8 9.78Norway 20 9.0 1.36 4.7 1.17 52.0 10.20Sweden 30 8.8 1.78 4.2 1.06 48.6 10.63Lapp 26 8.7 1.89 3.5 0.88 41.3 10.67Holland 36 8.6 1.91 4.2 1.09 48.5 9.00German 53 9.4 1.70 4.5 1.20 47.9 11.32French 58 9.2 1.92 4.4 1.10 47.7 8.60Ancient French 21 9.3 2.15 4.4 1.06 48.0 7.06Spain 27 9.7 2.05 4.6 1.06 47.9 9.91Ensay 63 9.0 1.64 3.9 1.01 42.7 9.50Repton 35 8.9 1.81 4.4 1.02 49.3 9.24Poundbury 102 9.3 1.89 4.2 1.03 45.4 8.73Spitalfields-1 77 8.4 1.61 4.5 1.15 53.5 11.40Spitalfields-2 57 8.8 1.89 3.9 1.20 44.8 12.08Neolithic UK 20 9.6 1.57 4.6 0.78 47.8 6.66Badari 36 10.6 1.87 3.8 0.97 36.2 9.06Naquada 79 10.0 1.67 3.9 1.03 38.8 8.83Gizeh 100 10.3 2.00 4.4 0.98 43.3 8.82Kerma 83 10.3 1.98 3.7 1.11 36.0 9.98Early Nubia 77 9.8 1.65 4.1 1.14 41.9 11.22Recent Nubia 44 10.3 1.94 3.7 1.10 35.3 7.70Morocco 19 10.0 1.78 4.3 1.31 43.2 9.96West Africa 33 9.3 2.06 2.9 0.80 32.1 9.53Nigeria-1 72 9.7 2.15 3.1 0.85 32.4 8.91Nigeria-2 72 9.2 2.19 2.7 1.01 29.6 9.36Gabon 71 8.8 2.33 2.7 1.00 30.4 9.15Congo 12 8.7 2.19 2.8 1.27 31.2 11.73Somalia 60 9.7 1.87 3.4 1.11 35.7 10.15Kenya 70 9.2 2.41 2.3 1.11 25.4 10.77Tanzania 54 9.1 2.23 2.7 0.78 30.3 6.49Uganda 20 9.0 2.12 2.3 0.89 25.7 8.92Malawi 41 9.1 2.94 2.7 1.18 30.3 10.63South Africa 56 8.8 2.40 2.8 1.05 32.4 10.25Khoi-San 28 7.1 2.30 1.4 1.03 17.5 10.77
119FRONTAL AND FACIAL FLATNESS

TABLE 7. Zygomaxillary measurements (in mm) and indices
Sample name N
Chord Subtense Index
Mean S.D. Mean S.D. Mean S.D.
Japanese 133 98.1 5.01 22.8 2.81 23.2 2.89Ainu 35 101.9 5.05 22.5 2.47 22.1 2.18Jomonese 24 100.2 4.95 22.2 2.90 22.2 2.89Northern Chinese 55 98.1 4.12 22.0 3.33 22.4 3.21Southern Chinese 63 98.6 4.82 21.1 3.06 21.4 2.93Koreans 25 99.4 4.49 20.2 3.04 20.3 2.99Mongolians 31 100.8 3.86 18.7 2.69 18.5 2.44Northeast Asians 17 96.8 5.85 18.5 2.96 19.1 3.09Chukchis 12 99.6 5.14 20.0 2.62 20.0 2.48Vietnamese 22 100.5 4.02 22.0 3.57 21.8 3.37Laos-Cambodia 43 99.8 4.86 21.7 2.73 21.8 2.80Thailand 30 100.6 4.66 22.0 2.71 21.9 2.44Myanmar 97 99.4 5.38 22.2 2.78 22.4 2.88Malay 49 98.1 4.67 22.6 2.92 23.0 2.99Early-SE Asians 10 99.2 7.93 21.3 2.56 21.6 3.67Sumatra 13 99.6 5.06 21.4 1.74 21.5 2.12Javanese 59 100.9 4.63 22.3 2.83 22.1 2.65Borneans 69 99.0 5.07 22.5 2.53 22.7 2.64Filipinos 74 99.5 5.63 21.3 2.69 21.5 2.56Celebes-Molucca 27 100.3 3.92 21.3 2.58 21.3 2.60Lesser Sunda 13 96.5 5.19 21.9 3.62 22.6 3.58Andamanese 48 95.1 4.19 23.8 2.72 25.1 2.75Nicobarese 17 99.2 4.59 22.1 3.35 22.3 2.97Negritos 18 94.8 4.29 19.3 2.35 20.3 2.14Eskimos 76 100.7 5.63 19.4 2.88 19.3 2.85Subarctic 20 100.9 5.35 23.9 3.56 23.7 3.35Northwest America 50 101.4 5.11 24.0 3.05 23.7 2.74California 38 100.3 5.95 23.2 2.79 23.2 2.74East America 19 100.2 5.99 23.7 3.19 23.8 3.88Mesoamerica 26 99.8 5.73 23.2 2.89 23.3 2.75Caribians 19 102.5 5.90 25.6 3.07 25.0 3.06Peruvians 91 98.9 4.32 24.2 2.57 24.5 2.38Fuegian-Patagonian 38 103.0 4.18 24.6 2.41 23.9 2.22Mariana 21 100.2 5.18 20.7 3.58 20.6 3.08Caroline 11 98.1 2.89 23.8 3.07 24.3 3.29Hawaii 72 96.5 5.20 24.2 2.58 25.1 2.53Easter 54 97.4 4.88 25.4 3.25 26.1 2.96Marquesas 57 99.0 4.52 25.1 2.93 25.4 2.69Society 42 95.9 5.25 24.8 3.44 25.9 3.46Cook 13 99.1 4.85 23.2 3.67 23.5 3.82Tonga-Samoa 12 100.6 6.89 24.6 2.86 24.4 2.36Maori 108 97.3 5.82 25.7 2.88 26.5 2.80Moriori 67 97.5 4.47 26.8 3.04 27.4 2.87Fiji 28 96.0 4.58 26.0 2.46 27.1 2.52New Britain 56 96.5 4.31 25.6 2.91 26.5 2.74Vanuatu 24 96.8 3.94 25.9 2.90 26.8 3.27New Caledonia 35 98.5 5.64 25.8 2.86 26.2 2.50New Ireland 24 95.8 4.91 26.4 3.21 27.6 3.87Santa Cruz 16 96.0 2.96 29.0 3.23 30.2 3.08Solomon 53 96.4 5.08 25.7 3.17 26.7 3.03Papua New Guinea 152 95.3 5.00 26.5 3.21 27.8 3.68Torres Strait 58 97.4 5.09 26.6 2.88 27.3 2.88New South Wales 50 95.3 4.92 25.0 2.46 26.2 2.78South Australia 92 96.6 5.02 26.0 3.11 27.0 3.12Murray River 23 95.4 4.53 24.6 2.16 25.8 2.50Queensland 19 94.7 5.94 23.4 2.68 24.8 3.43Western Australia 20 95.1 5.08 26.3 2.60 27.7 2.54Tasmania 10 95.2 5.66 27.3 3.18 28.7 3.50Nepalese 31 95.7 4.69 22.8 3.34 23.9 3.65Tibetans 56 97.9 5.36 21.4 2.48 21.9 2.73Bangladesh-Bhutan 27 94.1 5.11 24.0 2.87 25.5 2.75Assam-Sikkim 40 97.8 5.48 22.4 2.79 22.9 3.00Bengal-Bihar 76 93.8 4.44 23.6 2.84 25.2 3.01Punjab 72 94.4 4.91 24.7 2.98 26.2 2.98Delhi-NW India 31 94.2 4.90 22.7 2.59 24.1 2.68Madras 96 93.8 5.10 23.3 2.95 24.9 3.00Veddah 15 90.1 5.08 22.6 3.66 25.1 3.55
(continued)
120 T. HANIHARA

based on the combined sum of squares cal-culated separately in the 112 populationsamples. Table 8 gives the basic resultsof this canonical correlation analysis, us-ing the first variable group (glabellar,gnathic, and sagittal frontal indices) and aset of transverse flatness measurements ofthe face (second variable group). The canoni-cal correlation of the first factor is statisti-cally significant (chi-square 5 16.975;P , 0.05), but not so in the second and thirdfactors.
The standardized coefficients for the vari-ables of the first factor indicate the relation-
ship between the prominence of the infra-glabellar notch, prognathism, and frontalflatness in the sagittal plane and fronto-orbital flatness and, to a lesser extent, nasalflatness. The plots of the samples on the firstcanonical variates, based on the scores ofthe canonical variables in each sample, arepresented in Figures 7a,b. The first variablegroup (Fig. 7a) opposes the Australian/Melanesian samples to the east/northeastAsian samples. The positive, or Australian/Melanesian end, reflects a relatively promi-nent infraglabellar notch and marked prog-nathism with a sagittally flat frontal bone.
TABLE 7. (continued)
Sample name N
Chord Subtense Index
Mean S.D. Mean S.D. Mean S.D.
Afghanistan 38 95.0 5.21 24.5 3.00 25.8 2.98Palestine 83 94.8 4.78 23.8 2.69 25.1 2.77Turkey 20 96.7 4.61 22.9 3.39 23.7 3.31Cyprus 17 94.8 4.36 22.9 2.65 24.2 2.86Greece 30 93.9 5.72 23.6 3.14 25.2 3.00Ancient Greece 16 94.7 3.92 22.4 3.42 23.7 3.80Italian 99 93.7 5.15 23.9 2.55 25.6 2.76Ancient Italian 33 94.2 4.87 22.8 2.58 24.2 2.69Russian 42 94.1 6.62 23.3 2.58 24.9 3.13Hungary 21 92.7 4.58 22.6 1.48 24.4 1.95Czechoslovakia 55 93.2 4.85 22.8 2.93 24.5 2.91Finland 24 97.9 4.69 23.6 2.29 24.1 2.26Norwegian 18 93.6 5.20 24.8 1.60 26.5 1.37Sweden 29 94.9 6.14 23.3 3.66 24.5 3.54Lapp 26 94.6 5.39 21.7 2.75 22.9 2.40Holland 35 92.0 4.87 23.0 2.66 25.0 2.34German 52 94.0 3.89 23.5 3.24 24.9 3.46French 55 92.3 5.69 22.9 2.33 24.8 2.56Ancient French 18 96.5 7.47 22.7 3.73 23.5 2.88Spain 23 94.1 5.86 24.8 2.58 26.4 2.60Ensay 64 92.9 4.23 23.2 2.73 25.0 2.53Repton 30 94.0 4.75 23.6 2.81 25.1 2.61Poundbury 94 94.3 5.25 23.3 3.12 24.7 2.95Spitalfields-1 72 88.4 4.87 22.4 2.22 25.3 2.24Spitalfields-2 57 94.3 4.40 22.7 1.92 24.1 2.21Neolithic UK 12 92.7 3.99 23.6 2.98 25.4 3.08Badari 36 93.3 5.05 22.9 3.26 24.5 2.92Naquada 76 94.7 4.89 23.2 2.75 24.5 2.57Gizeh 100 93.8 4.78 23.3 2.57 24.8 2.60Kerma 82 95.7 4.70 21.3 3.67 22.5 3.24Early Nubia 76 93.9 4.73 23.0 2.48 24.5 2.43Recent Nubia 37 94.8 4.74 23.1 2.79 24.4 2.83Morocco 18 93.0 6.33 21.0 2.71 22.6 2.82West Africa 34 98.0 5.62 23.5 2.46 24.0 2.55Nigeria-1 69 98.5 4.47 21.4 2.40 21.7 2.24Nigeria-2 70 96.5 4.16 23.2 2.64 24.0 2.93Gabon 72 96.4 4.44 24.5 2.71 25.4 2.91Congo 13 95.6 5.30 24.6 2.70 25.9 3.27Somalia 50 92.8 5.19 22.2 3.14 23.9 3.13Kenya 62 97.2 5.16 21.4 3.07 22.0 3.11Tanzania 47 95.8 5.22 24.5 3.06 25.5 2.88Uganda 17 95.8 5.14 23.2 3.66 24.2 3.81Malawi 32 96.8 5.21 23.3 2.47 24.1 2.76South Africa 53 97.5 4.71 23.9 3.02 24.6 3.10Khoi-San 28 92.2 5.30 20.7 2.99 22.4 2.77
121FRONTAL AND FACIAL FLATNESS

Fig. 1. Graphic display of regional variation in the depth of the infraglabellar notch evaluated byM1/M1d. The order of squares corresponds to the sample number given in Table 1.
122 T. HANIHARA

Some of subSaharan African samples areplotted on the positive or Australian/Mel-anesian side. On the other hand, the Euro-pean samples, together with the north Afri-
can, west Asian, and Indian subcontinentsamples, are scattered on the opposed side.Figure 7b indicates the magnitude of theprojection of midfacial region in the trans-
Fig. 2. Graphic display of regional variation in prognathism (M40/M5).
123FRONTAL AND FACIAL FLATNESS

verse plane without prognathism. The posi-tive end, reflecting flat fronto-orbital andnasal portions, signals a decided easternAsian and Pacific configuration together
with some subSaharan African samples. Thedegree of facial projection of some NewWorld samples and Australian samples iscomparable to those of samples from south
Fig. 3. Graphic display of regional variation in sagittal frontal flatness tentatively measured by M29/M26.
124 T. HANIHARA

Asia to Europe through west Asia and northAfrica.
DISCUSSION
The results presented herein suggest thatthe features relating to frontal and facialflatness are largely confined to populationsfrom differing world regions: 1) the consider-
able flatness of the faces of east/northeastAsians, and to a lesser extent, of southeastAsians; 2) morphological complexes such asa deep infraglabellar notch and sagittallyflat frontal bone with facial prognathism inAustralians and Melanesians; 3) roundedforehead comparable to that in northeastAsians and transversely projecting faces as
Fig. 4. Graphic display of regional variation in the frontal index of facial flatness measurements.
125FRONTAL AND FACIAL FLATNESS

in Europeans found in the New World popu-lations; 4) eastern Asian-like features inPolynesians and Micronesians, except for aprojecting zygomaxillary region; 5) mid-facial projection without prognathism in Eu-ropeans and related populations such assouth and west Asians as well as northAfricans; and 6) remarkable prognathism
and very flat nasal bones in SubSaharanAfricans.
East/northeast Asians are quite differentfrom other geographical populations in theirfront-orbital and zygomaxillary indices. Thisis consistent with the fact that they exhibit amore horizontally oriented zygomatic bone,characterized by a more acute and anteri-
Fig. 5. Graphic display of regional variation in the simotic index of facial flatness measurements.
126 T. HANIHARA

orly situated zygomaxillary angle. The facesof Asian fossil hominids also show the samecharacteristics and contrast markedly witha good number of European and Africancontemporaries (Weidenreich, 1943; Coon,1967; Wolpoff, 1985, 1989, 1992; Wu and Wu,1985; Wu and Zhang, 1985; Smith et al.,1989; Pope, 1991). InAustralasia, the distinc-
tive characteristics of Australians amongcurrent human populations, and the firmlinks between the middle and late Pleis-tocene fossil hominids in this region andliving Australians, have been emphasizedwith features that include a deep infraglabel-lar notch, marked prognathism, and a flatforehead (Weidenreich, 1951; Larnach and
Fig. 6. Graphic display of regional variation in the zygomaxillary index of facial flatness measurements.
127FRONTAL AND FACIAL FLATNESS

Macintosh, 1974; Jacob, 1976; Pope, 1988;Wolpoff, 1992).
The results obtained in the univariateanalysis generally fit the definition of ‘‘re-gional character’’ in eastern Asia and Oce-ania proposed by Wolpoff (1980, 1985, 1989,1992), Thorne and Wolpoff (1981), Wolpoff etal. (1984), and others in their multiregionalhypothesis for the origin of anatomicallymodern humans.
If, on the other hand, a single origin formodern humans in subSaharan Africa isassumed, how can the regional morphologi-cal variation be explained? Lahr (1996), inher excellent study of craniofacial features,pointed out that early anatomically modernhumans as represented at Klasies RiverMouth, and by Florisbad, Skhul 5, Qafzeh 9,and other late Pleistocene fossil crania, pre-sent a morphological pattern characterizedby features such as a deep infraglabellarnotch, facial prognathism, and a flat frontalbone in the sagittal plane. The flat faces are,moreover, regarded as a generalized charac-ter in anatomically modern humans, basedon the fact that a transversely flat faceoccurred commonly in not only middle Pleis-tocene hominids but also in late Pleistoceneanatomically modern humans (Bulbeck,1981; Groves, 1989; Habgood, 1989, 1992;Smith and Paquette, 1989; Stringer, 1989,1992).
Stringer (1989) provides naso-frontal andzygomaxillary angles defined by Howells(1973) for a series of cranial samples fromthe late Pleistocene. Figure 8 illustrates thefronto-orbital and zygomaxillary indices ofthe samples used in the present study, to-gether with several late Pleistocene fossilremains reported by Stringer (1989). Thelate Pleistocene anatomically modern
samples show generally flat faces, compa-rable to present eastern Asian samples in atleast fronto-orbital flatness. Moreover, thevariation of facial flatness in anatomicallymodern humans in the late Pleistocene fallswithin the range of facial flatness in currenthuman groups from around the world.
The results obtained from canonical corre-lation analysis indicate that two differentanatomical circumstances can be recognizedin crania with deep infraglabellar notches,sagittally flat frontal bones, and markedprognathism: transversely flat faces and pro-jecting ones. As described above, the propor-tion of frontal and facial flatness in the latePleistocene among anatomically modern hu-mans roughly combines a deep infraglabel-lar notch, sagittally flat frontal bones, andmarked prognathism with more or less flatfaces. Taking this into consideration, it maybe possible to interpret the frontal and facialform of Australians as presenting both gen-eralized and specialized features. In a cladis-tic sense, the distinctive anatomical combi-nation seen in Australian cranial series doesnot retain a plesiomorphic state. Statedanother way (Lahr and Wright, 1996), Aus-tralian faces do not reflect the retention ofancestral traits. At the same time, it may bepossible to regard east/northeast Asians ashaving specialized craniofacial features, be-cause of their considerably flat faces withouta deep infraglabellar notch, sagittally flatfrontals, and prognathism.
Several investigators regard the flat facesof current northeast Asians as the result ofcold adaptation and/or biomechanical effi-ciency (Coon et al., 1950; Brues, 1977;Hylander, 1977; Szathmary, 1984; Rak, 1986;Smith and Paquette, 1989; Pope, 1991;Ishida, 1992). Some subSaharan Africanshave, on the other hand, high canonicalscores in both the first and second canonicalvariates. Except possibly for the graciliza-tion of the infraglabellar region, therefore,cranial series of some subSaharan Africans,e.g., Congolese, Tanzanians, and others,show the remnants of generalized features,suggesting the occurrence of gracilizationwithout marked intensification of special-ized features. At the same time, the possibleoutliers of the predominant eastern Asiansand their derived populations, such as the
TABLE 8. Canonical correlation coefficientsand canonical vectors
Axis First Second Third
Canonical correlation 0.36962 0.15915 0.06535Standardized coeffi-
cients in each indexGrabellar 0.25993 1.04517 20.15985Gnathic 0.85186 20.33174 20.40914Frontal-sagittal 20.34729 0.38572 20.95583Frontal 20.97032 20.37676 20.01051Simotic 20.28632 0.84430 20.49207Zygomaxillar 0.50407 20.49963 20.78118
128 T. HANIHARA

Nicobarese and Tasmanians, do not showany distinctive morphological differentia-tion from the expected generalized or thesubSaharan African form. According to Lahr(1995), it is possible that these peripheralgroups maintained, at least in part, theirdistinctiveness because of limited gene flowfrom neighboring groups, which would haveallowed the retention of certain morphologi-cal traits.
The results in this study are consistentwith the definition of ‘‘regional characters’’summarized by Wolpoff (1992). However, ina cladistic sense, it may also be possible toexplain regional morphological variation infrontal and facial flatness under the assump-tion of a single origin for anatomically mod-
TABLE 9. Scores of the first canonical variables
Population name First Second
1 Japanese 20.51534 0.965732 Ainu 20.13663 20.410833 Jomonese 20.04313 0.532954 Northern Chinese 20.61215 0.805735 Southern Chinese 20.44283 1.154976 Korean 20.54027 0.681757 Mongolians 20.49789 0.783558 Northeast Asians 20.19624 1.294939 Chukchis 20.51400 0.54450
10 Vietnamese 20.45913 0.6036311 Laos-Cambodia 0.08152 0.5488312 Thailand 0.17005 0.6512913 Myanmar 20.05769 0.0037514 Malay 0.13889 0.3032415 Early southeast Asians 0.12666 0.5822416 Sumatra 20.02390 20.2300117 Javanese 0.26509 0.1899818 Borneo 0.12446 0.5397719 Filipino 20.16207 0.3430020 Celebes-Molucca 0.33318 0.2861021 Lesser Sunda 0.00553 20.2053222 Andamanese 0.07203 0.3129623 Nicobarese 1.40590 0.9207924 Negritos 20.14795 0.5981925 Eskimo 0.29879 0.2545126 Subarctic 20.43647 20.8003227 Northwest America 0.03988 20.1869628 California 20.12198 20.0513229 East America 20.37432 20.7134830 Mesoamerica 20.28720 0.2123531 Caribians 20.08919 20.1909632 Peruvians 20.24755 20.2022033 Fuegians-Patagonians 20.23735 20.1171734 Mariana 20.49870 0.2120135 Caroline 0.35698 0.2834036 Hawaii 20.33028 0.9650337 Easter 0.00139 0.2293738 Marquesas 0.04121 0.5516739 Society 20.18568 0.4786040 Cook 20.21879 0.0370741 Tonga-Samoa 20.32261 20.0931642 Maori 20.28640 0.7845943 Moriori 20.67361 0.6606044 Fiji 0.91111 0.4522345 New Britain 1.81894 0.1267946 Vanuatu 1.55095 20.1416647 New Caledonia 1.43624 0.0609048 New Ireland 1.17431 0.0142049 Santa Cruz 1.89423 0.1337350 Solomon 0.77793 0.1988251 Torres Strait 1.57422 0.2547652 Papua New Guinea 0.92669 0.2743253 New South Wales 1.38151 20.0421854 South Australia 2.16836 20.0695555 Murray River 2.29469 20.1707856 Queensland 1.43997 20.2590157 Western Australia 1.18973 20.2615858 Tasmania 1.98920 0.5910859 Nepalese 20.31678 20.9711260 Tibet 20.41049 20.1637361 Bangladesh-Bhutan 20.52885 20.7237762 Assam-Sikkim 20.09922 0.5375563 Bengal-Bihar 20.51980 20.6324664 Punjab 20.85010 20.8614465 Delhi-NW India 20.22099 20.5581266 Madras 0.23024 20.5776167 Veddah 20.33035 20.9780768 Afghanistan 20.33998 20.71406
(continued)
TABLE 9. (continued)
Population name First Second
69 Palestine 20.60440 20.3846370 Turkey 20.60357 20.0395871 Cyprus 21.33885 20.4045172 Greece 20.72897 20.3323673 Ancient Greece 21.38628 20.8102674 Italian 20.61754 20.5071075 Ancient Italian 21.34607 20.9271976 Russian 20.70826 20.7479677 Hungary 20.39161 20.5231278 Czechoslovakia 20.20074 20.4252479 Finland 20.68235 20.2834580 Norwegian 20.77253 20.2383481 Sweden 20.75123 20.7896382 Lapp 20.22060 0.2941983 Holland 20.71893 20.3522684 German 20.53106 20.7689385 French 20.83406 20.4542286 Ancient French 20.56970 20.2513187 Spain 20.95937 20.7368888 Ensay 20.67296 0.0753989 Repton 20.41484 20.0656490 Poundbury 20.89128 20.1147891 Spitalfield-1 21.05172 20.8347892 Spitalfield-2 20.52416 20.3787193 Neolithic UK 20.66419 20.4445994 Badari 20.17757 0.1926395 Naquada 20.54847 20.4101696 Gizeh 21.30567 20.5957097 Kerma 20.41847 20.5634098 Early Nubia 20.84130 20.6003699 Recent Nubia 0.00308 20.19127
100 Morocco 20.88181 20.69076101 West Africa 0.97986 20.28247102 Nigeria-1 0.17861 20.48442103 Nigeria-2 0.82602 0.22732104 Gabon 0.60916 0.33746105 Congo 1.74754 0.36976106 Somalia 20.91061 20.63282107 Kenya 0.55730 0.08282108 Tanzania 1.56967 0.41645109 Uganda 1.07217 0.09828110 Malawi 0.74199 0.36025111 Zulu-Kaffir 0.60181 0.04403112 Khoi-San 0.43738 0.92141
129FRONTAL AND FACIAL FLATNESS

ern humans in subSaharan Africa. It isworth noting that this study is not a test ofcompeting models of modern human origins.The proper conclusion is, therefore, that the
data on recent craniofacial variation inworldwide populations are compatible withnot only a multiregional interpretation butalso a single-origin interpretation.
Fig. 7. a: Scores of the first canonical vector of the first canonical variates. b: Scores of the second canonicalvector of the first canonical variates.
130 T. HANIHARA

Fig. 7.
131FRONTAL AND FACIAL FLATNESS

Fig. 8. Scatter diagram of fronto-orbital and zygomaxillary indices of facial flatness, includingsamples from late Pleistocene fossil remains (Stringer, 1989).
132 T. HANIHARA

ACKNOWLEDGMENTS
I express my sincere gratitude for theirkind permission to study the materials un-der their care to Dr. T. Molleson, Dr. R.Kruszynski, and Dr. C. Stringer of the Natu-ral History Museum (London); Dr. R. Foleyand Dr. M. Bellatti of the Department ofBiological Anthropology, University of Cam-bridge; Professor A. Langaney and Dr. MiyaAwazu Pereira da Silva of Laboratoired’Anthropologie biologique, Musee del’Homme, Paris; Dr. J. Specht, Dr. P. Gordon,Dr. L. Bonshek, and Dr. N. Goodsell of theDepartment ofAnthropology,Australian Mu-seum, Sydney; Professor J. Stone and Dr. D.Donlon of the Department of Anatomy andHistology, the University of Sydney; Mr. D.Henley of the New South Wales AboriginalLand Council; Dr. M. Chow, a dentist inSydney; Professor M. Hanihara of the Schoolof Languages, Macquarie University; Dr. C.Pardoe and Dr. G.L. Pretty of the Depart-ment of Anthropology, South Australian Mu-seum, Adelaide; and Professor Emeritus B.Endo and T. Akazawa of the Department ofAnthropology, Faculty of Science, Universityof Tokyo. I am greatly indebted to ProfessorY. Dodo of the Department of Anatomy,Tohoku University School of Medicine, forinvaluable suggestions. This study was sup-ported in part by a Grant-in-Aid for Scien-tific Research on the Priority Area ‘‘Interdis-ciplinary Study on the Origins of JapanesePeoples and Cultures’’ headed by ProfessorK. Omoto of the International ResearchCenter for Japanese Studies (no. 10115204),a Grant-in-Aid for Scientific Research (no.09839003) from the Ministry of Education,Science and Culture of Japan, and a Japa-nese Fellowship for Research in the UK andFrance from the Japanese Society for thePromotion of Science.
LITERATURE CITED
Alekseev VP. 1979. Anthropology of Siberian peoples. In:Laughlin WW, Harper AB, editors. The first Ameri-cans: origins, affinities, and adaptations. Stuttgart:Gustav Fischer. p 57–90.
Alekseev VP, Debets GF. 1964. Craniometry. Moscow:Nauka.
Baba H. 1993. Human evolution in Asia as viewed fromfossil features. Anthropol Sci 101:465–472 [in Japa-nese].
Baba H. 1995. Diregional model of human evolution. In:Brenner S, Hanihara K, editors. The origin and past of
modern humans as viewed from DNA. Singapore:World Scientific. p 244–266.
Brauer G. 1988. Osteometrie: a. Kraniometrie. In: Knuß-mann R, editor. Anthropologie: Handbuch der Verglei-chenden Biologie des Menschen, Band I. Stuttgart:Gustav Fischer. p 160–192.
Brues AM. 1977. People and race. New York: MacmillanSeries in Physical Anthropology, Macmillan Publish-ing Co. p 1–336.
Bulbeck D. 1981. Continuities in Southeast Asian evolu-tion since the late Pleistocene: some new materialdescribed and some old questions reviewed. MA the-sis, Australian National University.Canberra, Austra-lia.
Coon CS. 1967. The origin of races. New York: Alfred A.Knopf. p 1–344.
Coon CS, Garn SM, Birdsell JB. 1950. Races: a study ofthe problems of race formation in man. Springfield,Illinois: Charles C. Thomas. p 1–153.
Debets GF. 1951. Anthropological studies in the Kam-chatka region. Trudi Instituta Etnografii 17:1–263.
Gill GW, Hughes SS, Bennett SM, Gilbert BM. 1988.Racial identification from the midfacial skeleton withspecial reference to American Indians and whites. JForensic Sci 33:92–99.
Groves CP. 1989. Regional approach to the problem ofthe origin of modern humans in Australasia. In:Mellars P, Stringer C, editors. The human revolution:behavioural and biological perspective in the originsof modern humans. Edinburgh: Edinburgh UniversityPress. p 274–285.
Habgood PJ. 1989. The origin of anatomically modernhumans in Australasia. In: Mellars P, Stringer C,editors. The human revolution: behavioural and bio-logical perspectives in the origins of modern humans.Edinburgh: Edinburgh University Press. p 245–273.
Habgood PJ. 1992. The origin of anatomically modernhumans in East Asia. In: Brauer G, Smith FH, editors.Continuity or replacement: Controversies in Homosapiens evolution. Rotterdam: A.A. Balkema. p 273–288.
Hanihara T, Ishida H. 1995. Evolutionary significance offacial flatness inAustralianAborigines and neighbour-ing populations. Perspect Hum Biol 1:85–98.
Hanihara T, Dodo Y, Kondo O, Nara T, Doi N, Sensui N.1999. Intra- and interobserver errors in facial flatnessmeasurements. Anthropol Sci 107:25–39.
Howells WW. 1973. Cranial variation in man: a study bymultivariate analysis of patterns of difference amongrecent human populations. Papers of the PeabodyMuseum no. 67. Cambridge: Peabody Museum, Har-vard University. p 1–259.
Howells WW. 1989. Skull shapes and the map: craniomet-ric analyses in the dispersion of modern Homo. Papersof the Peabody Museum no. 79. Cambridge: PeabodyMuseum, Harvard University. p 1–189.
Howells WW. 1995. Who’s who in skulls: ethnic identifi-cation of crania from measurements. Papers of thePeabody Museum no. 82. Cambridge: Peabody Mu-seum, Harvard University. p 1–108.
Hrdlicka A. 1942. Crania of Siberia. Am J Phys Anthro-pol 29:435–481.
Hylander WL. 1977. The adaptive significance of Es-kimo craniofacial morphology. In: DahlbergAA, GraberTM, editors. Orofacial growth and development. Paris:Mouton Publishers. p 129–169.
Ishida H. 1992. Flatness of facial skeletons in Siberianand other circum-Pacific populations. Z Morphol An-thropol 79:53–67.
Jacob T. 1976. Early populations in the Indonesianregion. In: Kirk RL, Thorne AG, editors. The origins ofthe Australians. Canberra: Australian Institute ofAboriginal Studies. p 81–93.
133FRONTAL AND FACIAL FLATNESS

Lahr MM. 1994. The multiregional model of modernhuman origins: a reassessment of its morphologicalbasis. J Hum Evol 26:23–56.
Lahr MM. 1995. Patterns of modern human diversifica-tion: implications for Amerindian origins. Yrbk PhysAnthropol 38:163–198.
Lahr MM. 1996. The evolution of modern human diver-sity: a study of cranial variation. Cambridge, UK:Cambridge University Press. p 1–416.
Lahr MM, Wright RVS. 1996. The question of robusticityand the relationship between cranial size and shapein Homo sapiens. J Hum Evol 31:157–191.
Larnach SL, Macintosh NWG. 1974. A comparativestudy of Solo and Australian Aboriginal crania. In:Elkin AP, Macintosh NWG, editors. Grafton ElliotSmith: the man and his work. Sydney: Sydney Univer-sity Press. p 95–102.
Oschinsky L. 1962. Facial flatness and cheekbone mor-phology in Arctic Mongoloids. Anthropol NS 4:349–377.
Pope GG. 1988. Recent advances in Far Eastern paleoan-thropology. Annu Rev Anthropol 17:43–77.
Pope GG. 1991. Evolution of the zygomaticomaxillaryregion in the genus Homo and its relevance to theorigin of modern humans. J Hum Evol 21:189–213.
Pope GG. 1992. Craniofacial evidence for the origin ofmodern humans in China. Yrbk Phys Anthropol 35:243–298.
Rak Y. 1986. The Neanderthal face: a new look at an oldface. J Hum Evol 15:151–164.
Smith FH, Paquette SP. 1989. The adaptive basis ofNeandertal facial form, with some thoughts on thenature of modern human origins. In: Trinkaus E,editor. The emergence of modern humans: bioculturaladaptations in the late Pleistocene. Cambridge, UK:Cambridge University Press. p 181–210.
Smith FH, Falsetti AB, Donnelly SM. 1989. Modernhuman origins. Yrbk Phys Anthropol 32:35–68.
Stringer CB. 1989. The origin of early modern humans:a comparison of the European and non-Europeanevidence. In: Mellars P, Stringer CB, editors. Thehuman revolution: behavioural and biological perspec-tives on the origins of modern humans. Edinburgh:Edinburgh University Press. p 232–244.
Stringer CB. 1992. Replacement, continuity and theorigin of Homo sapiens. In: Brauer G, Smith FH,editors. Continuity or replacement: controversies inHomo sapiens evolution. Rotterdam: A.A. Balkema. p9–24.
Szathmary E. 1984. Human biology of the Arctic. In:Damas D, editor. Handbook of North American Indi-
ans, volume 5, Arctic. Washington, DC: SmithsonianInstitution. p 64–71.
Thorne AG, Wolpoff MH. 1981. Regional continuity inAustralasian Pleistocene hominid evolution. Am JPhys Anthropol 55:337–349.
Trinkaus E. 1987. The Neandertal face: evolutionaryand functional perspectives on a recent hominid face.J Hum Evol 16:429–443.
Weidenreich F. 1943. The skull of Sinanthropus pekinen-sis: a comparative study on a primitive hominid skull.Palaeontol Sinica N D 10:1–484.
Weidenreich F. 1951. Morphology of Solo man. Anthro-pol Pap Am Mus Natl Hist 43:205–290.
Wolpoff MH. 1980. Palaeoanthropology. New York: Al-fred A. Knopf. p 1–576.
Wolpoff MH. 1985. Human evolution at the peripheries:the pattern at the eastern edge. In: Tobias PV, editor.Hominid evolution: past, present, and future. NewYork: Alan R. Liss. p 335–365.
Wolpoff MH. 1989. Multiregional evolution: the fossilalternative to Eden. In: Mellars P, Stringer CB, edi-tors. The human revolution: behavioural and biologi-cal perspectives on the origin of modern humans.Edinburgh: Edinburgh University Press. p 62–108.
Wolpoff MH. 1992. Theories of modern human origins.In: Brauer G, Smith FH, editors. Continuity or replace-ment: controversies in Homo sapiens evolution. Rotter-dam: A.A. Balkema. p 25–63.
Wolpoff MH, Wu X, Thorne AG. 1984. Modern Homosapiens origins: a general theory of hominid evolutioninvolving the evidence from East Asia. In: Smith FH,Spencer F, editors. The origin of modern humans: aworld survey of the fossil evidence. New York: Alan R.Liss. p 411–483.
Woo TL, Morant GM. 1934. A biometric study of the‘‘flatness’’ of the facial skeleton in man. Biometrika26:196–250.
Wu X, Wu M. 1985. Early Homo sapiens in China. In: WuR, Olsen JW, editors. Palaeoanthropology and palaeo-lithic archaeology in the People’s Republic of China.New York: Academic Press. p 91–106.
Wu X, Zhang Z. 1985. Homo sapiens remains from latepalaeolithic and neolithic China. In: Wu R, Olsen JW,editors. Palaeoanthropology and palaeolithic archaeol-ogy in the People’s Republic of China. New York:Academic Press p 107–133.
Yamaguchi B. 1973. Facial flatness measurements of theAinu and Japanese crania. Bull Natl Sci Mus 16:161–171.
Yamaguchi B. 1980. A study on the facial flatness of theJomon crania. Bull Natl Sci Mus Tokyo [D] 6:21–28.
134 T. HANIHARA