Embed Size (px)
Citation preview


Front Flap
The housing market has imploded and the stock market has followed suit, with stock portfolios, retirement accounts, and pension funds cut in half. The U.S. economy is reeling from the real estate meltdown and credit crunch. Not stopping at the border, the storm has broadened to Europe, Asia, and beyond throughout 2008 and into 2009. Is there anyone on the planet who has not been touched by this disaster?
Even though we’ve all been affected by the calamity and have heard no shortage of news about it, it still seems unfathomable and utterly incomprehensible to most people that the actions of certain banks, mortgage companies, and Wall Street firms could bring the economic engine of the world to a grinding halt. Now, for the first time, and in terms everyone can grasp, noted analyst and value investing expert Whitney Tilson, along with his partner Glenn Tongue, explains not only how it happened, but shows that the tsunami of credit problems isn’t over. Another even larger wave is yet to come. If you know catastrophe is looming, you can sidestep the train wreck, and even profit, but you need to understand how bad times present opportunity and where to look.
Tilson, a columnist for Kiplinger’s Personal Finance, featured on 60 Minutes, and a regular on CNBC, started presenting his findings to everyday people and found them clamoring for more. Now in More Mortgage Meltdown, Tilson explains in a clear and understandable way how misguided assumptions, insatiable greed, reckless risk taking, and government inaction led to the creation of the greatest asset bubble in history, the aftermath of which is the perfect economic storm. Then, he shows you why there’s still much more pain to come and what we can expect from the ongoing crisis over the next few years.
Finally, More Mortgage Meltdown teaches you how to find investment opportunities within the rubble and position your portfolio to take advantage of the crisis. The book uses in-depth case studies of individual companies and stocks to show how to evaluate investments in these uncertain times. You will learn how to spot warning flags in the financial statements of companies that can help you avoid losing your hard-earned money. And you will learn how to spot undervalued businesses with competitive advantages or hidden assets that will likely emerge stronger from the crisis. It is important for all of us to understand how the credit and mortgage crisis happened. Equally important is the chance to potentially profit in its aftermath.
Back Flap
WHITNEY TILSON and GLENN TONGUE are the Managing Partners of T2 Partners LLC and the Tilson Mutual Funds. The former firm manages three value-oriented hedge funds while the latter is comprised of two mutual funds, Tilson Focus Fund and Tilson Dividend Fund.
MR. TILSON is the cofounder and Chairman of the Value Investing Congress, a biannual investment conference in New York City and Los Angeles, as well as the investment newsletters Value Investor Insight and SuperInvestor Insight. He writes a regular column on value investing for Kiplinger’s Personal Finance, has written for the Financial Times and TheStreet.com, and was one of the authors of Poor Charlie’s Almanack, the definitive book on Berkshire Hathaway Vice Chairman Charlie Munger. He was featured on 60 Minutes in December 2008, was one of five investors included in SmartMoney’s 2006 Power 30, was named by Institutional Investor in 2007 as one of twenty Rising Stars, and appears regularly on CNBC and Bloomberg TV. He received an MBA with high distinction from the Harvard Business School, where he was elected a Baker Scholar, and graduated magna cum laude from Harvard College with a bachelor’s degree in government.
MR. TONGUE spent seventeen years on Wall Street prior to joining T2 Partners, most recently as an investment banker at UBS, where he was a managing director specializing in acquisitions and leveraged finance. Before UBS, Mr. Tongue was at Donaldson, Lufkin & Jenrette for thirteen years, the last three of which he served as the president of NYSE-listed DLJdirect, the consistently top-rated online brokerage firm. Prior to DLJdirect, Mr. Tongue was a managing director in the investment bank at DLJ, where he worked on over 100 transactions, aggregating more than $40 billion. He received an MBA with distinction from the Wharton School of Business and received a Bachelor of Science in electrical engineering and computer science from Princeton University.
Visit www.moremortgagemeltdown.com to ask Whitney and Glenn questions, read their latest thoughts on the companies they analyze in the book, see updated color versions of the book’s charts, and much more.

-1-
Chapter 13
An Ill-Fated Acquisition?
Case Study: Wells Fargo
Given that we covered our remaining short position in Wells Fargo at around $10
during the first week of March 2009 – and are now long the stock – you might wonder
why we’re writing about it here. There are two answers: first, because when we decided
to write this book in early January 2009, it was one of our favorite short ideas because the
stock was around $30 – it’s truly stunning how quickly the stock fell in only two months.
Second, because it’s an interesting case study of how a company can be a great short at
one time and price, but one that should be covered, or even be a long position, at another
time and price.
As the credit crunch deepened over the course of 2008, we profitably shorted a
number of banks like Washington Mutual and Wachovia that we believed had not
reserved adequately for likely losses. Well Fargo was not on our list because we thought
it had a great franchise and that its reserves might be sufficient. However, when it
became clear that Wells Fargo would be acquiring Wachovia, we shorted it at around
$30.
Our investment thesis rested on two pillars: first, having been short Wachovia, we
thought Wells Fargo was buying some big losses, especially in Wachovia’s option ARM
and home equity portfolios. Second, we thought Wells Fargo’s stock price reflected an
unrealistically rosy scenario in light of what was happening in the overall mortgage and
credit markets. When we first shorted it, the stock was trading at roughly three times and
twelve times our estimates for book value and earnings, respectively, at the time, so we
thought there was a lot of room for the stock to fall if our investment thesis was correct –
and was unlikely to run against us very much if we were wrong. This is precisely the
type of “heads-we-win-a-lot, tails-we-don’t-lose-very-much” scenario that make for a
good investment, long or short.
The Bull Case for Wells Fargo
There is much to admire about Wells Fargo. By all accounts it has a great
management team and a very strong franchise that will likely become even stronger with
the acquisition of Wachovia, which gives it a coast-to-coast presence and propels it to the
top, or near the top, of U.S. banks. The combined company is number one in bank
branches (6,610), small business lending, middle market commercial lending, agriculture
lending, commercial real estate lending and brokerage, and bank-owned insurance
brokerage (number five worldwide). It’s also number two in banking deposits in the U.S.

-2-
(11.2 percent, a hair behind Bank of America, which has 11.3 percent), mortgage
originations and servicing, retail brokerage and debit cards.
Wells Fargo’s pre-Wachovia business was highly profitable, earning $19.6 billion
pre-tax in 2008 before provisions for loan losses (which were enormous – net income was
only $2.9 billion; peak net income was $8.4 billion in 2006). Figure 13.1 shows the
dramatic growth over the six years between 2003 and 2008.
Figure 13.1 Wells Fargo Pretax, Pre-Provision Earnings (2003-2008)
$-
$5
$10
$15
$20
2003 2004 2005 2006 2007 2008
Source: Wells Fargo Q4 08 financial results presentation, 1/28/09, p. 10.
Wells Fargo’s robust earnings were primarily driven by the company’s net
interest margin, which in 2008 vastly exceeded those of its three largest competitors, as
shown in Figure 13.2.

-3-
Figure 13.2 Net Interest Margin of the Four Largest U.S. Banks (2008)
Source: Wells Fargo Q4 08 financial results presentation, 1/28/09, p. 15.
Wells Fargo not only had higher margins, but was also growing its revenues and
pretax, pre-provision earnings faster than its peers, as shown in Table 13.1.
Table 13.1 Growth in Pretax, Pre-Provision Earnings and Revenue
Pretax, Pre-Provision Revenue
Earnings Growth Growth
2008 5 Year 2008
Wells Fargo 17.4% 11.3% 6.1%
JP Morgan, Citigroup, BofA -60.5% -60.4% -16.7%
Top 9 Peers -47.9% -41.7% -2.1%
Source: Wells Fargo Q4 08 financial results presentation, 1/28/09.
-4-
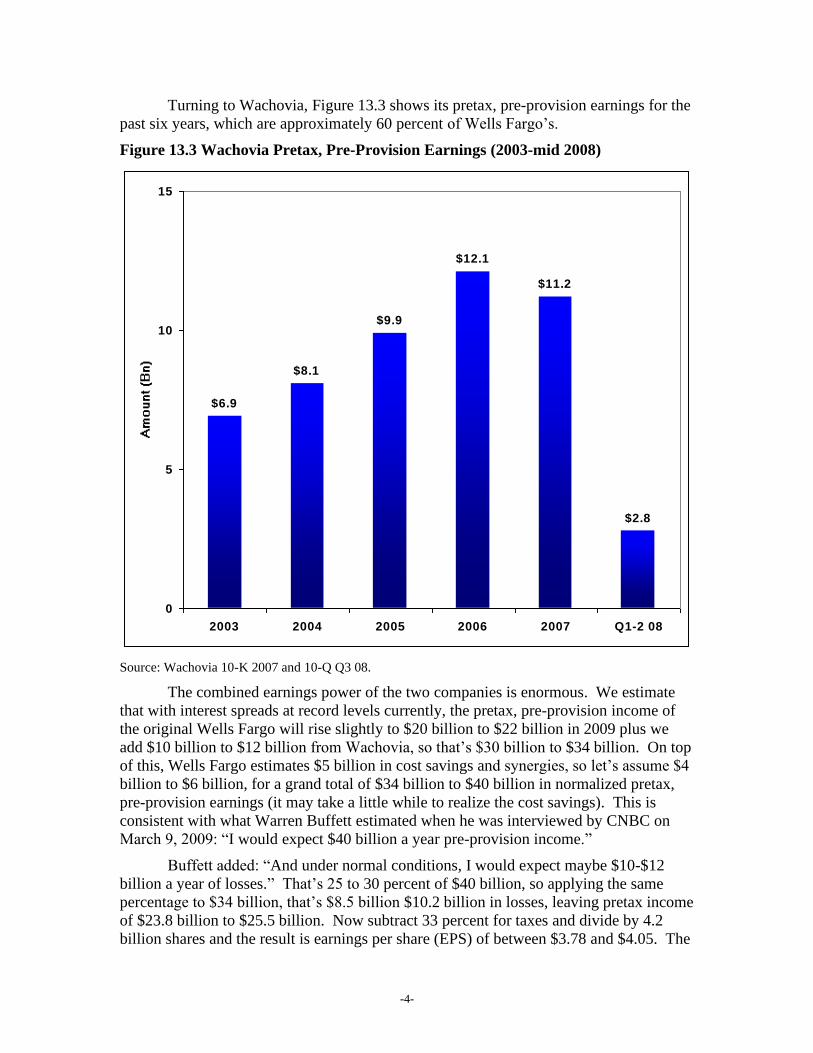
Turning to Wachovia, Figure 13.3 shows its pretax, pre-provision earnings for the
past six years, which are approximately 60 percent of Wells Fargo’s.
Figure 13.3 Wachovia Pretax, Pre-Provision Earnings (2003-mid 2008)
$6.9
$8.1
$9.9
$12.1
$11.2
$2.8
0
5
10
15
2003 2004 2005 2006 2007 Q1-2 08
Source: Wachovia 10-K 2007 and 10-Q Q3 08.
The combined earnings power of the two companies is enormous. We estimate
that with interest spreads at record levels currently, the pretax, pre-provision income of
the original Wells Fargo will rise slightly to $20 billion to $22 billion in 2009 plus we
add $10 billion to $12 billion from Wachovia, so that’s $30 billion to $34 billion. On top
of this, Wells Fargo estimates $5 billion in cost savings and synergies, so let’s assume $4
billion to $6 billion, for a grand total of $34 billion to $40 billion in normalized pretax,
pre-provision earnings (it may take a little while to realize the cost savings). This is
consistent with what Warren Buffett estimated when he was interviewed by CNBC on
March 9, 2009: “I would expect $40 billion a year pre-provision income.”
Buffett added: “And under normal conditions, I would expect maybe $10-$12
billion a year of losses.” That’s 25 to 30 percent of $40 billion, so applying the same
percentage to $34 billion, that’s $8.5 billion $10.2 billion in losses, leaving pretax income
of $23.8 billion to $25.5 billion. Now subtract 33 percent for taxes and divide by 4.2
billion shares and the result is earnings per share (EPS) of between $3.78 and $4.05. The

-5-
same calculations at $40 billion of pretax, pre-provision income, minus $10-$12 billion
of losses result in EPS of $4.44 to $4.76. Any way you cut it, that’s a lot of earnings for
a stock that closed on March 12, 2009 at $13.95.
2009 is off to a good start according to CFO Howard Atkins, who made some
bullish comments in a press release on March 6, 2009: “Our strong operating results for
the first two months of 2009 have been driven by continued growth in lending, deposits
and mortgage volumes. Mortgage originations for the first two months alone were $59
billion, exceeding in two months the exceptionally strong fourth quarter of 2008, and
mortgage applications were $107 billion.”1
Regarding its balance sheet, in the same press release Wells Fargo announced that
it was cutting its dividend by 85 percent, which will save the company $5 billion annually
– a very smart move. In another smart move, Wells Fargo was aggressive in booking
impairments and taking write-downs in Wachovia’s portfolio, as shown in Table 13.2.
Table 13.2 Credit Impairments and Write-Downs Taken By Wells Fargo on
Wachovia
Credit Impaired Credit
Portfolio Loan Balance (Bn) Write-Down (Bn)
Pick-a-Pay mortgages (option ARMs) $59.8 $24.3
Other consumer loans $5.1 $2.8
Commercial real estate $20.5 $7.7
Other commercial loans $5.9 $1.5
Other $2.6 $0.9
TOTAL $93.9 $37.2
Source: Wells Fargo Q4 08 financial results presentation, 1/28/09.
In the March 9th press release, Atkins summarized why Wells Fargo believes that
its capital position is strong:
Our capital position, adjusted for risk, is near the top of our peer group. At December 31, 2008,
stockholders’ equity was $99 billion with Tier 1 Capital at 7.84 percent – 30 percent above the 6
percent regulatory minimum for well-capitalized banks. Our tangible common equity was $36
billion, 2.86 percent of tangible assets and 3.32 percent of regulatory risk-weighted assets. These
ratios are after significantly reducing the risk in the Wachovia loan and securities portfolios, about
half of the combined balance sheet of the new Wells Fargo. By immediately writing down loans
and securities at Wachovia through purchase accounting adjustments at close, we have already
significantly reduced the risk of loss to tangible common equity. Since these losses have already
been recognized, our future earnings will be higher and therefore tangible common equity can now
grow faster. Adjusted for the fact that we already accounted for these future losses, our tangible
common equity as a percent of regulatory risk-weighted assets would have been 5.2 percent at
December 31, 2008.
Buffett certainly thinks Wells Fargo is attractive, but worries about what the
government might do. Here’s what he said during the March 9th CNBC interview:
Warren Buffett: …Our stocks we plan to hold a very long time…overall I like to buy them with
the idea of owning forever. And the quotes don't make much difference.
1 Wells Fargo press release, 3/6/09, www.wellsfargo.com/press/2009/20090306_Dividend

-6-
Now, if I looked at the performance of Wells Fargo, we'll say, I see that, you know, in a couple
years – and management doesn't have anything to do with what I'm saying here – I would
expect $40 billion a year pre-provision income. And under normal conditions I would expect
maybe 10 to $12 billion a year of losses. I mean, you lose money in banking, you just try not
to lose too much.
So, you know, you get to very interesting figures. I mean, the spreads are enormous on what
they're doing. They're getting the money at bargain rates. So if there were no quote on Wells
Fargo and I just owned it like I own my farm, I would look at the way the business is
developing, and I would say, you know, “These are a couple of tough years for losses in the
banking business, but you expect a couple tough years every now and then.” And that the
earning power is…going to be greater by far than it's ever been when you get all through with
it.
The only worry in that is the government will force you to sell shares at some terribly low price.
And I hope they're wise enough not to do that. That's what's spooking the banking market to a
big extent.
Becky Quick, CNBC: You worry about that, too.
Warren Buffett: Yeah, sure.
Becky Quick, CNBC:: That's why you'd like some clarity out of Washington on what they're
planning to do...
Warren Buffett: I think clarity is a good thing for the whole country…Any issue to do with
people's money, clarity's important. People want to be clear about their money. But I would
say that…Wells Fargo, their prospects three years out are better than ever.
To summarize, Buffett loves the stock, it’s trading at 3 to 4 times normalized
earnings and the company has taken large write-downs for Wachovia, so why isn’t every
investor buying it? The answer lies in the balance sheet, in particular a minimal amount
of equity, which may yet put Wells Fargo in the same dire position as Citigroup.
Wells Fargo’s Balance Sheet
Table 13.3 shows Wells Fargo’s balance sheet, which includes Wachovia, as it
appears in the 2008 10-K. You might think it would be easy to determine Wells Fargo’s
stockholders’ equity, the single most important element of the balance sheet – just read
the second-to-last line at the bottom of the balance sheet, right? But it’s not so easy. (For
more discussion of equity, see the appendix at the end of this chapter.)

-7-
Table 13.3 Wells Fargo’s Balance Sheet
December 31,
(in millions) 2008 2007
ASSETS
Cash and due from banks $23,763 $14,757
Federal funds sold, securities purchased under resale agreements &
other short-term investments 49,433 2,754
Trading assets 54,884 7,727
Securities available for sale 151,569 72,951
Mortgages held for sale (includes $18,754 and $24,998 carried at
fair value) 20,088 26,815
Loans held for sale (includes $398 carried at fair value at December
31, 2008) 6,228 948
Loans 864,830 382,195
Allowance for loan losses -21,013 -5,307
Net loans 843,817 376,888
Mortgage servicing rights:
Measured at fair value (residential MSRs) 14,714 16,763
Amortized 1,446 466
Premises and equipment, net 11,269 5,122
Goodwill 22,627 13,106
Other assets 109,801 37,145
Total assets $1,309,639 $575,44
2
LIABILITIES
Noninterest-bearing deposits $150,837 $84,348
Interest-bearing deposits 630,565 260,112
Total deposits 781,402 344,460
Short-term borrowings 108,074 53,255
Accrued expenses and other liabilities 53,921 30,706
Long-term debt 267,158 99,393
Total liabilities 1,210,555 527,814
STOCKHOLDERS EQUITY
Preferred stock 31,332 450
Common stock $1.67 par value, authorized 6 billion shares; issued
4.4 billion shares and 3.5 billion shares 7,273 5,788
Additional paid-in capital 36,026 8,212
Retained earnings 36,543 38,970
Cumulative other comprehensive income (loss) -6,869 725
Treasury stock 135,290,540 shares and 175,659,842 shares -4,666 -6,035
Unearned ESOP shares -555 -482
Total stockholders’ equity 99,084 47,628
Total liabilities and stockholders’ equity $1,309,639 $575,44
2 Source: Wells Fargo 2008 10-K.

-8-
What we, as investors, care about is Well Fargo’s ability to weather the current
storm, so we want to focus on tangible common equity – the word “tangible” meaning
that it excludes goodwill and other intangibles and the word “common” meaning it only
includes common stock, not preferred stock. Intangibles are excluded because, as noted
earlier, things like brands don’t help cover losses. As for preferred stock, it’s a hybrid
security that has characteristics of both debt and equity since it typically pays a dividend,
but often can also be converted into stock. It’s valuable capital in that it can absorb
losses and help avert a company going bankrupt, but it’s senior to the common stock,
meaning the common stockholders usually takes all losses until they’re wiped out before
the preferred stockholders start to take losses. Therefore, shareholders of Wells Fargo’s
stock should be most concerned with the amount of tangible common equity.
So we start with stated equity of $99,084 (all numbers hereafter in millions) and
then subtract $31,332 of preferred stock and $22,627 of goodwill, for a total of $45,125
($45.1 billion). But wait, there’s more.
Due to some odd twist in generally accepted accounting principles (GAAP),
mortgage servicing rights (MSRs) appear on the balance sheet. Wells Fargo is in the
business of servicing mortgages and the value of this business, based on Wells Fargo’s
estimate of future profits, appears as an asset. This makes no sense as this is clearly an
intangible asset – in fact, the Financial Accounting Standards Board (FASB) defines all
servicing rights as intangible assets. So, $45,125 minus $14,714 of “Measured at fair
value (residential MSRs)” and $1,446 of “amortized MSRs” results in tangible common
equity of $28,965 ($29.0 billion).
We’re not done yet, however. Wells Fargo has “Other assets” of $109,801 and
when one reads the footnotes in the 10-K, one sees that the company has buried some
intangible assets in this line rather than breaking them out separately. Table 13.4 appears
in Note 7 of Wells Fargo’s 2008 10-K.
Table 13.4 Wells Fargo’s Other Assets
December 31,
(in millions) 2008 2007
Total nonmarketable equity investments $16,782 $6,930
Operating lease assets $2,251 $2,218
Accounts receivable $22,493 $10,913
Interest receivable $5,746 $2,977
Core deposit intangibles $11,999 $435
Customer relationship & other intangibles $3,516 $319
Foreclosed assets:
GNMA loans $667 $535
Other $1,526 $649
Due from customers on acceptances $615 $62
Other $44,206 $12,107
TOTAL OTHER ASSETS $109,801 $37,145
Source: Wells Fargo’s 2008 10-K, Note 7, page 110.

-9-
The two lines in italics, “core deposit intangibles” and “customer relationship &
other intangibles,” totaling $15,515 ($15.5 billion) also need to be subtracted in the
calculation of tangible common equity, so $28,965 - $15,515 = $13,450 ($13.5 billion).
(Incidentally, note the huge rise to $44.206 billion of “other,” up from $12.1 billion the
previous year. A sum this large should be broken down and described in detail, but it’s
not. Such a big increase almost certainly has to do with the Wachovia acquisition and
part of it could be intangibles as well.)
Phew! All done, right? Nope. One more step. Once a year, accounting rules
(specifically FAS 107, “Disclosures about Fair Value of Financial Instruments”) require
companies to report “fair value estimates…for financial instruments...for which carrying
amounts approximate fair value, and excluding financial instruments recorded at fair
value on a recurring basis.”2 In the case of Wells Fargo, FAS 107 requires the company
to value the loans on its balance sheet (as well as certain other assets and liabilities) at
market value, rather than simply carrying them at par, which it normally does unless a
write-down is taken. Companies are often slow to take write-downs, so FAS 107 can
provide insight into this. Table 13.5 shows a table that appears in Note 17 of Wells
Fargo’s 2008 10-K
Table 13.5 FAS 107: Disclosures about Fair Value of Financial Instruments
December 31, December 31,
2008 2008 2007 2007
Carrying Estimated Carrying Estimated
(in millions) amount fair value amount fair value
FINANCIAL ASSETS
Mortgages held for sale $1,334 $1,333 $1,817 $1,817
Loans held for sale $5,830 $5,876 $948 $955
Loans, net $843,817 $829,603 $376,888 $377,219
Nonmarketable equity investments (cost
method) $11,104 $11,220 $5,855 $6,076
TOTAL $862,085 $848,032 $385,508 $386,067
Difference -$14,053 $559
FINANCIAL LIABILITIES
Deposits $781,402 $781,964 $344,460 $344,484
Long-term debt $267,055 $266,023 $99,373 $98,449
TOTAL $1,048,457 $1,047,987 $443,833 $442,933
Difference -$470 -$900
NET DIFFERENCE -$13,583 $1,459
Source: Wells Fargo’s 2008 10-K, Note 17, page 143.
2 Wells Fargo’s 2008 10-K, Note 17, page 143

-10-
We can see that in 2007, there was virtually no difference between the carrying
amount and estimated fair value for either financial assets or liabilities, but it was quite a
different story in 2008. In particular, Wells discloses that the $843.8 billion of loans held
on its balance sheet have a fair (i.e., market) value of only $829.6 billion, $14.2 billion
less. (Note that fair value is determined by the company, which has obviously has strong
incentives to estimate as high of a number as possible.)
Calculating the differences across all FAS 107 financial assets and liabilities
results in a net difference in 2008 of fair value being $13,583 lower than what Wells
Fargo reports on its balance sheet – quite a difference from 2007, when it was $1,459
higher.
So this is the final adjustment we make to Wells Fargo’s equity: $13,450 minus
the FAS 107 adjustment of $13,583 results in the company having adjusted tangible
common equity of negative $133 million!
Reasonable people would argue whether this means that Wells Fargo is insolvent,
but there’s no question that the company has virtually no cushion on its current balance
sheet to withstand future losses beyond its $21.7 billion provision for credit losses. To
see whether this provision is likely to be sufficient, let’s now analyze the company’s
potential losses.
Losses
Wells Fargo, to its credit, did not become involved to any meaningful degree in
toxic securitized products, as did so many of its peers, so the analysis of possible losses
focuses on the loans Wells Fargo holds on its balance sheet. Table 13.6 shows the
breakdown of Wells Fargo’s $864.8 billions of loans (including Wachovia’s book) as of
yearend 2008, with our range of loss estimates for each category, discussed further
below.

-11-
Table 13.6 Loan Portfolio With Estimated Losses
Estimated Estimated
Range of Range of
Wells Fargo Cumulative Cumulative
12/31/08 (Bn) Losses (%) Losses (Bn)
Commercial and commercial real estate:
Commercial $202
Other real estate mortgage $103
Real estate construction $35
Lease financing $16
Total commercial and commercial real estate $356 5 - 10% $18 - $36
Consumer:
Real estate 1-4 family first mortgage - Option ARM* $95 6 - 40% $6 - $39
Real estate 1-4 family first mortgage $153 5 - 10% $8 - $15
Real estate 1-4 family junior lien mortgage $110 10 - 15% $11 - $17
Credit card $24 7 -12% $2 - $3
Other revolving credit and installment $93 7 -12% $7 - $11
Total consumer $475
Foreign $34 3 - 10% $1 - $3
TOTAL LOANS $865 $52 - $124
Source: Wells Fargo Q4 08 release, 1/28/09, page 25; T2 estimates.
*Note: We break out option ARMs separately from “Real estate 1-4 family first mortgage,” using the table
on page 38. Also, the $6 billion to $39 billion of estimated option ARM losses are in addition to the $24.3
write-down taken to date.
While it’s virtually impossible to estimate losses on such a large and complex
loan book, based on the data and trends analyzed in the first half of this book, we are able
to make some estimates, especially in the consumer loan area.
Option ARMs
Let’s start with option ARMs. Table 13.7 appears on page 38 of Wells Fargo’s
Q4 08 earnings release, reflecting Wachovia’s “Pick-a-Pay” portfolio (its name for option
ARMs; to its credit, Wells Fargo never wrote a single one of these toxic loans).

-12-
Table 13.7 Pick-a-Pay (Option ARM) Loan Portfolio
December 31, 2008
Non-SOP 03-
3 loans
SOP 03-3
loans
Balance Ratio of
prior to non- carrying
Outstanding Current accretable Current Carrying amount to
(in millions) balance LTV ratio discount LTV ratio amount current value
California $28,107 86% $42,650 133% $25,472 85%
Florida $6,099 89% $5,992 119% $3,439 76%
New Jersey $3,545 74% $1,809 94% $1,246 60%
Texas $2,231 61% $562 72% $385 49%
Arizona $1,449 95% $1,552 133% $895 85%
Other states $16,269 75% $9,381 92% $6,178 61%
TOTAL $57,700 $61,946 $37,615
Source: Wells Fargo Q4 08 earnings release, 1/28/09, page 38.
What this table is showing us is that Wells Fargo, when it acquired Wachovia,
went through its $119.6 billion option ARM portfolio, separated the best $57.7 billion
into a non-credit impaired portfolio and put the remaining $61.9 billion of risky/defaulted
loans into a credit-impaired portfolio (labeled “SOP 03-3 loans”). Then, it wrote down
the credit impaired loans by $24.3 billion, leaving $37.6 billion. Thus, Wells Fargo’s
total option ARM portfolio as of yearend 2008 was $57.7 billion plus $37.6 billion =
$95.3 billion. Of these loans, 56 percent are in California and 10 percent are in Florida.
The $57.7 billion of non-credit impaired loans are performing extremely well so
far, with only 0.10 percent having missed even one payment and a loan-to-value of 80
percent based on November 2008 home prices. This sounds impressive until one
considers that by definition this portfolio will be performing exceptionally well –because
Wells Fargo cherry picked only performing loans to be part of it!
As we showed in Chapter 4, option ARMs are defaulting at catastrophic rates, but
that’s driven almost entirely by the loans that have hit their resets – before then, roughly
80 percent of the borrowers are paying only the ultra-low teaser rate, so very few will
default no matter what the LTV is. Wells Fargo doesn’t disclose what percentage of its
non-credit impaired loans have hit their reset (our bet: almost none), nor what percentage
are negatively amortizing (our bet: the vast majority).
Wells Fargo tried to put lipstick on this pig during its Q4 earnings call when it
said: “We do believe that Wachovia’s option ARM portfolio, or Pick-a-Pay, is the
highest-quality option ARM portfolio in the industry.” To us, that’s like claiming to be
the best downhill skier in Somalia.

-13-
And while it might appear that Wells Fargo was very conservative in writing
down Wachovia’s option ARMs by $24.3 billion, or 20.3 percent, we think more losses
are in store. In Chapter 4, we estimated that of all option ARMs ever written (Wachovia
had roughly one-sixth of them), 70 percent would default with 60 percent severity,
resulting in 42 percent losses. If we give Wells Fargo the benefit of the doubt and
assume that 50 percent of the original $119.6 billion will default with 50 percent severity,
that’s a 25 percent loss or $29.9 billion, $5.6 billion more than the write-down Wells
Fargo has taken to date. But we wouldn’t be surprised to see 70 percent default with 70
percent severity, a 49 percent loss or $58.6 billion, $34.3 billion more than the write-
down taken to date.
Home Equity Portfolio
Our second-biggest area of concern is Wells Fargo’s home equity portfolio, which
grew by approximately $55 billion (more than 50 percent) with the acquisition of
Wachovia. Here’s some data on the portfolio, as disclosed on page 37 of the Q4 earnings
release and during the January 28, 2009 conference call:
• The combined portfolio as of yearend 2008 was $129.5 billion;
• Wells Fargo categorized $10.3 billion (8 percent) as the “liquidating
portfolio,” similar to the option ARM credit impaired portfolio;
• 76 percent of the liquidating portfolio and 40 percent of the core portfolio (43
percent overall) has a combined loan-to-value above 90 percent, a worrisome
level given how rapidly home prices are falling, especially in Wells Fargo’s
two biggest home equity loan markets, California and Florida;
• 27.5 percent of the loans are in California and 9.5 percent are in Florida, a
total of 37 percent, a very worrisome level;
• Only 15 percent of the loans are first lien; the remaining 85 percent are second
lien, meaning that upon default, severity will likely approach 100 percent; and
• 2.48 percent of the loans were two or more payments past due as of yearend
2008 and the annualized loss rate is 2.87 percent, both good numbers (assisted
by Wachovia’s 1.62 percent and 1.84 percent figures, respectively), but the
delinquency trend is rising.
In Chapter 4, we estimate that home equity loan losses across the entire $1.1
trillion outstanding will ultimately be 15 to 25 percent. Again, if we give Wells Fargo the
benefit of the doubt and assume its losses will be 10 to 15 percent and only apply this to
the $110 billion of second lien home equity loans, that’s $11 billion to $17 billion in
losses.

-14-
First Lien Mortgages
Wells Fargo has $153 billion of first lien mortgages (excluding option ARMs), of
which $18.7 billion are home equity loans. 21 percent of the $153 billion are in
California and 11 percent are in Florida, for a total of 32 percent. It’s difficult to estimate
the possible losses here because Wells Fargo doesn’t break out delinquencies for this
segment, nor do we know how many are jumbo loans, but we’d guess they comprise the
majority of the California and Florida loans, given how high home prices got in those
states (also, if they weren’t jumbo loans, Wells Fargo would probably have sold them to
the government-sponsored enterprises [GSEs], Fannie and Freddie).
In Chapter 4 we estimated that all prime loans will show 5 to 10 percent losses
and jumbo price will have 7 to 12 percent losses, so let’s use the low end for Wells Fargo,
5 to 10 percent. Applied to a $153 billion portfolio, that’s $8 billion to $15 billion in
losses.
Other Consumer Loans
Based on our knowledge of the credit card industry, we estimate that Wells
Fargo’s credit card, other revolving credit and installment loan portfolio will incur losses
in the 7 to 12 percent range, equal to $9 billion to $14 billion.
Commercial and Commercial Real Estate
It’s difficult to estimate what the losses might be for Wells Fargo’s $356 billion of
commercial and commercial real estate loans, which account for 41 percent of the
company’s total loan book. The only area for which the company provides meaningful
disclosure is in commercial real estate and construction, where the original Wells Fargo
had $68 billion in outstanding loans with a 0.55 percent annualized charge-off rate in Q4
08, more than double the previous quarter’s 0.27 percent and eight times the 0.07 percent
in Q4 07. Wachovia’s $70 billion portfolio was showing much greater stress, with a 5.92
percent annualized charge-off rate in Q4 08, more than double the previous quarter’s 2.64
percent and five times the 1.09 percent in Q4 07.
Commercial real estate, to which Wells Fargo has $103 billion of exposure, is
going to be an enormous train wreck, but actually losses and charge-offs to date remain
quite low primarily because the loans typically don’t reset for at least five years, so the
bad loans written during the peak bubble years of 2005-07 haven’t reset and therefore
banks can hold them at or near par.
Real estate construction loans, to which Wells Fargo has $35 billion of exposure,
will likely be an even bigger train wreck.
In total, we estimate that Wells Fargo will have 5 to 10 percent losses across its
commercial and commercial real estate loan book, which translates into another $18
billion to $36 billion in losses.

-15-
Conclusion
In total as noted in Table 13.6, we estimate that Wells Fargo will incur $52 billion
to $124 billion of losses on its $865 billion loan book, or 6 to 14 percent. Even the low
end is more than double Wells Fargo’s $21.7 billion provision for credit losses, so in light
of the company having little or no real equity, does this mean we think Wells Fargo is
likely to meet the same fate as Citigroup? Not necessarily. Allow us to explain.
Wells Fargo is currently in a race for its life. Its losses are digging a hole every
quarter, which will continue for the foreseeable future, so Wells Fargo’s challenge is to
earn profits fast enough to fill the hole before it engulfs the company. We think it’s
likely to do so, which is why we now own the stock. It’s going to be a close call,
however, which is why it’s not a very big position – there’s still a real possibility of a bad
outcome.
Everything hinges on how quickly the losses come in and how much money
Wells can earn. The $21.7 billion provision for credit losses provides a bit of a cushion,
which Wells Fargo said during its January 28, 2009 conference call “covers 12 months of
estimated losses for consumer loans and at least 24 months for commercial loans.” We
think that’s optimistic, but it still underscores the good news for the company that its
loans will take time to default. Unlike toxic securitized finance products like RMBSs and
CDOs, which have to be marked down very quickly, actual loans take time to season and
companies have some leeway as to when they take charge-offs and recognize losses. For
example, Wells Fargo is aggressively working with many at-risk homeowners and
businesses to modify loans and reduce the chances of default. In a race against time, it’s
critically important that Wells Fargo have these tools at its disposal.
Another plus is that Wells Fargo’s management finally seems to have awakened
to how perilous the situation really is, which led it to slash the dividend and even more
aggressively cut costs.
As we showed at the beginning of this chapter, Wells Fargo is generating pretax,
pre-provision earnings of approximately $30 billion to $34 billion annually ($7.5 billion
to $8.5 billion per quarter) even before $5 billion in cost cuts and synergies kick in,
which will likely boost this to $10 billion per quarter.
When combined with the $21.7 billion provision for credit losses, are these profits
enough for Wells Fargo to keep ahead of the $52 billion to $124 billion of losses to
come? We think it’s likely, but it depends on the level of profits and losses and, equally
importantly, their timing. If big losses materialize quickly but profits are weaker than we
expect, Wells Fargo will be in big trouble.
Figure 13.4 shows Wells Fargo’s net loan charge-offs and its provision for credit
losses for each of the past five quarters. The good news is that the loan charge offs in
every quarter are lower than the credit losses being taken, meaning the company is
building its total provision for credit losses, especially in the fourth quarter of 2008 when
it took a huge charge to boost its reserves upon acquiring Wachovia.

-16-
Figure 13.4 Wells Fargo (pre-Wachovia) Quarterly Net Loan Charge-Offs and
Provision for Credit Losses, and Total Provision for Credit Losses
0
1
2
3
4
5
6
7
8
9
Q4 07 Q1 08 Q2 08 Q3 08 Q4 08
0
5
10
15
20
25
Net loan charge -offs
Quarte rly provision for credit
losses
T ota l provision for credit losses
(right axis)
Source: Wells Fargo Q4 08 release, 1/28/09, page 27.

-17-
Figure 13.5 shows the same data for Wachovia over the same period (excluding
Q4 08 due to the acquisition).
Figure 13.5 Wachovia Quarterly Net Loan Charge-Offs and Provision for Credit
Losses, and Total Provision for Credit Losses
0
1
2
3
4
5
6
7
Q4 07 Q1 08 Q2 08 Q3 08
0
2
4
6
8
10
12
14
16
18
Net loan charge -offs
Quarte rly provision for
credit losses
T ota l provision for
credit losses (right
axis)
Source: Wachovia 10-Q Q3 08, p. 33.
Note how Wachovia massively increased its provision for credit losses in its last
two quarters of existence, far above the increase in loan charge-offs. This was a
desperate – and ultimately unsuccessful – attempt to catch up from prior periods of
under-reserving and stave off distress. By Q3 08, it had built its total provision for credit
losses to $15.6 billion, but investors judged this inadequate and crushed the stock, forcing
Wachovia into the arms of Wells Fargo. (It turns out that investors were right, given that
Wells Fargo took $37.2 billion in write-downs upon acquiring Wachovia, as shown
earlier in Table 13.2.)
Now we have the information to estimate what the combined company’s quarterly
loan charge-offs and provision for credit losses for might be. We can see that
Wachovia’s loan charge-offs were rising rapidly before it was acquired. Assuming that
these trends in Wachovia’s loan book continue, quarterly loan charge-offs might be $3
billion in Q1 09, rising to $4 billion by the end of 2009 and then stabilizing, so to keep
ahead of this, let’s assume that Wells Fargo will want to take a $4 billion provision for
credit losses in Q1 09 and then increase this to $5 billion by the end of 2009.
-18-
Coincidentally, Wells Fargo’s loan losses prior to the acquisition were running at
a similar pace, so let’s assume its charge-offs and credit losses rise at a similar pace. This
would imply that the combined company’s quarterly provision for credit losses would be
$8 billion in early 2009, rising to $10 billion by the end of the year.
As high as this is, it is almost precisely matched by the $8 billion to $10 billion of
quarterly pretax, pre-provision profits we expect Wells Fargo to earn, so it current $21.7
billion cushion would see little impairment and the company would likely make it
through the storm. As noted earlier, however, if some combination of weaker profits and
higher losses occurs, Wells Fargo might end up a ward of the government, like Citigroup.
In summary, we think if Wells Fargo makes it through the storm without
significant dilution of its shareholders, perhaps a 70 percent likelihood in our estimation,
it will earn $4 to $5 per share, which would translate into a $40 to $60 stock. That kind
of upside offsets the very real downside risk and makes the risk-reward equation highly
favorable when the stock is in the $10 to $15 range, which is why we now own it.

-19-
Appendix: Background on Equity
The single most important figure on a balance sheet is equity. Mathematically,
assets are equal to liabilities plus equity (A=L+E) – that’s why it’s called a balance sheet:
assets must balance liabilities plus equity. Another way to think about equity is that it’s
the amount by which assets exceed liabilities (E=A-L). Thus, equity is a measure of
financial strength: a company with $100 billion in equity (like Berkshire Hathaway) is
financially stronger than a company like Resource America, which has $141 million in
equity, because Berkshire has a $100 billion asset cushion above all of its liabilities to
withstand such shocks to the business as a loss of assets (writing down inventory, for
example) or an unexpected jump in liabilities (e.g., insurance claims from a big
hurricane).
From a shareholder’s perspective, equity is both good and bad. It’s good because
it provides a company with protection against unexpected calamities such as the
economic environment we’re currently experiencing. Companies of all sorts, not just
financial institutions, that have lots of equity will weather this storm and may even profit
from it by being able to take market share from or acquire weaker competitors.
But equity also represents shareholders’ capital that’s tied up in the business –
that’s why it’s full name is “stockholders’ equity” (it’s also known as “book value”). But
as an investor, I don’t want my capital tied up in a business – I’d prefer that the business
use as little capital as possible because that increases the return on equity and lets me
keep more of my capital so that I can invest it elsewhere.
Pretty much every business requires a certain amount of equity to operate, but
above a minimum level, boards and management teams have a great deal of latitude as to
how to capitalize a business, which raises tough questions with no clear answers. For
example, if a company is profitable over time and accumulates a lot of cash, should it
hold onto the cash in case a recession hits or a juicy acquisition target comes along, or
should the company return the capital to shareholders in the form of dividends or share
repurchases, thereby reducing its equity? Shareholders generally love dividends and
share repurchases, but consider how many companies returned billions in cash to
shareholders only a year or two ago and are now desperately in need of capital amid the
current crisis.
The reason this is important is that the U.S. (and world) financial system is on its
knees is because most companies don’t have enough equity to withstand the losses that
are occurring. Even using generous definitions of equity, Wall Street firms were levered
25 to 1 and even up to 35 to 1, meaning their assets were 25 to 35 times as large as their
equity – and banks weren’t far behind. For example, in its March 6th press release, Wells
Fargo noted that its Tier 1 capital (the most generous equity-like measure) was at 7.84
percent. While that was “30 percent above the 6 percent regulatory minimum for well-
capitalized banks,” according to Atkins, it’s still 12.8 times leverage. And if you use
tangible equity rather than Tier 1 capital, the leverage jumps to 35 to 1! (Of course,
Wells Fargo’s leverage is infinite if you use our calculations that show its equity is

-20-
negative.) Wells Fargo, like most financial institutions, is highly leveraged and has little
margin for error.
Goodwill and Intangible Assets
It’s not just the dollar amount of equity that matters – it’s often more important
exactly what are the assets and liabilities that determine the equity. In some cases, a
company’s assets aren’t worth what they’re carried on the books for or it has hidden
liabilities, both of which would make actual equity lower than reported.
The most important adjustment that often needs to be made to equity is to subtract
intangible assets, the largest of which is usually goodwill, which is created when a
company acquires another for more than its asset value. For example, imagine a
company paid cash to acquire Coca Cola for its current market capitalization of $95
billion. Coke has $16 billion of tangible book value, so the acquirer would see its cash
balance go down by $95 billion and it would take Coke’s assets and liabilities onto its
own balance sheet. Because Coke’s tangible assets exceed its liabilities by $16 billion,
this would offset the decline in cash, resulting in a $79 billion decline on the asset side of
the acquirer’s balance sheet.
This presents an accounting quandary, however. Remember, A=L+E. Assets just
went down by $79 billion net, so the equation is no longer in balance. Should the
acquirer be required to write down its equity by $79 billion as a reflection of the fact that
it grossly overpaid for Coke? Think about it: why would someone buy Coke for more
than its tangible assets? The obvious answer is that Coke’s value is not embedded in its
cash, receivables, inventory, trucks, computers, buildings and all other assets that appear
on its balance sheet. Rather, by far its most valuable asset is its brand, which has been
built, cultivated and nurtured by the company since its inception in 1892. It’s the brand
that, more than anything, that allowed the company to earn nearly $6 billion in profits in
2007 and 2008, which in turn justifies the $95 billion market cap (as of March 12, 2009).
So the acquiring company is paying $79 billion above the tangible asset value for
Coke’s intangible assets. To resolve the accounting quandary and balance the balance
sheet, therefore, the acquiring company would add $79 to its balance sheet on a line
under assets called “Goodwill.”
There are other types of intangible assets, which usually appear on a separate line
under assets on the balance sheet called “Intangible assets” or “Other intangible assets.”
For example, imagine a pharmaceutical company that buys a patent from another
company for $1 billion, giving it the right to produce a lucrative drug. In this case, the
acquirer’s cash would go down by $1 billion and intangible assets would go up by $1
billion.
When calculating a company’s financial strength, many analysts exclude goodwill
and other intangibles primarily because if a company runs into trouble, its intangible
assets are likely worth little or nothing, whereas its tangible assets like cash, receivables,
inventory and even sometimes property, plant and equipment can be monetized to, say,
pay off debt.