Embed Size (px)
Citation preview

From Waste Management to Circular Economyin Indonesian context
Moderator: Martin van Nieuwenhoven
Jakarta, October 26, 2018

SHARING INNOVATION
KnowledgeInstitutes
Government
Companies
EXCHANGE KNOWLEDGEAND INNOVATION
CIRCULAR PRODUCTS AND SERVICES
HOLLAND CIRCULAR HOTSPOTDutch circular solutions for global challenges
GOVERNMENT2GOVERNMENT COLLABORATION

SHARING INNOVATION
PROGRAMME
• 09:45 - 09:50 Introductory remarks
• Mr. Roald Lapperre, Vice Minister of the Dutch Ministry of Infrastructure and Water Management
• 09:50 - 10:00 Waste management in Indonesian context
• Mr. Novrizal Tahar, Director Waste Management, Ministry of Environment and forestry
• 10:00 - 10:10 Findings of the Danish Jakarta study
• Mr. Per Rasmussen, Natl Programme Adviser Danida Environmental Support Programme, phase 3 (ESP3)
• 10:10 - 10:25 Inspiring ideas for Indonesia: European examples for Integrated Solid Waste Management
• Mr. Herman Huisman, senior advisor international cooperation
• 10:25 - 10:40 Inspiring ideas for Indonesia: Experiences from global cooperation projects
• Mr. Herman Huisman,
• 10:40 - 11:10 Panel: how to make it actionable and scale-up
• Mr. Novrisan, Director Management of Waste and Dangerous Substances in Indonesia
• Mrs. Retno Hapsari, Director of XS Project
• Mrs. Wilda Yanti, Director of PT Xaviera Global Synergy
• 11.10 – 11.15 Wrap-up by
• Mr. Herman Huisman

SHARING INNOVATION
SPEAKERS

HOLLAND CIRCULAR HOTSPOT, AYANA MIDPLAZA, 26 OCTOBER 2018
SOLID WASTE MANAGEMENT IN INDONESIA
NOVRIZAL TAHARDIRECTOR OF SOLID WASTE MANAGEMENT
REPUBLIC OF INDONESIAMINISTRY OF ENVIRONMENT AND FORESTRY

SHARING INNOVATION
INCREASING OF POPULATION
DEVELOPMENT OF SW
TECHNOLOGYLIFE STYLE
LESS PUBLIC AWARENESS
INCREASING TYPE AND AMOUNT OF SOLID
WASTE PRODUCTION
MINDSET
THE NATIONAL SITUATIONS ON SOLID WASTE MANAGEMENT

ENVIRONMENTAL POLICY AND REGULATION IN INDONESIA
INDONESIAN CONSTITUTION
1945
LAW 32/2009 Environmental Protection and Management
LAW 18/2008Solid Waste
Management
Article 28H:A proper and healthy environment constitutes a human right of every
Indonesian citizen
• Improve environmental quality to sustain our life
• Encounter global warming• Assure legal certainty and provide
protection of human right
• Population and consumption pattern increase both amount and type of waste
• Waste needs to be managed integrally and comprehensively
• Assure legal certainty and clear role-sharing among stakeholders
Improve human health, environmental quality and utilize waste to resource
Protect living environment from pollution and damage, guaranteeing
human safety, health, and life for achieving sustainable development

POLICY TRANSFORMATION(Law No. 18/2008, Govt Reg No. 81/2012 & Presidential Decree No. 97/2017)
• WASTE JUST POLLUTANT LOADS
• NO WASTE REDUCTION
• NO WASTE TO RESOURCE
• NO RESOURCE EFFICIENCY
• FULL VIRGIN RESOURCE EXTRACTION
• LINIER ECONOMY
8
SHIFTING THE PARADIGM
END OF PIPE SOLUTION 3R & EPR CIRCULAR ECONOMY
• REDUCE WASTE AS POLLUTANT LOADS
• REDUCTION AT SOURCE
• WASTE TO RESOURCE
• RESOURCE EFFICIENCY
• LIMIT VIRGIN RESOURCE EXTRACTION
• PRODUCER RESPONSIBILITY
• LESS WASTE BY DESIGN
• MAKE WASTE A NEW LIFE AS LONG AS POSSIBLE
• CIRCULAR ECONOMY
• SUSTAINABLE CITIES AND COMMUNITIES (SDG GOAL NO 11)
• RESPONSIBLE CONSUMPTION & PRODUCTION (SDG GOAL NO 12)
Before law Law implementation Advance implementation

SHARING INNOVATION0,00
200,000,00
400,000,00
600,000,00
800,000,00
1,000,000,00
1,200,000,00
1,400,000,00
2011 2012 2013 2014 2015
Pertambahan Volume Timbulan Sampah Plastikdi 22 Kota Metropolitan dan Besar
CHANGING COMPOSITION:• DECREASED OFORGANICWASTE : 60% (2013) 57% (2016)• INCREASED OF PLASTIC WASTE: 14% (2013) 16% (2016)
Source: Adipura Secretariat, 2013
NATIONAL SOLID WASTE PROFILE
Others 2,4%Glases 1,7%
Fabric Material 3,5%
Rubber 5,5%
Steel 4,3%
Paper 9%
Plastic 14% Organic 60%
FOOD WASTE
GARDENING WASTE
PAPER WASTE
STEEL SCRAP
PLASTIC WASTE
FABRIC MATERIAL
RUBBER WASTE
GLASES WASTE
OTHERS
SOLID WASTE COMPOSITION
Trend of Plastic Waste Production in 22 Big and Metropolitan Cities SOURCES OF SOLID WASTE

SOLID WASTE POTENTIAL AS RESOURCE MATERIAL
NoComposition Amount
(tons)Usage
Type %
1 Compostableorganic
57 37,480,198.27 Compost, biogas, heat, electricity
2 Plastic 16 10,520,757.41 Raw material, heat electricity
3 Paper 10 6,575,473.38 Raw material
4 Metal 4 2,630,189.35 Raw material
5 Rubber 2 1,315,094.68 Refused Derived Fuel (RDF)
6 Textile 3 1,972,642.01 Raw material
7 Glass 2 1,315,094.68 Raw material
8 Others 6 3,945,284.03 Others
TOTAL 100 65,754,733.81
Source:MoEF Indonesia, 2016-2017
SHARING INNOVATION
- ACT NO 18YEAR 2008SOLID WASTE MANAGEMENT
- GOVT.REGULATION NO 81YEAR 2012 HOUSEHOLD WASTE AND HOUSEHOLD-LIKE WASTE MANAGEMENT
- MINISTERIAL DECREE NO 13 YEAR 2012 3R AND WASTE BANK
- MINISTERIAL DECREE NO 53 YEAR 2016 ADIPURA PROGRAM
- MINISTERIAL DECREE NO 59 YEAR 2016LEACHATE STANDARD (TPA)
- MINISTERIAL DECREE NO 70 YEAR 2016 EMISSION STANDARD OF INSINERATOIN PROCESS FOR SW
- PRESIDENTIAL DECREE NMBER 35 YEAR 2018 REGARDING THE ACCELELRATION
CLEAN INDONESIA
PROGRAM 2020
- PRESIDENTIAL REGULATION NO 97 YEAR 2017 ON JAKSTRANAS
NATIONAL STRATEGY AND POLICY OF SWMREGULATIONS APPROACHES
GOOD ENVIRONMENT
AND HEALTH QUALITY

SHARING INNOVATION
National Target of Solid Waste Management(Presidential Decree No 97/2017)
IndicatorNational Target on Solid Waste Management
2015 2016 2017 2018 2019 2020 2021 2022 2023 2024 2025
Solid WasteEstimation
(Million Ton)64.4 65.2 65.8 66.5 67.1 67.8 68.5 69.2 69.9 70.6 71.3
Solid Waste Reduction
(Million Ton)
10%(6.44)
12%(7.82)
15%(9.89)
18%(12 )
20% (13.4)
22%(14.)
24% (16.4)
26% (17.99)
27% (18.9)
28% (19.7)
30% (20.9)
Solid Waste Handling(Million Ton) 70%
(45)71%(46)
72%(47.3)
73 %(48,5)
75%(50.3)
75% (50.8)
74% (50.7)
73% (50.52)
72% (50.3)
71% (50.1)
70% (49.9)
1. Under the Precidential Decree No. 97/2017 stated the national target of solid waste management are100% well managed in years 2025 by; 30% of waste reduction 70% 0f waste handled
2. In year 2025, there is no littering of solid waste in the river, beach, ocean, open dumping system and openburning

POLICY DIRECTIVE MEASUREMENT(Presidential Regulation Number 97 Year 2017)
1. DERCREASE WASTE GENERATION PER CAPITA
2. DECREASE WASTE GENERATION AT SOURCE
3. DECREASE WASTE TO LANDFILL
4. DECREASE WASTE TO ENVIRONMENT
13
30% WASTE REDUCTION BY 2025
70% WASTE HANDLING BY 2025
1. INCREASE WASTE TO RECYCLE AND RECOVER
2. DECREASE WASTE TO LANDFILL
3. DECREASE WASTE TO ENVIRONMENT

Scheme of Resource Efficiency and Circular Economy of Solid Waste Management
Solid WasteManagement
Organic Waste
Plastic Waste
Paper Waste
Glasses Waste
Steel Scrap
Residue
CompostingBiogas
Material Recovery
TPA
Recycle Industry
Energy Recovery
Energy Recovery
RENEWABLE RESOURCES Replace Natural Resources
SUSTAINABLE CONSUMPTION
REDUCE-REUSE-RECYCLE
Recycle Centre Facility
Waste Bank

15
The Implementation of3R Progam of Solid Waste Management through the Waste Bank to Promote Resource Efficiency and Circular Economy
Total Waste Bank is about 5,244 spreading in 34 provinces and 219 cities in Indonesia Waste Bank create social engineering of sorting process to implement 3R prorgam in the
community Waste reduction from the sources Need more time and excellent methode to make this program massive in Indonesia

SOCIAL, ENVIRONMENTAL AND ECONOMIC BENEFITS FROM CIRCULAR ECONOMY OF THE WASTE BANK
0,01% 0,01%0,14%
1,70%
1
Persentase pengurangan Sampah di Bank sampah terhadap Sampah Nasional
2014 2015 2016 2017
3. Contribute to the national waste reduction
1,009,625,043
1,009,625,043
1,145,731,446
1,515,449,825
1,595,493,825
0 500,000,000 1,000,000,000 1,500,000,000 2,000,000,000
Pertumbuhan Omset Bank Sampah4. Circular Economy (Income)
Average per year (IDR)
2018
2017
2016
2015
2014
2. Create job opportunity for community
817,027
1,096,906 1,099,188
1,387,010
1,585,013
2014 2015 2016 2017 2018
Jumlah Sampah Yang terkelola di Bank Sampah (Ton/Tahun)
1. Increased solid waste treated in the source (ton/year)

Industrials Sectors Put Into Action of the Circular Economy
1. PRODUCERS OBLIGUE TO REDUCE WASTE DERIVED FROM THEIR PRODUCT AND PACKAGING BY DOING RE-DESIGN, RECYCLE, AND REUSE
2. MAIN PRODUCERS: BRAND OWNER, RETAIL, AND FOOD/BEVERAGE SERVICE
17
10-YEARLY EPR IMPLEMENTATION
ROADMAP
SINGLE USE PLASTIC BAG REDUCTION
1. PLASTIC BAG FEE
2. NO PROVISION PLASTIC BAG INSTEAD OF REUSABLE SHOPPING BAG
3. PROVIDE BIO-BASED SHOPPING BAG
4. PROVIDE RECYCLEABLE AND REUSABLE PLASTIC BAG BUT MUST BE TAKEN BACK FOR RECYCLING

Promoting of Energy Recovery of Solid Waste Management
Presidential Regulation No 35 Year 2018 Regardingthe Acceleration of thermal Process Ffor Solid Waste
Treament
12 cities are targeted under the Presidential Regulation;
DKIJakarta,Tangerang, South Tangerang, Bekasi, Bandung,
Semarang, Surakarta, Surabaya, Makassar, Denpasar, Palembang
Manado
Invesment Mechanism: Govenment to governtment (G to
G) Public private partnership (PPP) Business to business (B to B) Busines to govenment (B to G)

THANK YOUTERIMA KASIH
19

WASTE MANAGEMENT MASTER PLAN
DKI JAKARTA
SUMMARY PRESENTED AT EU SEMINAR ON WASTE AND
CIRCULAR WCONOMY OCTOBER 25, 2018

SHARING INNOVATION
Background
Revision of the existing Master Plan for Waste Management in DKI Jakarta to offer the best possible solutions for managing all the municipal solid waste generated within DKI Jakarta.
In 2018, the DKI Jakarta Environment Department will undertake a revision of the Master Plan project covering the 3Rs, waste collection and transport, so the revision focused on the waste treatment, covering waste-to-energy, as well as other methods and technologies.
Slide 21

SHARING INNOVATION
ObjectiveThe objective of this consultancy was:
to assist with and provide technical inputs to arevision of the Master Plan for Waste Management inDKI Jakarta in compliance with present Indonesianpolicies, and to identify obstacles and opportunitiesfor generating waste-based energy with a view torecommending general designs of ITF and TPS.
Slide 22

SHARING INNOVATION
Area Covered by PlanJakarta, officially the Special Capital Region of Jakarta, occupies a total land area of 662 square kilometers and had a total population of 10 million in 2014 plus about 3.0 million daily commuters from the adjacent areas.
The city is divided into five municipalities (“Kota Administratif”): Central Jakarta, West Jakarta, South Jakarta, East Jakarta and North Jakarta. The city also includes the Thousand Islands area.
Slide 23

SHARING INNOVATION
Main Treatment RecommendationsEstablish waste-to-energy facilities in Jakarta. Remember to tender these professionally (international tender)!
Make Refuse Derived Fuel for use in cement kilns in collaboration with Lafarge-Holcim.
Rehabilitate and operate the existing dry anaerobic digestor in Pesanggrahan, South Jakarta and duplicate the experience in other locations.
Slide 24

SHARING INNOVATION
Other Recommendations
Slide 25
• Split out the waste management operations from the Department of Environment, so that the same unit is not responsible both as operator and regulator.
• Initiate long-term planning on waste reduction programmes, especially on initiatives such as an Extended Producer Responsibility (EPR) programme for mobile phones.

SHARING INNOVATION
Other Recommendations
Slide 26
• Allocate resources to ensure waste collection from areas that are not served at present.
• The current system where unlicensed vehicles collect commercial waste is very vulnerable to illegal dumping and should be properly regulated.
• Consider doing a lot of waste transport at night to avoid traffic jams.

SHARING INNOVATION
Other Recommendations
Slide 27
• Study how to improve the operating and environmental standards at the Bantar Gebang Landfill.
• Plan long-term to transport waste in shipping containers by train or barge. Establish a new waste treatment & disposal facility far from Jakarta within reach of a harbour or a rail line.

SHARING INNOVATION
Thank you!
Sunter Waste-to-Energy facility (drawing by Babcock & Wilcox Vølund, the technology supplier).

SHARING INNOVATION
Inspiring ideas for Indonesia: European examples for Integrated Solid Waste
Management

SHARING INNOVATION
Historical overview policy on waste (& resources)
Collection
Control &Technical
Integratedwastepolicy
Circulareconomy
Management scale
Public health
EnvironmentalProtection
Resource management
Preservation of prosperity
Municipal
Regional
National
Global
1875 1990 20131975 2016
wasteprevention

Content:• Waste hierarchy (since 1979)• Producer responsibility• Minimum standards• Landfill and incineration taxes/landfill bans• Separate collection of waste streamsSystem:• Adequate planning system• (Municipal) Waste tax that covers all costs• Cooperation between government authorities• Involvement of waste management industry & NGO’s• Consensus on data• Monitoring & enforcement systemPerformance:2-3% landfilling, 81% Recycling; 17% WtE
Critical success factorsWaste Management in general

32
Introduce extended producers responsibility
Ministry of infrastructure
& Environment
EPR regulation
and control
Batteries WEEE Packaging Car tyres ELV
Create a stable collection system Create awareness and environmentally responsible behavior Contribute to “design for recycling” and “ecodesign” Prevent illegal trade and export Annual Reporting on collection and recycling performance Contribute in shift to refurbisch, repair, re-manufacture, part harvesting

Performance MSW 2016 (Eurostat)
SHARING INNOVATION
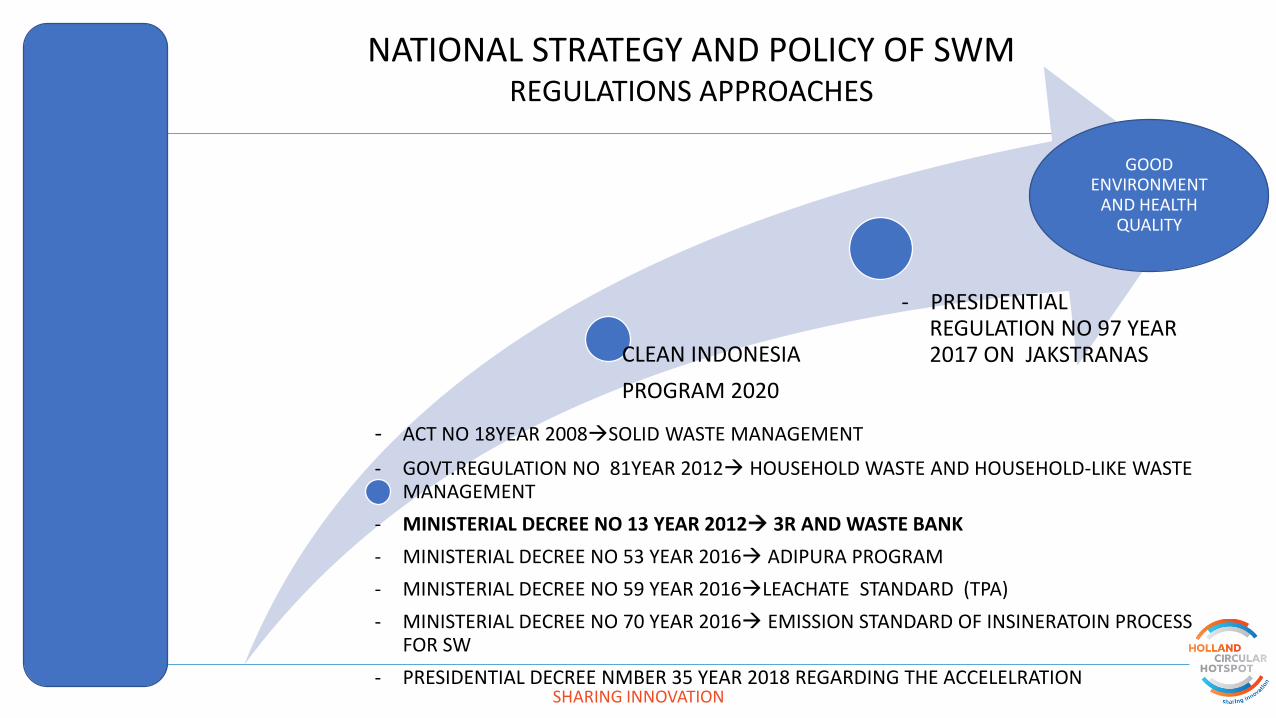
High Efficiency WtE has a negative Carbon footprint
With a strong Business Case and lowest social cost
Amsterdam High Efficiency WtE Technology

Moving towards Resource Management
RESOURCE MANAGEMENT
WASTE MANAGEMENTWASTE PREVENTION
ExtractionManufacturing
TransportDistribution Purchasing
UseRe-use
SeparateCollection
Recycling
Other treatmentand recovery
Reduction at source Sustainable consumption
Avoided waste flows Diverted waste flows
Waste Minimization
Preparing for Re-use
PRODUCTION CONSUMPTION END OF LIFE

SHARING INNOVATION
DUTCH PRACTICAL EXAMPLES OF THE CIRCULAR ECONOMY
The Dutch Policy Example
Objectives of the Dutch government
• A circular economy by 2050
• 50% reduction in use of raw materials by 2030

SHARING INNOVATION
Program structure: 5 Transition Agendas
Transition Agendas (priorities )
Biomass& Food
Plastics ProductionIndustry
Construction Consumer goods
Legislation &Regulation
Market incentives
Financing Knowledge & Innovation
International cooperation
Interventions

SHARING INNOVATION
Visualising Circular Economy: “the Value Hill”
DUTCH PRACTICAL EXAMPLES OF THE CIRCULAR ECONOMY

SHARING INNOVATION
MAKE AND USE PRODUCTS SMARTERREFUSERETHINKREDUCEPRODUCT AND PARTS LIFE EXTENSION RE-USEREPAIRREFURBISHREMANUFACTUREREPURPOSEVALORISATION OF MATERIALSRECYCLERECOVER
TRADITIONAL 3-RsREDUCERE-USERECYCLE
Presentfocus?
Futurefocus?
Rethink!
DUTCH PRACTICAL EXAMPLES OF THE CIRCULAR ECONOMY

Waste is a choice
The choice is (y)ours

SHARING INNOVATION
Inspiring ideas for Indonesia: Experiences from global cooperation projects in:
Sweepsmart, Tanzania, and Colombia

Efficient segregated waste handling to clean the streets, increase
recycling, reduce landfills and create jobs to be proud of!Our vision
Existing (informal) recycling sector
Households
Dumping
Trucks
Landfill/
Waste-to-
Energy
Recyclable waste
Mixed waste
Door2Door
collection
Households
(source
segregated)
Door2Door
collection
(segregated)
Organic
Waste
processing
TrucksProcessing
/ Landfill
Smart
Waste
Centre
Recyclable
Organic
Reject
Segregated
Now
Sw
eepS
mart
vis
ion

Optional: compost/biogas
Our solution –Smart Waste
Centre
Smart operations and data management based on
optimized hardware, building, processes and a dashboard
Building
Hardware
Processes Training
Dashboard

Our solution –Smart Waste Centre
Our partners/
customers:
• Capacity: 1-1.5T/day
• Sort ~6-8 streams at once
• Low value material sent to landfill
• Squatting, mosquitos, rats
• Dirty, smelly and unorganised
Capacity: 3-4T/day
Sort ~36 streams at once
Low value material sorted > fuel
Ergonomic & hygienic work
Clean landmark in the neighbourhood!
We tripled capacity, increased recycling and drastically improved
hygiene and ergonomics in 3 centres in Bangalore
AfterBefore
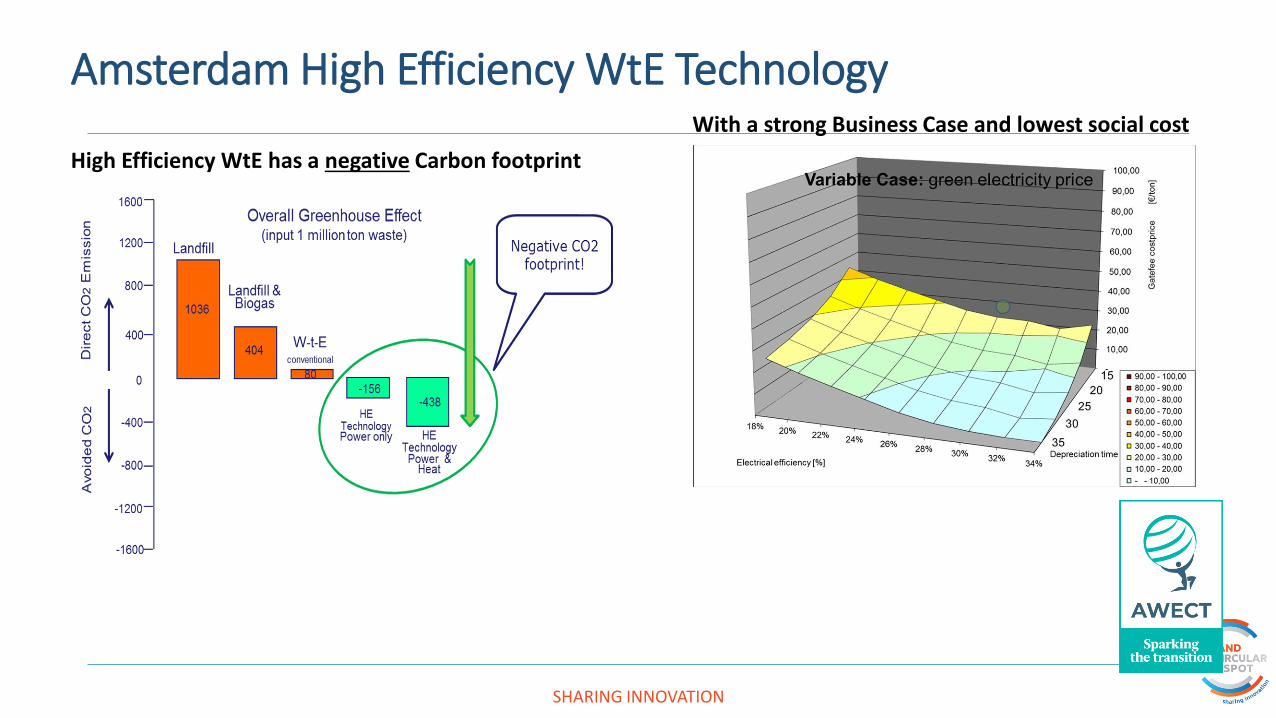
An efficient integrated segregated SWM system
based on four principles - for a clean city!Our solution –Integrated SWM
Awareness and logistics go hand-in-handSegregated handling in 3 main streams1 2
Simple but efficient collection &
transport – Europe meets India
Users pay in return for good service
including feedback3 4

CredentialsWe have experience with various waste
management projects in India and abroad
Waste management gap
analysis for two of Wipro’s
largest campuses in Bangalore
Technical support in setting up an
integrated solid waste management
system for EcoHub project, Bangalore
Six-month project for ELCITA to
improve source segregation at
Electronics City companies
Supporting British company Systemiq
in Indonesia to set up a solid waste
management facility for project STOP
Three facilities in Bangalore:• Waste collection & facility of
• Electronic City Township Authority
• Dry Waste Collection Centre of
• BBMP (Bangalore Municipality)
• Aggregation centre for Hasiru
Dala
Challenges
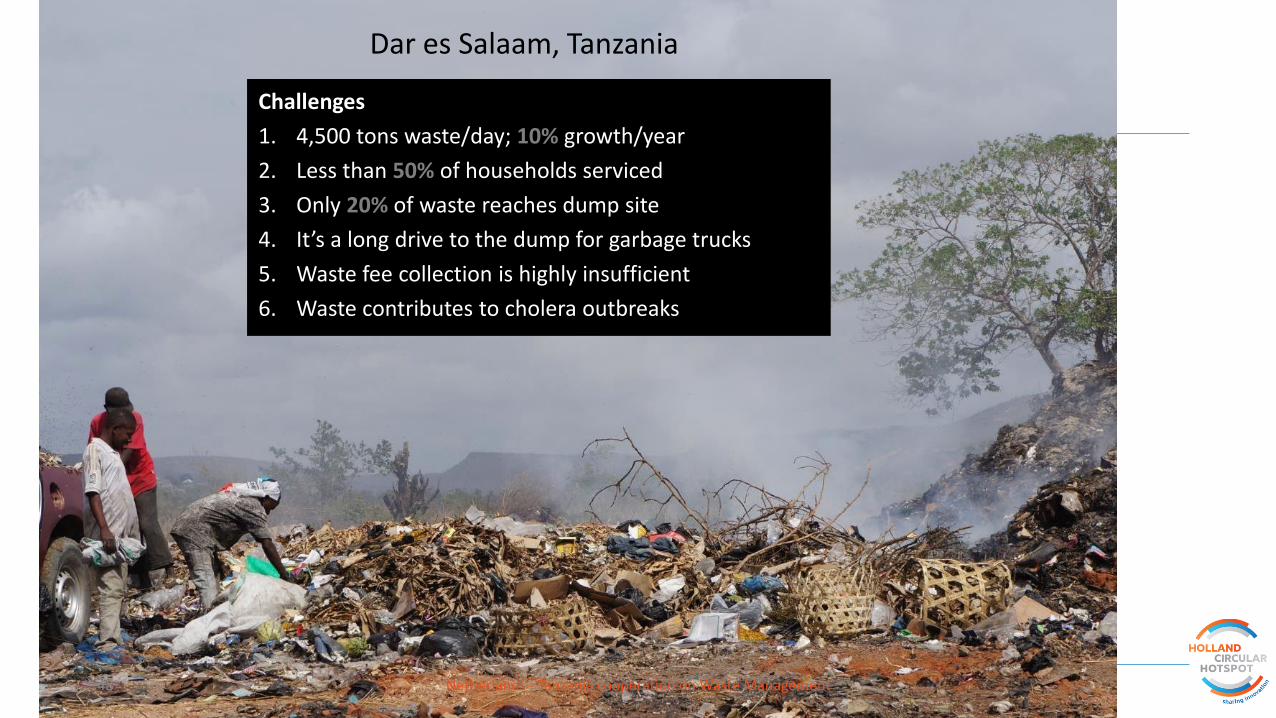
1. 4,500 tons waste/day; 10% growth/year
2. Less than 50% of households serviced
3. Only 20% of waste reaches dump site
4. It’s a long drive to the dump for garbage trucks
5. Waste fee collection is highly insufficient
6. Waste contributes to cholera outbreaks
Netherlands - Tanzania cooperation on Waste Management48
Dar es Salaam, Tanzania

SHARING INNOVATION
Waste GoalsDar es Salaam
5Waste
cooperation
5Waste
cooperation
4Cost
coverage
4Cost
coverage
3Pugu
sustainable
3Upgrade Pugu
landfill
1Better waste
service
2Optimized
wastelogistics
2Optimized
wastelogistics
1Better waste
service
Goals (in 5 yrs starting from project take-off)
To increase coverage of waste collection services in Dar es Salaam to a minimum of 90% of the population; organize awareness programs in cooperation with local NGO’s
To remediate, upgrade and expand the dump site to the standards of a controlled landfill and extend its remaining life span by at least 20 years. MRF constructed to accommodate the waste pickers; composted “organics” used a daily cover
To improve the collection and transport of MSW, a.o. through the use of waste transfer stations, with option of MRF’s
To establish a public waste fee collection system on the basis of full cost recovery and differentiated fees based on affordability
To further regionalize waste management in Dar es Salaam, e.g. by the establishment of a Metropolitan Waste Authority
Netherlands - Tanzania cooperation on Waste Management
49

SHARING INNOVATION
Current situation Colombia:• Lack of
experience EPR packaging
• Lack of trust between actors
• Lack of baseline information
• Insufficient infrastructure
• The position of the waste pickers is not clear
In 5 years:• PRO is well
established• Systems have
been well developed and tested
• Targets are set• Geographic
scope defined• List of materials
finalized
EPR Packaging in Colombia: 5 years
Now In 5 years
Creation of PRO
Pilot projects
Coordination Government – PRO – (municipalities)
Information system
Creation of infrastructure
Professionalizing the waste pickers

SHARING INNOVATION
- Define service area
- Report quantities
- Vehicle registration
- ECA registration
Contract Uniform
Conditions
- Services briefcase
- Business
Strengthening Plan
- User database
- Web page
- Scale Calibration
register
- Supervisors and
control system
- Service provision
program
-Reports Macro-routes- Certificate of labor competences- Staff by employment category
- PQR report-Plan of Emergencies and contingencies
- Report Financial Statements- Map of the area of provision in MAGNA-SIRGAS
1 Month
2 Months
12 Months
Formalization process of waste recyclers organizations
Acces to the rate
Recyclers as entrepreneurs =
People lending the activity of take advantage of
waste.
4th
Year
Re
gis
ter
in
SS
PD
2th
Year
3th
Year
5th
Year
FORMALIZATION OF RECYCLING ORGANIZATIONS

SHARING INNOVATION
Waste tariff system in Colombia
Nationwide every municipality has to divide their territory in 6 districts: 1-3 pay less than the costs; 5-6 subsidize 1-3; 4 pays the actual costs

SHARING INNOVATION
Team Decree 838Including recycling activities in the National tariff system of Colombia

SHARING INNOVATION
Panel: how to make it actionable and scale-upMr. Novrisan, Director Management of Waste and Dangerous Substances in IndonesiaMrs. Retno Hapsari, Director of XS ProjectMrs. Wilda Yanti, Director of PT Xaviera Global Synergy