Embed Size (px)
Citation preview
Initial Findings from the UO 2015 Sexual Violence Survey
Department of Psychology, University of Oregonhttp://dynamic.uoregon.edu/jjf/campus/
UO Team (in alphabetical order): Jennifer J. Freyd, Jennifer M. Gómez, Marina N. Rosenthal, Alec Smidt, & Carly Parnitzke Smith
ARC3 Team: 22 researchers and administrators from across the countryPresented by Jennifer Freyd on 24 August 2015 within the Keynote Panel entitled “Campus Sexual Assault: Current Research and Prevention Approaches” at the 20th International Summit & Training on Violence, Abuse, & Trauma, San Diego, CA, San Diego, CA, 23‐26
August 2015.
1
The UO 2015 Sexual Violence Survey
• Designed to assess student experiences of sexual assault, sexual harassment, stalking, and intimate partner violence, as well as student attitudes, and well‐being
• Based in part on our 2014 UO campus survey and the national 2015 ARC3 survey
• Funds for participant pay and graduate assistant provided by the UO President’s Office
• Data collection occurred online during 26 May to 5 June 2015
2
Slide Sections
1. Recent Background2. The 2015 Survey Methods3. Some Survey Findings 4. Summary, Limitations, Future Directions
3
1. Recent Background
4
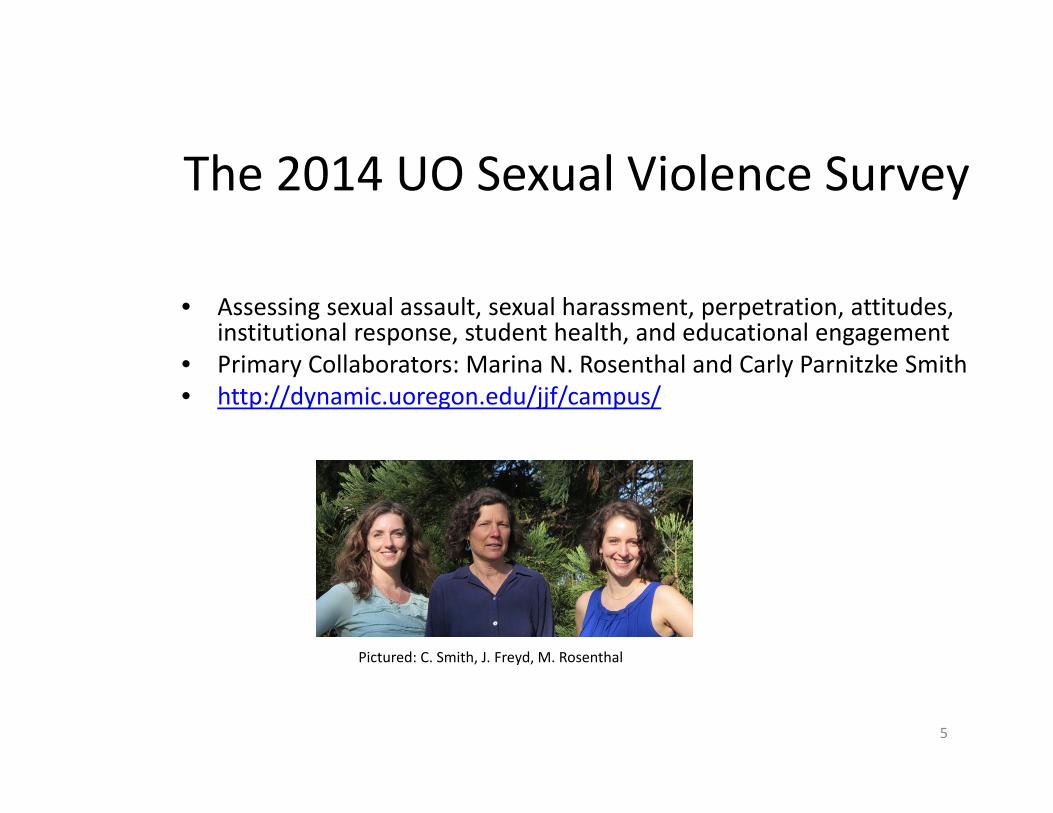
The 2014 UO Sexual Violence Survey
• Assessing sexual assault, sexual harassment, perpetration, attitudes, institutional response, student health, and educational engagement
• Primary Collaborators: Marina N. Rosenthal and Carly Parnitzke Smith • http://dynamic.uoregon.edu/jjf/campus/
Pictured: C. Smith, J. Freyd, M. Rosenthal
5
The 2014 Survey• Assesses
– sexual assault and harassment victimization– student attitudes and perceptions of institutional behaviors
– educational engagement and student well‐being• Data collection
– August and September of 2014, on‐line, $20 gift card compensation
• Funding for participant compensation: CSWS grant and private donation
• Sample – 982 completed surveys

The 2014 Survey Instrument
• Primarily used or modified existing instruments; some new items were created specifically for this study
• Civil rights versus criminal foundation– Victimization items based on Title IX understanding
• Victimization assessed with behavioral descriptions of events (labels like sexual assault or rape avoided)
• Web presentation; Qualtrics software – Qualitrics "Display Logic" was used such that questions presented to participants often depended upon their answers to prior questions.
7
Some Key Findings from the 2014 UO Survey
• 10% of female participants were subjected to completed anal or vaginal penetration
• 19% of female participants were subjected to attempted or completed anal or vaginal penetration
• 35% of female and 11% of male participants indicated at least one sexual experience without consent during college
8
2014 Findings Continued
• The perpetrators were mostly men (frequently other students) known to the victims.
• The overwhelming majority of students who were assaulted (90%) or raped (86%) did not report to a university source.
• 41% of those victimized also indicated at least one sort of institutional betrayal
9
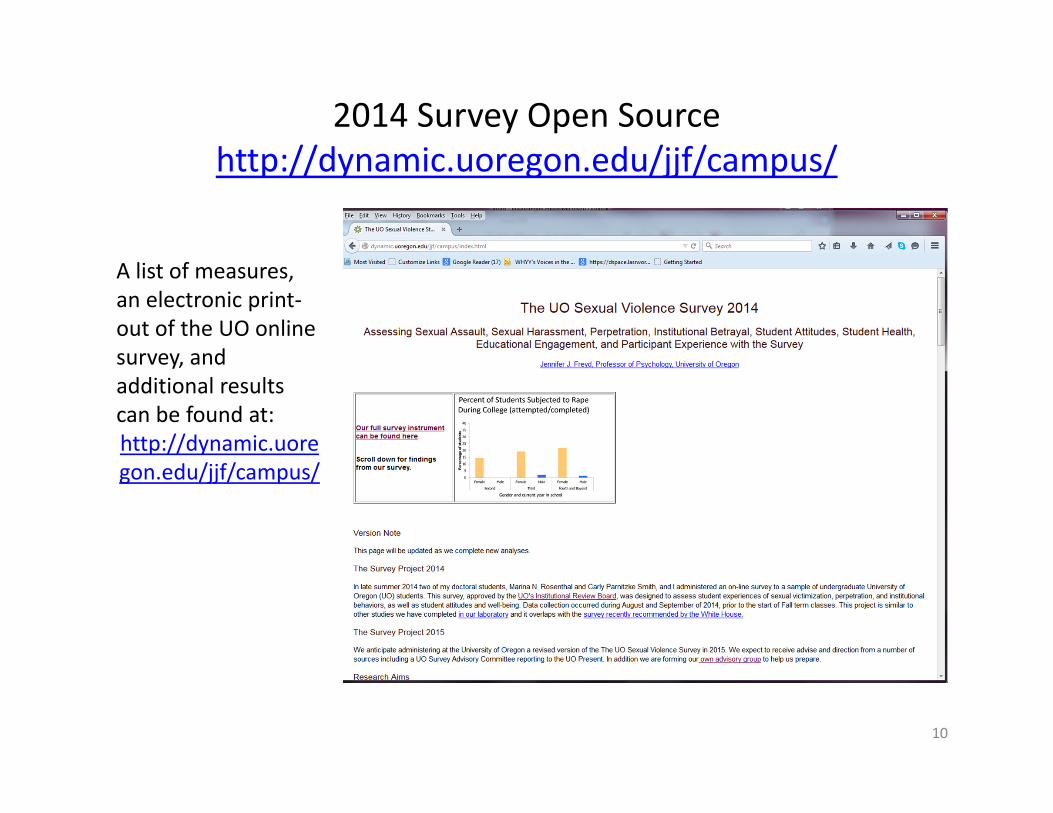
2014 Survey Open Sourcehttp://dynamic.uoregon.edu/jjf/campus/
A list of measures, an electronic print‐out of the UO online survey, and additional results can be found at: http://dynamic.uoregon.edu/jjf/campus/
10

The 2015 ARC3 Survey
• ARC3 = The Administrator‐Researcher Campus Climate Collaborative
• Created in February 2015 at the Madison Summit on Campus Climate and Sexual Misconduct
• ARC3 included or incorporated many of our 2014 UO survey measures
• UO one of 4 pilot schools, spring 2015
11
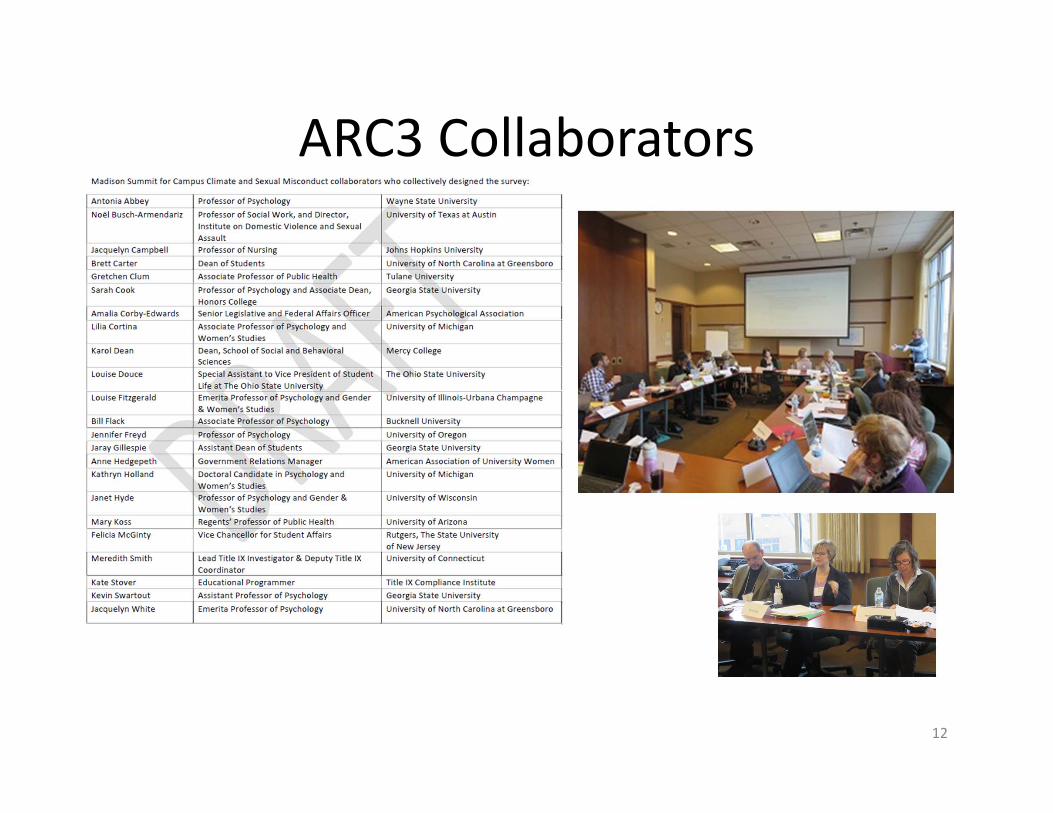
ARC3 Collaborators
12

The UO 2015 Sexual Violence Survey
• Spring 2015• Two lab members joined
research team: doctoral students Alec Smidt and Jennifer M. Gómez
• We also created an advisory group
• Goals: contribute to UO, nation, research
• Start with the ARC3 survey pilot; modify lightly; add additional measures
GómezSmidt
Smith, Freyd, Rosenthal
13
How the 2015 survey compares to the 2014 survey
• Overall similar: random selection of UO students invited; on‐line survey; amazon.com certificate compensation; similar measures (behavioral descriptions, guided by civil rights/Title IX)
• Numerous small differences in measures and some changes in measures (e.g. stalking, dating violence added this time)– Institutional support measured along with betrayal
• Both undergraduate and graduate student participants included this time
• Assessment in late spring 2015 rather than late summer 2014
14
2. The 2015 Survey Methods
15
The UO 2015 Sexual Violence Survey
• Designed to assess student experiences of sexual assault, sexual harassment, stalking, and intimate partner violence, as well as student attitudes, and well‐being
• Based in part on our 2014 UO campus survey and the national 2015 ARC3 survey
• We also added a number of additional measures to test hypotheses about mechanisms
• Funds provided by the UO President’s Office• Data collection occurred online during 26 May to 5 June 2015
16
2015 Survey Procedure
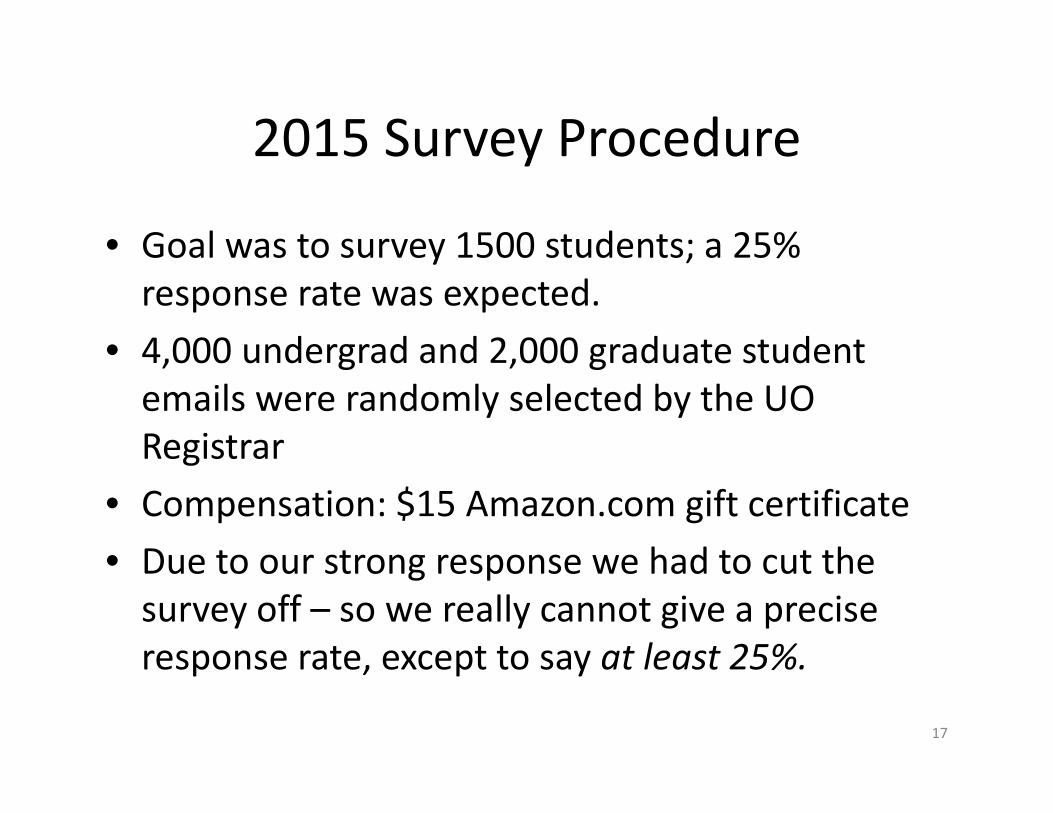
• Goal was to survey 1500 students; a 25% response rate was expected.
• 4,000 undergrad and 2,000 graduate student emails were randomly selected by the UO Registrar
• Compensation: $15 Amazon.com gift certificate• Due to our strong response we had to cut the survey off – so we really cannot give a precise response rate, except to say at least 25%.
17

2015 Data Integrity ‐‐ Attention Check
• 5 attention‐check items designed to ensure that participants were attending to the content of their responses
• placed at various points throughout the survey, often as part of a list of responses in a matrix table, and directed participants to select a specific response if they were paying attention– I will select ‘agree’ if I am paying attention– The response to this item will be ‘neutral’ to indicate attention.
• Only participants who got at least 4 of these items correct were included in the data analysis
18

2015 Survey Participants
• 1,334 finished the survey and passed attention checks– 795 Undergraduate Students– 539 Graduate Students
19

2015 Survey Participants Continued
• Racial Demographics– 82% White or Caucasian– 11% Asian or Asian American– 8% Hispanic or Latino– 3% Black or African American– 2% Native American or Alaska Native– 1% Hawaiian or Pacific Islander– 3% Other
20
2015 Survey Participants Continued
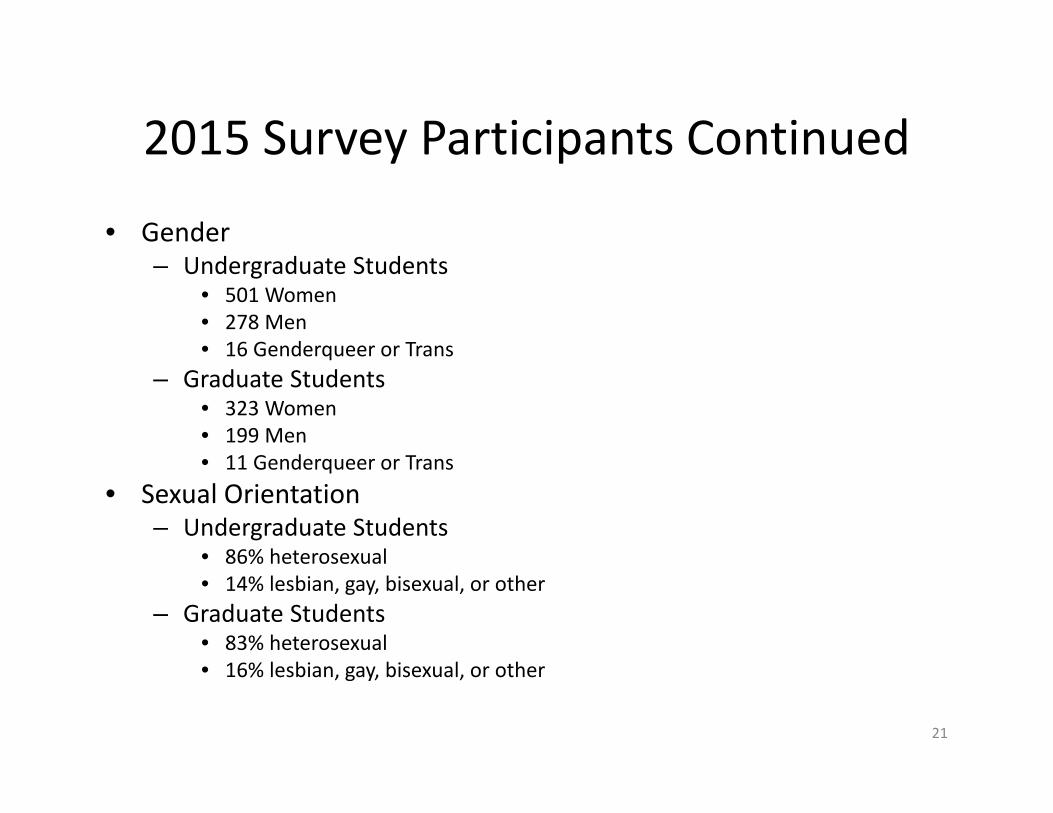
• Gender– Undergraduate Students
• 501 Women• 278 Men• 16 Genderqueer or Trans
– Graduate Students• 323 Women• 199 Men• 11 Genderqueer or Trans
• Sexual Orientation– Undergraduate Students
• 86% heterosexual• 14% lesbian, gay, bisexual, or other
– Graduate Students• 83% heterosexual• 16% lesbian, gay, bisexual, or other
21
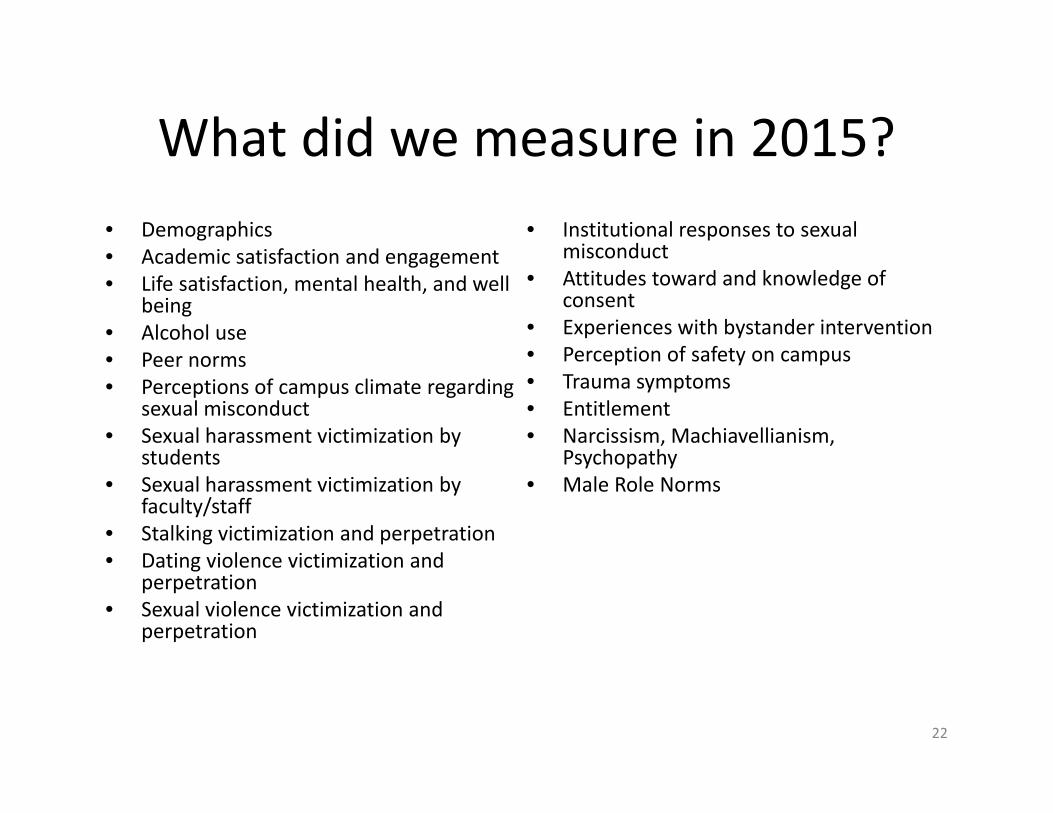
What did we measure in 2015? • Demographics• Academic satisfaction and engagement• Life satisfaction, mental health, and well
being• Alcohol use• Peer norms• Perceptions of campus climate regarding
sexual misconduct• Sexual harassment victimization by
students• Sexual harassment victimization by
faculty/staff• Stalking victimization and perpetration• Dating violence victimization and
perpetration• Sexual violence victimization and
perpetration
• Institutional responses to sexual misconduct
• Attitudes toward and knowledge of consent
• Experiences with bystander intervention• Perception of safety on campus• Trauma symptoms• Entitlement• Narcissism, Machiavellianism,
Psychopathy • Male Role Norms
22
Note: All Victimization Questions Tied to UO
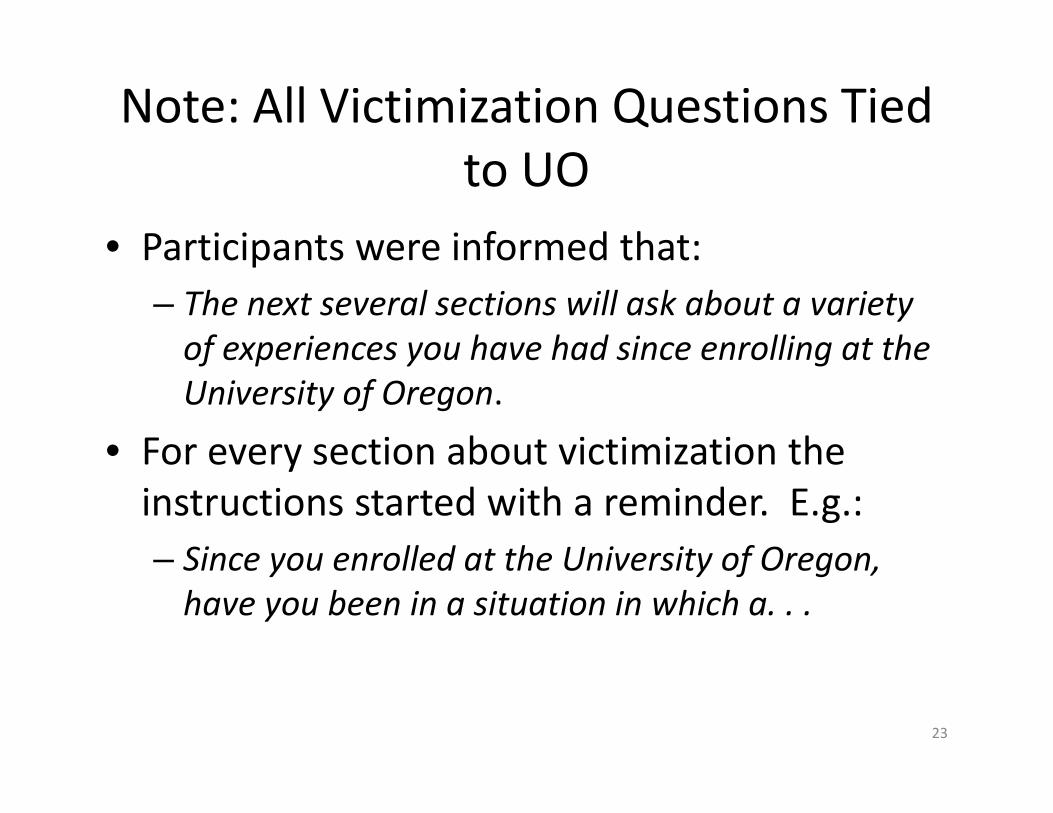
• Participants were informed that:– The next several sections will ask about a variety of experiences you have had since enrolling at the University of Oregon.
• For every section about victimization the instructions started with a reminder. E.g.:– Since you enrolled at the University of Oregon, have you been in a situation in which a. . .
23

3. Some Survey Findings
a. Participant Reactions to Surveyb. Victimization Rates c. Graduate Student Victimization Patternsd. Student Awareness and Attitudes about Institution
24
a. Participant Reactions to Survey
25
Participant Response to 2015 Survey
16 17 14
29
17
5212
15 16
29
19
6 30
10
20
30
40
50
60
70
80
90
100
1 (Much LessDistressing)
2 3 4 5 6 7 (Much MoreDistressing)
Percen
tage of P
articipan
ts
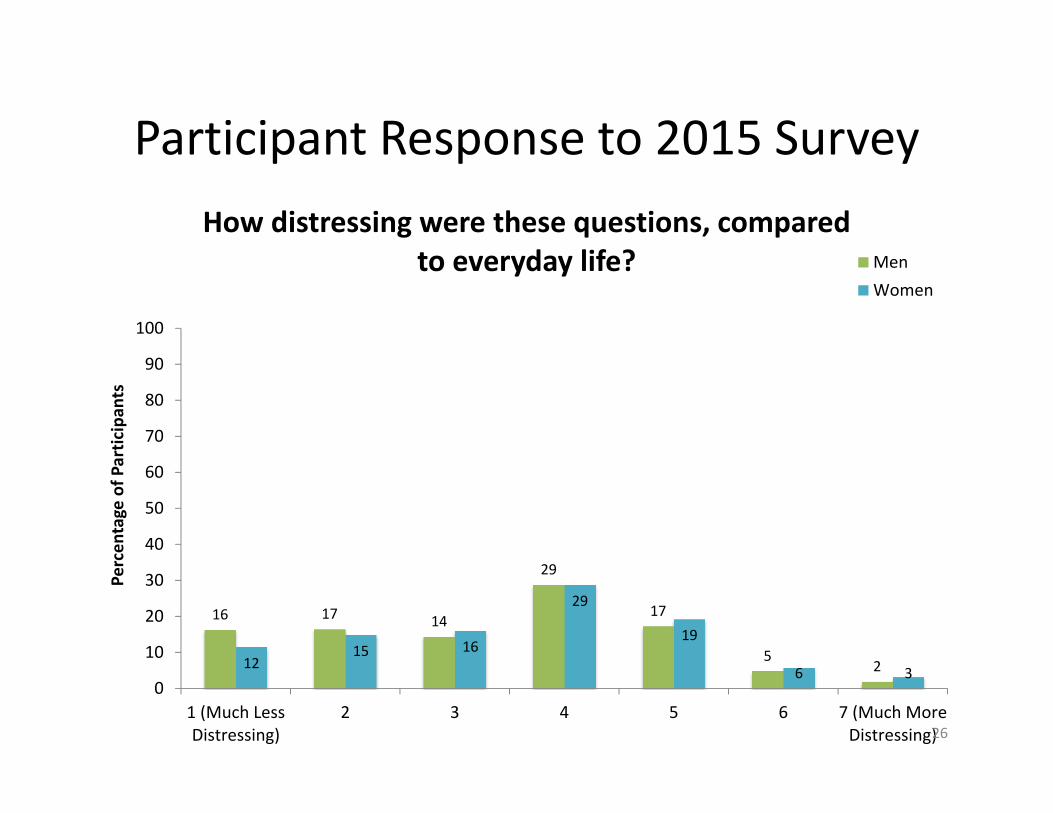
How distressing were these questions, compared to everyday life? Men
Women
26
Participant Response to 2015 Survey
2 4 5
12
1922
36
1 2 49
14
26
43
0
10
20
30
40
50
60
70
80
90
100
1 (DefinitelyNot
Important)
2 3 4 5 6 7 (DefinitelyImportant)
Percen
tage of P
articipan
ts
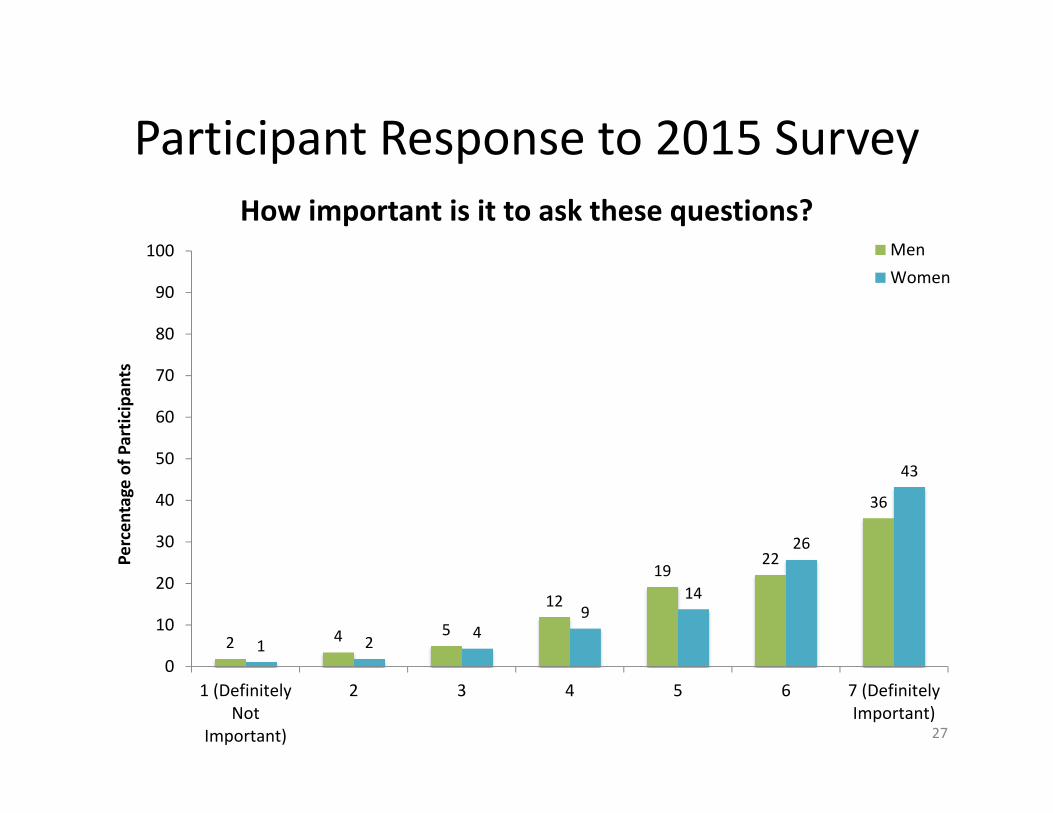
How important is it to ask these questions? MenWomen
27
Findings
b. Victimization Rates
28

Rates of sexual experiences without consent
(modified Sexual Experiences Survey, Koss et al., 2007)
29
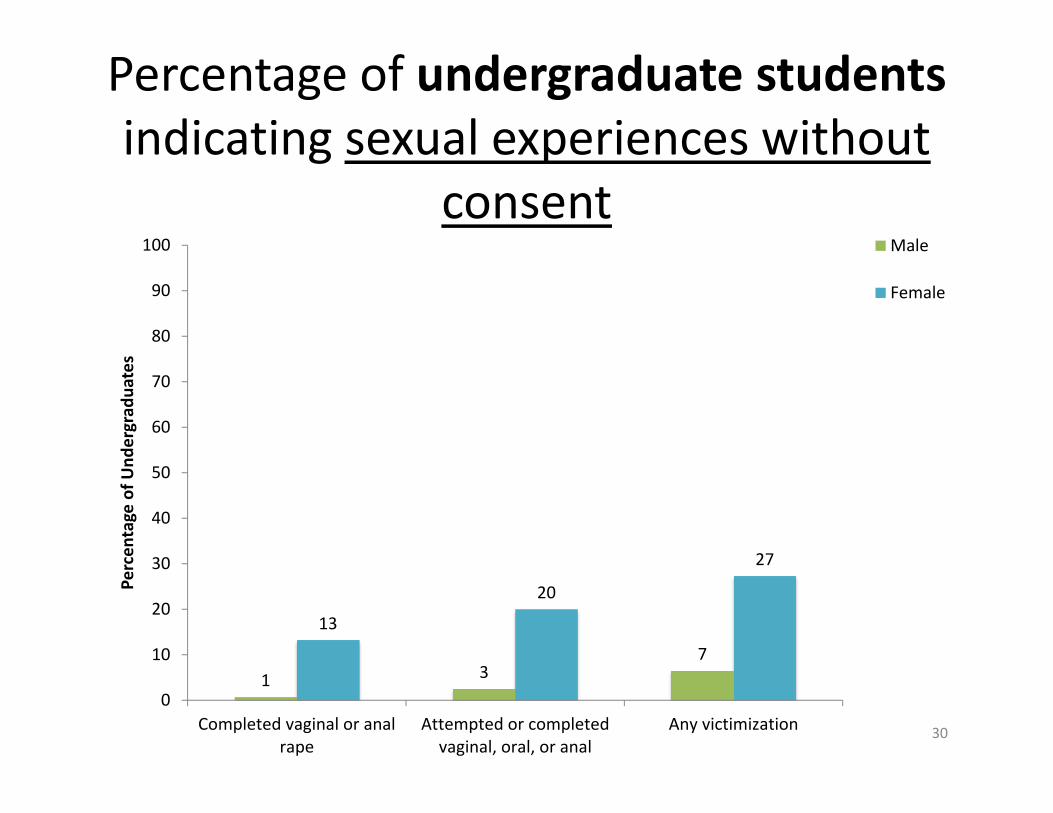
Percentage of undergraduate students indicating sexual experiences without
consent
1 37
13
20
27
0
10
20
30
40
50
60
70
80
90
100
Completed vaginal or analrape
Attempted or completedvaginal, oral, or anal
Any victimization
Percen
tage of U
ndergrad
uates
Male
Female
30
Graduate student rates of sexual experiences without consent (new to 2015)
31

Percentage of graduate students indicating sexual experiences without
consent
1 2 548 10
0
10
20
30
40
50
60
70
80
90
100
Completed vaginal or analrape
Attempted or completedvaginal, oral, or anal
Any victimization
Percen
tage of G
radu
ate Stud
ents
Male
Female
32

Dating Violence (battering) and Stalking
33
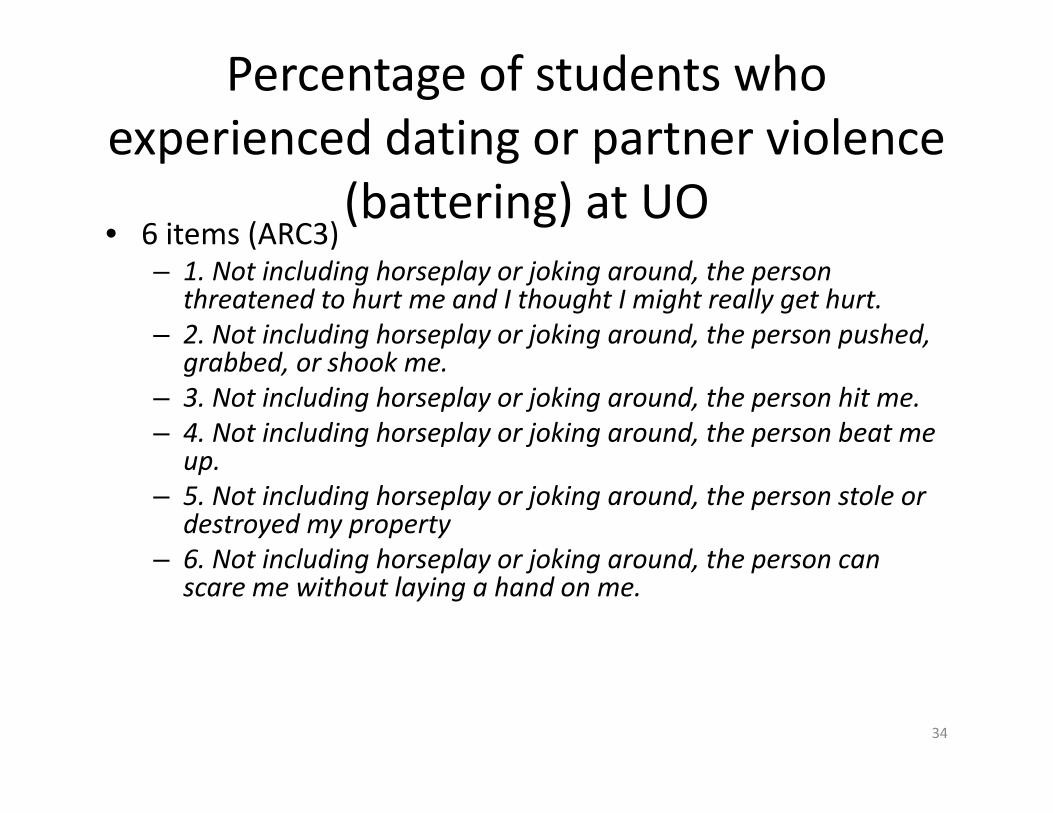
Percentage of students who experienced dating or partner violence
(battering) at UO• 6 items (ARC3)
– 1. Not including horseplay or joking around, the person threatened to hurt me and I thought I might really get hurt.
– 2. Not including horseplay or joking around, the person pushed, grabbed, or shook me.
– 3. Not including horseplay or joking around, the person hit me. – 4. Not including horseplay or joking around, the person beat me
up. – 5. Not including horseplay or joking around, the person stole or
destroyed my property – 6. Not including horseplay or joking around, the person can
scare me without laying a hand on me.
34

Percentage who experienced dating or partner violence (battering)
6
14
711
0
10
20
30
40
50
60
70
80
90
100
Men Women Men Women
Undergraduate Graduate
Percen
tage of P
articipan
ts
35
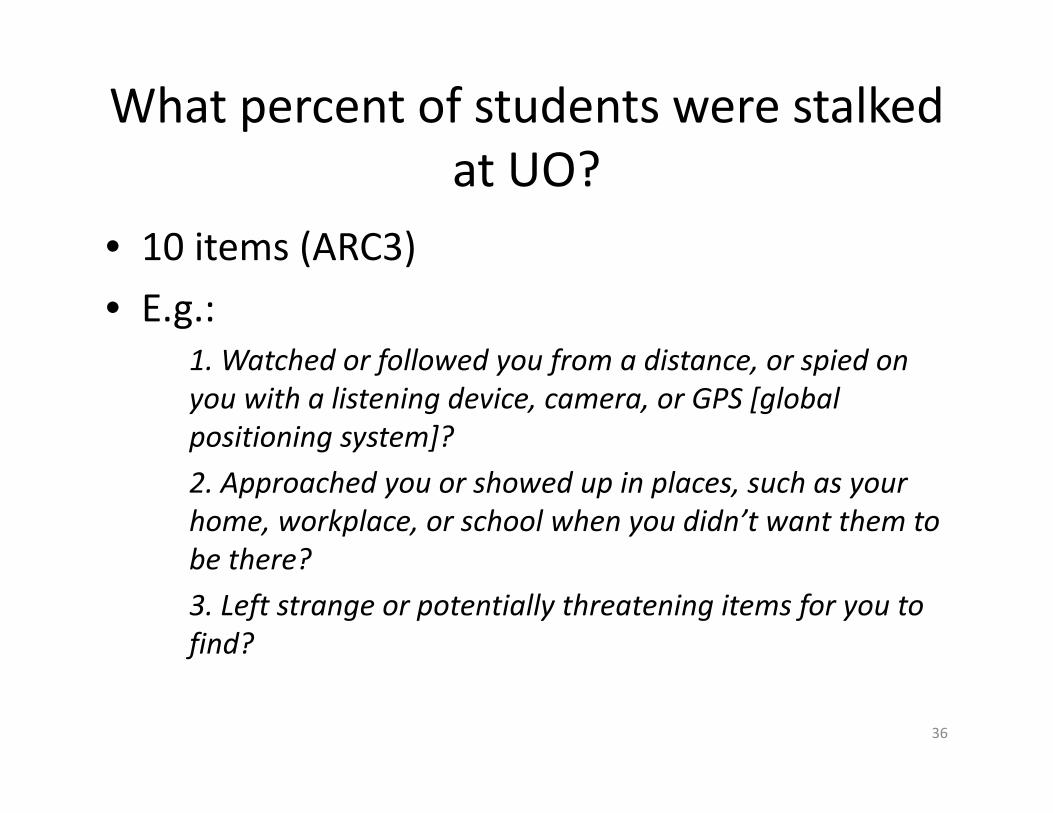
What percent of students were stalked at UO?
• 10 items (ARC3)• E.g.:
1. Watched or followed you from a distance, or spied on you with a listening device, camera, or GPS [global positioning system]? 2. Approached you or showed up in places, such as your home, workplace, or school when you didn’t want them to be there? 3. Left strange or potentially threatening items for you to find?
36
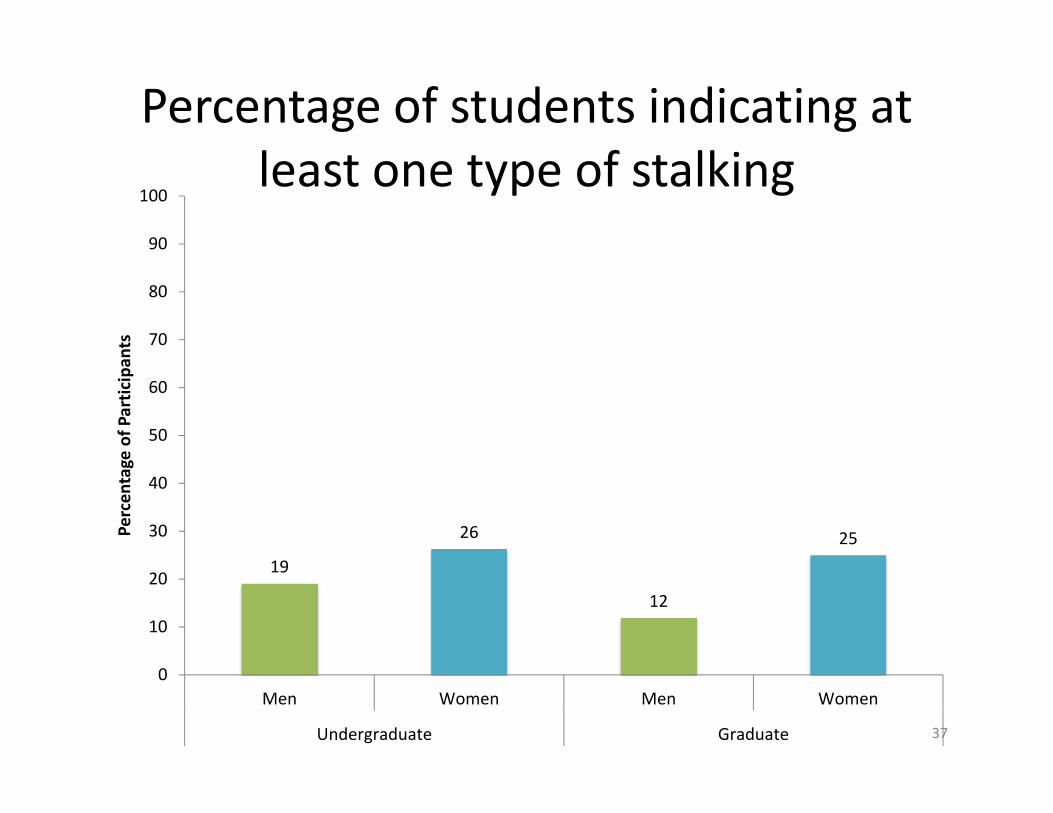
Percentage of students indicating at least one type of stalking
19
26
12
25
0
10
20
30
40
50
60
70
80
90
100
Men Women Men Women
Undergraduate Graduate
Percen
tage of P
articipan
ts
37
What percent of students experienced sexual or gender‐based events that are potentially
harassing?
38
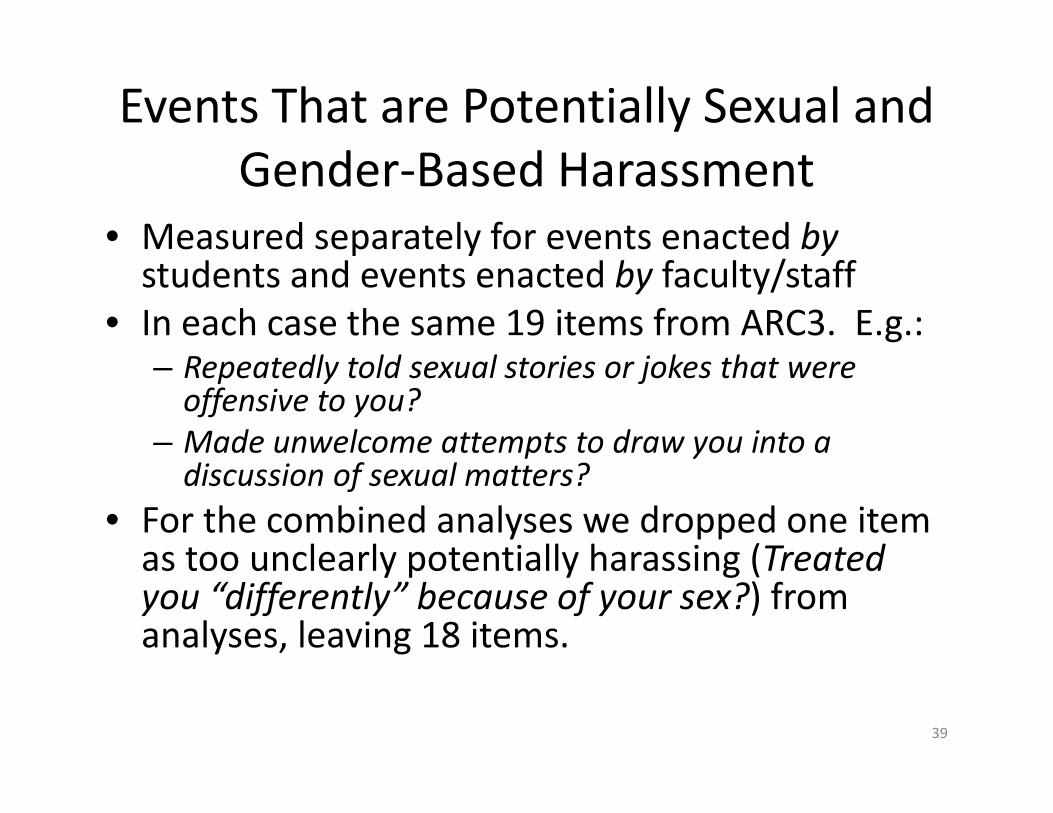
Events That are Potentially Sexual and Gender‐Based Harassment
• Measured separately for events enacted bystudents and events enacted by faculty/staff
• In each case the same 19 items from ARC3. E.g.:– Repeatedly told sexual stories or jokes that were offensive to you?
– Made unwelcome attempts to draw you into a discussion of sexual matters?
• For the combined analyses we dropped one item as too unclearly potentially harassing (Treated you “differently” because of your sex?) from analyses, leaving 18 items.
39

Potentially Harassing Experiences: Undergraduates
40

Potentially Harassing Experience: Undergraduates
46
21
68
28
0
10
20
30
40
50
60
70
80
90
100
By a student By faculty/staff
Percen
tage of U
ndergrad
uate Stude
nts
Men
Women
41

Potentially Harassing Experiences: Graduate Students
42
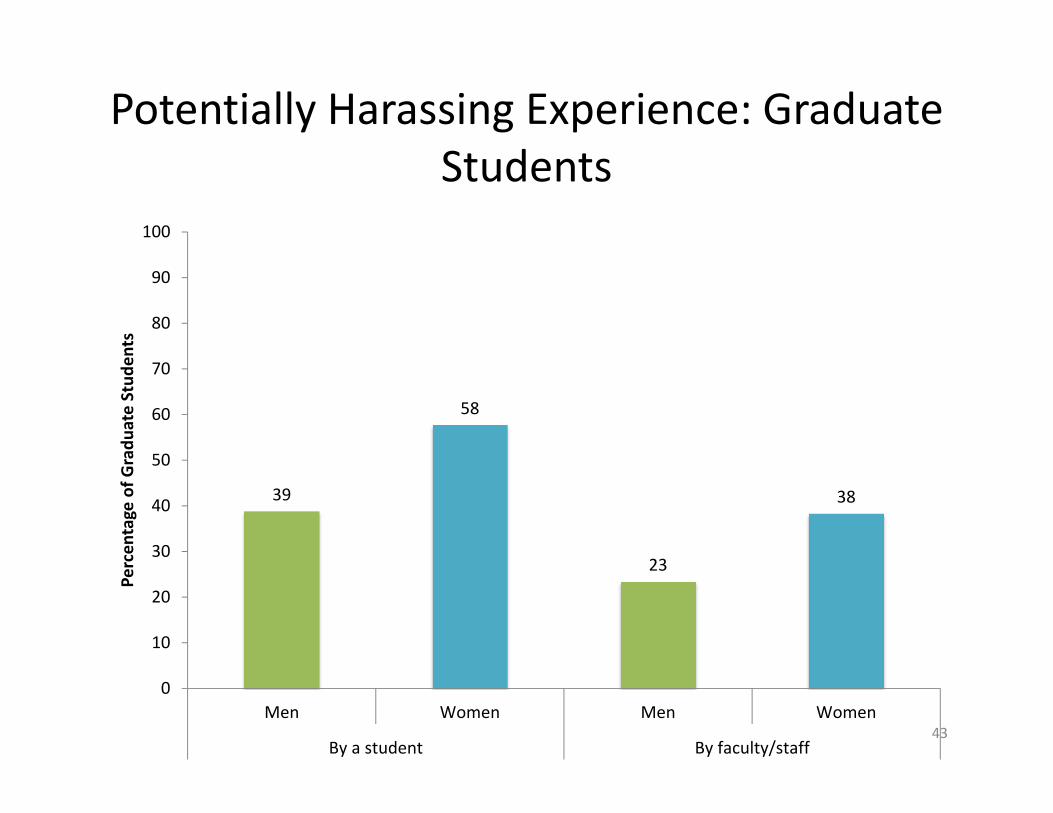
Potentially Harassing Experience: Graduate Students
39
58
23
38
0
10
20
30
40
50
60
70
80
90
100
Men Women Men Women
By a student By faculty/staff
Percen
tage of G
radu
ate Stud
ents
43

Findings
c. Graduate Student Victimization Patterns
44

Different pattern of victimization for undergrads versus graduate students?
45
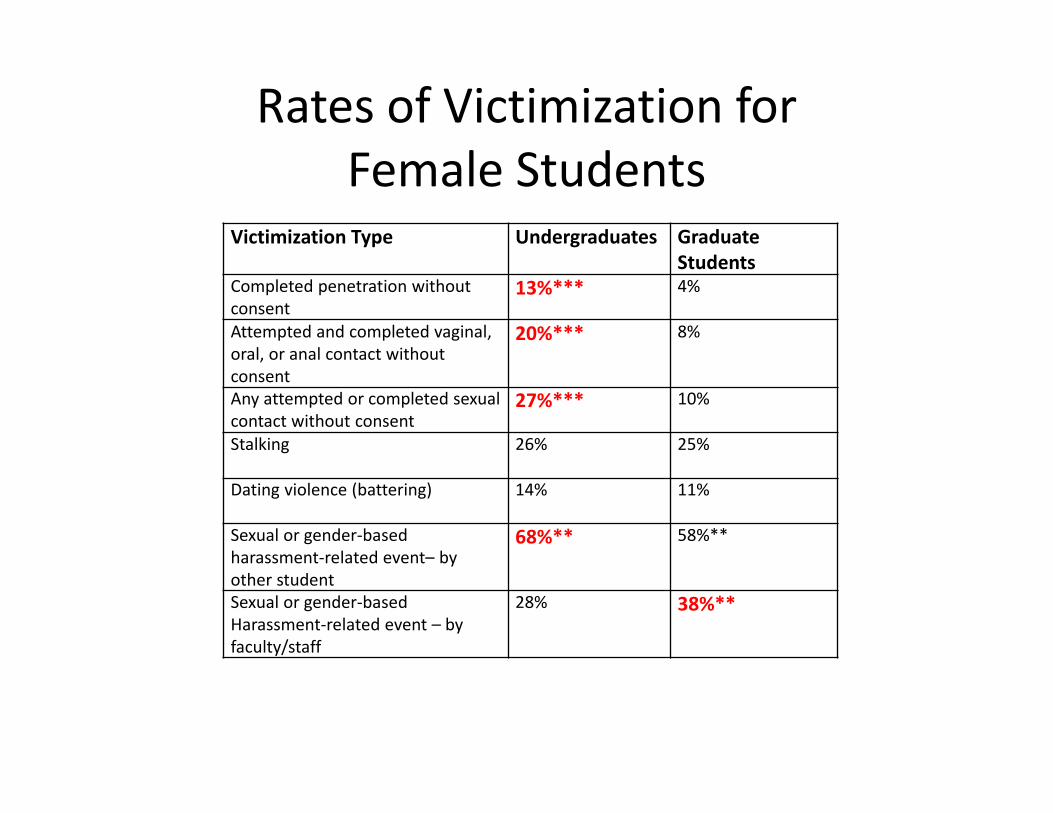
Rates of Victimization for Female Students
Victimization Type Undergraduates GraduateStudents
Completed penetration without consent
13%*** 4%
Attempted and completed vaginal, oral, or anal contact without consent
20%*** 8%
Any attempted or completed sexual contact without consent
27%*** 10%
Stalking 26% 25%
Dating violence (battering) 14% 11%
Sexual or gender‐based harassment‐related event– by other student
68%** 58%**
Sexual or gender‐based Harassment‐related event – by faculty/staff
28% 38%**
The high rates of harassment related experiences reported by graduate students also
prompted us to take a closer look: does graduate degree program matter?
47

Potentially harassing experiences for graduate students by degree program
48
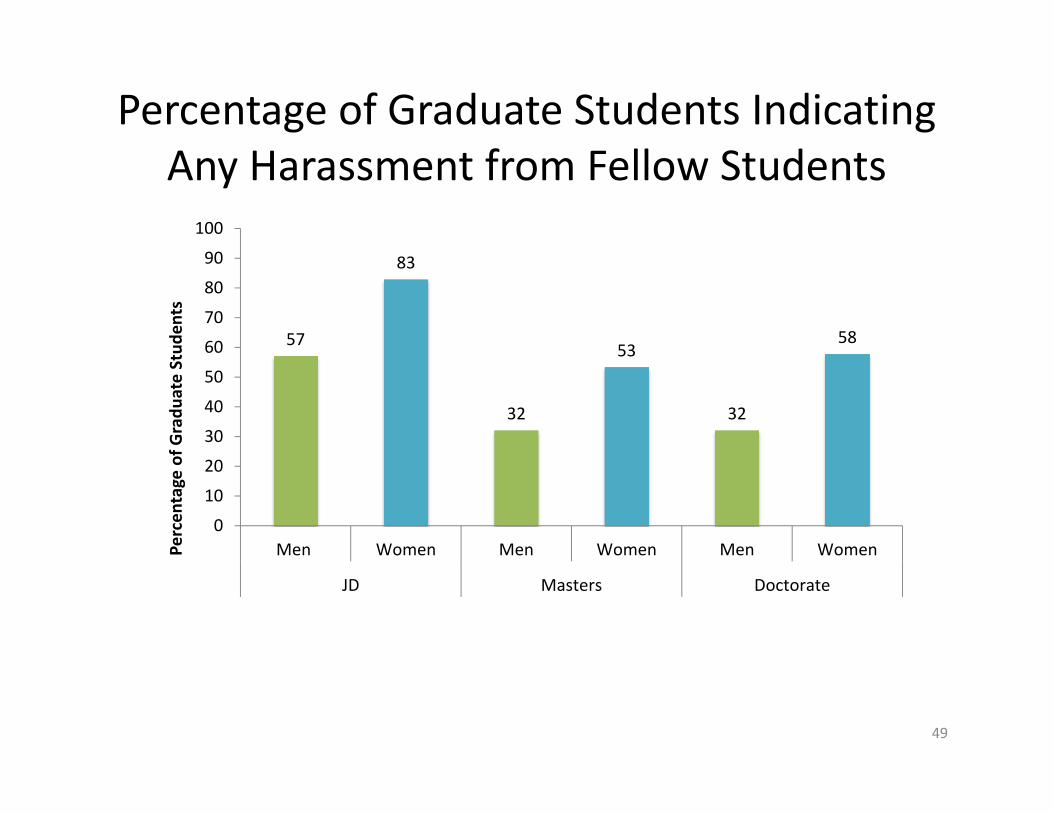
Percentage of Graduate Students Indicating Any Harassment from Fellow Students
57
83
32
53
32
58
0
10
20
30
40
50
60
70
80
90
100
Men Women Men Women Men Women
JD Masters Doctorate
Percen
tage of G
radu
ate Stud
ents
49

Percentage of Graduate Students Indicating Any Harassment from Faculty or Staff
26
57
2631
22
44
0
10
20
30
40
50
60
70
80
90
100
Men Women Men Women Men Women
JD Masters Doctorate
Percen
tage of G
radu
ate Stud
ents
50
What about other victimization types – do JD students report more or less than other grad
students?
51

Victimization Experiences of Female Graduate Students
52
Victimization Type JD students Othergraduate students
Attempted or completed sexual contact without consent
17% 10%
Attempted and completed vaginal, oral, or anal contact without consent
14% 7%
Completed penetration without consent
9% 3%
Stalking 34% 24%
Dating violence 14% 11%
Sexual harassment – by other students
86%** 62%
Sexual harassment –by faculty/staff
63%* 44%
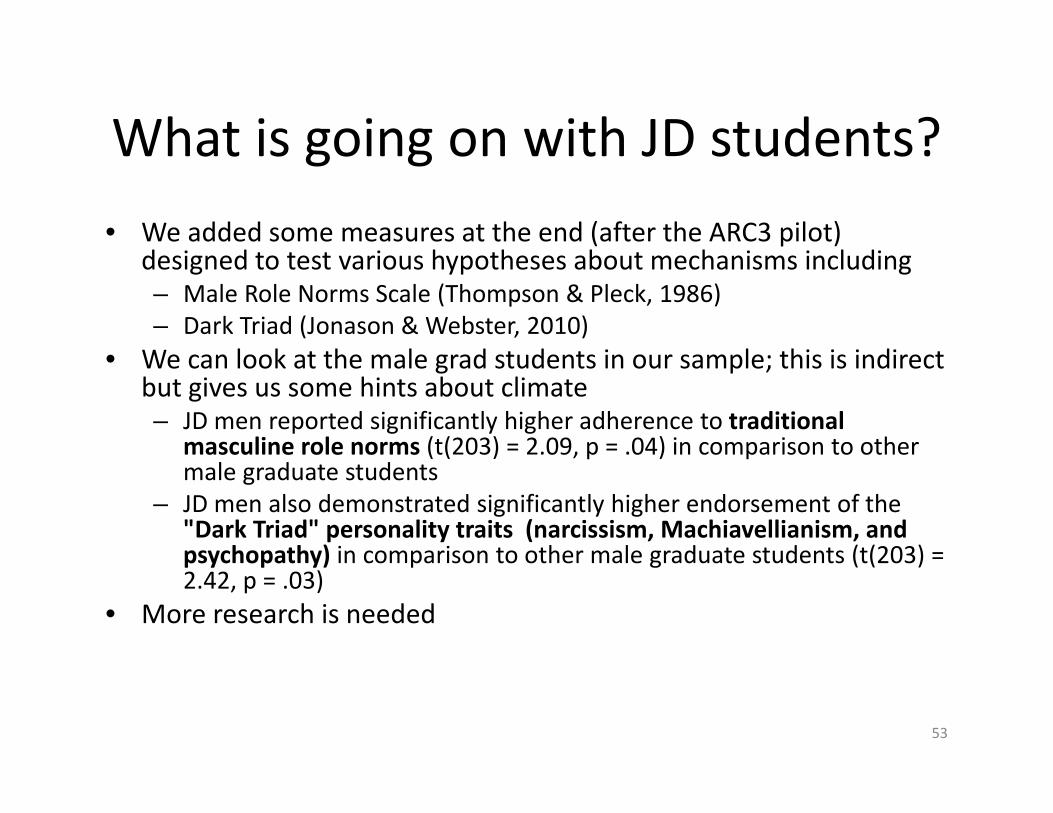
What is going on with JD students?• We added some measures at the end (after the ARC3 pilot)
designed to test various hypotheses about mechanisms including– Male Role Norms Scale (Thompson & Pleck, 1986)– Dark Triad (Jonason & Webster, 2010)
• We can look at the male grad students in our sample; this is indirect but gives us some hints about climate – JD men reported significantly higher adherence to traditional
masculine role norms (t(203) = 2.09, p = .04) in comparison to other male graduate students
– JD men also demonstrated significantly higher endorsement of the "Dark Triad" personality traits (narcissism, Machiavellianism, and psychopathy) in comparison to other male graduate students (t(203) = 2.42, p = .03)
• More research is needed
53

Findings
d. Student Awareness and Attitudes about Institution
54
Student Awareness and Attitudes about Institution
– unawareness of services– perception of institutional response– institutional support and betrayal– perceptions of safety
55

Student Unawareness of Services
56
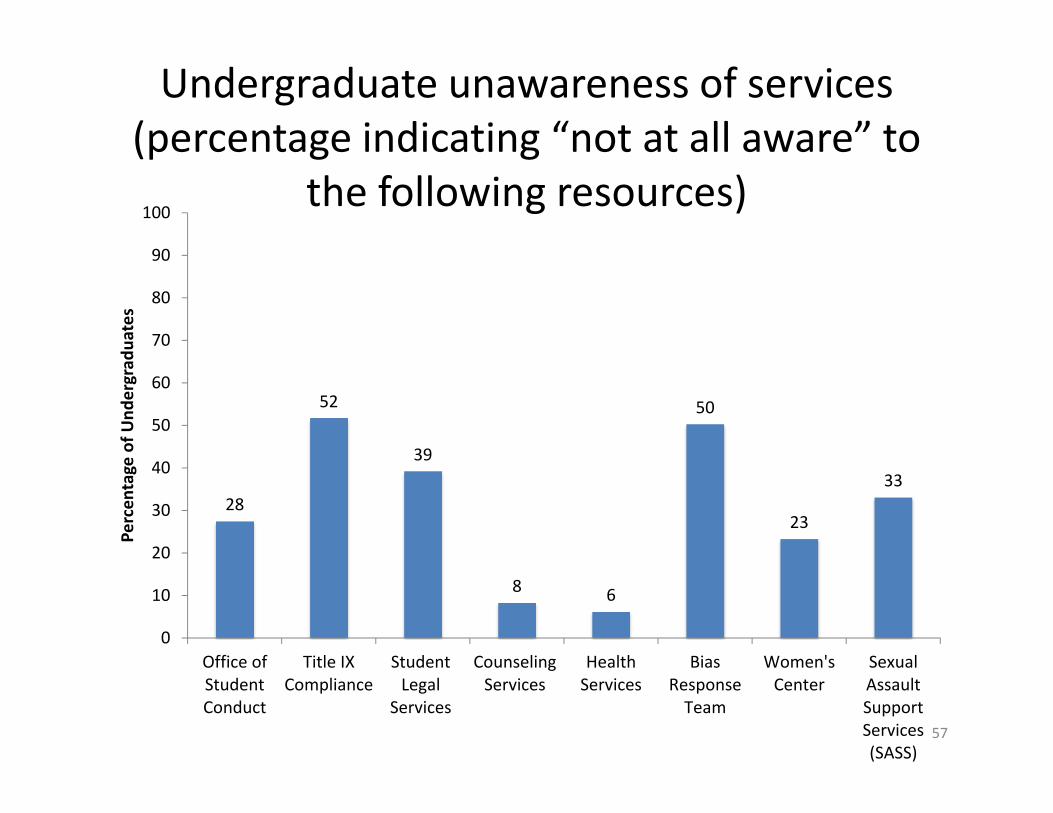
Undergraduate unawareness of services (percentage indicating “not at all aware” to
the following resources)
28
52
39
8 6
50
23
33
0
10
20
30
40
50
60
70
80
90
100
Office ofStudentConduct
Title IXCompliance
StudentLegal
Services
CounselingServices
HealthServices
BiasResponseTeam
Women'sCenter
SexualAssaultSupportServices(SASS)
Percen
tage of U
ndergrad
uates
57
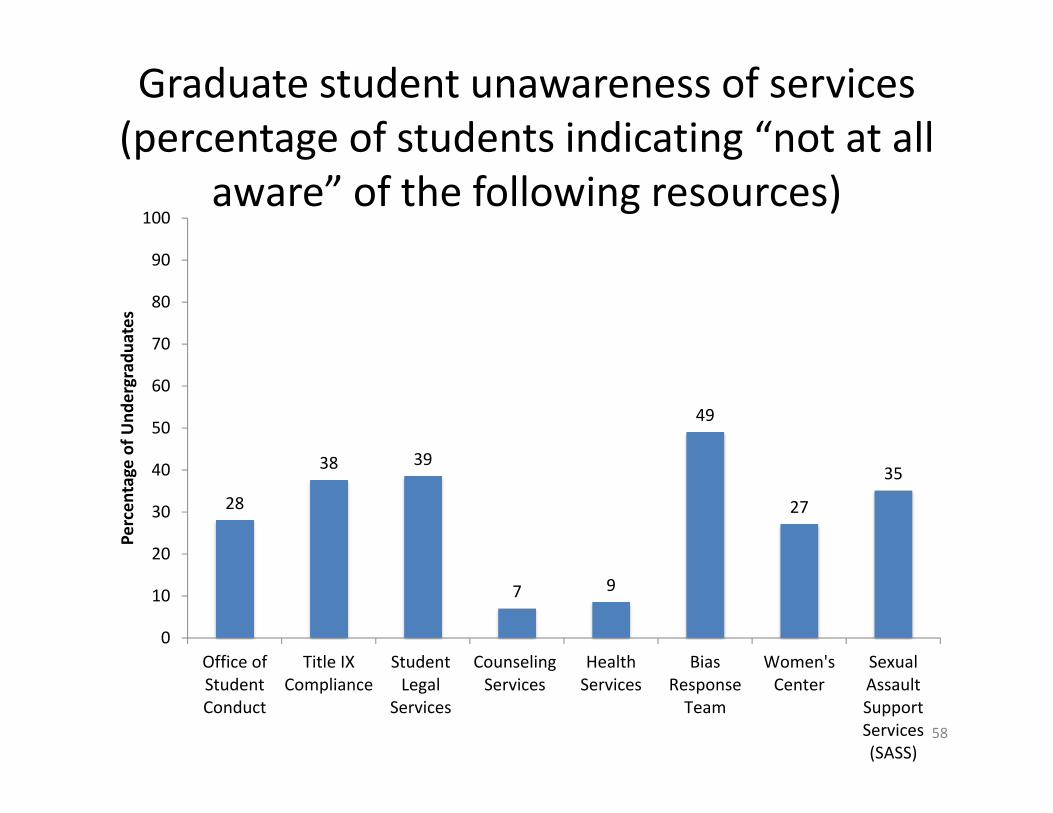
Graduate student unawareness of services (percentage of students indicating “not at all
aware” of the following resources)
28
38 39
7 9
49
27
35
0
10
20
30
40
50
60
70
80
90
100
Office ofStudentConduct
Title IXCompliance
StudentLegal
Services
CounselingServices
HealthServices
BiasResponseTeam
Women'sCenter
SexualAssaultSupportServices(SASS)
Percen
tage of U
ndergrad
uates
58
Student Perception of Institutional Response
59
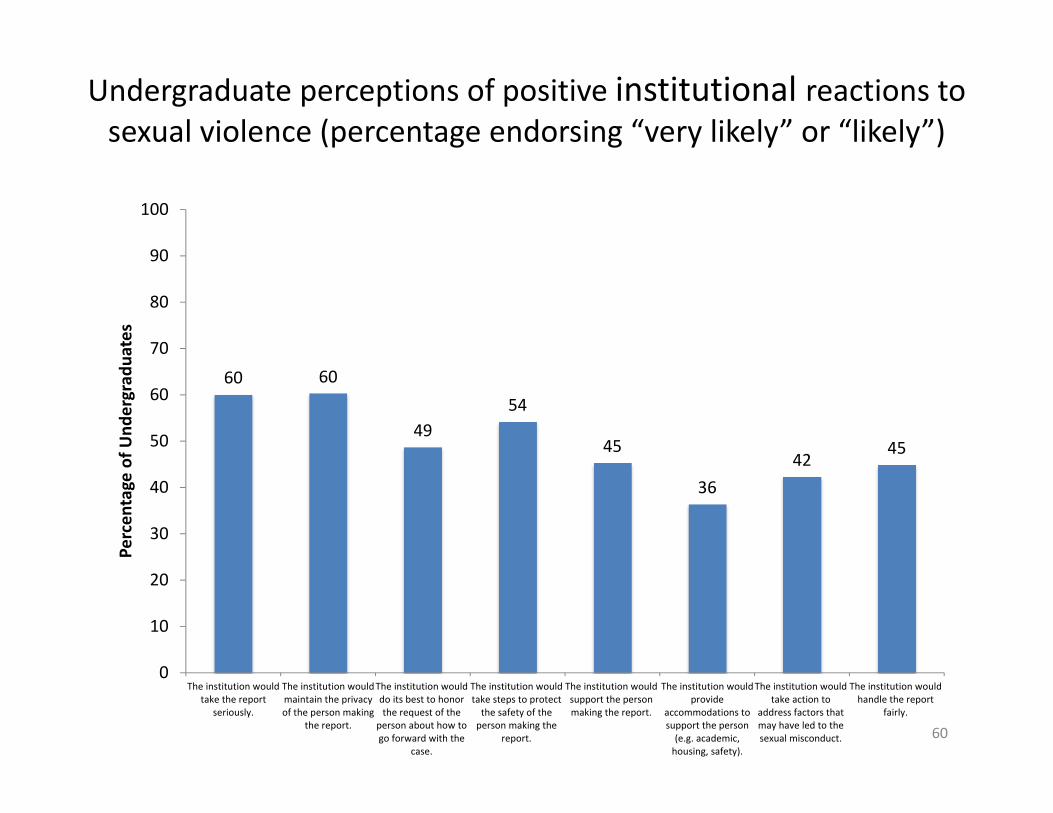
60 60
4954
45
3642
45
0
10
20
30
40
50
60
70
80
90
100
The institution wouldtake the report
seriously.
The institution wouldmaintain the privacyof the person making
the report.
The institution woulddo its best to honorthe request of the
person about how togo forward with the
case.
The institution wouldtake steps to protectthe safety of theperson making the
report.
The institution wouldsupport the personmaking the report.
The institution wouldprovide
accommodations tosupport the person(e.g. academic,housing, safety).
The institution wouldtake action to
address factors thatmay have led to thesexual misconduct.
The institution wouldhandle the report
fairly.
Percen
tage of U
ndergrad
uates
Undergraduate perceptions of positive institutional reactions to sexual violence (percentage endorsing “very likely” or “likely”)
60

17
26
11
0
10
20
30
40
50
60
70
80
90
100
The institution would label theperson making the report a
troublemaker.
The institution would have ahard time supporting the person
who made the report.
The institution would punish theperson who made the report.
Percen
tage of U
ndergrad
uates
Undergraduate perceptions of negative institutional reactions to sexual violence (percentage endorsing “very
likely” or “likely”)
61

Graduate student perceptions of positive institutional reactions to sexual violence
(percentage endorsing “very likely” or “likely”)
4641
2935
2620
2429
0
10
20
30
40
50
60
70
80
90
100
The institution wouldtake the report
seriously.
The institution wouldmaintain the privacyof the person making
the report.
The institution woulddo its best to honorthe request of the
person about how togo forward with the
case.
The institution wouldtake steps to protectthe safety of theperson making the
report.
The institution wouldsupport the personmaking the report.
The institution wouldprovide
accommodations tosupport the person(e.g. academic,housing, safety).
The institution wouldtake action to
address factors thatmay have led to thesexual misconduct.
The institution wouldhandle the report
fairly.
Percen
tage of G
radu
ate Stud
ents
62
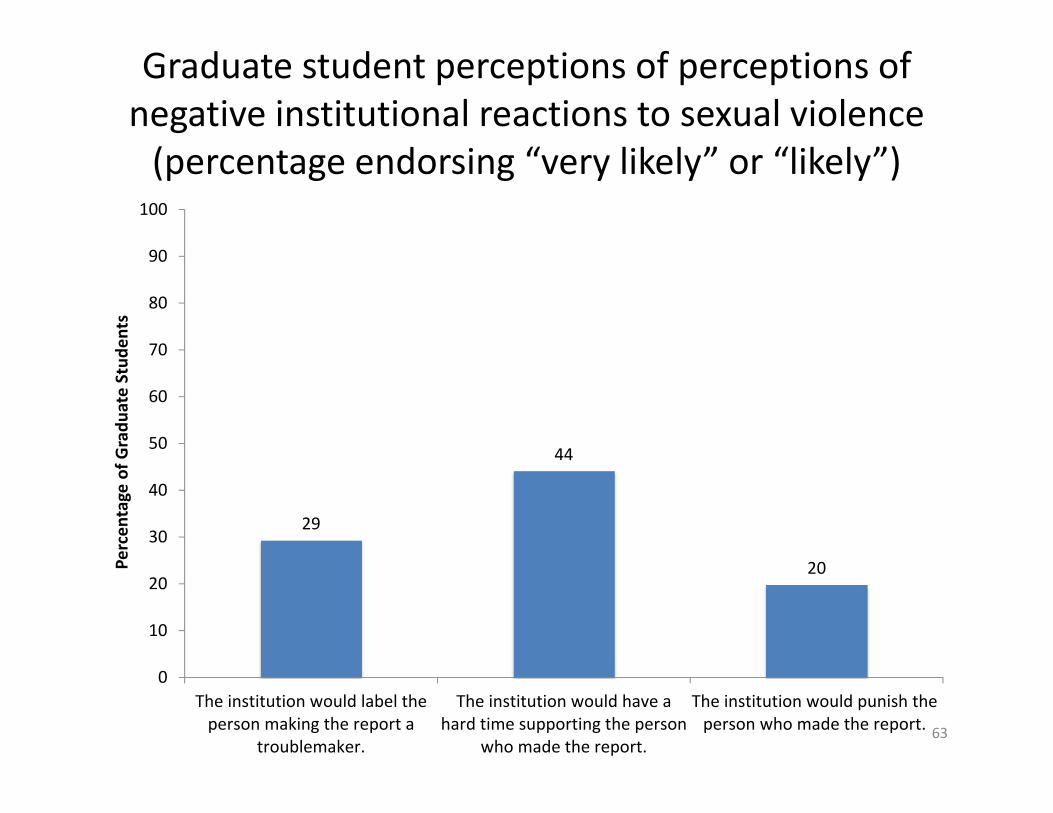
Graduate student perceptions of perceptions of negative institutional reactions to sexual violence (percentage endorsing “very likely” or “likely”)
29
44
20
0
10
20
30
40
50
60
70
80
90
100
The institution would label theperson making the report a
troublemaker.
The institution would have ahard time supporting the person
who made the report.
The institution would punish theperson who made the report.
Percen
tage of G
radu
ate Stud
ents
63
Experiences of Institutional Support and Experiences of Institutional Betrayal
64

Institutional Support and Institutional Betrayal
• Of those victimized
– 29% reported at least one form of institutional support or repair. (New to 2015)
– 44% of students reported at least one type of institutional betrayal. (Similar to 2014)
65

Student Perceptions of Safety
66

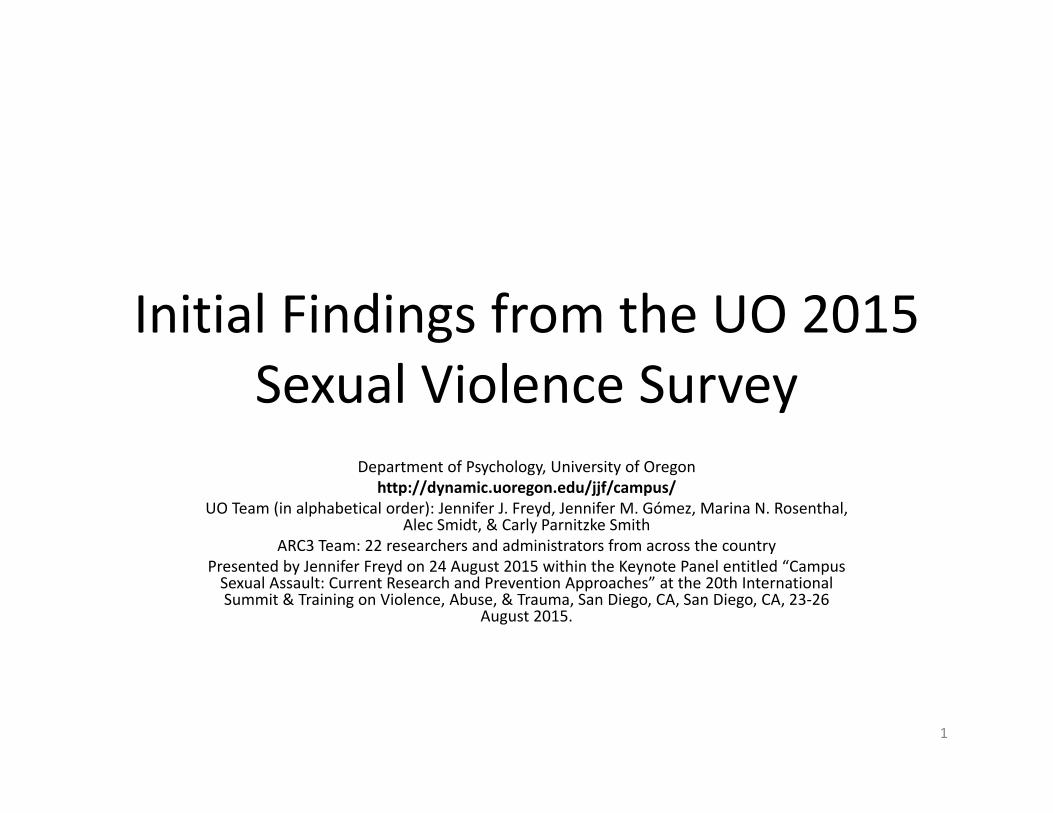
Undergraduates indicating “Agree” or “Strongly Agree” to the following
statements83
89 87
80
42
67
4853
0
10
20
30
40
50
60
70
80
90
100
On or around thiscampus, I feel safe fromsexual harassment.
On or around thiscampus, I feel safe from
dating violence.
On or around thiscampus, I feel safe from
sexual violence.
On or around thiscampus, I feel safe from
stalking.
Percen
tage of U
ndergrad
uates
Men
Women
67
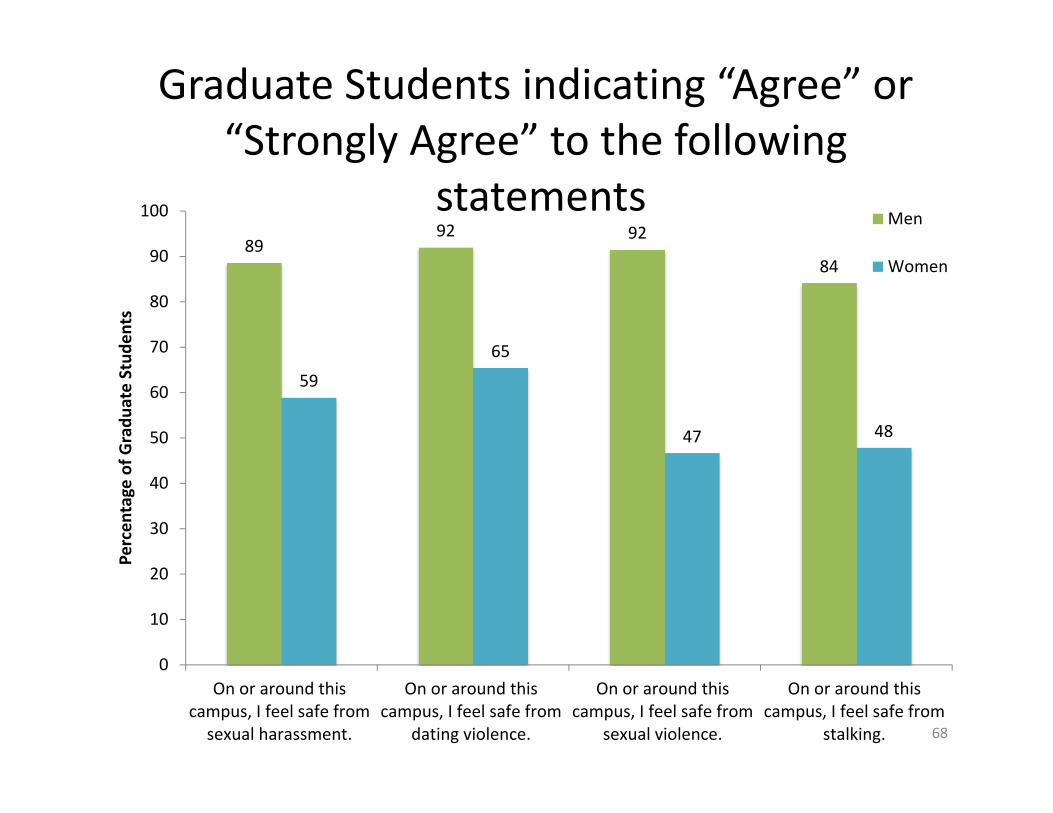
8992 92
84
59
65
47 48
0
10
20
30
40
50
60
70
80
90
100
On or around thiscampus, I feel safe fromsexual harassment.
On or around thiscampus, I feel safe from
dating violence.
On or around thiscampus, I feel safe from
sexual violence.
On or around thiscampus, I feel safe from
stalking.
Percen
tage of G
radu
ate Stud
ents
Men
Women
Graduate Students indicating “Agree” or “Strongly Agree” to the following
statements
68

4. Summary of Key Findings, Limitations, Future Directions
69
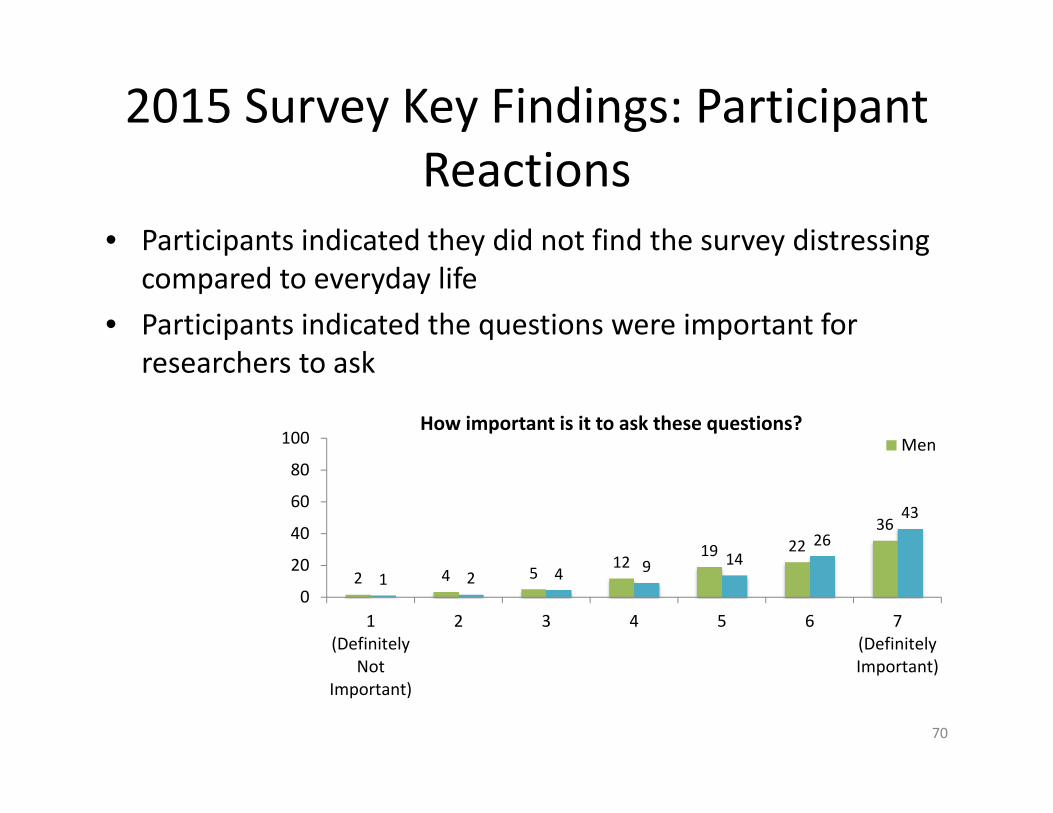
2015 Survey Key Findings: Participant Reactions
• Participants indicated they did not find the survey distressing compared to everyday life
• Participants indicated the questions were important for researchers to ask
70
2 4 512
19 2236
1 2 4 9 1426
43
0
20
40
60
80
100
1(Definitely
NotImportant)
2 3 4 5 6 7(DefinitelyImportant)
How important is it to ask these questions? Men
2015 Survey Key Findings: Victimization
• The 2015 Survey largely replicated the 2014 Survey for sexual assault and rape – about 20% of female undergraduates are victims of completed or attempted rape at the UO.
• The 2015 Survey also reveals high rates of sexual and gender‐based harassment‐related events, stalking, and dating violence (battering) for female students.
• Graduate students and undergraduate students show different patterns of victimization. . .
71

Rates of Victimization for Female Students
Victimization Type Undergraduates GraduateStudents
Completed penetration without consent
13%*** 4%
Attempted and completed vaginal, oral, or anal contact without consent
20%*** 8%
Any attempted or completed sexual contact without consent
27%*** 10%
Stalking 26% 25%
Dating violence (battering) 14% 11%
Sexual or gender‐based harassment‐related event– by other student
68%** 58%**
Sexual or gender‐based Harassment‐related event – by faculty/staff
28% 38%**
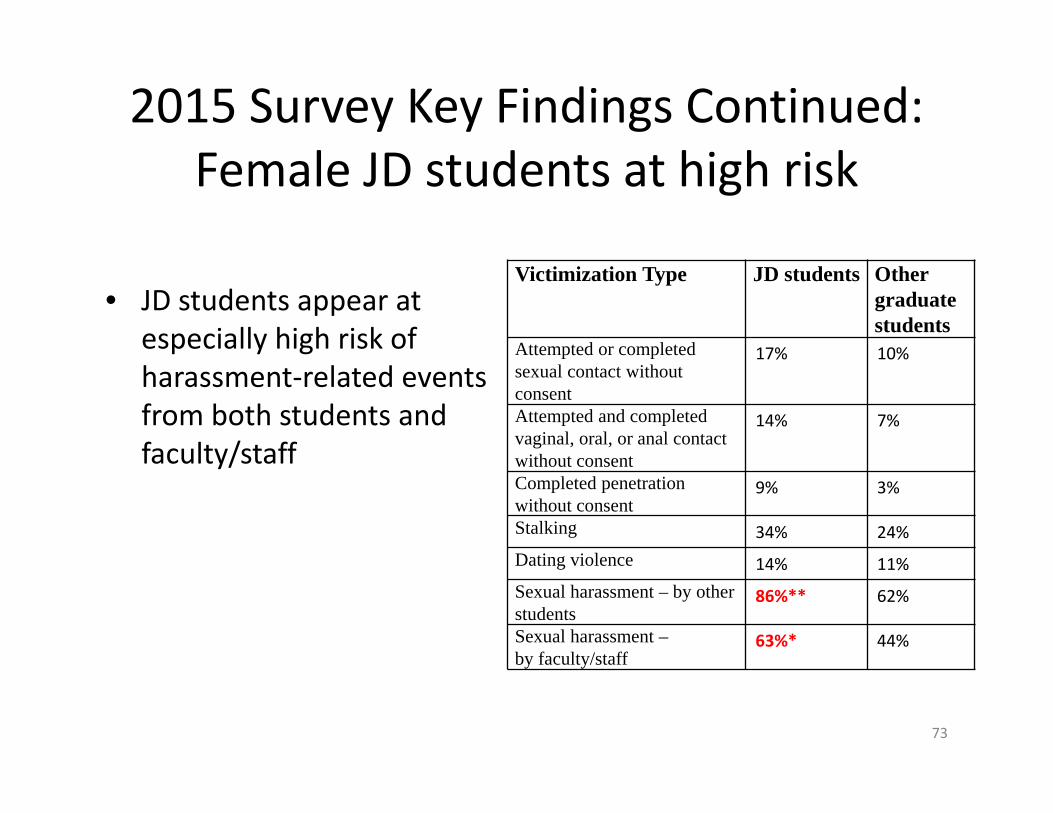
2015 Survey Key Findings Continued: Female JD students at high risk
• JD students appear at especially high risk of harassment‐related events from both students and faculty/staff
73
Victimization Type JD students Othergraduate students
Attempted or completed sexual contact without consent
17% 10%
Attempted and completed vaginal, oral, or anal contact without consent
14% 7%
Completed penetration without consent
9% 3%
Stalking 34% 24%Dating violence 14% 11%Sexual harassment – by other students
86%** 62%
Sexual harassment –by faculty/staff
63%* 44%
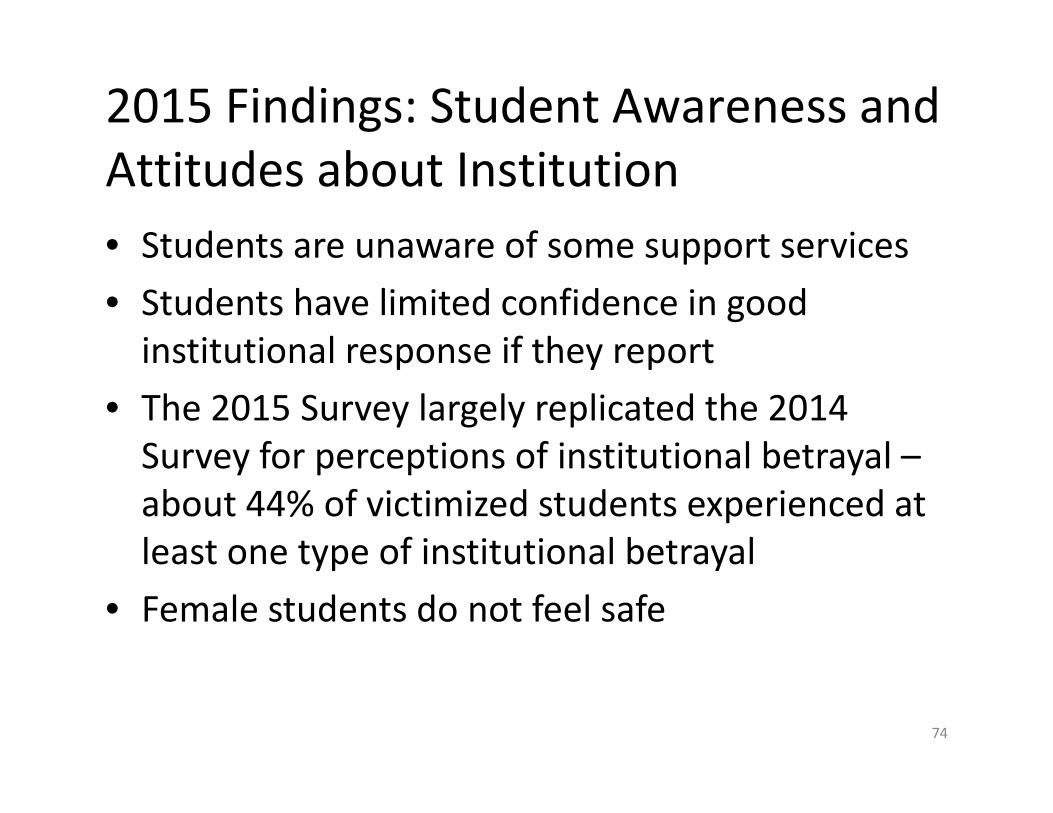
2015 Findings: Student Awareness and Attitudes about Institution• Students are unaware of some support services• Students have limited confidence in good institutional response if they report
• The 2015 Survey largely replicated the 2014 Survey for perceptions of institutional betrayal –about 44% of victimized students experienced at least one type of institutional betrayal
• Female students do not feel safe
74
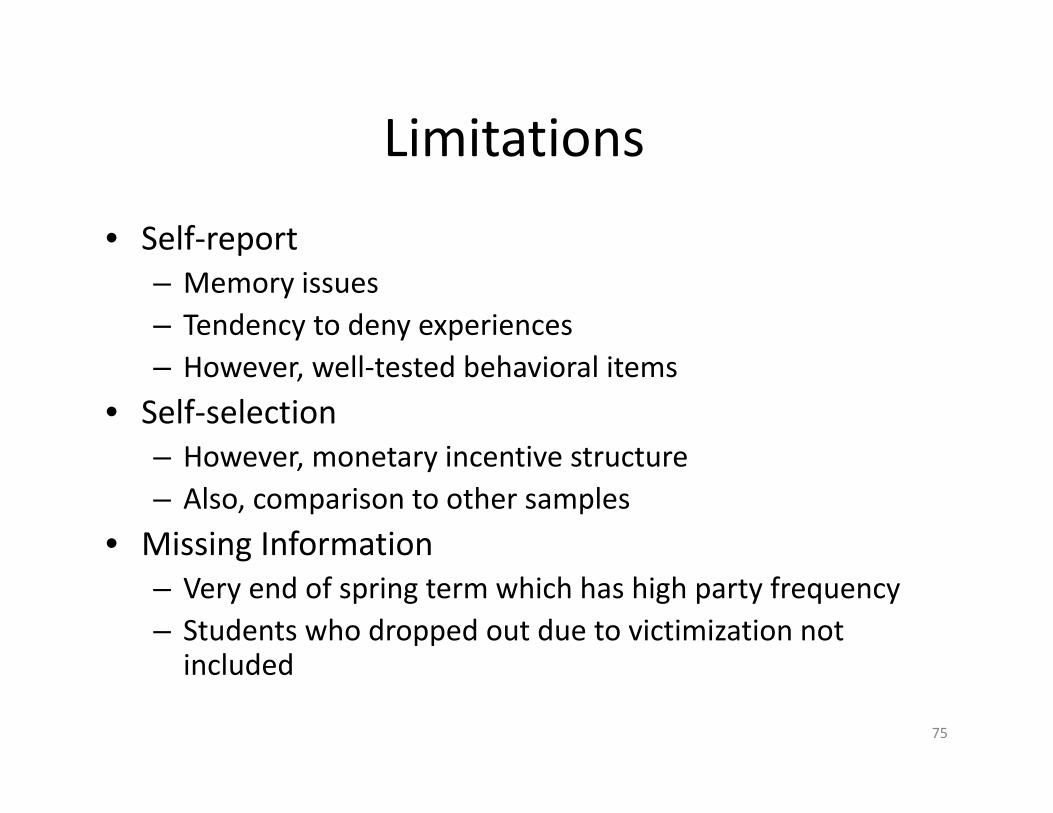
Limitations
• Self‐report– Memory issues– Tendency to deny experiences– However, well‐tested behavioral items
• Self‐selection– However, monetary incentive structure– Also, comparison to other samples
• Missing Information– Very end of spring term which has high party frequency– Students who dropped out due to victimization not included
75
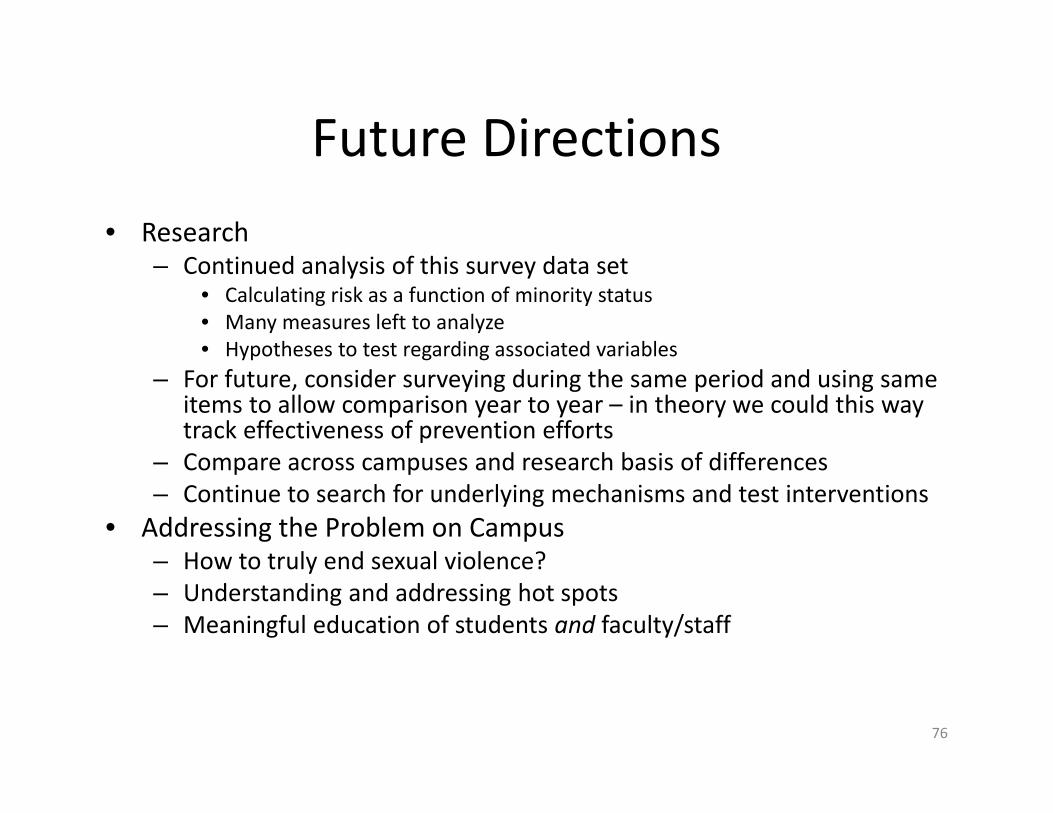
Future Directions• Research
– Continued analysis of this survey data set• Calculating risk as a function of minority status• Many measures left to analyze • Hypotheses to test regarding associated variables
– For future, consider surveying during the same period and using same items to allow comparison year to year – in theory we could this way track effectiveness of prevention efforts
– Compare across campuses and research basis of differences– Continue to search for underlying mechanisms and test interventions
• Addressing the Problem on Campus– How to truly end sexual violence? – Understanding and addressing hot spots– Meaningful education of students and faculty/staff
76