Embed Size (px)
Citation preview


Summer 2016 / Maplines • 3Visit the BCS website at www.cartography.org.uk
Hello all, as I write this, we have just celebratedBedford’s 850th year as a Chartered Borough,with a celebration in the form of a River
Festival. Over 200,000 people came from all aroundthe world to attend! OS has celebrated 225 years andA-Z 80 years! And the UK now has a Geographer forPrime Minister – “Theresa May: the highest achieverof all in the starry, Oxford University Geography classof ’74” quips The Telegraph.
As the school year has come to an end, anxiousstudents will be awaiting GCSE, A-Level and Degreeresults. An increase in Geography GCSE by over3000 students per year totalled the number ofstudents taking the exam in 2015 to 228,075. A-levelwas at just over 37,000 and there are more than 80universities in the UK offering over 1400 Geographyrelated degrees – at any time there are almost300,000 students studying geography full or part-time.
So Geography is on the rise in popularity again.How can we help? As geographers and
cartographers, we can help explain difficult subjectareas to students, we can tell them about what wedo for a living and we can answer questions theymight have. The best question I was asked at aRestless Earth was “Miss, how much do youearn?” I answered truthfully and said I haveearned x and now I’m earning y, but my life ismore enriched with passing on my knowledgethrough Restless Earth.
This edition is packed full of what we love – articlesfrom our members. Thank you to all and if you areinterested in getting what you are doing out there,submit an article and some pictures!!
We have the joint BCS SOC conference in September– if you haven’t already booked a form is in themiddle of this edition for you to complete and return.We look forward to seeing you all there! Happysummer!
Alice, Louisa, Jasmine, Humian, Oliver and MartinMaplines Editors
2 • Summer 2016 / Maplines Visit the BCS website at www.cartography.org.uk
From the Editors
Welcome to the new look ofthe BCS! Our new websiteand logo were launched
successfully at the GEO Businessexhibition in London on 24th and 25thMay, amidst the throng of over 2,200visitors from some 50 countries. TheBCS had a strong presence at ourstand and throughout the rest of theexhibition and I want to extend mythanks to all our members who cameto support us, whether by manning ourstand or by saying hello; it was goodto see you there.
Our new website signifies a major stepforward in how the Society presentsitself to the world and it also offersnew opportunities for the Society andits members to interact. If you havenot yet had a chance to see the goodwork at www.cartography.org.uk, Iheartily encourage you to do so.Remember that you can renew yourBCS membership, sign up for events,purchase publications, and much morevia its fresh and inviting new design.We are also looking at being able tooffer online voting for the AGM, forthose who would find this moreconvenient. More details will followonce we establish a robust system onour website, but there will always bethe option to vote by post or in personat the AGM for those who prefer.
Many have been involved in thecreation and development of the newwebsite since the project was initiatedunder Pete Jones’s Presidency and Ishould like to thank all those who havecontributed in any way; in particular,Martin Lubikowski, Chair ofPublications, for overseeing the projectfor the Society, to Lewis Cave, from
Win Marketing, for his expertise anddiligence, to BCS Council membersand SIG Conveners who haveprovided new content, and to StephenBooth from PV Publications for hisassistance in the run up to the launch.We must not forget that our websiteneeds to evolve as the Society evolves– our ‘shop window’ should always befit for purpose – so feedback is alwayswelcome as we continue to promotethe art, science and technology ofmapmaking in this way.
The development of our new websitebrought the ideal opportunity toreconsider the overall image of the BCSand the possibility to coordinate itslaunch with a wider rebranding of theSociety. The aim was to arrive at asolution that would provide a bold,contemporary and professional feel thatwould reflect the Society’s relevance tonew generations of mapmakers andwork with our full range of printed andonline media. The challenge wouldrequire a truly collaborative effort and adesign team comprising Mary Spence,Martin Lubikowski, Giles Darkes andmyself was formed at the end of 2015with the task of drawing up someoptions for Council to consider.
The process began with a redesign ofthe cover of The Cartographic Journal,which incorporated a new font(Gotham) and a new logo for theSociety. Gotham is a modern, confidentand friendly typeface, chosen for itsability to epitomise the clarity ofexpression which lies at the heart ofeffective cartographic communication.The logo, which is an evolution of adesign by Mary Spence, updates ourtraditional and recognizable form of the
quadrant for use in a modern contextand continues to use blue, a colourwith which the Society has a strongassociation. Many potential newstraplines were put forward anddiscussed by Council, with ‘promotingmaps and mapmaking’ chosen as thebest for summarising our aims andrepresenting our membership whilealso communicating who we are andwhat we do to non-members mostclearly. After considering all feedbackthe design team produced a revisedset of designs and associatedguidelines, which were approved byCouncil on 19th April.
We have worked hard to create a newlook for the BCS which meets our initialaims and this would not have beenpossible without the expertise, timeand patience of those involved. Mary,especially, has worked tirelessly toimplement the new branding acrossour whole range of publications(including, as you will have noticed,the splendid new cover for Maplines)and other items to ensureconsistency, and we all owe her ourthanks. Contributions to Maplines arealways welcome and present a realopportunity to get your project outthere, so don’t delay – get in touchwith the editorial team!
A Message from the President
ContentsThe Magazine of the British Cartographic Society (Registered Charity No. 240034)
Volume 27, 2nd Issue – Summer 2016
Maplines Regularsp.05 Events Calendarp.08 Admin & Corporate Reportp.15 Omnium Gatherump 19 UKCC Report
Also in this issue. . .p.05 Mapping Togetherp.09 Geo Business 2016p.11 BCS - SOC Conferencep 18 The World from on Highp.20 Information Geographyp.24 The Three Peaks Challenge
Advertising in MaplinesConsider this a shop window to promote your company, event,course or publication to the mapping community.
To submit editorial, contact the Editors:[email protected]
For display advertising, contact Sharon Robson:[email protected] or +44 (0)1438 352617
All photography and illustrations in this issue have been provided toMaplines by the article authors unless stated otherwise. Allcontributors to Maplines are responsible for assuring that they havepermission to use images and content. Please addcredits/acknowledgements as appropriate."
Editorial Contact Details:Senior Editors: Martin Lubikowski, Louisa Keyworth &Alice Gadney
Editors: Jasmine Walsh, Ollie Madgwick & Humiun Miah
Deadline for copy for the Winter 2016edition is 17 October 2016.
The views expressed in Maplines arethose of the Editors and Contributors and not necessarily those ofthe BCS.
© The British Cartographic Society 2016
Publishers: Geomares Publishing UK Ltd2B North Road, Stevenage, Hertfordshire SG1 4ATwww.pvpubs.com
Hand-made MapsCaroline Robinson tells allabout David Atkinson and hisunique hand-made maps.
4
A-Z MapsThe 80 years history of theA-Z Atlas is uncovered bySteve Berger.
6
A Long, Long ElectionA map of the upcoming USelection has been createddetailing how Trump can win.
10
225 Years of OSTwo maps have been createdfor OS’s 225 anniversaryexplains Christopher Wesson.
16
If you would like to sponsor a Maplines Quiz please contact theEditors for more information.
An update on the latestRestless Earth workshop co-ordinated by Alice Gadney.
22Restless Earth 2015-2016
Continued on page 15. . .
Dr Alex Kent
Printing: The Manson Group, St Albans

In a quiet street in London is oneof the nicest illustration studiosI’ve ever seen. Behind the blinds
and the windows are shelves whichare stacked, bulging with books onillustration, art and maps. Thereare a good few tables and lamps, aguitar and a piano. A studio of anillustrator rock star.
David has kindly welcomed me intohis studio and shows me around,with a cup of tea in one hand and alittle dog at his feet. He worked forseveral universities as a lecturerbefore setting up his company,Hand Made Maps Ltd, in 1988.David is one of those amazingpeople who can draw in any style -using various techniques - mixinghand-drawn with computer artwork.All of his works look completelydifferent. He believes that this
technique and content creates aunique style which he loves.
“The way I work with mixed andunusual materials mostly results insomething different and surprising.The surface of the earth is theresult of chance and accident, andout of this randomness emerges achaotic beauty. As in WilliamBlake’s famous poem – ‘to see theworld in a grain of sand’.”
David has been fortunate enough towork with some of the biggestadvertising agencies in the worldmaking maps, as well as forMichael Palin’s ‘Round the World in80 Days’ and ‘Pole to Pole’. Heworks hard to give each map atactile, human and touchableaspect, while moving the artformtowards the twenty-first century. Hislettering is so well drawn by hand,that some graphic designers haveasked if they can have the font!
He tries to use old techniqueswhen he can, but using computers
allows him to store images as wellas piece them together, like inthis beautiful map mural (above)of the world for the TransReInsurance Company in New York.
This glorious 30ft long map showsthe types of disasters that canoccur around the world, whichDavid researched beforecompiling the map. Pretty handyfor an insurance company,however I am sure that it isslightly unnerving for any visitors.
His work sings of craft and a loveof maps, and I am sure that hewill have even greater works toshow in the future.
You can find him in the recentbook “The Art of Illustrated Maps:A Complete Guide to CreativeMapmaking’s History, Process andInspiration” by John Roman,published by How Design Books oronline at www.handmademaps.com
By Caroline Robinson
Creative Mapping
4 • Summer 2016 / Maplines Visit the BCS website at www.cartography.org.uk
TThhee KKiinngg ooff HHaanndd--mmaaddee MMaappssDavid Atkinson, Illustrator, shares his
44 years of rock ‘n’ roll illustrative maps
Left & Inset: Davidworking hard at his desk.
Events Calendar 2016 - 2017
Visit the BCS website at www.cartography.org.uk Summer 2016 / Maplines • 5
August18 Aug HMMG Visit RAF•Northolt, AIDU, Air HistoricalBranch, Sector Ops and PolishWar Memorial (John Peaty)
September6 Sep Better Mapping with•ArcGIS with Ken Field6 Sep BCS President’s Golf•Competition, Lilley Brook GolfClub, Cheltenham, tee times13:27 and 13:36 (Peter Jolly)6-8 Sep BCS Annual•Symposium with SoC,Cheltenham Park Hotel15-16 Sep MCG Meeting, NLS,•Edinburgh (Charles CloseSociety invited) (Ann Sutherland)20 Sep 10:30-13:00 BCS•Membership and ProgrammeCommittee Meetings,Prospect House20 Sep 13:30-16:30 BCS Council•Meeting, Prospect House26 Sep Restless Earth,•Birmingham27 Sep 16:00-18:00 Restless•Earth, Wimbledon
October5 Oct Restless Earth, South•Shields6 Oct Restless Earth,•Sunderland6 Oct GeoData Scotland,•Edinburgh11-12 Oct Restless Earth,•Bradford-on-Avon17 Oct Restless Earth,•Dartford18 Oct Restless Earth,•Pewsey Vale19-23 Oct Frankfurt Book Fair•21 Oct Great Engineers•Conference HQ RE Chatham
November2 Nov Better Mapping at•Ordnance Survey (Paul Naylor,Mary Spence)8 Nov 11:00-13:00 BCS•Membership and ProgrammeCommittee Meetings, HodgesRoom and Study at RAF Club,128 Piccadilly, London8 Nov 13:00-15:00 BCS Fellows’•Drinks/Lunch, Cowdrey & HodgesRooms, RAFC (need to book)
8 Nov 15:00-15:30 Break•8 Nov 15:30-17:00 BCS Annual•Lecture, ‘Cartography – SovietStyle’ by John Davies,President’s Room, RAFC8 Nov 17:00-18:30 AGM•President’s Room, RAFC9 Nov 10:00-13:30 BCS Council•Meeting at Prospect House15 Nov Restless Earth, Banbury•
December1 Dec GeoData London•15 Nov Restless Earth,•Cranfield, Bedfordshire
JanuaryBCS Committee & Council meetings•24-25 Jan DGI London•UK Geo Forum Annual Lecture•
AprilBCS Committee & Council meetings•18-21 Apr GISRUK, University•of Manchester20-21 Apr GA Conference,•University of Surrey, Guildford
Having successfully beenawarded a student bursaryfrom the British Cartographic
Society in 2015, I was fortunateenough and excited to attend theannual conference that broughttogether the British CartographicSociety and Society of Cartographersin York that September.
I began the ‘Mapping Together’conference with a welcome talk bythe BCS and the SoC in themorning, followed by two workshopsin the afternoon. Being able to selecta workshop that suited my interestswas extremely insightful and afantastic opportunity to be able towork alongside fellow mappers andcartographic professionals. Thevariety of talks that followed theworkshops were both veryinteresting and informative, allowingme to take notes and extend myknowledge. After each talk, therewas ample opportunity to share anddiscuss everyone’s opinions and
reflections; this time was extremelybeneficial for me.
The Awards Ceremony that followedthe Gala dinner was the highlight ofthe conference in York for me. Itwas a great opportunity to networkwith everyone at the conference inan informal, non-intimidating andrelaxed environment. In addition, itwas very useful to gain newcontacts in the field in which I wouldlike to pursue a career.
Day two gave me a further chanceto learn more from the talks andworkshops that I attended. Listeningto Danny Dorling’s thought-provoking presentation on mappingthe UK elections of 2015 and thetalk ‘Maps on Apps’ delivered an up-to-date approach. I was fortunateand grateful to be provided withexciting case studies that I coulduse to support my GIS module aspart of my Geography degree.
My experience at the conferencewas extremely rewarding. In addition,
being able to include this opportunityon my CV and discuss it ininterviews has helped me to securea place at University College Londonto study for a Master’s course inGeographical Information Science.Following the conference, I joinedthe British Cartographic Society asan Associate Member and am verymuch looking forward to attendingfuture workshops with the society, aswell as making the most out of thebenefits that membership has tooffer. I would strongly encouragestudents to apply for a bursary toattend the conference in future; theinvaluable experience and excitingopportunity gave me a new level ofmotivation to continue with mypassion for cartography.
Mapping Together
Amy Palmer

replacements from their colleaguesfor lost or damaged letters.
In the 1980s, mapping productionwas further improved by the latestinnovation in scribing tools whichcould be used for street mappingfor the first time.
Phyllis was awarded the MBE in1986, around the same time thatcomputer typesetting replaced phototypesetting, with two dedicatedoperators now taking on theresponsibility for the letter production.
The greatest production revolutionwas to occur in 1990 as the firstCAD/CAM Unix computers wereinstalled into the drawing office.Even in the early days, theadvantages were obvious, andvery quickly this evolved intowindows-based PCs usingdrawing software. One of the newchallenges was to use thistechnology to create the mapwhilst still retaining the style thatmade the A-Z so unique and easyto read from the very beginning.
In 1996 the company celebrated its60th year with a trip to Eurodisney,with Phyllis surrounded by thepeople she always considered asher family. She passed awayshortly after, on the 28th August,exactly 60 years to the very daysince the company was founded.
The next decade opened with thecompany using the most advancedtechnology available to producepublications. Computer-to-plate
was the next step forward, againadvancing production significantly.Using this method, the drawingoffice managed to send out 164jobs in a single year in 2005, andthe company had record salesover this time.
Computers were to see othersignificant developments in theindustry with the arrival of satellitenavigation and the availability offree internetmapping. Thequality of boththese technologicaladvances was tosteadily increaseas the demand forpaper productionrapidly declined.This ultimatelylead to arestructure of thebusiness in 2013, but with thewords and ideals of Phyllis deeplyentrenched into the new structure.
So where to now? Well, Phyllishad a saying she was rather fondof, and one that summed up herbusiness approach, and that was‘on we go’ so we are doingprecisely that. The nature of thebusiness is evolving with themarket, and we are now producingdigital data, and giving both thebusiness user and high streetcustomer exactly what they wantand need. Our digital offeringgrows rapidly as we are a longway along the process of creatingthe digital A-Z of the UK, aproduct we simply call A-Z Street.
A-Z Street, already in use byLondon Air Ambulance, as well as
Government organisations, providesflexible but familiar mapping, andwe will be maintaining the most upto date, detailed and easy to readUK mapping source available atstreet level. Add to this the range ofcustom products available fromwallpaper to large format atlases,not forgetting a range of licencedbrand products from Ben Shermanclothing to jigsaws, and we have somuch to offer.
How everyone uses the map haschanged, and we’ve changed withit. Every individual now expectsto be the centre of their map, anddigital and custom mapping
allows for this. We are now alsoable to offer previouslydiscontinued titles as print-on-demand products, which hasmeant the return of our London 9-sheet maps, now available fromour website.
The future is there for us – webelieve that mapping is more apart of life than ever before, andthere will always be a demand forthe supply of maps in changingformats. The continuingdevelopment of mapping toolsdrives the industry forward intouncharted territory, and we lookforward to seeing where thejourney takes us for the next 80years. On we go indeed.
By Steve Berger, Joint ManagingDirector, Geographers' A-Z Map Co Ltd
Historical Mapping
Visit the BCS website at www.cartography.org.uk Summer 2016 / Maplines • 7
Although the history of A-Zspans 80 years, the story ofthe company began in 1900
when a young Hungarian,Alexander Gross moved to Londonseeking his fortune (and avoidingconscription). Alexander foundedGeographia Ltd in 1908, andproduced a series of World Atlases,followed by war maps and aviationmaps. These maps would providehim with the financial security andreward he came to London to find,as well as a family he lovedcomprising of his artistic wife Bella,and his children Anthony andPhyllis Gross. Phyllis was born in1906, and travelled extensively as achild with her family until Alexanderand Bella divorced in 1920, andpossibly as a result, Alexander wasremoved from the board ofGeographia soon after.
This left Phyllis with no place to callhome on leaving boarding school,so she took a place in a college inFrance both as pupil and teacherbefore studying at the Sorbonne.After a brief and failed marriage,Phyllis returned to London in 1936,and Alexander set up Geographers’Map Company on the 28th August,splitting the shares equally betweenPhyllis and Anthony. It was Phyllis,however, who took on theresponsibility of creating the first A-
Z, and spent hours walking thestreets of London cataloguing thehouse numbers, junctions andstreets. Alexander told her to callthe first publication the 'OK Atlas',but she changed the name at thelast moment, and sold every lastcopy of her first London A-Z, withher main customer being a certainW.H. Smith and Sons.
By 1938, the Company wereselling 12 titles, with the mapsbeing entirely hand drawn byskilled cartographers. It would takea fully trained cartographer around12 weeks to create a finishedpublication, and these early mapsare true works of art. In 1940, withthe outbreak of the Second WorldWar, the government ordered theremoval of street maps from sale,but following her father’s example,the business instead produced warmaps for the newspapers.
In 1946, Phyllis was involved in atragic accident when the plane shewas on crashed into a Surrey hill,leaving her with a fractured skull andspinal injuries. Undeterred, Phylliscontinued with her work, and alsospent time running her father’s USmapping business as well. However,she was to have a falling out withher father in 1950 when he askedAnthony to take over Geographers’.This resulted in Phyllis suffering astroke, and although her fathernever saw the threat through, Phyllis
took a back seat torecuperate for aroundtwo years.
By 1952 Geographers’had over 30 publicationscovering from London toGlasgow. Alexanderpassed away in 1958,leaving a 50 year legacyas a publisher andinnovator in the mappingworld. The 1960s sawchanges to road map
production methods, with the moveaway from traditional tracing papersheets and indian ink, to scribing.Street map revision moved toAstrafoil but the process for bothwas still slow and fiddly.
In 1962, the business moved toSevenoaks in Kent (we’ve been inthe area ever since) and by themid 60’s, the company had over50 publications. With this growth,and with Phyllis having noobvious family to pass thebusiness on to, she took theextraordinary and unselfish stepof selling her shares into Trust.Her brother agreed, and in 1965,ownership of Geographers’ MapCompany moved to theGeographer’s Map Trust.
The 1970s saw both anintroduction of the now iconic A-Zto the company name as well asthe move to photo typesetting, withcartographers taking turns at thetypesetter to print out the lettersthey needed to make up the nameson the map. These letters wouldthen be added one at a time to thesheets. Although a quicker methodthan previously, time could be lostas cartographers tried to find
Historical Mapping
6 • Summer 2016 / Maplines Visit the BCS website at www.cartography.org.uk
80 years of Geographers’ A-Z Maps
Below: Phyllis Pearsall c. 1940and the first A-Z of London.
Above: The company premisesexpanded to Gray's Inn Road.
Above: Plate making an A-Z Mapcirca 1990.
Below: A-Z Maps are increasinglybeing used in digital applications
such as navigation systems for theemergency services.
Inset: Naming roads using lettersmounted on stripping film.

Membership
We would like to firstly thankall of you who haverenewed your membership
subscription for 2016. If you haveforgotten, it’s not too late; pleaseuse one of the following methodsto keep your membership active:
Through the website:•www.cartography.org.uk
Personal Cheque made payable•to The British CartographicSociety, please write yourmembership number on the back.
Bank standing order.•
Debit/Credit card details sent•with your returned renewal form.
If you have not renewed by theend of June your membership willbe suspended and you will nolonger receive BCS publications,also your access to TheCartographic Journal online willbe terminated. We hope to hearfrom you soon!
New Members
Since the Spring 2016 edition ofMaplines was published, we havepleasure in welcoming the followingnew members to the society.
Corporate MembersGarsdale Design
UK MembersMr S. Jones, Mr D. Nuttall,
Mr N. Boyes, Miss A. Spriggs,Miss G.Brooks, Miss S. McSkeane, Mr M. Oyler, Mrs S. Hobbs, Mr J. Berry, Miss E. Gillard, Mr O. Saunders, Ms A. Semproni, Dr P. Mason, Mr J. Bean, Mr P. Mallard, Mr M. Davis, Ms K. Rann, Mr T. Starnes, Mr J. Piper, Mr J. Meyjes, Ms L. Ortolja-Baird, Mr R. Adams,Miss H. Peek, Mr M. Greenfield,Ms F. Hogan, Mr D. Hope, Mr T. Greenwood, Mr A. Ryan, Ms A. Giles.
Overseas MembersMr G. Terry
Associate MembersMr T. Foster, Miss P. Koper, Mr R. Waters, Miss M. Garrido,Mr P. Hooper, Ms M. Luck, Miss A. Palmer.
Sadly we report the unfortunatenews that a long standingFellowship Member has passedaway. Our thoughts andcondolences are with the family ofMr Peter John Adams.
In other BritishCartographic Society news:
The society exhibited at both theEsri UK Conference and theGeoBusiness Show. Both eventshad delegates showing greatinterest in the Society exhibition,in particular the Restless EarthProgramme. It was good to seefaces we recognised and to meetnew faces.
At the GeoBusiness show, thenew BCS webpage and logo werelaunched. As with all big changes
such as these, there have beenteething problems and technicalhitches. There is a very hard-working team within the societyputting their minds to these issuesso they can be ironed out. Weapologise for any difficultiesencountered during this time.Please continue to contact us withany problems and we will reportthese to the web designers.
The BCS – SoCConference 2016
To be held at The CheltenhamPark Hotel, Cheltenham, 6-8thSeptember 2016.
You should have all received yourconference programme by now.We hope you agree it looks aninteresting, exciting event for allmap lovers. Bookings have got offto a healthy start and we hope tomeet and see as many of youthere as possible!
And finally. . .
As always we are reachable bytelephone and email Monday toThursday 9.00am – 5.30pm andFriday 9.00am – 5.00pm. We arehappy to help any members withany issues or queries they mayhave related to the society.
Email: [email protected]
Phone: 01223 894 870
We look forward to meeting you atCheltenham!
Linda Baron and Ryan Harrow,BCS Administration Team.
BCS Admin Report & Corporate Report
8 • Summer 2016 / Maplines Visit the BCS website at www.cartography.org.uk
BCS Admin Report
It has been great to see somany corporate members atnumerous conferences and
exhibitions held over the lastcouple of months. I know many ofyou dropped in on the BCS standat the ESRI UK Conference and atGEO Business 2016 where welaunched the new website andlogo.
The new website will provide theBCS with a much improved forumto keep in touch with othercartographic professionals and toinform members and all maplovers of the latest developmentsand products available. Yourideas on how it can best beutilised to promote members tothe cartographic and geospatialworld will always be welcomeand I look forward to anyfeedback.
The combined BCS/SoCConference is in September. Abig thank you to all sponsors;your support is greatlyappreciated. I look forward toseeing you in Cheltenham forwhat is an exciting programmeof talks, workshops and muchmore.
Alan Grimwade,BCS Corporate Liaison Officer,[email protected]
Corporate Report
Following a lot of hard work byseveral people, GEOBusiness 2016 was chosen
as the event that BCS wouldlaunch its new website, logo andmarketing material. The event washeld in the Business Design Centrein Islington on 24-25 May and wasattended by some 2,200 delegatesfrom over 50 countries so clearlyprovided an excellent venue forBCS to show off its new wares.
Undoubtedly, the most importantelement was the launch of thenew website which is often the
first point of contact for potentialnew members and is used bymembers on a regular basis. Thesite has been developed by WinMarketing and Ann Goodwin fromthe company was on the stand forthe launch. The new site doeshave a much fresher look and feeland work is continuing to populatethe site.
A key feature of all our marketingmaterial including the website isthe new logo which is much‘cleaner’ than its predecessor. Adifficult thing to design when it
has to look right whenused with all the marketingmaterial and I think itreally does work well onthe website and the newflyers, coasters, pens,
pencils, rulers and post-it notes.They all look very smart so welldone the design team (MarySpence, Giles Darkes, MartinLubikowski and Alex ourPresident).
Also on the stand at the launchwere Alice Rickward, our RestlessEarth Co-ordinator and PaulNaylor from Ordnance Surveywho chairs the ProgrammeCommittee. And, I hear you say,‘Why were you there?’ Answer: Asleading publications salesman.
By Peter Jolly
Geo Business 2016
Visit the BCS website at www.cartography.org.uk Summer 2016 / Maplines • 9
BBCCSS aatt GGEEOOBBuussiinneessss 22001166
Below: From left to right - MarySpence, Alice Gadney, Paul
Naylor, Martin Lubikowski, AlexKent and Peter Jolly.

Last year’s Britishcampaign took 38days, the Canadian
election process lasted78 days, but the U.S.presidential campaignhas been going on sinceNovember 2012 (shortlyafter President Obamawon re-election). Morethan three years ofelection noise is taking atoll domestically andglobally.
I saw that the Britishpeople were unsettledby the raucous politicsinternationally to theextent that Parliamentdebated banning DonaldTrump, knownaffectionately (or not) as“The Donald.” BritishMPs were quiteuncomplimentary,calling Mr. Trump “abuffoon,” “wazzock,”“ridiculous xenophobe,”
and “the orange prince ofAmerican self-publicity.”
Trump Taps into Anger
Trump profited politically from the“angry voter syndrome” that hasbeen gripping conservatives sincePresident Obama’s election in2008. The “angry voter” ischaracterized as an older whitemale, who feels America is indecline. He blames globalization,status quo politicians, and theexpansion of women’s andminority’s rights for America’sproblems.
Trump energized these angryvoters with celebrity self-confidenceand attacks on global trade, theRepublican Party elite, women’srights, and immigrants. Trump hasfed the anger by leading the“birther” movement, accusingPresident Obama of not beingAmerican-born; he used it again tovanquish his two main Republicanopponents (both Latino): Ted Cruzand Marco Rubio.
Trump certainly succeeded inmanipulating angry voters during
the primaries, and he boastsabout receiving some 12 millionprimary votes. However,primaries have low voter turnoutrates in the United States—averaging 17% of eligible votersin 2016. The November electionexpands to some 225 millioneligible voters.
Trump’s TroublingElectoral Map
On November 8, 2016, Trump willface the country’s most diverseelectorate ever. Nearly one-in-three eligible voters will be aracial or ethnic minority.Traditional Republican woes withwomen voters have beenexacerbated by Trump.
The President of the UnitedStates is elected based on anaccumulation of state electoralvotes, known as the ElectoralCollege (see map below). Thetrouble for Trump is that thereliably Republican states in theSouth and West add up to only180 electoral votes compared to264 votes for dependablyDemocratic states (see graphbelow). The winner needs 270electoral votes to becomepresident. States with largeminority populations, such asCalifornia and New York,consistently vote for Democrats.
The Electoral College is not acollege, but a process set up bythe Constitution in 1787 as acompromise to give less populousstates (including slave states) agreater role in electing thepresident. The framers feared thatlarge states would dominate adirect popular presidentialelection. The Electoral Collegeallocates the least populous states3 votes. The most populous state,California, wields 55 votes.
Can Trump Triumph?
Trump could win againstDemocratic rival Hillary Clinton if hetakes all 7 swing states (94 votes),which is a long, long shot. A fewkey states deserve some detail:
Florida (29 votes) is the pivotal•swing state in this election, andTrump cannot win without it. Heowns the lavish $200 million Mar-a-Lago estate in Palm Beach, butminorities make up some 45% ofFlorida’s population. CubanAmericans, who traditionally voteRepublican, are divided onTrump; younger Cuban Americanslike Obama’s Cuba policy.President Obama won this statein 2012 by only 74,000 votes outof 8.4 million, and the minorityvote is critical.
Political Mapping
10 • Summer 2016 / Maplines Visit the BCS website at www.cartography.org.uk
A Lon
g, Lon
g Election
Continued on page 24. . .
BCS – SOC Conference 2016
Visit the BCS website at www.cartography.org.uk Summer 2016 / Maplines • 11
BCS – SOC Conference 2016
Visit the BCS website at www.cartography.org.uk Summer 2016 / Maplines • 13
BCS – SOC Conference 2016
12 • Summer 2016 / Maplines Visit the BCS website at www.cartography.org.uk

BCS – SOC Conference 2016
14 • Summer 2016 / Maplines Visit the BCS website at www.cartography.org.uk
The OS has been celebrating on•two fronts recently: The Trig Pillar is80 years old and it’s their 225thbirthday. The hashtag #TrigPillar80has been used by members of thepublic to send photos of themselvesstanding on or near, posing with orjust admiring trig pillars to try to winan OS t-shirt. There areapproximately 6000 trig pillars stillstanding, originally placed to set up atriangulation of the whole of GreatBritain. Although no longer used forsurveying, they are still maintained bythe OS. "Trigbagging" describes the
activity of visiting asmay pillars aspossible. Trig-baggerextraordinaire, RobWoodall, hasrecently completed a14-year quest to visitall 6190 pillars.
On 21 June, the OS celebrated•225 years of map production byproducing two 'new' maps, basedon historic styling but usingmodern data. The results can beseen on the OS website, atwww.ordnancesurvey.co.uk/blog/2016/06/celebrating-225-years-with-a-map/. See the article in thisedition for more information onhow the maps were made.
A dress made from World War•II "escape and evade" silk mapswas sold in July; silk was used for
maps as it did not crease, wasdurable and could be folded upsmall for concealment. Thought tohave been created between 1945-50, when fabric was still rationed,returning servicemen would havebought the material home afterthe war. Source: BBC website
A large 'new' monument has•been discovered at Petra, Jordan,using Google Earth and enhancedsatellite imagery. Archaeologistsmade the discovery at the WorldHeritage Site recently; it is thoughtto date from the second centuryBCE. The structure is about 56 by49 metres and will now beexcavated to investigate further.Enhanced remotely sensed imagerywas used to identify different landuses and picks out features not
visible by conventional methods.Drones were then used to fly overthe monument to photographfurther. Source: www.iflscience.com
The centenary of the start of the•Battle of the Somme has beencommemorated recently withevents in northern France and theUK to remember the 1.1 millionmen who lost their lives. 4dSommeis an interactive map from Esriwhich shows the campaign of theIrish Raised Divisions during theBattle. This uses GIS methodology,along with historic mapping, toshow progress on the modernlandscape. The website describesthe terrain and conditions andallows the user to view thecontemporary mapping overlaid onEsri satellite imagery. There is alsoa description of how mapping wassupplied to the front line. Thewebsite is a fascinating insight intothe technologies of the period, aswell as the history of the mostdeadly battle of WW1. Source:http://queensub.maps.arcgis.com/apps/Cascade/index.html?appid=f0629347d5dc4d6987686f876eec5649
Summer 2016 / Maplines • 15Visit the BCS website at www.cartography.org.uk
Omnium GatherumCartography in the News
a miscellaneous collection of people and things
. . . Continued from page 03
There are plenty of exciting newideas being discussed in Council atthe moment as we explore ways topromote maps and mapmaking to awider audience. These include thedevelopment of a series of materialsfor presenting better cartography touniversity students (following asuccessful talk by Giles Darkesgiven to students at the Universityof Nottingham), an online guide tocartography that will build on thesuccess of our handy bookCartography: An Introduction, andthe creation of a publication inspired
by our Restless Earth workshopsthat will be aimed at educatingchildren about maps and mapping.
Looking ahead, plans for the jointBCS-SoC conference ‘Mapping atthe Edge’ at Cheltenham Park Hotelfrom 6th to 8th September are wellunderway as we return ‘down South’to congregate at the historic spatown. The event promises to beenjoyable and enlightening, with ourexpert blend of workshops and talkstogether with our exhibition, galadinner and presentation of awards,golf tournament, and live mapcritique. So I hope to see you in
Cheltenham after the summer anduntil then, in the spirit of the town’smotto, may I wish you ‘Salubritas etErudito’ (health and education)!
Remember that your views areimportant to me and you are alwaysvery welcome to get in touch. I will bemoving offices over the summer, soemail ([email protected]) is probably the best way toreach me, or, if you prefer, please writeto me at Canterbury Christ ChurchUniversity or call (01227) 767700.
Onward and upward!Dr Alex Kent, BCS President
representation and so copied stylesfrom other parts of the country. Aswell as a time before railways, theoriginal maps were also long beforeBritish National Grid, so Cassiniprojection is used.
Normally we’d use customalgorithms and bespoke softwareto generalise features, such asbuildings, from large scale, buthere we used out-of-the-box GIStools for efficiency. We tried manydifferent methods of vectorbuilding hatching, but ultimatelyapplying a pattern to therasterised buildings was the mostworkable route. The internalshadows were created with dropshadow and masks.
For point symbols, we were keen toshow churches and windmills asthese appeared on the original maps.Lighthouses and beacons sadly don’texist in our geographic extent.
2016 London is a hectic urbansprawl. To allow the eye to rest,we decided not to showadministrative names and toconcentrate on the geographiclocations people refer to ineveryday life. In an attempt tocapture true positions andhierarchy, we used our namesdatabase combined with scouringold OS maps. Urban settlements
do not grow uniformly, but thebeauty of old maps is thatsettlements were usually ahandful of properties around aroad junction, so original centresare very easy to pinpoint. Byevaluating these against themodern day placement andimportance we manually placedand categorised all text.
The text on the map, and eventhe title, are a close match to theoriginal Board of Ordnance maps.Marginalia is a further tribute tothe original maps of the era.Aside from the ornate title and the‘scale of two hands’, you’ll noticesubtleties such as the irregularlines of the graticule markers.Again a nod to the hand-drawnand often askew lines of theoriginal draughtsmen.
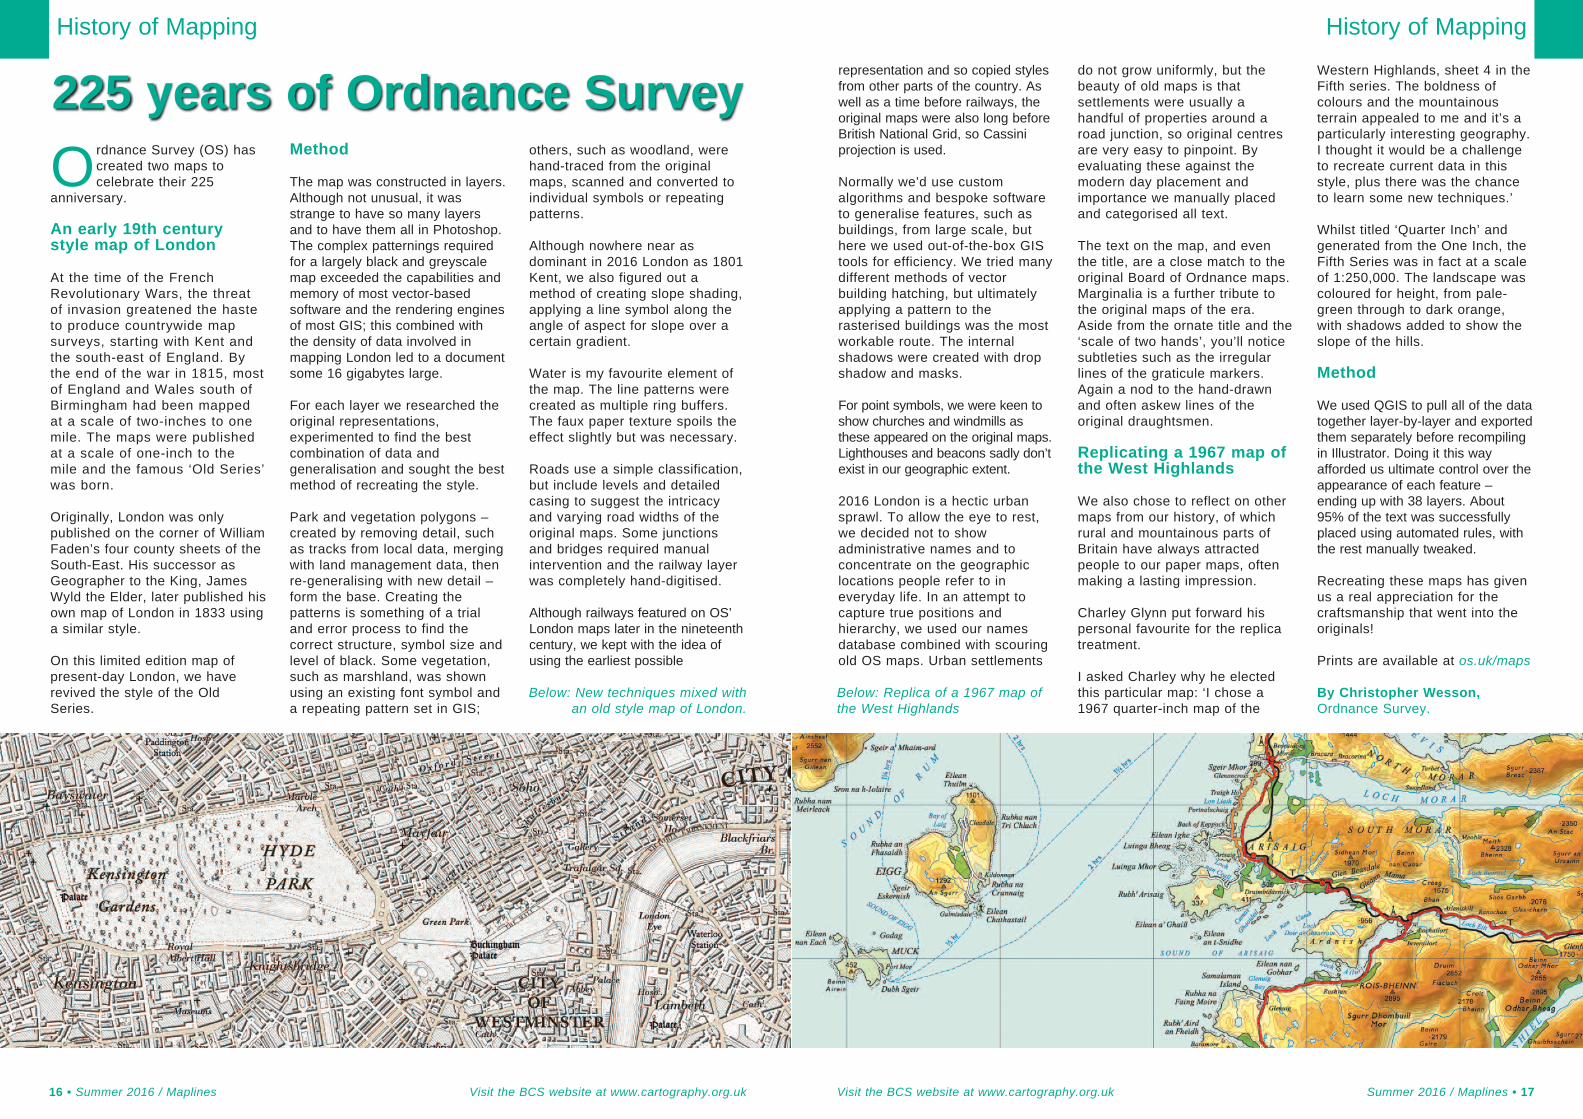
Replicating a 1967 map ofthe West Highlands
We also chose to reflect on othermaps from our history, of whichrural and mountainous parts ofBritain have always attractedpeople to our paper maps, oftenmaking a lasting impression.
Charley Glynn put forward hispersonal favourite for the replicatreatment.
I asked Charley why he electedthis particular map: ‘I chose a1967 quarter-inch map of the
Western Highlands, sheet 4 in theFifth series. The boldness ofcolours and the mountainousterrain appealed to me and it’s aparticularly interesting geography.I thought it would be a challengeto recreate current data in thisstyle, plus there was the chanceto learn some new techniques.’
Whilst titled ‘Quarter Inch’ andgenerated from the One Inch, theFifth Series was in fact at a scaleof 1:250,000. The landscape wascoloured for height, from pale-green through to dark orange,with shadows added to show theslope of the hills.
Method
We used QGIS to pull all of the datatogether layer-by-layer and exportedthem separately before recompilingin Illustrator. Doing it this wayafforded us ultimate control over theappearance of each feature –ending up with 38 layers. About95% of the text was successfullyplaced using automated rules, withthe rest manually tweaked.
Recreating these maps has givenus a real appreciation for thecraftsmanship that went into theoriginals!
Prints are available at os.uk/maps
By Christopher Wesson,Ordnance Survey.
History of Mapping
Visit the BCS website at www.cartography.org.uk Summer 2016 / Maplines • 17
Ordnance Survey (OS) hascreated two maps tocelebrate their 225
anniversary.
An early 19th centurystyle map of London
At the time of the FrenchRevolutionary Wars, the threatof invasion greatened the hasteto produce countrywide mapsurveys, starting with Kent andthe south-east of England. Bythe end of the war in 1815, mostof England and Wales south ofBirmingham had been mappedat a scale of two-inches to onemile. The maps were publishedat a scale of one-inch to themile and the famous ‘Old Series’was born.
Originally, London was onlypublished on the corner of WilliamFaden’s four county sheets of theSouth-East. His successor asGeographer to the King, JamesWyld the Elder, later published hisown map of London in 1833 usinga similar style.
On this limited edition map ofpresent-day London, we haverevived the style of the OldSeries.
Method
The map was constructed in layers.Although not unusual, it wasstrange to have so many layersand to have them all in Photoshop.The complex patternings requiredfor a largely black and greyscalemap exceeded the capabilities andmemory of most vector-basedsoftware and the rendering enginesof most GIS; this combined withthe density of data involved inmapping London led to a documentsome 16 gigabytes large.
For each layer we researched theoriginal representations,experimented to find the bestcombination of data andgeneralisation and sought the bestmethod of recreating the style.
Park and vegetation polygons –created by removing detail, suchas tracks from local data, mergingwith land management data, thenre-generalising with new detail –form the base. Creating thepatterns is something of a trialand error process to find thecorrect structure, symbol size andlevel of black. Some vegetation,such as marshland, was shownusing an existing font symbol anda repeating pattern set in GIS;
others, such as woodland, werehand-traced from the originalmaps, scanned and converted toindividual symbols or repeatingpatterns.
Although nowhere near asdominant in 2016 London as 1801Kent, we also figured out amethod of creating slope shading,applying a line symbol along theangle of aspect for slope over acertain gradient.
Water is my favourite element ofthe map. The line patterns werecreated as multiple ring buffers.The faux paper texture spoils theeffect slightly but was necessary.
Roads use a simple classification,but include levels and detailedcasing to suggest the intricacyand varying road widths of theoriginal maps. Some junctionsand bridges required manualintervention and the railway layerwas completely hand-digitised.
Although railways featured on OS’London maps later in the nineteenthcentury, we kept with the idea ofusing the earliest possible
History of Mapping
16 • Summer 2016 / Maplines Visit the BCS website at www.cartography.org.uk
225 years of Ordnance Survey
Below: New techniques mixed withan old style map of London.
Below: Replica of a 1967 map ofthe West Highlands

Amedieval map combinedwith a view of the Earthfrom space is a reminder of
humanity’s ancient desire to chartthe world from above.
On 11th February 2016 the Britishastronaut Tim Peake tweeted apicture from aboard the InternationalSpace Station (ISS). Captioned ‘acopy of one of the oldest maps inBritain, now exploring the newestfrontier here in space’, it showed afacsimile of the English Herefordmap (c.1300), on display at thecity’s cathedral, where it has beenfor at least 400 years.
The 700-year-old Hereford mapoffers a unique insight into whatmedieval people thought the Earthlooked like. The map, drawn onto asingle piece of vellum measuring 5ft2in by 4ft 4in, is oriented in the truesense of the word with east (Latinoriens) at the top and has Jerusalemat its centre. The map is of the typeknown as the T-O: the O of theinhabited world is divided into thethree known continents – Europe,Africa and Asia – by the watery Tformed by the intersection of therivers Don and Nile and theMediterranean, whose position in themiddle (medius) of the Earth (terra)is clear on Peake’s photograph.
With its 1,091 inscriptions, the mapwas an attempt to summarise
human knowledge in fields asdiverse as geography, ethnography,zoology and history. The inscriptionthat shows the location of Herefordhas at some point been rubbedaway and rewritten, probably as aresult of generations of viewersmarking their place in the worldwith their fingers.
What is striking about Peake’simage is how alike the two viewsof the Earth are. Both show uscircles of lands indented withdarker bays and seas. Though ‘thenewest frontier here in space’ hasonly recently become accessible tous, the longing for an orbital viewof the Earth is not new.
In his Phaedo, Plato, in the fourthcentury BC, described the Earth fromabove as a patchwork of terrains andvegetations, stitched together like aleather ball. Another legend, from thefourth century AD, has Alexander theGreat build a flying machine – madefrom a basket tethered to two griffins– which he used to fly to such aheight that the Earth looked to himlike a threshing floor encircled by aserpent. Mathematical proofs of thesphericity of the Earth have beenaround since antiquity and medievalpeople were aware that theyinhabited a globe. The Englishmystic Julian of Norwich (c.1342-c.1416) wrote that she was shownthe Earth in a vision: she held it – asround as a ball and about the size ofa hazelnut – in the palm of her hand.
The most influential orbital view ofthe Earth, however, appeared inCicero’s De re publica (54-51 BC).
This dialogue onRoman politicsconcluded with thedream of theRoman militarytribune ScipioAemilianus (185-129 BC), in whichhe is visited by hisdeceased
grandfather, therenowned General ScipioAfricanus, and taken upto the sky. From ‘a high
place full of stars, shining andsplendid’, Scipio observes thecosmos and its stellar workings: theMilky Way appeared as a circle ofbrightest white, the stars were orbsfar exceeding the Earth in size andthe moon shone with light borrowedfrom the sun. Scipio despairs at thesmallness of the Earth and, evenmore, that of the Roman Empire,exclaiming that ‘the Earth itselfappeared to me so small, that itgrieved me to think of our empire,with which we cover but a point, asit were, of its surface’.
Scipio’s cosmic vision became acornerstone for cosmographicalthought in the High Middle Agesthrough Macrobius’s Commentaryon the Dream of Scipio, written inthe early fifth century. Macrobiusexplained Cicero’s literaryallusions to the shape and natureof the cosmos, employing a seriesof maps and diagrams to show thespherical Earth in relation to thecelestial sphere – the convexity ofthe night sky on which the starsappear to turn around the Earth –and delineate the globe intoclimatic zones based on latitude.The Hereford map belongs to asimilar intellectual world: its circleof lands does not represent a flatdisk world, but rather the inhabitedpart of the northern hemisphere.
Peake’s view of the Earth hasbeen anticipated for millennia.Antique and medieval thinkerslacked the technological but notthe imaginative means to putthemselves into orbit and lookdown on the Earth. Looking out ofthe window of the ISS onto a worldwhere, in the astronomer CarlSagan’s words, ‘everyone youlove, everyone you know,everyone you ever heard of, everyhuman being who ever was, livedout their lives’, gives us a share ofthe breathless wonder with whichthe ancients mapped their world.
By Dale Kedwards,Dale is a historian of medievalmaps at the University of Zurich.
Astronautical Mapping
18 • Summer 2016 / Maplines Visit the BCS website at www.cartography.org.uk
Left: Screenshot ofTim Peake’s tweet.
The World From On High An invitation fromMenno-Jan Kraak,ICA President: Our
bi-annual InternationalCartographic Conferencesare highlights on thecartographic calendar. It iswith great pleasure that Iinvite you to Washington,DC, in the United States to
participate in ICA’s 28th conference.It promises to be a unique andsuccessful event. It will be uniquebecause we will experience thedevelopments in our discipline sincethe previous conference, expressedin papers, posters and in exhibitionsof maps and technology, andbecause Washington, DC, is thecentre of US cartography, and manyorganizations and companies willshare their knowledge with us. It willbe successful because you will bethere too.
And from Lynn Usery, ICA Vice-President and Conference Director:The Cartography and GeographicInformation Society (CAGIS) invitesthe world of cartography and GIS tocome to Washington, DC, 2-7 July2017 for the 28th InternationalCartographic Conference of theInternational CartographicAssociation. We are planning afantastic conference that will drawupon all the resources of the nation’scapital. The National Galleries of Art,the Smithsonian Institution, theNational Geographic Society, and theLibrary of Congress will all play a rolein making this a great conference.
We have selected the MarriottWardman Park Hotel as the venue.Located in Northwest DC, it is on theMetro which provides easy accessto all of the museums, shops, andrestaurants across the entire District.In addition, the conference coincideswith the national celebration ofindependence, which will make it avery festive time.
For more information aboutICC2017, please see the websitehttp://icc2017.org/. The call forpapers is now open, inviting paperson a wide range of cartographic andgeographic information science(GIScience) themes (see below).Submissions will be accepted online
only until 26 October 2016, using theonline submission form. Authors willbe notified of acceptance/rejectionno later than 20 January 2017.Submissions will be assessed ontheir originality, interest tocartographers, and likelihood ofadvancing the discipline.Submissions may be technical orcreative, scientific or experiential,individual or institutional in scopeand approach. Submissions andoptional papers will be assessed onhow well they demonstrate a cleargoal of relevance to cartography, useof systematic investigation ormethods, completeness of results orrecommendations, and significanceof conclusions.
Presentation format options are oralpaper or poster. There are two tracksfor submitting your presentation. TheBook Track (B) requires submissionof a short abstract and full paper.The Proceedings Track (P) requiressubmission of a long initial abstract.Tracks B and P submission detailsare explained within the onlineinstructions.
The schedule is:26 October 2016 – Submission•
of Abstract and Papers10 January 2017 – Notification of•
acceptance31 January 2017 – Submission•
of Final Manuscripts16 February 2017 – Conference•
Registration for Presenters/Authors
Sessions on a wide range of topicsare expected. The topic list has beendeveloped from recent conferencesand extensive consultation with ICACommissions by chair of the ScientificCommittee, Cynthia Brewer.
T01: Visual analytics, geovisuali-•zation, and dynamic cartography.T02: Spatial analysis, geocompu-•
tation, modeling, and data mining.T03: Virtual reality, augmented•
reality, 3D mapping, and Geodesign.T04: Generalization, multi-resolution•
data, and multi-scale representation.T05: Thematic cartography and•
multivariate data mapping; semiology.T07: User studies; user experience•
and usability; user interface design.T08: Cognitive issues in map use•
and design.
T09: Children and cartography.•T10: Accessible cartography for•
people with disabilities.T11: Education and training in•
cartography and geospatialtechnologies.T12: Outreach, geospatial•
MOOCs, and sharing mappingmethods beyond cartography.T13: Design of maps.•T14: Arts and culture; spatial•
digital humanities.T15: History of cartography and•
historical cartography.T16: Digital issues in cartographic•
heritage; map and geoinformationcuratorship.T17: Ubiquitous cartography and•
theoretical cartography.T18: Critical cartography; GIS•
and society.T19: Web cartography; map serv-•
ices and apps; GIS cloud computing.T20: Collaborative mapping,•
volunteered geographic information,and crowdsourcing.T21: Open source mapping and•
open geospatial data.T22: Location based services, geo-•
spatial prospecting, and privacy issues.T23: Intellectual property rights in•
mapping and geospatial data.T24: Management, workflows,•
and supply chains for mappublishing and geospatial products.T25: Atlas cartography: advances in•
structure, design, and technology use.T26: Spatial semantics and•
ontologies; spatial datainfrastructures; interoperability.T27: Quality of geospatial data,•
maps/charts; data integration,metadata, and standards.T28: Big data; sensor networks and•
remotely-sensed data for mapping;feature extraction from lidar.T29: Projections, coordinate•
systems, transformations, andconversions.T30: Topographic mapping; design•
and update of national mappingseries.T31: Toponyms: place names as•
cultural heritage, place-name conflicts,toponymic field work & documentation.T32: Mountain cartography and•
terrain representations; recreationand orienteering maps.T33: Cadastral mapping; mapping•
for city management.
UKCC Column
Visit the BCS website at www.cartography.org.uk Summer 2016 / Maplines • 19
UKCC
Continued on page 21. . .

information geographies. It existsin over 200 languages, it contains32 million articles, and 15% of allInternet users access it on anygiven day. Content on the platformthus can play an important role inannotating parts of our world.
Wikipedia operates using a digitalarchitecture that, in theory, allowsanyone with an Internet connectionto contribute content (indeed, theplatform’s strapline is “the freeencyclopedia that anyone can edit”).However, as figure 2 illustrates, thegeography of participation is highlygeographically uneven.
The map is based on Wikipediadata dumps encompassing 44languages from November 2012.The map highlights the fact that amajority of content produced inWikipedia is about a relativelysmall part of our planet.
By contrast, other continents aremuch less represented in the world’smost prominent digital repository ofhuman knowledge. The wholecontinent of Africa contains onlyabout 2.6% of the world’s geotaggedWikipedia articles despite having14% of the world’s population and20% of the world’s land.
Some of this variation can beexplained by Internet population(i.e. the total number of Internetusers in a country). However, even
accounting for their small Internetpopulations, most countries in theMiddle East and Africa still arerepresented by far fewer articlesand register far fewer edits thanwould be expected when Internetpenetration is accounted for (seeGraham et. al. 2014 for detailedstatistical analyses on the topic).
Said plainly, geographies ofparticipation and representation areheavily skewed in favour of Internetusers in high-income countries.These uneven geographies ofparticipation can not simply beexplained by internet access.
Interviews and focus-groups withWikipedians also revealed that theavailability of a broader ecosystemof local information, having aneducated and tech literatepopulation, having reliable
infrastructure (such as powersupply), not excluding half of thepopulation (in other words, women),having the internet be trusted ratherthan subject to surveillance by thestate, and having the critical massfor local-language tools, platforms,and communities were also allsignificant enabling factors.
As everyday human geographiesare increasingly infused withinformation, we need to be askingmore questions about whatinformation geographies look likeand who gets to participate intheir creation. The digital momenthas not yet facilitated a broad-based democratisation of digitalknowledge. Let’s therefore keepasking who, where, and what getsincluded and excluded.
By Mark Graham
Mapping the Web
Visit the BCS website at www.cartography.org.uk Summer 2016 / Maplines • 21
Human geographies areinfused with information.Information is created,
processed, and used in places. Itis stored in places; it movesacross places; and it ultimatelyannotates and augments places.
Until relatively recently, much ofthe world’s geographic informationwas tethered to particular parts ofthe world. Information was stuck toits containers (e.g. words physicallyprinted onto the page of a book),but it could move around the worldwithout significantly changing.
Mass media like books, televisionor radio allowed information to beboth mobile and static (or
‘immutable'). This fundamentallyaltered the political economy ofgeographic information. Immutable,but mobile, geographic informationcould be employed to exert powerin economic, social, and politicalspheres of life and governance.This meant that those in control ofthe means of informationalproduction (e.g. publishers,printers, media companies,governments, and censors) couldwield enormous influence over howplaces came to be represented.
But the digital moment has broughtabout a fundamentally different
relationship between content andits containers. Information can beseparated from its containers, butstill remain immutable.
Because of the digital moment’sability to detach content from itscontainers, and massively lowerbarriers to entry than earlypractices of media production,there are many commentators thathave pointed to the possibilitiesfor more democratised informationgeographies.
The digital moment thereforeoffers a radically different politicaleconomy of geographicinformation: the ability for broad-based participation and
representation that can circumventtraditional mediators ofinformation; and the ability forcitizens to play a greater role inshaping the immutable geographicinformation that plays such animportant role in everyday life.
But before being swept away withhype about the democratization ofgeographic information, we canlook at some data about what isactually happening. First, it isworth remembering that Internetaccess is a pre-requisite for mosttypes of digital engagement.Figure 1 visualises data on
Internet users from 2013 (the mostrecent data currently available).
The data are mapped as acartogram in which the size of eachcountry represents its population ofInternet users (each hexagon onthe map symbolizing one third of amillion Internet users). Shading onthe map is used to represent eachcountry’s Internet penetration rate:darker shades symbolizing higherlevels of Internet usage amongstthe population.
The map paints a revealing pictureabout human digital activity. Theworld’s largest Internet population(over half a billion connectedpeople) lives in China. Indeed 46%
of the world’s Internet users nowlive in Asia (China, India, andJapan alone are home to moreInternet users than all of Europeand North America put together). Itis also notable how few countriescan count a majority of theirpopulations as Internet users (Indiafor instance, falls into the lowestcategory, at <20% penetration).
Looking at these data as a startingpoint, therefore reminds us thatdespite the massive impacts thatthe Internet has on everyday lifefor many people, there remainstarkly uneven geographies ofaccess. A majority of humanityhas never used the Internet.
With those imbalances in mind, itis also worth reflecting on who itis that creates content online.Whilst, in theory, any internet usercan create information andparticipate in digital platforms. Inpractice, we see a much morelimited set of people doing that.
This is particularly evident if welook at the world’s most usedencyclopaedia: Wikipedia.Wikipedia is one of the world’smost visible components of digital
Mapping the Web
20 • Summer 2016 / Maplines Visit the BCS website at www.cartography.org.uk
Information Geographies &Geographies of Information
T34: Digital Transportation•Infrastructure: highly precise andcontinuously updated road modelsfor autonomous vehicles.T35: Marine and aeronautical•
cartography, navigation charts anddata, baselines, and sovereign zones.T36: Geospatial intelligence and•
military cartography.T37: Early warning, risk reduction,•
and crisis management using mapsand geospatial information systems.T38: Sustainable development;•
adaptation and resiliency mapping.T39: Planetary, extrasolar, and•
celestial cartography.T40: Developments in intensively•
mapped domains: global change,
soils, geology, agriculture,humanitarian programs, crime,facilities management, etc.
I would strongly encourage UKCartographers to considerattending the ICC2017 inWashington, even if you havenever attended an ICC before –Washington is a fascinating citywith lots of interesting museumsand galleries (most are free) and Iam confident that the conferencewill be highly interesting andextremely well organised. Evenbetter, I would hope for a goodnumber presentations and postersbe submitted; the UK has punchedwell below its weight at recentconferences in terms of number of
delegates and presentationscompared to many of our Europeanneighbours – Belgium now ranksabove us in these areas. Wetraditionally have a high profile incartography internationally, butneed greater visibility within ICA.
There is no UK national report for thisconference, that comes every 4 years,but there will be an International MapExhibition and a Petchenik Children’sMap Design competition. We willsupply information about these laterthis year with the aim to have abumper showcase of the best of UKCartography.
David Forrest, Chair, UK CartographyCommittee ICA Vice-President.
. . . Continued from page 19
Figure 1:Mapvisualisingwhichcountries areaccessingthe Internet.
Figure 2: Mapdisplayingcountries
editingWikipedia.

While Restless Earth is of benefitto the schools and the childrentaking part, getting them involvedin geography and increasing theirknowledge, the day can also bebeneficial to the volunteers.Volunteering for the RestlessEarth workshop is part of the AGIChartered Geographer (GIS)accreditation scheme, gaining youfour CPD points.
Corporate members can use theday as a Corporate Responsibilityor voluntary/charity day. It is notjust a team building exercise forthe children – I often feel usvolunteers are a team with ourown strengths and expertise tohelp in the workshop. It’s alsogreat to meet BCS members andfind out what you all do!
If you think your company mightbenefit from this, there is a letterwhich can be downloaded fromthe website or emailed to you topresent to your employer,highlighting the benefits andstructure of the day.
During the summer, moreinformation also will be put up onthe website for volunteers todownload.
I will be needing volunteers againthis year, but also as a presentingrole! If you have any questionsabout volunteering, please don’thesitate to contact me.
Thank You
I have recently met with oursponsors – Global Mapping andMinistry of Defence – to explainwhat a great role they play in theworkshop and to thank them fortheir support.
I am due to visit The Great BritainSasakawa Foundation and JapanSociety, Esri and the RoyalGeographical Society in the
summer to promote the workshop,present our work and thank themfor their continued support.
I would like to say thank you to allour sponsors, volunteers andsupporters. I have to say a specialthank you to Fernando Menéndez,from EOSGIS in Spain, for creatingour two fantastic 3D models, whichreally help the children understandthe topography of Japan, somethingus professionals take for granted.
If you feel your company couldsupport Restless Earth, pleasecontact me at the email addressbelow and I would be more thanhappy to discuss!
Please see the website forRestless Earth workshop dates –they are coming in thick and fastfor next year!
Alice Gadney,Alice is the Restless EarthCoordinator for the BritishCartographic Society. Sheorganises school visits and thevolunteers and helps run theworkshops. Promotion of theworkshop is done throughnetworking and word of mouth bythe schools.
Contact [email protected]@cartography.org.ukEducational Members:www.cartography.org.uk/members/education-schools/Restless Earth:www.cartography.org.uk/members/education-schools/welcome-to-the-bcs-restless-earth-workshop/ Events:www.cartography.org.uk/product-category/events/
Restless Earth
Visit the BCS website at www.cartography.org.uk Summer 2016 / Maplines • 23
In 2015-16 we have visited 35schools, from Kendal toSouthampton and Penarth,
Wales to Mildenhall. We havetaught to approximately 3,300pupils who have made over 1400maps, each one different andunique.
Due to new curriculum changes –the Cartography Skill, part ofGeographic Skills – GCSEGeography is a key element,making up 30% of the key skill!Us professionals can help them!
In 2011, a workshop was createdby immediate Past President, PeterJones. It is aimed at Years 9 and10 and requires them to producemapping products that would beused in the search and rescue forpeople in the Japanese Earthquakeand Tsunami disaster of 2011.
With seven different scaledbasemaps in English andJapanese and a briefpresentation, the pupils are askedto take geographic informationfrom the basemaps and translateit onto their map bases. Eachpupil has a role - Humanitarian:Helping the people find shelterand food, Military: Finding secureareas to land planes andtransport equipment to theaffected area, Search & Rescue:Securing sites for landinghelicopters, Medical: Securingpeople’s health before they travelto the safe places, Co-ordinator:Making sure the team talks to
one another and all elements areincluded on the maps.
Many of the pupils have neverseen such big maps or foreignmaps either.
The workshop is about 2 to 2½hours long and a final judgingtakes place to find a winner and acommendation. The winninggroup each get a world mapsupplied by Global Mapping.
The winners and commendationfrom each school will go forwardto the new BCS Award forRestless Earth 2015-2016.Presentation of the awards will beat the Annual Symposium inSeptember 2016. A ‘Volunteer ofthe Year’ award will also bepresented.
Volunteering
Volunteers are always neededand your expertise in thecartographic field is muchappreciated.
With the purchase of an EsriArcGIS Non-Profit Licence, weare now able to spatiallyanalyse where the schools arethat we have visited and are yetto visit. Many of these are inand around London and in aswathe up from Milton Keynesto Kendal, so this might appealto those of you living aroundLondon, the West Midlands andNorth West. We’ve noted thatwe have not been to manyschools in the North East, SouthWest or East Anglia, but we areworking on this!
22 • Summer 2016 / Maplines Visit the BCS website at www.cartography.org.uk
Restless Earth Report2015 - 2016
Restless Earth
Right: Students studying maps ofJapan to fulfil the role given to them.
Right: 3D model helping thestudents understand thetopography of Japan.
Inset: Volunteers helping out withmap reading.

Ben Nevis, Scafell Pike andSnowdon attract around700,000 visitors each year
with 30,000 of those visiting tocomplete the Three PeaksChallenge. Until recently, challengersneeded three Ordnance Survey (OS)maps for their planning andnavigation. Then OS cartographicand product teams created the ThreePeaks Challenge map.
The map provides challengers withall the mapping they need in oneplace and it has the addedadvantage of clearly marked routes,which cover the recommendedclimbs on all three of the peaks.Divided into four areas, three of theseareas use the OS 1:25 000 mappingfor the individual peak locations, withthe fourth map providing an indicationfor the road journey between thepeaks. The 1:25,000 data includesroad and rail networks, height, naturalfeatures and points of interest.
OS created the map in conjunctionwith several organisations andcharities responsible for themanagement of the mountains,including the Three Peaks
Partnership. They helped verify therecommended walking routes for eachpeak, ensuring routes were accurateand enabled maximum safety.
Nick Giles, Managing Director of OSLeisure, commented: “The new maphas been created to ultimately makeit easier, safer and more enjoyablefor individuals to plan for, and takepart in, the national Three PeaksChallenge by providing a singlesource of information, covering allthree mountains.
“We’re in the busiest season forpeople looking to take part in theThree Peaks Challenge and we
would urge everyone to be fullyprepared for the challenge andalways carry a paper map. GPSdevices and mapping apps are great,but you never know when batterieswill fail. The OS Three PeaksChallenge map could be the mostimportant item in your backpack.”
The map can be used for planning,navigation and as a memento of theiradventure – challengers can evenchoose which peak photo to featureon the cover of their map. It’s availableto purchase online by individualchallengers, but also potentially bycharities and event organisers toinclude as part of a challenge pack.
The Three Peaks Challenge map canhelp to support a user to completethe challenge responsibly and safely.This includes tips for preparing,mountain rescue, weather advice andthe Countryside Code, as OS arekeen to minimise the impact of theevent on the outdoor environment.
This map is available through theOS shop, and as a BCS member,you are entitled to a 25% discountusing the discount code BCS25LM
Pennsylvania, Penn. on map (20•votes) has not voted for aRepublican presidential candidatesince 1988, and it looks favorable forDemocrats in 2016. RepublicanSenator Toomey, who won his seatin a low turnout 2010 election, willlikely lose due to higher voter turnoutthis year. President Obama won bymore than 300,000 votes in 2012,and the 2016 Democratic NationalConvention will be in Philadelphia—acity friendly to Democrats.
Ohio (18 votes) is another•must win state for Trump.Northern Ohio and major Ohiocities prefer Democrats, andObama’s winning margin in 2012was 166,000 votes out of 5.5million. Trump’s cavalier insultsagainst Republican Governor
Kasich divide Ohioans. The July2016, Republican NationalConvention will be in Cleveland—a Democratic stronghold—wheretensions will be high.
Virginia (13 votes) favors•Democrats in 2016, partly due tohigh minority population growth inthe Northern Virginia, the formerlands of Lord Fairfax. Republicanshave not won a statewide electionsince 2009, and Obama wonVirginia in 2012 by 149,000 votesout of 3.8 million. Trump barelywon the Virginia primary, gettingonly 34% of the vote and losingNorthern Virginia, Richmond, andCharlottesville—where,incidentally, the Trump familyowns the state’s largest vineyard.
Hillary Clinton should win inNovember, even with her perceived
unpopularity and problems. Why? Asshown with the electoral map, ageneric Democrat holds anadvantage over a generic Republicancandidate. In polls, the DemocraticParty and President Obama are morepopular than the Republican Party.Finally, Trump staged a hostiletakeover of the Republican Party,which is replete with division andMachiavellian intrigue.
As a celebrity tycoon, Trump is anunconventional candidate(imagine Simon Cowell as primeminister), but he must navigate along, conventional politicalprocess to win. In the end, toomany states and groups arealigned against Trump, and oddsare against the orange princebecoming president.
By David Miller
Exploration
24 • Summer 2016 / Maplines Visit the BCS website at www.cartography.org.uk
The Three Peaks Challenge
. . . Continued from page 10
Above: OS maps for the three peaks.