Embed Size (px)
Citation preview
Prof. Dr. Uwe Dieter Grebe
From Tank-to-Wheel to Life Cycle EmissionsJoint Symposium Waseda UniversityMay 20, 2019

“ We came all this way to explore the moon, and the most important thing is that we discovered the Earth. ”
William Anders, Apollo 8December 24, 1968
Source: NASA

Matanda Copper & Cobalt Mine, Kongo
Actions for Sustainability:
• Ensure State-of-the-art process engineering
• Study & minimize ecosystem impact
• Implement EoL strategies & Material Recycling
Challenges:
• Destruction of sensible Ecosystems
• Hazardous Emissions
• Substandard working conditions
Cobalt washing at a small mine, Kongo
Photo: Bloomberg
Example: Li-Ion Battery Materials

Life Cycle CO2
ProducingGreen Electrons &
Fossil Fuels
Refinery inludingPower-to-Liquids Plant using Carbon Capture
Liquid Fuel Infrastructure
Raw Material Extraction
ComponentProduction
Vehicle & Energy Carrier Production
Vehicle In-Life and Scrappage

Life Cycle CO2
ProducingGreen Electrons &
Fossil Fuels
Liquid Fuel Infrastructure
Raw Material Extraction
ComponentProduction
Vehicle & Energy Carrier Production
Vehicle In-Life and Scrappage
Refinery inludingPower-to-Liquids Plant using Carbon Capture

The need for individual mobility will lead to a coexistence of different propulsion systems
Powertrain CompetitionHurdles for Individual Technologies

ICE-based Powertrain withZero Impact Emission
Internal Combustion Engines with zero impact on the air quality in cities are possible and reasonably affordable
Affordable Mobility with unlimited Driving Range
Combustion
HybridProcess andThermal Control
Aftertreatment
TECHNOLOGY EVOLUTION
Reasonably low product cost increase allows for local air quality without impact to human health
Compliance in all Driving Situations
Severity
EU
China
India
US
REAL DRIVING EMISSIONS
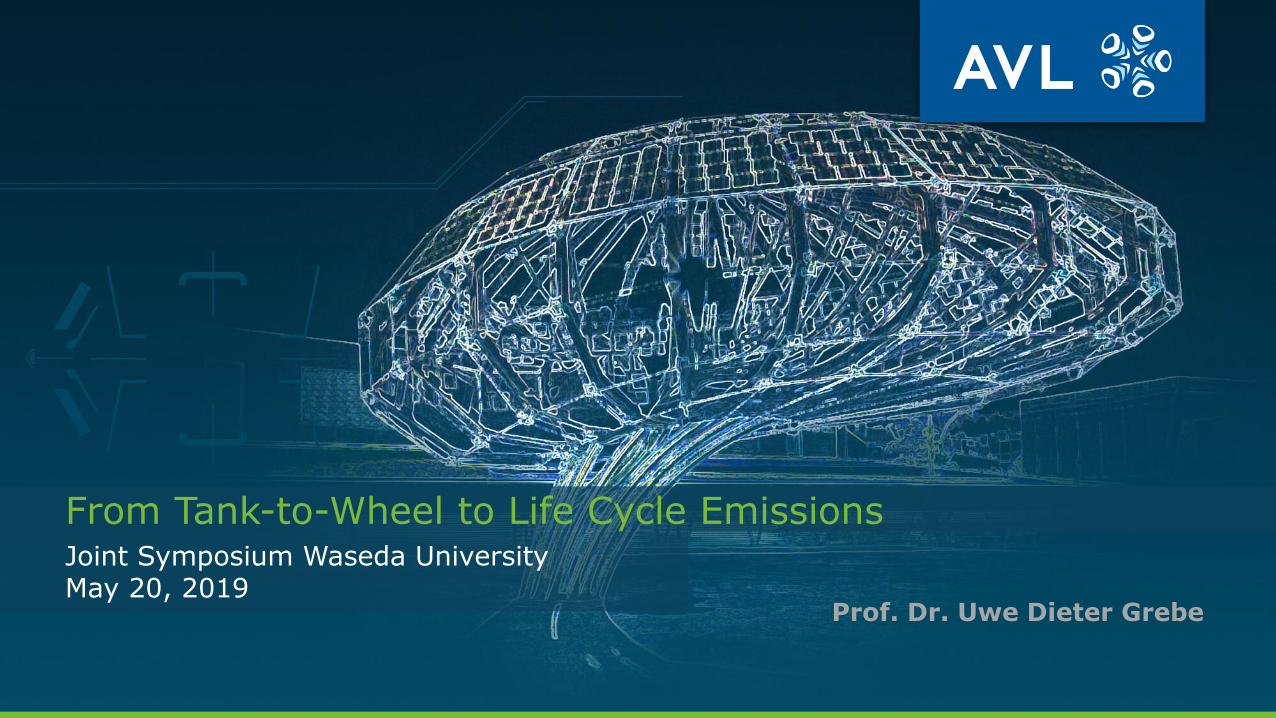
Hybridization as enabler for “Zero Impact Emission” capability of ICE
Aggravated RDE-Boundariese.g.: reduced length of city part
EU6d EU7 Zero Impact Emission SI and CI
Pollutant Emissions
SILimit
CILimit
CI&SILimit
On the way to Zero Impact Emissions
Technical Mitigation
• Limited ICE Dynamics e.g.: torque limitation, electric torque assist, electric drive-off
• Reduced Engine Raw Emission
• Refined Exhaust Gas Aftertreatment System e.g. secondary air, electrically heated catalyst, refined GPF
• Refined Control Strategies
• …
Significant Further Emission Reduction
• Electric Drive–Off
• Exhaust Gas Conversion Management
• Predictive Operation Strategies
• Passive SCR / NOx Storage Catalyst
• Secondary Air System
• …

Cost WalkZero Impact Emission ICE and BEV
Vehicle segment: CBEV driving range:350 km 52 %
238 %

Global CO2 Reduction – CAFE / CAFC
Significant aggravation of CAFE targets especially in EU and China
Freezing 2020 targets until 2026 ?
2015–2030
-30-40% ?
ZEV requirements in CA
Accounting for CO2
from electricity 2025 ?
NEDC ➔ WLTP
-15% 2025 , - 37,5% 2030
Zero Level Emission Vehicles
15% 2025 , 35% 2030
Real World CO2 ?
NEV share mandatory
License plate restrictions
NEDC➔ WLTP (CATC) ?
2015 – 2030
-56%2015 – 2030
-50-60% ?

9%
41%
2021 2025 203020162021 2025 20302016
31%
7%
20%
41%
AVL prediction 04/2019
2021 2025 20302016
*) incl. 48V with e-Drive
AVL Aggravated EU7 Scenario0%
10%
20%
30%
40%
50%
60%
70%
80%
90%
100%
AVL Scenario Medium
1%
Ele
ctr
ifie
d
IC
E-b
ased
Ele
ctr
ifie
d
IC
E-b
ased
8%
41%
1%
0%
10%
20%
30%
40%
50%
60%
70%
80%
90%
100%
AVL Scenario Medium
FCEVBEVPlug-In Hybrid(M)HEV*Conv & Start StopConv & Start Stop
Technology Forecast - LD Vehicles 2030New Vehicle Production – AVL “Most Likely ”
IC
E-b
ased
Ele
ctr
ifie
d
0%
10%
20%
30%
40%
50%
60%
70%
80%
90%
100%
AVL Aggravated EU7 Scenario
29%
12%
0%
57%
2%

What if Synthetic Fuels are available?
PtX Fuels are a favorable option to use as drop-in for existing fleet
Power-to-X (E-Fuels)• Feasible scenario –
Technologies are fundamentally established
• Storage to balance fluctuations from wind
and solar
• Scale-up and infrastructure built-up need to
be started soon to enable sizable volumes
mid-term
• Will be in competition to other alternative
renewable routes
(Hydrogen, Battery Electric)
• Aviation and ocean-going marine likely to
be first in line for any liquid fuels

Efficiency Chain: from Source to Wheel
Source: AVL

-5
20%
40%
60%
100%
0 5 10 15 20 25 30 35 40 45
Ambient temperature / °C
Percentage of max. electric range
Significant range impact of
▪ Ambient temperature
▪ Drive style
▪ Cabin comfort
80%
Battery’s “comfort zone”
Real World EV Driving Range:A reliable Uncertainty

Efficiency Chain: from Source to Wheel
Source: AVL

Life Cycle CO2
ProducingGreen Electrons &
Fossil Fuels
Refinery inludingPower-to-Liquids Plant using Carbon Capture
Liquid Fuel Infrastructure
Raw Material Extraction
ComponentProduction
Vehicle & Energy Carrier Production
Vehicle In-Life and Scrappage

Vehicle Production GHG Emissions
Raw Material Extraction, Refining and Smelting needs to be included into assessment of Vehicle GHG Emissions. Recycling is a potential for GHG Reduction.

Vehicle Production GHG Emissions
C-Segment Vehicle Values largely dependent on boundary conditions:
Sources: AVL, FfE, University of Linz
MHEV
“GHG lean” production for base Vehicle and ICE. Today “real world” values vary largely (up to 8 t/veh.)
BEV
Battery 60 kWh, US MI Electricity Mix, Production Best-Practice (140 kg CO2/kWh)
Battery-related: Variation 62 to 212 kg CO2/kWh, depending on battery manufacturing
FCEV
Fuel Cell Stack: 80kW
Carbon Fiber Hydrogen Storage, 5 kg capacity. Carbon Fiber Production Footprint 25 kg CO2/kg (range is 20…31)

Battery Pack ProductionGHG Emissions
Module Manufacturing
Pack Manufacturing
AssemblyHousing
Module Integration
Assy. Thermal System
Electrical-System
Integration
BMS Integration
EnclosureHousing
EOLTesting
CellStacking
Module Housing
Assy./WeldingBusbar
Assy./Welding
LV System
Assy./Welding
E/E System
EnclosureModule
EOL Testing
Battery Housing
incl. Module Housing
19%
Cells incl. Manufacturing
66%
Thermal Management
4% BMS 10%
Pack Manufacturing1%
GHG Share of Battery Pack
source: Tesla
source:Audi
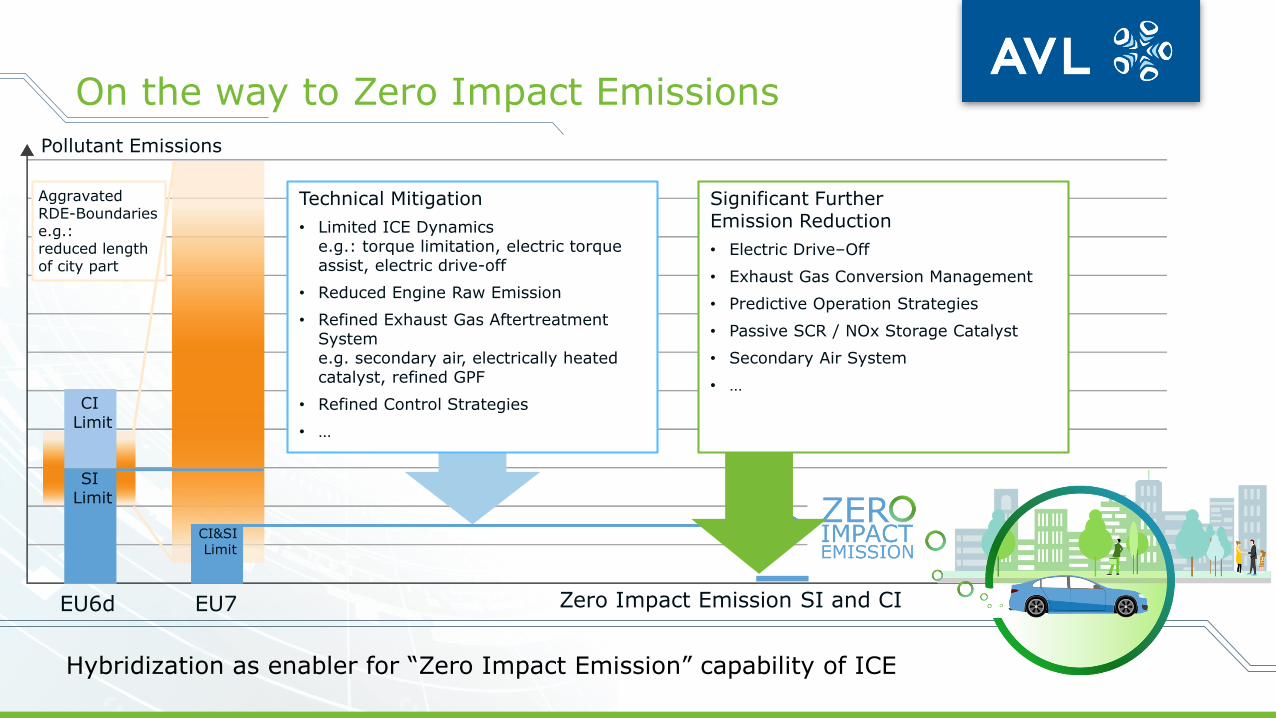
Battery Cell Production GHG Emissions
Cell Manufacturing
Cell Materials
Mixing & Coating 1%
Drying 38%
Calendering 2%
Slitting 4%
Packaging 5%
Contracting Terminals 1%
Final Sealing 4%
Ageing & Formation 1%
Dry room conditioning
44%
CO2 Emission Share of Battery Cell Production
CO2 Emissions for Battery Cell Production
References:Kwade et al., Nature Energy (2018)H. C. Kim et al. Env. Sci. (2016)C. Yuan et al. Manuf. Tech. (2017)L. Janschitz, AVL, Master Thesis (2018)

Fuel Cell Tank ProductionGHG Emissions
ReferencesAVL Benchmark DataJ.J. Cook, NREL Technical Report (2017)Toray technical data (T700 Fiber)
Type 4 Hydrogen Storage Vessel
(AVL / OEM Specimen)
Manufacturing Steps GHG Emissions for Vessel Manufacturing
1
Injection Molding
2
Thermal Treatment
3Coating
4Laser Welding
5Winding
6Winding
7Hardening
8Protectors
9Cleaning
10
End of Line Test
Plastic Liner
Silicon
Plastic Liner
Carbon Fiber
Glass Fiber
PU Foam
Material Input Manuf. Step
Carbon Fibre
Other Material
Manufacturing
2-vessel system, capacity 5 kg (usable)Vessels only, i.e. w/o valves, receptacle, PRD.

Production and Well-to-WheelA long Use Phase to offset for Production
BatteryCells
Battery Pack Assy.
BEV
Base Vehicle
UseProduction
HEV48V
Mid LowHigh
•GHG footprint
of energy for
production
•Manufacturing
technology
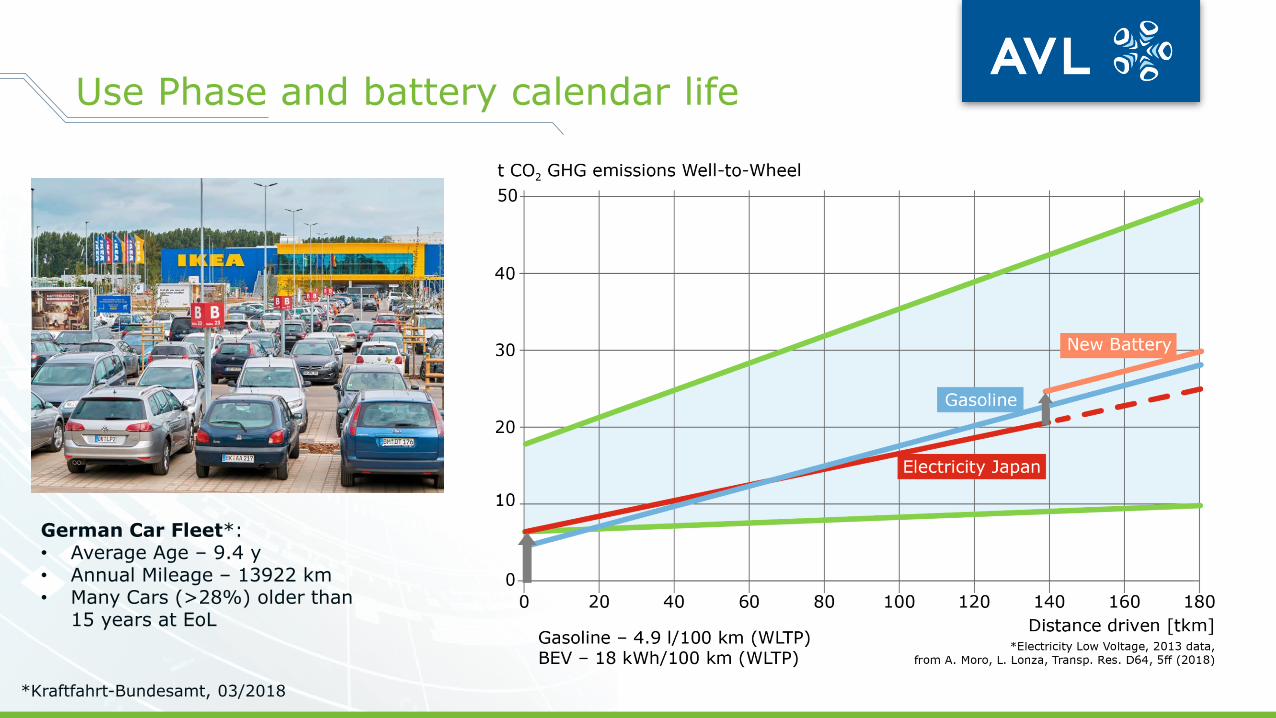
Use Phase and battery calendar life
German Car Fleet*:• Average Age – 9.4 y• Annual Mileage – 13922 km• Many Cars (>28%) older than
15 years at EoL
*Kraftfahrt-Bundesamt, 03/2018

70 kW
20 kWh80 kWh
Take out: 40 kW Fuel Cell Add: Battery 20 kWh
FCEV 80 kW, H2 Refueling
Take out: 60 kWh Battery Cap.Add: 70 kW Range Extender
BEV 400 km range
Note: Simplified Scenario. Implications e.g. on performance & efficiency
Fuel Cell P-HEV
E-REV
Battery @ 140kg CO2/kWh
FASTREFUELING
Modular Powertrain System
Optimizing for low CO2 in production requires a rethinking of the configuration of the propulsion system
Plug-In 100 km range, H2 Refueling
100 km EV range / Gasoline: Unlimited
+ FlexibilityWeight: -240 kgProduct Cost: -5500 €
+ Plug-In CapabilityWeight: +60 kgProduct Cost: -1500 €
H2
20 kWh
40 kW
H2
80 kW
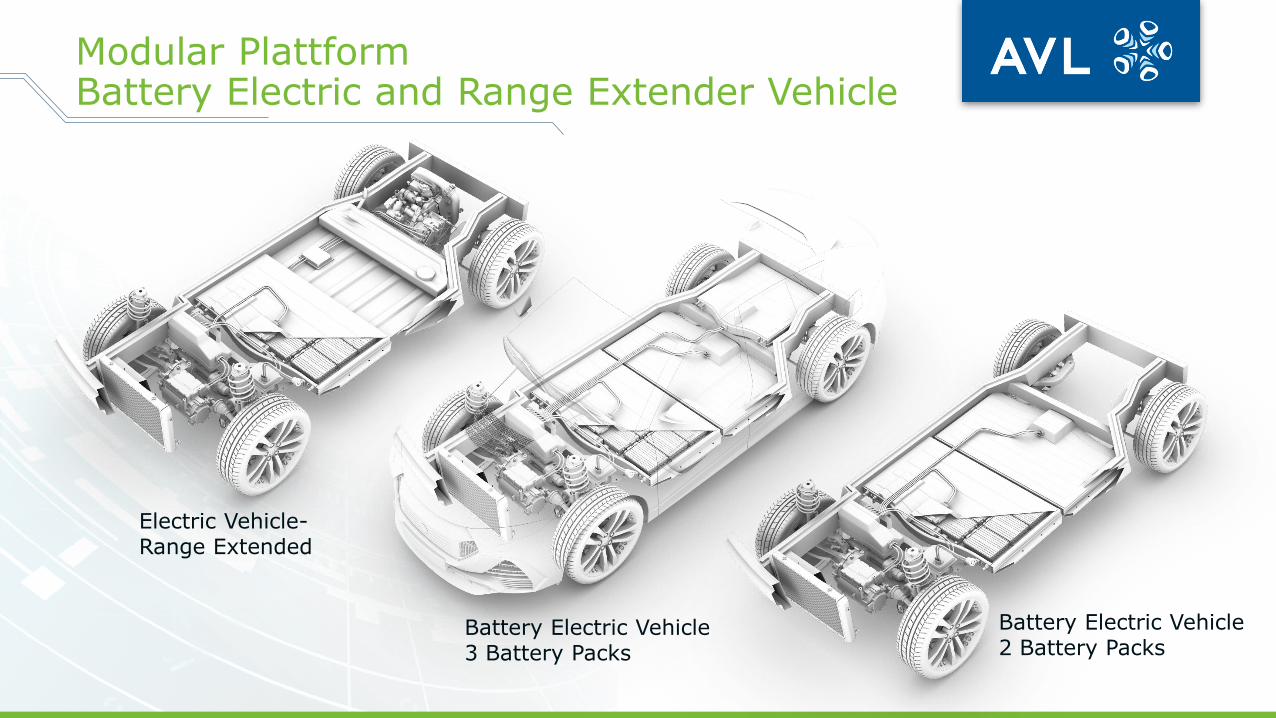
Modular PlattformBattery Electric and Range Extender Vehicle
Battery Electric Vehicle3 Battery Packs
Electric Vehicle-Range Extended
Battery Electric Vehicle2 Battery Packs

Multi-PurposeICE Vehicle
400 km BEV(with limitations)
Shared Car, bus, train, plane…= 1% of trips
Owned Owned (with some shortfalls)
Owned + Shared
Gasoline or DieselMain vehicle for universal use
Variants of Electrification
+
Main Vehicle tailored to use case (e.g. commute)
FCEV(Infrastructure& Cost issue)
E-REV/PHEV(Might still suffer from city bans)
200 km BEV= 99% of trips
Evolution of Car Ownership (Scenario)

GHG emissions from the production of batteries determined by energy used to manufacture
Summary
Zero impact emissions for internal combustion engines is reasonably affordable
PtX enables the use of renewable energy with ICE – drop-in capability preferred
Sustainability in ecology, economy and society as the guiding principle
GHG regulations drive a significant share electrification –however, the ICE plays an important role in the propulsion of future vehicles
Minimized WtW GHG emissions can be achieved with smaller batteries –combined with range extenders, fuel cells or future intermodal mobility concepts

Source: NASA
Thank You