Embed Size (px)
Citation preview

OSD10, 1127–1167, 2013
From satellitealtimetry to Argo and
operationaloceanography
P. Y. Le Traon
Title Page
Abstract Introduction
Conclusions References
Tables Figures
J I
J I
Back Close
Full Screen / Esc
Printer-friendly Version
Interactive Discussion
Discussion
Paper
|D
iscussionP
aper|
Discussion
Paper
|D
iscussionP
aper|
Ocean Sci. Discuss., 10, 1127–1167, 2013www.ocean-sci-discuss.net/10/1127/2013/doi:10.5194/osd-10-1127-2013© Author(s) 2013. CC Attribution 3.0 License.
EGU Journal Logos (RGB)
Advances in Geosciences
Open A
ccess
Natural Hazards and Earth System
Sciences
Open A
ccess
Annales Geophysicae
Open A
ccess
Nonlinear Processes in Geophysics
Open A
ccess
Atmospheric Chemistry
and Physics
Open A
ccess
Atmospheric Chemistry
and Physics
Open A
ccess
Discussions
Atmospheric Measurement
Techniques
Open A
ccess
Atmospheric Measurement
Techniques
Open A
ccess
Discussions
Biogeosciences
Open A
ccess
Open A
ccess
BiogeosciencesDiscussions
Climate of the Past
Open A
ccess
Open A
ccess
Climate of the Past
Discussions
Earth System Dynamics
Open A
ccess
Open A
ccess
Earth System Dynamics
Discussions
GeoscientificInstrumentation
Methods andData Systems
Open A
ccess
GeoscientificInstrumentation
Methods andData Systems
Open A
ccess
Discussions
GeoscientificModel Development
Open A
ccess
Open A
ccess
GeoscientificModel Development
Discussions
Hydrology and Earth System
Sciences
Open A
ccess
Hydrology and Earth System
Sciences
Open A
ccess
Discussions
Ocean Science
Open A
ccess
Open A
ccess
Ocean ScienceDiscussions
Solid Earth
Open A
ccess
Open A
ccess
Solid EarthDiscussions
The Cryosphere
Open A
ccess
Open A
ccess
The CryosphereDiscussions
Natural Hazards and Earth System
Sciences
Open A
ccess
Discussions
This discussion paper is/has been under review for the journal Ocean Science (OS).Please refer to the corresponding final paper in OS if available.
From satellite altimetry to Argo andoperational oceanography: threerevolutions in oceanographyP. Y. Le Traon∗
Ifremer and Mercator Ocean, 8–10 rue Hermes – Parc Technologique du Canal, 31520Ramonville St Agne, France
∗ Invited contribution by P. Y. Le Traon, recipient of the EGU Fridtjof Nansen Medal 2012.
Received: 5 April 2013 – Accepted: 12 July 2013 – Published: 18 July 2013
Correspondence to: P. Y. Le Traon ([email protected])
Published by Copernicus Publications on behalf of the European Geosciences Union.
1127

OSD10, 1127–1167, 2013
From satellitealtimetry to Argo and
operationaloceanography
P. Y. Le Traon
Title Page
Abstract Introduction
Conclusions References
Tables Figures
J I
J I
Back Close
Full Screen / Esc
Printer-friendly Version
Interactive Discussion
Discussion
Paper
|D
iscussionP
aper|
Discussion
Paper
|D
iscussionP
aper|
Abstract
The launch of the US/French mission Topex/Poseidon (T/P) (CNES/NASA) in Au-gust 1992 was the start of a revolution in oceanography. For the first time, a very precisealtimeter system optimized for large scale sea level and ocean circulation observationswas flying. T/P alone could not observe the mesoscale circulation. In the 1990s, the5
ESA satellites ERS-1/2 were flying simultaneously with T/P. Together with my CLS col-leagues, we demonstrated that we could use T/P as a reference mission for ERS-1/2and bring the ERS-1/2 data to an accuracy level comparable to T/P. Near real time highresolution global sea level anomaly maps were then derived. These maps have beenoperationally produced as part of the SSALTO/DUACS system for the last 15 yr. They10
are now widely used by the oceanographic community and have contributed to a muchbetter understanding and recognition of the role and importance of mesoscale dynam-ics. Altimetry needs to be complemented with global in situ observations. In the end ofthe 90s, a major international initiative was launched to develop Argo, the global arrayof profiling floats. This has been an outstanding success. Argo floats now provide the15
most important in situ observations to monitor and understand the role of the oceanon the earth climate and for operational oceanography. This is a second revolution inoceanography. The unique capability of satellite altimetry to observe the global oceanin near real time at high resolution and the development of Argo were essential to thedevelopment of global operational oceanography, the third revolution in oceanography.20
The Global Ocean Data Assimilation Experiment (GODAE) was instrumental in the de-velopment of the required capabilities. This paper provides an historical perspectiveon the development of these three revolutions in oceanography which are very muchinterlinked. This is not an exhaustive review and I will mainly focus on the contributionswe made together with many colleagues and friends.25
1128

OSD10, 1127–1167, 2013
From satellitealtimetry to Argo and
operationaloceanography
P. Y. Le Traon
Title Page
Abstract Introduction
Conclusions References
Tables Figures
J I
J I
Back Close
Full Screen / Esc
Printer-friendly Version
Interactive Discussion
Discussion
Paper
|D
iscussionP
aper|
Discussion
Paper
|D
iscussionP
aper|
1 Introduction
In the early 1990s, one century after the Nansen’s Fram expedition, a small altime-try community was exploring the oceans with a new and wonderful instrument: theUS/French mission Topex/Poseidon (T/P) (CNES/NASA). This has been an excitingtime period. For the first time, a very precise altimeter system optimized for large scale5
sea level and ocean circulation observations was flying. T/P revolutionized our visionand understanding of the large scale sea level and ocean circulation variations. In the1990s, the ESA satellites ERS-1/2 were flying simultaneously with T/P. The joint use ofT/P and ERS-1/2 provided new views of the ocean circulation at high resolution; thisalso led to many discoveries, in particular, on mesoscale variability. Altimetry needs to10
be complemented by in situ observations and models. In the end of the 90s, a majorinternational initiative was launched to develop Argo, the global array of profiling floats,as an initial joint venture between CLIVAR and the Global Ocean Data AssimilationExperiment (GODAE). Argo has been an outstanding success. The unique capabilityof satellite altimetry to observe the global ocean in near real time at high resolution15
and the development of Argo were essential to the development of global operationaloceanography. GODAE (1998–2008) was phased with the T/P and ERS-1/2 succes-sors (Jason-1 and ENVISAT) and was instrumental in the development of global oceananalysis and forecasting capabilities. The development of such an integrated approach(satellite and in situ observations, models) has been another great adventure and an-20
other series of major achievements in oceanography.This paper will cover these three revolutions or breakthroughs in oceanography. This
is not meant at all to be an exhaustive review. I will mainly try to summarize and il-lustrate the contributions we made together with many colleagues and friends. Themain focus will be satellite altimetry. I will start with a brief overview of the develop-25
ment of satellite altimetry and, in particular, the T/P breakthrough of high precisionaltimetry. A summary of science investigations from satellite altimetry over the past20 yr will then be given. I will then cover the development of the SSALTO/DUACS prod-
1129
OSD10, 1127–1167, 2013
From satellitealtimetry to Argo and
operationaloceanography
P. Y. Le Traon
Title Page
Abstract Introduction
Conclusions References
Tables Figures
J I
J I
Back Close
Full Screen / Esc
Printer-friendly Version
Interactive Discussion
Discussion
Paper
|D
iscussionP
aper|
Discussion
Paper
|D
iscussionP
aper|
ucts and illustrate the contribution they have made to a better recognition of the impor-tance and role of mesoscale variability. The development of Argo and global operationaloceanography will then be reviewed. Complementarities with satellite altimetry will beemphasized. A focus on European contributions, in particular, in the framework of theEuro-Argo research infrastructure and the GMES/Copernicus Marine Service will also5
be given. Lessons, perspectives and new challenges for the integrated global oceanobserving system will be finally discussed.
2 The development of satellite altimetry
Satellite altimetry is one of the most important satellite techniques for oceanography.Over the past 20 yr, it has revolutionized our vision and understanding of the ocean cir-10
culation. Satellite altimetry provides global, real time, all-weather sea surface heightsmeasurements (SSH) (sea level) at high space and time resolution. Sea level is di-rectly related to ocean circulation through the geostrophic approximation. Sea level isalso directly related to the density structure of the ocean interior and is a strong con-straint for inferring the 4-D ocean circulation through data assimilation. This explains15
the unique and fundamental role of satellite altimetry for data assimilation and opera-tional oceanography.
2.1 Principle of satellite altimetry
The altimetry measurement principle is simple (although the system is complex). Analtimeter is an active radar that sends a microwave pulse towards the ocean surface.20
Very precise on board clock measures the return time of the pulse from which the dis-tance or range between the satellite and the sea surface is derived. The range precisionis a few centimeters for a distance of 800 to 1300 km. An altimeter mission generallyincludes a bifrequency altimeter radar (usually in Ku and C or S Band) (for ionosphericcorrections), a microwave radiometer (for water vapor correction) and a tracking sys-25
1130

OSD10, 1127–1167, 2013
From satellitealtimetry to Argo and
operationaloceanography
P. Y. Le Traon
Title Page
Abstract Introduction
Conclusions References
Tables Figures
J I
J I
Back Close
Full Screen / Esc
Printer-friendly Version
Interactive Discussion
Discussion
Paper
|D
iscussionP
aper|
Discussion
Paper
|D
iscussionP
aper|
tem for precise orbit determination (Laser, GPS, Doris) that provides the orbit altituderelative to a given earth ellipsoid. The altimeter measures the distance between thesatellite and the ocean surface. Using a precise orbitography system, the position ofthe satellite relative to a reference ellipsoid is determined. The combination of thesetwo measurements yields the estimation of the sea level relative to a reference ellip-5
soid. This estimation comprises the geoid (an equipotential of the earth gravity field towhich a motionless ocean would exactly conform) and the ocean dynamic topography.The geoid has variations of up to 100 m and the ocean dynamic topography (the pa-rameter of interest here) has variations of up to 1 m. For a comprehensive descriptionof altimeter measurement principles, the reader is referred to Chelton et al. (2001).10
Altimeter missions provide along-track measurements every 7 km along repetitivetracks (e.g. every 10 days for the TOPEX/Poseidon and Jason series and 35 days forERS and ENVISAT). The distance between tracks is inversely proportional to the re-peat time period (e.g. about 315 km at the equator for TOPEX/Poseidon and 90 km forERS/ENVISAT). The satellite usually repeats over exactly the same ground track pat-15
tern every cycle. Every cycle, it thus observes the same geoid signal and the dynamictopography (which is time varying). This allows a precise estimation of the sea levelor dynamic topography anomaly even if the geoid is not known. Thanks to the recentGRACE and GOCE gravimetric missions, the geoid is now known with a precision ofa few centimeters for scales larger than 100 km. This now allows estimating much more20
precise mean dynamic topography and thus absolute dynamic topography.
2.2 Past, present and future altimeter missions
Satellite altimetry is now a very mature technique. The concept was first demonstratedwith GEOS-3 and Seasat in 1975 and 1978 respectively. GEOSAT ERM (Exact Re-peat Mission) (1986–1989) can be considered as the actual start of the altimeter era.25
It was particularly suitable for mesoscale observations due to its long duration (almost3 yr) and its 17 day repeat cycle. TOPEX/POSEIDON (T/P) (1992–2005) was, how-ever, the major breakthrough for satellite altimetry. Due to its high accuracy, it has
1131

OSD10, 1127–1167, 2013
From satellitealtimetry to Argo and
operationaloceanography
P. Y. Le Traon
Title Page
Abstract Introduction
Conclusions References
Tables Figures
J I
J I
Back Close
Full Screen / Esc
Printer-friendly Version
Interactive Discussion
Discussion
Paper
|D
iscussionP
aper|
Discussion
Paper
|D
iscussionP
aper|
provided for the first time a precise description of global mean sea level, large scalesea level and ocean circulation variations. T/P was launched in 1992 and its follow-onmissions Jason-1 and Jason-2 were launched in 2001 and 2008 respectively. ERS-1(1991–1996), ERS-2 (1995–2002) and ENVISAT (2002–2012) provided complemen-tary sampling that is needed, in particular, for ocean mesoscale variability monitoring.5
They also provided high latitude coverage. Present and future missions for the nextdecade include Cryosat-2, HY-2, Alti-Ka (SARAL), Sentinel-3, Jason-3 and Jason CS.SWOT will be the demonstration of a new concept (interferometry and SAR) with newcapabilities at very high resoution for mesoscale/submesoscale ocean observationsover a swath. Figure 1 provides a summary of existing and future altimeter missions.10
2.3 The challenge of high accuracy altimetry: the T/P breakthrough
Satellite altimetry is also one of the most complex and challenging technique in terms ofaccuracy. It requires measuring the distance between the satellite and the sea surfacewith an accuracy of a few cm; assuming a typical satellite height of 1000 km, this meansa relative accuracy of 10−8. There have been major advances in sensor and processing15
algorithm performances over the last 20 yr. It is important to realize that these advanceswere only possible through a continuous dialogue between engineers and scientists.As a result, accuracy has evolved from several meters to a few cm only (Fig. 2). Theessential role of the T/P Science Working Team (SWT) and later on of the OceanSurface Topography Science Team (OST-ST) must be emphasized here. These strong20
and committed international scientific teams were dedicated to the improvement ofaltimeter performance for science investigations.
T/P provided a major advance in accuracy. Its payload (dual frequency altimeter forionospheric corrections, three frequency radiometer and DORIS, GPS and laser track-ing for satellite orbit determination) and orbit were optimized for sea level measure-25
ments. T/P orbit was at high altitude to reduce atmospheric drag effects, thus allowinga better orbit determination; it was chosen as a non-sun synchronous orbit with a re-peat time period to reduce tidal aliasing problems and a 66◦ inclination to allow a good
1132
OSD10, 1127–1167, 2013
From satellitealtimetry to Argo and
operationaloceanography
P. Y. Le Traon
Title Page
Abstract Introduction
Conclusions References
Tables Figures
J I
J I
Back Close
Full Screen / Esc
Printer-friendly Version
Interactive Discussion
Discussion
Paper
|D
iscussionP
aper|
Discussion
Paper
|D
iscussionP
aper|
observation of the two velocity components at crossovers. T/P orbit was known with anaccuracy of about 2 cm rms and the satellite – ocean surface distance could thus bedetermined to within a few cm.
2.4 1992: a major milestone in the development of satellite altimetry
The following events that occurred 20 yr ago have had a major impact on the develop-5
ment of satellite altimetry:
– The publication of the so called “purple book” The Future of Spaceborne Altimetry:Oceans and Climate Change – a Long Term Strategy (Koblinsky et al., 1992). Thisvisionary paper paved the way for the development of satellite altimetry over thenext 20 years. Its main recommendation was for “a succession of high-accuracy10
satellite altimeter systems designed for ocean and ice observations to establishan uninterrupted time series over the global ocean and major ice sheets for atleast the subsequent 20 years”.
– The launch of TOPEX/Poseidon (T/P). T/P was optimized for large scale sea levelobservations. T/P revolutionized our vision and understanding of the ocean.15
– The start of the ERS-1 35 day repeat period mission, initializing together withTOPEX/Poseidon, a long term (20 yr) two satellite altimeter constellation. ERS-1orbit was very well suited for mesoscale circulation and the sampling was quitecomplementary to T/P.
3 Science investigations from satellite altimetry20
Over the past 20 yr, sea level and ocean circulation science investigations from satellitealtimetry have been swinging from mesoscale to large scale focuses. A brief review isgiven here.
1133
OSD10, 1127–1167, 2013
From satellitealtimetry to Argo and
operationaloceanography
P. Y. Le Traon
Title Page
Abstract Introduction
Conclusions References
Tables Figures
J I
J I
Back Close
Full Screen / Esc
Printer-friendly Version
Interactive Discussion
Discussion
Paper
|D
iscussionP
aper|
Discussion
Paper
|D
iscussionP
aper|
3.1 GEOSAT: a mission well suited for mesoscale variability studies
The 70s were often quoted as the mesoscale decade. Several major experiments werecarried out in the USA (Mode and Polymode), in Russia (Polygon) and to a lesser extentin France (Tourbillon) to investigate mesoscale dynamics. In the pre-TOPEX/Poseidonera, mesoscale variability was thus a clear research focus. The GEOSAT ERM (1986–5
1990) was particularly suitable for mesoscale investigations. These resulted in majornew findings. Many topics were covered from the almost three years of GEOSAT ERMobservations: tracking of eddies (e.g. Gordon and Haxby, 1990; Jacobs and Leben,1990), frequency/wavenumber spectra and space/time scales of variability (e.g. LeTraon et al., 1990; Stammer and Boening, 1992; Le Traon, 1991), eddy momentum10
fluxes (e.g. Tai and White, 1990; Morrow et al., 1992), model validation (e.g Wilkin andMorrow, 1994), eddy energy variations (e.g. Fu et al., 1988; Zlotnicki et al., 1989), west-ern boundary currents (e.g. Kelly and Gille, 1990; Qiu et al., 1991). These topics havebeen revisited over the following 20 yr and are still subject of intense research activities.
3.2 TOPEX/Poseidon: large scale variability is observed for the first time15
After the launch of TOPEX/Poseidon, the altimeter community mostly switched to largescale variability analysis. TOPEX/Poseidon was also a centerpiece of WOCE (Wunsch,2001), the World Ocean Circulation Experiment, which had a clear focus on the largescale ocean circulation. T/P was the first altimeter mission optimized for large scalesea level observations (e.g. Koblinsky et al., 1992). It provided for the first time a global20
description of the large scale sea level and ocean circulation variations, mean sea levelvariations and El Nino/La Nina events (see Fu and Chelton, 2001; Picaut and Busalac-chi, 2001; Cazenave and Nerem, 2004 for a review). These signals could not be orcould be barely observed with previous altimeter missions. Large scale seasonal stericsea level variations related to the heating/cooling of surface waters were the first sig-25
nals discovered by T/P. Monitoring of tropical variability and Rossby and Kelvin wavepropagation signals related to El Nino/La Nina events has been a major contribution.
1134

OSD10, 1127–1167, 2013
From satellitealtimetry to Argo and
operationaloceanography
P. Y. Le Traon
Title Page
Abstract Introduction
Conclusions References
Tables Figures
J I
J I
Back Close
Full Screen / Esc
Printer-friendly Version
Interactive Discussion
Discussion
Paper
|D
iscussionP
aper|
Discussion
Paper
|D
iscussionP
aper|
Characterization of the intra-seasonal large scale high frequency variability was alsoanother major finding of T/P. T/P also provided an invaluable contribution to the ob-servation and modeling of tidal signals. The capability of estimating global mean sealevel variations (e.g. Cazenave and Nerem, 2004) was somewhat unexpected. Due toa careful monitoring of error sources (see Ablain et al., 2009 for a recent review) and5
a continuous validation with tide gauge observations (e.g. Mitchum, 1998), the globalmean sea level variations can now be monitored from space with T/P and its succes-sors Jason-1 and Jason-2. Shown in Fig. 3 is a time series of the global mean sea levelmeasured by T/P and Jason-1 and Jason-2 from 1992 to 2012. The rate of global meansea level rise over this time period is about 3 mmyr−1. Altimetry data also provide the10
first observation of the spatial variability of the mean sea level variations (Fig. 4).
3.3 End of the 90’s: a renewed interest in mesoscale variability
In the end of the 90’s, the community interest switched back to mesoscale investiga-tions. This renewed interest was partly related to the availability of multiple altimetermissions. Over the past 10 yr, most mesoscale studies have relied on the improved15
resolution derived from the SSALTO/DUACS merged T/P (resp. Jason-1) and ERS(resp. ENVISAT) data sets. These recent studies have provided new insights on eddydynamics and their roles on ocean circulation, transport of heat and salt and couplingwith atmosphere and biology. This has allowed a much better recognition and under-standing of the role and importance of eddies. A few illustrative examples are given be-20
low. A comprehensive review is given in Le Traon and Morrow (2001), Fu et al. (2010)and Morrow and Le Traon (2012). The development of the SSALTO/DUACS mergedproducts for mesoscale variability studies is described in the next section.
The improved resolution from T/P and ERS-1/2 (and later on Jason-1 and ENVISAT)has provided a characterization of the Eddy Kinetic Energy (EKE) with a level of detail25
never before achieved at global scale (e.g. Ducet et al., 2000). It has also allows a bettercharacterization of space and time scales of mesoscale variability (e.g. Ducet et al.,2000; Jacobs et al., 2001), eddy propagation velocity (e.g. Brachet et al., 2004; Morrow
1135

OSD10, 1127–1167, 2013
From satellitealtimetry to Argo and
operationaloceanography
P. Y. Le Traon
Title Page
Abstract Introduction
Conclusions References
Tables Figures
J I
J I
Back Close
Full Screen / Esc
Printer-friendly Version
Interactive Discussion
Discussion
Paper
|D
iscussionP
aper|
Discussion
Paper
|D
iscussionP
aper|
et al., 2004; Fu, 2009; Chelton et al., 2007, 2011b), anisotropy (e.g. Ducet et al., 2000;Huang et al., 2007), skewness (e.g. Thompson and Demirov, 2006), a better descriptionof eddy/mean flow interaction (e.g. Ducet and Le Traon, 2001; Qiu and Chen, 2010)and coupling with biology (e.g. Chelton et al., 2011a). This improved description ofmesoscale variability has been extensively used to validate eddy permitting or eddy5
resolving models (e.g. Stammer et al., 1996; Brachet al., 2004; Penduff et al., 2010).Brachet et al. (2004) showed the high level of agreement between POP 1/10◦ NorthAtlantic model and altimeter observations. The spatial scales and eddy propagationvelocities were also shown to match accurately.
Ducet et al. (2000) found a good comparison between velocities derived from al-10
timeter and drifter data. Differences in EKE between altimetry and drifters were furtheranalyzed by Fratantoni (2001) who explained differences mainly by sampling issuesboth for drifters and altimetry. Sampling effects for altimetry were quantified by LeTraon and Dibarboure (2002) (see Sect. 4.6). A few years later, Maximenko and Ni-iler (2006) pointed out that part of the differences was physical due to cyclostrophic15
effects. Geostrophic velocity (slightly) underestimates (overestimates) velocity in anti-cyclonic (cyclonic) eddies. Differences in EKE are thus highly correlated with sea levelvariability skewness (Thompson and Demirov, 2006). This is an interesting result thathighlights the importance of a better understanding of observed signals. Note that al-timeter data have recently been used to diagnose errors in global drifter array velocities20
due to drogue loss (Rio et al., 2011; Grodsky et al., 2011).Merged T/P and ERS data sets have also allowed a better investigation of EKE sea-
sonal variations. A very nice illustration is given in the Qiu and Chen (2004) study. Theydetected high EKE bands in the South Pacific with well-defined annual cycles along theeastward-flowing surface currents of the South Tropical Countercurrent (STCC) and the25
South Equatorial Countercurrent (SECC). They were able to relate these variations tothe seasonal variation in the intensity of baroclinic and barotropic instabilities of thegeneral circulation.
1136
OSD10, 1127–1167, 2013
From satellitealtimetry to Argo and
operationaloceanography
P. Y. Le Traon
Title Page
Abstract Introduction
Conclusions References
Tables Figures
J I
J I
Back Close
Full Screen / Esc
Printer-friendly Version
Interactive Discussion
Discussion
Paper
|D
iscussionP
aper|
Discussion
Paper
|D
iscussionP
aper|
The availability of global merged altimeter products over a long time period and thedevelopment of eddy detection techniques have allowed a systematic tracking of in-dividual eddies. Morrow et al. (2004) found divergent pathways of cyclonic and anti-cyclonic ocean eddies in the three oceans of the Southern ocean. Chelton et al. (2007,2011b) carried out a global tracking and characterization of individual eddies. This out-5
standing analysis has contributed to a much better recognition of the importance of ed-dies. Thousands of eddies are observed in all regions of the world ocean and they canbe monitored over long time periods and long distances. The non-linear characteristicsof eddies make it clear that the dynamics of mid latitude variability is not dominated byRossby wave propagation.10
Understanding the shape of wavenumber spectra has been revisited based on im-proved data sets, very high resolution models and new theoretical developments. LeTraon et al. (2008) showed that wavenumber sea level spectral shapes in high eddy
energy regions are close to k−11/3 and thus favour an interpretation in terms of Sur-face Quasi Geostrophic (SQG) dynamics (Lapeyre and Klein, 2006). Xu and Fu (2012)15
carried out a global estimation of altimeter wavenumber spectral slopes taking into ac-count white altimeter noise. They found similar wavenumber slopes in high eddy energyregions. In low eddy energy regions, slopes are much weaker and close to k−2. This isconsistent with previous estimations based on Geosat data (e.g. Le Traon et al., 1990).Arbic et al. (2012) and Richman et al. (2012) recently pointed out the role of internal20
tides that could explain the flatter slopes.Finally, a new interesting finding from merged altimeter data sets is the ubiquitous
presence of jet-like structures in the anomalies of geostrophic velocity (Maximenkoet al., 2005, 2008). The underlying physical mechanisms are not yet fully understoodyet but are likely to be related to the development of β plumes.25
1137
OSD10, 1127–1167, 2013
From satellitealtimetry to Argo and
operationaloceanography
P. Y. Le Traon
Title Page
Abstract Introduction
Conclusions References
Tables Figures
J I
J I
Back Close
Full Screen / Esc
Printer-friendly Version
Interactive Discussion
Discussion
Paper
|D
iscussionP
aper|
Discussion
Paper
|D
iscussionP
aper|
4 History of the development of the SSALTO/DUACS merged products
Over the past 20 yr, the simultaneous availability of several altimeter missions and thedevelopment of merging techniques have offered unique capabilities to observe theocean at high resolution. Near real time high resolution global sea level anomaly mapshave been operationally produced as part of the SSALTO/DUACS system. They are5
now widely used by the oceanographic community and have contributed to a muchbetter understanding and recognition of the role and importance of mesoscale dynam-ics. Merging multiple altimeter data sets is not, however, an easy task and the develop-ment of merged products has been a long term and time consuming effort. An historicalbackground is given in the following sections.10
4.1 First step: demonstrating that T/P data could be used to improve ERS
In 1992, ERS-1 was flying simultaneously with T/P. The space/time sampling by thesetwo missions was quite complementary. The ERS-1 orbit with a 35 day repeat cyclewas well suited for mesoscale studies while the T/P orbit was optimized for large scalesignal observations. Compared to T/P, ERS-1 was a less precise altimeter mission. The15
accuracy of ERS-1 near real time orbits was, in particular, only about 30 cm rms mainlybecause of the failure of the PRARE orbit tracking system. Merging of ERS-1 and T/Pthus first required reducing the large ERS-1 orbit error. Using the more precise T/Pdata as a reference, one could improve the accuracy. Together with CLS colleagues, Istarted working on the problem in early 1994 and made a first successful demonstration20
in 1995 (Le Traon et al., 1995a, b). Through a global minimization of T/P-ERS and ERS-ERS crossover differences, we showed that ERS orbit error could be reduced to a levelcomparable to the T/P orbit error. In addition, the method allowed removal of any biasesbetween the two missions. Several ERS-1 cycles were reprocessed and corrected forusing T/P as a reference.25
1138

OSD10, 1127–1167, 2013
From satellitealtimetry to Argo and
operationaloceanography
P. Y. Le Traon
Title Page
Abstract Introduction
Conclusions References
Tables Figures
J I
J I
Back Close
Full Screen / Esc
Printer-friendly Version
Interactive Discussion
Discussion
Paper
|D
iscussionP
aper|
Discussion
Paper
|D
iscussionP
aper|
4.2 Second step: reprocessing of whole ERS time series
The next step was to convince funding agencies to reprocess the whole ERS timeseries and set up an operational multiple altimeter processing system. This was notan easy task. It was not clear who should fund such an activity. Space agencies didnot consider that the development of high level multi-mission products was part of their5
responsibilities. Several user surveys were carried out as part of the CEO (Center forEarth Observation) programme of the European Commission (the so-called pathfinderand proof of concept studies coordinated by CLS and carried out in 1995/1996). Thanksto the French Space Agency (CNES) and several European projects (e.g. AGORA,MATER, CANIGO) the merging methods were developed further (e.g. Hernandez et al.,10
1995; Ayoub et al., 1998). The whole ERS time series was reprocessed and adjustedonto T/P data (Le Traon and Ogor, 1998). The adjustment method was refined and itsformal error was derived. We demonstrated that the ERS orbit could be derived withan accuracy similar to that of T/P (“the 2 cm challenge”) (Fig. 5).
4.3 Third step: development of the global mapping technique15
The global mapping technique was developed in parallel (Le Traon et al., 1998). Themethod is a global space/time sub-optimal interpolation method (e.g. Bretherton et al.,1976) that uses an a priori knowledge of space and time scales of sea level variations(covariance). These were derived from the analysis of altimeter observations. Noisecharacterization was essential and included measurement white noise, unresolved20
(small scale) signals and correlated noise due to errors in models used to correct al-timeter observations mainly from tidal and high frequency effects due to atmosphericpressure and wind forcing. The main originality of the method was to take explicitlyinto account these correlated errors in the mapping procedure. This resulted in a majorimprovement in the mapping of eddy sea level and velocity signals (Fig. 6). The first25
global maps of T/P and ERS-1/2 data were then produced by Ducet et al. (2000).
1139
OSD10, 1127–1167, 2013
From satellitealtimetry to Argo and
operationaloceanography
P. Y. Le Traon
Title Page
Abstract Introduction
Conclusions References
Tables Figures
J I
J I
Back Close
Full Screen / Esc
Printer-friendly Version
Interactive Discussion
Discussion
Paper
|D
iscussionP
aper|
Discussion
Paper
|D
iscussionP
aper|
4.4 Fourth step: real time processing and DUACS project
The near real time processing of altimeter data was developed as part of DUACS (De-veloping Use of Altimetry for Climate Studies), a European Commission Project 3 yrproject which started in February 1997. DUACS was part-funded under the CEO Pro-gramme of the Environment and Climate programme of the European Commission and5
the Midi-Pyrenees regional council. It was coordinated by Philippe Gaspar at CLS, andgathered four of the major climate research teams in Europe: the European Centre forMedium-Range Weather Forecasts (ECMWF), the European Centre for Research andAdvanced Training in Scientific Computation (CERFACS), the UK Met. Office (UKMO)and the Max-Planck Institute fur Meteorologie (MPIFM). This was a major step forward.10
DUACS project demonstrated that altimeter data can be processed in near real timewith sufficient accuracy for operational oceanography and to help improve the skill ofclimate simulations and, more specially, seasonal climate forecasts.
4.5 Final step: the operational SSALTO/DUACS products
In 2002, DUACS was integrated in the CNES multi-satellite ground segment (SSALTO)15
processing facility. This final step allowed DUACS to move from a project to a sustainedoperational system SSALTO/DUACS. The system was then regularly improved throughdifferent R&D or operational projects (e.g. ENACT, MERSEA, MyOcean).
Thanks to SSALTO/DUACS, we now have a long time series (20 yr) of high res-olution mesoscale altimeter products based on a homogenous two satellite configu-20
ration (T/P and ERS-1/2 and Jason-1/2 and ENVISAT). These products have beenused for a wide range of science and operational applications (see previous section):mesoscale variability and global characterization of eddies, monitoring fronts in theAntarctic Circumpolar Current, multiple migrating quasi zonal jets, eddies and Rossbywaves, ocean/atmosphere coupling at the mesoscale, model validation, testing turbu-25
lence theories, coupling physics and biology, coastal dynamics, Argo and altimetry,data assimilation, operational oceanography and applications.
1140

OSD10, 1127–1167, 2013
From satellitealtimetry to Argo and
operationaloceanography
P. Y. Le Traon
Title Page
Abstract Introduction
Conclusions References
Tables Figures
J I
J I
Back Close
Full Screen / Esc
Printer-friendly Version
Interactive Discussion
Discussion
Paper
|D
iscussionP
aper|
Discussion
Paper
|D
iscussionP
aper|
SSALTO/DUACS is now the main multi-mission altimeter data center used by thescientific community and by operational oceanography and climate centers. It providesdirectly usable, high quality near real time and delayed mode global and regional al-timeter products. Main processing steps include product homogenization, data editing,orbit error correction, reduction of long wavelength errors, and production of along-track5
and mapped sea level anomalies. A mean dynamic topography (MDT) is also used toobtain absolute dynamic topographies. Several versions of MDTs were derived andthe most recent ones benefit from GRACE and GOCE observations (e.g. Rio et al.,2011). The SSALTO/DUACS weekly production moved to a daily production in 2007 toimprove timeliness of data sets and products. A new real time product was also devel-10
oped for specific real time mesoscale applications. A comprehensive recent descriptionof SSALTO/DUACS is given in Dibarboure et al. (2011).
In 2011, more than 2000 users were registered with access to the SSALTO/DUACSproducts and more than 80 publications in the international literature have used theseproducts. The use of merged altimeter products is now commonplace. This was not at15
all the case 20 yr ago and the user requirements have strongly evolved based on theavailability of products. This is one of the lessons of the SSALTO/DUACS history.
Many colleagues at CLS (engineers and scientists), Ph.D. students and post docswith different and complementary skills contributed to the development and scien-tific use of SSALTO/DUACS products. This was essential for transforming a scientific20
demonstration product into a widely used and operational product. Long term supportfrom CNES was essential.
4.6 What do multiple altimeters resolve? How many altimeters are needed?
The minimum requirement for ocean variability sampling by altimetry is that at leasttwo altimeter missions with one very precise long-term altimeter system are needed25
(e.g. Koblinsky et al., 1992). With T/P and Jason-1 and ERS and ENVISAT mis-sions, this minimum requirement has been met since 1992. Le Traon and Dibar-boure (2002) provide a summary of the mapping capabilities of the T/P+ERS (Jason-
1141

OSD10, 1127–1167, 2013
From satellitealtimetry to Argo and
operationaloceanography
P. Y. Le Traon
Title Page
Abstract Introduction
Conclusions References
Tables Figures
J I
J I
Back Close
Full Screen / Esc
Printer-friendly Version
Interactive Discussion
Discussion
Paper
|D
iscussionP
aper|
Discussion
Paper
|D
iscussionP
aper|
1+ENVISAT) configuration. Sea level can be mapped with an error of less than 10 %of the signal variance while the velocity can be mapped with an error of 20 to 40 %of the signal variance (depending on latitude). A large part of mapping errors is dueto high frequency (periods <20 days) and high wavenumbers signals (wavelengths<100–200 km). There was a stimulating debate in the early 2000s on the resolution5
capability of multiple altimeter data. This is a complex issue because the sampling isirregular in space and time and the measurement errors add a significant burden. Sev-eral theoretical studies were carried out (e.g. Wunsch, 1989; Chelton and Schlax, 1994;Greenslade et al., 1997; Le Traon and Dibarboure, 1999, 2002; Le Traon et al., 2001a;Tai, 2004, 2006). Different views were expressed. They often were related to different10
interpretations of what is meant by resolution. There is now a common agreement thatthe merging of multiple altimeter data sets (two satellites in delayed mode) resolve sealevel wavelengths longer than 200 km.
Although the T/P+ERS merged data have provided a much better representationof the mesoscale variability, it is far from fully resolving the mesoscale variability. To15
improve further our understanding of mesoscale variability, one must observe it athigher space and time resolution. From October 2002 to September 2005, samplingof the ocean has been exceptional with four altimeter missions flying simultaneously(Jason-1, ENVISAT, T/P interleaved with Jason-1 and Geosat Follow-On). These datasets were merged to improve the estimation of mesoscale surface circulation in the20
Mediterranean Sea and in the global ocean by Pascual at al. (2006, 2007). Thesestudies demonstrated that, at least three, but preferably four, altimeter missions areneeded for monitoring the mesoscale circulation. The effect is much larger for real timeapplications. Pascual et al. (2009) showed that four altimeters are needed in real timeto get a similar quality performance as two altimeters in delayed mode.25
1142

OSD10, 1127–1167, 2013
From satellitealtimetry to Argo and
operationaloceanography
P. Y. Le Traon
Title Page
Abstract Introduction
Conclusions References
Tables Figures
J I
J I
Back Close
Full Screen / Esc
Printer-friendly Version
Interactive Discussion
Discussion
Paper
|D
iscussionP
aper|
Discussion
Paper
|D
iscussionP
aper|
5 Argo
5.1 Development of Argo
Satellite altimetry is only one, albeit major, element of global ocean observing system.A major challenge in the end of the 90s was to set up a real time global in situ ob-serving system to complement satellite observations. This led to the development of5
Argo, a global array of profiling floats measuring every 10 days temperature and salin-ity throughout the deep global oceans, down to 2000 m. Argo was initially developedas a joint venture between GODAE and CLIVAR (Argo Science Team, 1998; Roem-mich et al., 1999). It has been an outstanding achievement and a second revolutionin oceanography. In November 2007, Argo reached its initial target of 3000 profiling10
floats. More than 30 countries are involved in the development and maintenance ofthe array. Argo delivers data both in real time for operational users and after carefulscientific quality control for climate change research and monitoring. The outstandingscientific leadership of Dean Roemmich, a strong international cooperation and a highlycommitted international Argo steering/science team are key elements of such a major15
success.There were stimulating discussions on the development and organisation of Argo in
its initial phase. I contributed with French colleagues on design and sampling issues atan international level (Argo Science Team and GODAE) and at national level (Coriolisand Mercator Ocean) (e.g. Guinehut et al., 2002, 2004). An important debate took20
place on the initial scope of Argo: should Argo start with a North Atlantic array orshould Argo go directly to a global array? Argo was finally developed as a global array.The value of being global has been widely demonstrated through Argo results andachievements. This was also a strong requirement given by the GODAE community(e.g. Le Traon et al., 2001b).25
1143

OSD10, 1127–1167, 2013
From satellitealtimetry to Argo and
operationaloceanography
P. Y. Le Traon
Title Page
Abstract Introduction
Conclusions References
Tables Figures
J I
J I
Back Close
Full Screen / Esc
Printer-friendly Version
Interactive Discussion
Discussion
Paper
|D
iscussionP
aper|
Discussion
Paper
|D
iscussionP
aper|
5.2 Argo achievements
Freeland (2010) provides an overview of early Argo achievements. Argo data havebeen used to better understand global sea level rise (e.g. Cazenave et al., 2009), toanalyze large scale ocean circulation variations (e.g. Roemmich et al, 2007) and deepconvection areas (e.g. Vage at al., 2009). Argo provides a major improvement in the5
estimation of heat stored by the oceans (e.g. von Schuckmann et al., 2009; Trenberth,2010; von schuckmann and Le Traon, 2011). This is crucial for a better understandingof the earth energy balance (e.g. Hansen et al., 2011). Argo data in relation to thehistorical record have also shown salinity changes that suggest an amplification of theglobal hydrological cycle (Durack and Wijffels, 2010). Argo has brought remarkable10
advances in ocean forecasting capability (e.g. Oke et al., 2009; Dombrowsky et al.,2009) (see next section) and will be critical for developing reliable seasonal to decadalclimate predictions (e.g. Balmaseda et al., 2007; Balmaseda and Anderson, 2009).About 200 papers using Argo data are published per year. Research papers oftenjointly use Argo and altimetry. Argo data are also now systematically used together with15
altimeter data for ocean analysis and forecasting. This demonstrates the very strongand unique complementarity of the two observing systems.
5.3 Synergies with altimetry
Argo has strong complementarities with satellite altimetry. Improved ocean heat stor-age derived from Argo (e.g. von Schuckmann et al., 2009; von Schuckmann and Le20
Traon, 2011) (Fig. 7) is needed for a better understanding of the mechanisms behindrising mean sea level. This is an example of the strong complementarity with altime-try (and GRACE). Guinehut et al. (2006) and Dhomps et al. (2011) have shown howbarotropic and deep steric signals at different time scales can be inferred from thecomparison of Argo and altimetry. Another interesting example of the synergetic use of25
altimeter and Argo is the use of altimeter data in Argo quality control (Guinehut et al.,2009). This quality control is now part of the operational Coriolis processing system.
1144

OSD10, 1127–1167, 2013
From satellitealtimetry to Argo and
operationaloceanography
P. Y. Le Traon
Title Page
Abstract Introduction
Conclusions References
Tables Figures
J I
J I
Back Close
Full Screen / Esc
Printer-friendly Version
Interactive Discussion
Discussion
Paper
|D
iscussionP
aper|
Discussion
Paper
|D
iscussionP
aper|
I have also been working with Stephanie Guinehut and Gilles Larnicol for the last10 yr on the development of products merging Argo and altimeter observations (Guine-hut et al., 2004, 2012). The objective was to use altimetry, satellite sea surface tem-perature (SST) and Argo observations to reconstruct 3-D mesoscale temperature andsalinity fields. Argo observations allow a global description of the statistical relation-5
ships that exist between surface and subsurface fields needed to infer the 3-D T&Sfields from altimetry and SST. Compared to the use of climatological estimates, upto 50 % of the variance of the temperature fields in the upper layers can thus be re-constructed from altimeter and sea surface temperature observations and a statisticalmethod (Guinehut et al., 2012). For salinity, only about 20 to 30 % of the upper layers10
signal can be reconstructed from satellite observations. We showed then that the jointuse of Argo, altimeter and SST observations improves further the 3-D mesoscale tem-perature and salinity fields by 20 to 30 % of the signal variance (Fig. 8). We also showedthat the joint use of Argo and altimetry provides a better reconstruction of large-scaleand low-frequency fields due to a better reduction of the aliasing of the mesoscale vari-15
ability. This was shown in a simulation study by Guinehut et al. (2004) and verified withactual data by Guinehut et al. (2012).
5.4 European contributions
Over the past couple of years, I have been involved with Ifremer and European col-leagues in the development of the Euro-Argo research infrastructure that organizes and20
federates the European contribution to Argo (www.euro-argo.eu). Euro-Argo is part ofthe European Strategy Forum on Research Infrastructures (ESFRI) roadmap. It willdevelop and progressively consolidate the European component of the global network.We set up an initial target: the European contribution should be of the order of a quarterof the global array. Specific European interest also requires an increased sampling in25
the Nordic, Mediterranean and Black Seas. Overall, this will require Europe to deployabout 250 floats per year. The objective is also to prepare the next phase of Argo inEurope with the extension to biogeochemical variables, the deep ocean, marginal seas
1145

OSD10, 1127–1167, 2013
From satellitealtimetry to Argo and
operationaloceanography
P. Y. Le Traon
Title Page
Abstract Introduction
Conclusions References
Tables Figures
J I
J I
Back Close
Full Screen / Esc
Printer-friendly Version
Interactive Discussion
Discussion
Paper
|D
iscussionP
aper|
Discussion
Paper
|D
iscussionP
aper|
and the polar seas. Euro-Argo has been designed to answer needs from ocean andclimate research and operational oceanography (GMES/Copernicus) communities. In2013, Euro-Argo will evolve into a long-term European organization and legal structure(Euro-Argo ERIC) that will be initially hosted by France. This new European legal struc-ture will allow European countries to improve their contribution to Argo. Agreements are5
at ministerial level and this will help to ensure long term sustainability. This is the firsttime a European legal entity is set up to develop the global ocean observing systemin Europe. This is a unique opportunity to consolidate the European contribution toArgo. Argo France is the French component of Euro-Argo. It is organized through themulti-agency Coriolis partnership and is now part of the Ministry of Research national10
roadmap on large research infrastructures (TGIR).
6 Operational oceanography and GODAE
There are very strong links between satellite altimetry and operational oceanography.The ability to observe the global ocean in near real time at high space and time reso-lution is a prerequisite to the development of global operational oceanography and its15
applications. In addition to providing all weather observations, sea level from satellitealtimetry is an integral of the ocean interior and provides a strong constraint on the 4-Docean state estimation. At the end of the 90s, the satellite altimetry community waskeen to develop further the use of altimetry and this required an integrated approachmerging satellite and in situ observations with models. The Global Ocean Data Assim-20
ilation Experiment (GODAE) was thus set up in 1997 (Smith and Lefebvre, 1997). Thevision was “A global system of observations, communications, modelling and assimi-lation, that will deliver regular, comprehensive information on the state of the oceans,in a way that will promote and engender wide utility and availability of this resource formaximum benefit to the community” (International GODAE Steering Team, 2000). The25
aim was to demonstrate the feasibility and utility of global ocean monitoring and fore-casting and to assist in building the infrastructure for global operational oceanography.
1146

OSD10, 1127–1167, 2013
From satellitealtimetry to Argo and
operationaloceanography
P. Y. Le Traon
Title Page
Abstract Introduction
Conclusions References
Tables Figures
J I
J I
Back Close
Full Screen / Esc
Printer-friendly Version
Interactive Discussion
Discussion
Paper
|D
iscussionP
aper|
Discussion
Paper
|D
iscussionP
aper|
6.1 GODAE development and achievements
GODAE has been a major breakthrough in oceanography. The GODAE demonstration(2002–2008) was phased with the Jason-1 and ENVISAT altimeter missions. GODAEhas had a major impact on the development of global operational oceanography capa-bilities (Bell et al., 2009). It was instrumental in the development of Argo and GHRSST5
(GODAE High Resolution Sea Surface Temperature) (GODAE pilot projects), altime-try and in situ data processing systems (e.g. SSALTO/DUACS and Coriolis). Globalmodeling and data assimilation systems were progressively developed, implementedand inter-compared. In-situ and remote sensing data have been routinely assimilatedin global and regional ocean models to provide an integrated description of the ocean10
state. Products and services were developed for a wide range of applications: marineenvironment monitoring, weather forecasting, seasonal and climate prediction, oceanresearch, maritime safety and pollution forecasting, national security, the oil and gasindustry, fisheries management and coastal and shelf-sea forecasting (see GODAEOceanography Magazine Special Issue – Bell et al., 2009).15
6.2 The role of observations
Ocean analysis and forecasting models are strongly dependent on the availability ofmultiple altimeter data and Argo observations. High resolution altimetry is mandatoryto constrain the mesoscale circulation. Three to four altimeters at least are required(see also discussion above). Model resolutions are typically 1/12◦ and 1/36◦ at global20
and regional scales respectively. This poses even stronger requirements for the al-timeter constellation. Argo and the global in situ observing system are mandatory toconstrain large scale temperature and salinity fields that are poorly constrained bysatellite observations. Although Argo does not resolve the mesoscale, the joint use ofArgo and altimetry through effective data assimilation techniques can provide a good25
representation of mesoscale temperature and salinity fields (see also Sect. 5.3). Thiswas initially anticipated (e.g. Le Traon et al., 2001b) and was demonstrated as part
1147
OSD10, 1127–1167, 2013
From satellitealtimetry to Argo and
operationaloceanography
P. Y. Le Traon
Title Page
Abstract Introduction
Conclusions References
Tables Figures
J I
J I
Back Close
Full Screen / Esc
Printer-friendly Version
Interactive Discussion
Discussion
Paper
|D
iscussionP
aper|
Discussion
Paper
|D
iscussionP
aper|
of GODAE. The capability of Argo to complement altimeter observations to constrainboth large scale and mesoscale ocean fields through data assimilation is a major assetand explains why these two observing systems now provide the backbone of the globalobservations for operational oceanography. A review of the role of altimeter and Argoobservation data to constrain global ocean models is given by Oke et al. (2009). A con-5
tinuous assessment of the impact of Argo and altimeter observations is now organizedat international level through GODAE OceanView.
6.3 French and European contributions
The French contribution to GODAE was developed in early 1996 with the developmentof the Mercator modelling and data assimilation center, the in situ component with the10
multi-agency Coriolis structure and with the satellite component with CNES leadershipin the development of the Jason series. Strong links with the research community wereorganized from the start. This was an essential ingredient for developing state of theart modelling and data assimilation systems and to ensure that operational oceanog-raphy systems are also designed to answer present and future research needs. The15
development of a coastal operational oceanography prototype system (Previmer) wasstarted in a second phase in 2005.
In Europe, the MERSEA project allowed us to develop further the integration of Eu-ropean contributions to GODAE (Johannessen et al., 2006). This led to the develop-ment of the GMES/Copernicus Marine Service which is a major initiative to set up20
a sustained capability to observe and forecast the global ocean and European re-gional seas. Strong links were developed with EuroGOOS, in particular, to develop theupstream in situ observing system infrastructure and national downstream capabilities(e.g. coastal). The past 20 yr have thus seen the development of a well structured oper-ational oceanography community at European level (science, observations, modelling25
and applications) from global, regional and coastal scales.
1148

OSD10, 1127–1167, 2013
From satellitealtimetry to Argo and
operationaloceanography
P. Y. Le Traon
Title Page
Abstract Introduction
Conclusions References
Tables Figures
J I
J I
Back Close
Full Screen / Esc
Printer-friendly Version
Interactive Discussion
Discussion
Paper
|D
iscussionP
aper|
Discussion
Paper
|D
iscussionP
aper|
6.4 The role of the International GODAE Steering Team
GODAE started thanks to the leadership and initial vision of Neville Smith and MichelLefebvre. The role of the International GODAE Steering Team has then been central.It was formed in 1997 and took the responsibility for the development of GODAE underthe responsibility of Neville Smith. From 2005 to 2008, I co-chaired the IGST together5
with Mike Bell. Many scientists have served as members and contributed greatly tothe success of GODAE. There was an excellent “spirit” and willingness to share dataand products, expertise and experience (GODAE common). The team was supportedby the GODAE Patrons (sponsors) and an active project office. Several symposia andsummer schools were organized. At the end of GODAE in 2008 after the GODAE fi-10
nal symposium in Nice, it was decided to move towards a long term program: GODAEOceanView which is now led by a new Science Team co-chaired by Andreas Schillerand Eric Dombrowsky. GODAE OceanView now ensures a long term international co-ordination of operational oceanography and its evolution in relationship with JCOMMand GOOS.15
7 Conclusions and perspectives
The 1992–2012 time period represents 20 yr of outstanding achievements in oceanog-raphy: satellite altimetry, Argo, global operational oceanography and GODAE. This hashad a major impact on oceanography. This was also the birth of a new community.These three major successes were closely linked and did not happen by chance. They20
resulted from an initial vision of the long-term evolution of oceanography building onprevious achievements such as WOCE (World Ocean Circulation Experiment). Thishas been a well thought out and planned approach for the joint development of satel-lite, global in situ observations and modeling capabilities.
Several important lessons can be learnt from these successes. A long term vision25
shared with the wider community and the ability to work together for a common cause
1149

OSD10, 1127–1167, 2013
From satellitealtimetry to Argo and
operationaloceanography
P. Y. Le Traon
Title Page
Abstract Introduction
Conclusions References
Tables Figures
J I
J I
Back Close
Full Screen / Esc
Printer-friendly Version
Interactive Discussion
Discussion
Paper
|D
iscussionP
aper|
Discussion
Paper
|D
iscussionP
aper|
with a shared sense of purpose and achievement are essential. The importance ofinternational collaboration and, in particular, the specific role of strong and committedinternational science teams such as T/P SWT and OST-ST, Argo and GODAE must beemphasized. Synergies between fundamental and applied research, technology andapplications are other important ingredients; this requires working with people with5
different and complementary skills. Continuity of infrastructure (observing systems,modeling and data assimilation) and, just as important, continuity of qualified teamsis critical. This requires long term (>10 yr) support and high level advocacy in national,European and international agencies.
Many challenges remain. Consolidating/sustaining the global ocean observing sys-10
tem is still a concern. There is still need to optimize and improve (better space/timesampling) the altimeter constellation. The altimetry community now has a much betterunderstanding and recognition of the value of multiple altimeters. Operational oceanog-raphy now uses high to very high resolution models with data assimilation. This posesmuch stronger requirements for an altimeter constellation. Today, we are almost fac-15
ing similar challenges as 20 yr ago and the altimeter constellation is not significantlyimproved. Observation capabilities lag behind. It is critical to ensure a long term op-timized high resolution operational altimeter system for the next decade. Success ofthe development of GMES/Copernicus in Europe with the advent of Sentinel-3 mis-sions and the development of the Jason-CS series (continuation of the Jason-1-2-320
series) is thus essential. We also need to maintain our collective expertise and effortson instrument development, quality monitoring, intercalibration and the developmentof high level products. Sustaining Argo and the global in situ ocean observing sys-tem is needed in parallel. The first priority is to consolidate the contribution to theArgo core mission (global temperature and salinity measurements down to 2000 m)25
(Roemmich et al., 2009). This is critical to fully realize the unique and enormous po-tential of Argo. The European contribution should be significantly improved and thisis the expectation from the Euro Argo research infrastructure. There is also a needto ensure the consolidation and evolution of operational oceanography services (e.g.
1150

OSD10, 1127–1167, 2013
From satellitealtimetry to Argo and
operationaloceanography
P. Y. Le Traon
Title Page
Abstract Introduction
Conclusions References
Tables Figures
J I
J I
Back Close
Full Screen / Esc
Printer-friendly Version
Interactive Discussion
Discussion
Paper
|D
iscussionP
aper|
Discussion
Paper
|D
iscussionP
aper|
GODAE OceanView, GMES/Copernicus Marine Service). This requires consolidatingour modelling/assimilation capabilities and ensuring a continuous and state of the artR&D program.
There are also a series of new scientific challenges. The very high resolution andsubmesoscale dynamics is a new scientific frontier. The future SWOT mission should5
allow us to address the observational component. Other components must be devel-oped in parallel: the development of very high resolution modeling (1 km at the globalscale) and new theoretical frameworks for a better understanding of submesoscale dy-namics, vertical motions and their role for the coupling between physics and biology.It is also critical to prepare the main evolutions of Argo for the next decade: biogeo-10
chemical observations, deeper measurements, under ice operations in the polar seasand sampling of marginal seas. All of these evolutions are essential to improve ourknowledge of the role of the ocean on climate. They are also required for operationaloceanography. Operational oceanography finally needs to move its focus from physicsto ecosystems (further integration) and from large scale to coastal scale both for ob-15
servations, modeling, data assimilation and services. This calls for new internationaland European initiatives.
Acknowledgements. I feel very much honored to receive the prestigious Nansen medal. I con-sider it as recognition for a truly collective work, in particular, of the satellite altimetry community.Thanks to many outstanding colleagues and friends at CLS, CNES, Ifremer, Mercator Ocean20
and in the T/P and OST, Argo and GODAE international science teams. A particular thank tothe whole CLS Space Oceanography Division where I truly enjoyed 20 yr of common adventure.
References
Ablain, M., Cazenave, A., Valladeau, G., and Guinehut, S.: A new assessment of the errorbudget of global mean sea level rate estimated by satellite altimetry over 1993–2008, Ocean25
Sci., 5, 193–201, doi:10.5194/os-5-193-2009, 2009.
1151

OSD10, 1127–1167, 2013
From satellitealtimetry to Argo and
operationaloceanography
P. Y. Le Traon
Title Page
Abstract Introduction
Conclusions References
Tables Figures
J I
J I
Back Close
Full Screen / Esc
Printer-friendly Version
Interactive Discussion
Discussion
Paper
|D
iscussionP
aper|
Discussion
Paper
|D
iscussionP
aper|
Arbic, B. K., Richman, J. G., Shriver, J. F., Timko, P. G., Metzger, E. J., and Wallcraft, A. J.:Global modeling of internal tides within an eddying ocean general circulation model,Oceanography 25, 20–29, 2012.
Argo Science Team: On the Design and implementation of argo: an initial plan for a global arrayof profiling floats, International CLIVAR Project Office Report Number 2, GODAE Report No.5
5, GODAE International Project Office, Melbourne, Australia, 1998.Ayoub, N., Le Traon, P. Y., and De Mey, P.: Combining ERS-1 and TOPEX/Poseidon data to
observe the variable oceanic circulation in the Mediterranean sea, J. Marine Syst., 18, 3–40,1998.
Balmaseda, M. and Anderson, D.: Impact of initialization strategies and observations on sea-10
sonal forecast skill, Geophys. Res. Lett., 36, L01701, doi:10.1029/2008GL035561, 2009.Balmaseda, M., Anderson, D., and Vidard, A.: Impact of Argo on analyses of the global ocean,
Geophys. Res. Lett., 34, L16605, doi:10.1029/2007GL030452, 2007.Bell, M. J., Lefebvre, M., Le Traon, P. Y., Smith, N., and Wilmer-Becker, K.: The global ocean
data assimilation experiment, Oceanography, 22, 14–21, 2009.15
Brachet, S., Le Traon, P. Y., and Le Provost, C.: Mesoscale variability from a high-resolutionmodel and from altimeter data in the North Atlantic Ocean, J. Geophys. Res., 109, C12025,doi:10.1029/2004JC002360, 2004.
Bretherton, F. P., Davis, R. E., and Fandry, C. B.: A technique for objective analysis and designof oceanographic experiment applied to MODE-73, Deep-Sea Res., 23, 559–582, 1976.20
Cazenave, A. and Nerem, R. S.: Present-day sea level change: observations and causes, Rev.Geophys., 42, RG3001, doi:10.1029/2003RG000139, 2004.
Cazenave, A., Dominh, K., Guinehut, S., Berthier, E., Llovel, W., Ramillien, G., Ablain, M., andLarnicol, G.: Sea level budget over 2003–2008: a reevaluation from GRACE space gravime-try, satellite altimetry and Argo, Global Planet. Change, 65, 83–88, 2009.25
Chelton, M. G. and Schlax, D. B.: The resolution capability of an irregularly sampled dataset:with application to Geosat altimeter data, J. Atmos. Ocean. Tech., 11, 534–550, 1994.
Chelton, D. B., Ries, J. C., Haines, B. J., Fu, L. L., and Callahan, P. S.: Satellite Altimetry, in:Satellite Altimetry and Earth Sciences, edited by: Fu, L. L. and Cazenave, A., AcademicPress, 2001.30
Chelton, D. B., Schlax, M. G., Samelson, R. M., and de Szoeke, R. A.: Global observations oflarge oceanic eddies, Geophys. Res. Lett., 34, L15606, doi:10.1029/2007GL030812, 2007.
1152

OSD10, 1127–1167, 2013
From satellitealtimetry to Argo and
operationaloceanography
P. Y. Le Traon
Title Page
Abstract Introduction
Conclusions References
Tables Figures
J I
J I
Back Close
Full Screen / Esc
Printer-friendly Version
Interactive Discussion
Discussion
Paper
|D
iscussionP
aper|
Discussion
Paper
|D
iscussionP
aper|
Chelton, D. B., Gaube, P., Schlax, M. G., Early, J. J., and Samelson, R. M.: The influence ofnonlinear mesoscale eddies on near-surface chlorophyll, Science, 334, 328–332, 2011a.
Chelton, D. B., Schlax, M. G., and Samelson, R. M.: Global observations of nonlinearmesoscale eddies, Prog. Oceanogr., 91, 167–216, 2011b.
Dhomps, A. -L., Guinehut, S., Le Traon, P.-Y., and Larnicol, G.: A global comparison of Argo and5
satellite altimetry observations, Ocean Sci., 7, 175–183, doi:10.5194/os-7-175-2011, 2011.Dibarboure, G., Pujol, I. M., Briol, F., Le Traon, P.-Y., Larnicol, G., Picot, N., Mertz, F., and
Ablain, M.: Jason-2 in DUACS: updated system description, first tandem results and impacton processing and products, Mar. Geod., 34, 214–241 2011.
Dombrowsky, E., Bertino, L., Brassington, G. B., Chassignet, E. P., Davidson, F., Hurlburt, H. E.,10
Kamachi, M., Lee, T., Martin, M. J., Mei, S., and Tonani, M.: GODAE systems in operation,Oceanography, 22, 80–95, 2009.
Ducet, N. and Le Traon, P.-Y.: A comparison of surface eddy kinetic energy andReynolds stresses in the Gulf Stream and the Kuroshio Current systems from mergedTOPEX/Poseidon and ERS-1/2 altimetric data, J. Geophys. Res., 106, 16603–16622, 2001.15
Ducet, N., Le Traonc, P. Y., and Reverdin, G.: Global high resolution mapping of ocean cir-culation from the combination of TOPEX/Poseidon and ERS-1/2, J. Geophys. Res., 105,19477–19498, 2000.
Durack, P. J. and Wijffels, S. E.: Fifty-year trends in global ocean salinities and their relationshipto broad-scale warming, J. Climate, 23, 4342–4362, 2010.20
Fratantoni, D. M.: North Atlantic surface circulation during the 1990’s observed with satellite-tracked drifters, J. Geophys. Res., 106, 22067–22093, 2001.
Freeland, H. J., Roemmich, D., Garzoli, S. L., Le Traon, P.-Y., Ravichandran, M., Riser, S.,Thierry, V., Wijffels, S., Belbeoch, M., Gould, J., Grant, F., Ignazewski, M., King, B., Klein, B.,Mork, K. A., Owens, B., Pouliquen, S., Sterl, A., Suga, T., Suk, M.-S., Sutton, P., Troisi, A.,25
Velez-Belchi, P. J., and Xu, J.: Argo – a decade of progress, in: Proceedings of OceanObs’09:Sustained Ocean Observations and Information for Society, Vol. 2, edited by: Hall, J., Harri-son, D. E., and Stammer, D., Venice, Italy, 21–25 September 2009, ESA Publication WPP-306, 2010.
Fu, L.-L.: Pattern and velocity of propagation of the global ocean eddy variability, J. Geophys.30
Res., 114, C11017, doi:10.1029/2009JC005349, 2009.
1153

OSD10, 1127–1167, 2013
From satellitealtimetry to Argo and
operationaloceanography
P. Y. Le Traon
Title Page
Abstract Introduction
Conclusions References
Tables Figures
J I
J I
Back Close
Full Screen / Esc
Printer-friendly Version
Interactive Discussion
Discussion
Paper
|D
iscussionP
aper|
Discussion
Paper
|D
iscussionP
aper|
Fu, L.-L. and Chelton, D. B.: Large-scale ocean circulation, in: Satellite Altimetry and Earth Sci-ences: a Handbook for Techniques and Applications, edited by: Fu, L.-L. and Cazenave, A.,Academic Press, San Diego, 423, 133–16, 2001.
Fu, L.-L., Chelton, D. B., and Zlotnicki, V.: Satellite altimetry: Observing ocean variability fromspace, Oceanography, 1, 4, doi:10.5670/oceanog.1988.01, 1988.5
Fu, L.-L., Chelton, D. B., Le Traon, P. Y., and Morrow, R.: Eddy dynamics from satellite altimetry,Oceanography, 23, 14–25, 2010.
Gordon, A. L. and Haxby, W. F.: Agulhas eddies invade the south Atlantic: evidence fromGEOSAT altimeter and shipboard conductivity temperature-depth survey, J. Geophys. Res.95, 3117–3125, 1990.10
Greenslade, D. J. M., Chelton, D., and Schlax, M.: The midlatitude resolution capability of sealevel fields constructed from single and multiple satellite altimeter datasets, J. Atmos. Ocean.Tech., 14, 849–870, 1997.
Grodsky, S., Lumpkin, R., and Carton, J.: Spurious trends in global surface drifter currents,Geophys. Res. Lett., 38, L10606, doi:10.1029/2011GL047393, 2011.15
Guinehut, S., Larnicol, G., and Le Traon, P. Y.: Design of an array of profiling floats in the NorthAtlantic from model simulations, J. Marine Syst., 35, 1–9, 2002.
Guinehut, S., Le Traon, P. Y., Larnicol, G., and Philipps, S.: Combining Argo and remote-sensingdata to estimate the ocean three-dimensional temperature fields – a first approach based onsimulated observations, J. Marine Syst., 46, 85–98, 2004.20
Guinehut, S., Le Traon, P. Y., and Larnicol, G.: What can we learn fromglobal altimetry/hydrography comparisons? Geophys. Res. Lett., 33, L10604,doi:10.1029/2005GL025551, 2006.
Guinehut, S., Coatanoan, C., Dhomps, A. L., Le Traon, P. Y., and Larnicol, G.: On the use ofsatellite altimeter data in Argo quality control, J. Atmos. Ocean. Tech., 26, 395–402, 2009.25
Guinehut, S., Dhomps, A.-L., Larnicol, G., and Le Traon, P.-Y.: High resolution 3-D temperatureand salinity fields derived from in situ and satellite observations, Ocean Sci., 8, 845–857,doi:10.5194/os-8-845-2012, 2012.
Hansen, J., Sato, M., Kharecha, P., and von Schuckmann, K.: Earth’s energy imbalance and im-plications, Atmos. Chem. Phys., 11, 13421–13449, doi:10.5194/acp-11-13421-2011, 2011.30
Hernandez, F., Le Traon, P. Y., and Morrow, R.: Mapping mesoscale variability of the Azorescurrent using TOPEX/POSEIDON and ERS-1 altimetry, together with hydrographic and La-grangian measurements, J. Geophys. Res., 100, 24995–25006, 1995.
1154

OSD10, 1127–1167, 2013
From satellitealtimetry to Argo and
operationaloceanography
P. Y. Le Traon
Title Page
Abstract Introduction
Conclusions References
Tables Figures
J I
J I
Back Close
Full Screen / Esc
Printer-friendly Version
Interactive Discussion
Discussion
Paper
|D
iscussionP
aper|
Discussion
Paper
|D
iscussionP
aper|
Huang, H.-P., Kaplan, A., Curchitser, E. N., and Maximenko, N. A.: The degree of anisotropy formid-ocean currents from satellite observations and an eddy-resolving model simulation, J.Geophys. Res., 112, C09005, doi:10.1029/2007JC004105, 2007.
International GODAE Steering Team: The Global Ocean Data Assimilation Experiment Strate-gic Plan, GODAE Report No. 6, December, 2000.5
Jacobs, G. A. and Leben, R. R.: Loop current eddy shedding estimated using GEOSAT altimeterdata, Geophys. Res. Lett., 17, 2385–2388, 1990.
Jacobs, G. A., Barron, C. N., and Rhodes, R. C.: Mesoscale characteristics, J. Geophys. Res.,106, 19581–19595, 2001.
Johannessen, J. A., Le Traon, P.-Y., Robinson, I., Nittis, K., Bell, M. J., Pinardi, N., and10
Bahurel, P.: Marine Environment and Security for the European Area Toward OperationalOceanography, BAMS, 1081–1090, 2006.
Kelly, K. A. and Gille, S. T.: Gulf stream surface transport and statistics at 69◦ W from theGEOSAT altimeter, J. Geophys. Res., 95, 3149–3161, 1990.
Koblinsky, C., Gaspar, P., and Lagerloef, G. (Eds): The Future of Spaceborne Altimetry –15
Oceans and Climate Change: a Long-Term Strategy, Joint Oceanographic Institutions, Inc.,85 pp., 1992.
Lapeyre, G. and Klein, P.: Dynamics of the upper oceanic layers in terms of surface quasi-geostrophy theory, J. Phys. Oceanogr., 36, 165–176, 2006.
Le Traon, P. Y.: Time scales of mesoscale variability and their relationship with spatial scales in20
the North Atlantic, J. Mar. Res., 49, 467–492, 1991.Le Traon, P. Y. and Dibarboure, G.: Mesoscale mapping capabilities of multiple-satellite altime-
ter missions, J. Atmos. Ocean. Tech., 16, 1208–1223, 1999.Le Traon, P.-Y. and Dibarboure, G.: Velocity mapping capabilities of present and future altimeter
missions: the role of high frequency signals, J. Atmos. Ocean. Tech., 19, 2077–2088, 2002.25
Le Traon, P.-Y. and Morrow, R.: Ocean currents and eddies, in: Satellite Altimetry and Earth Sci-ences: a Handbook for Techniques and Applications, edited by: Fu, L.-L. and Cazenave, A.,Academic Press, San Diego, 171–210, 2001.
Le Traon, P. Y. and Ogor, F.: ERS-1/2 orbit improvement using T/P: the 2 cm challenge, J.Geophys. Res., 103, 8045–8057, 1998.30
Le Traon, P. Y., Rouquet, M. C., and Boissier, C.: Spatial scales of mesoscale variability in theNorth Atlantic as deduced from GEOSAT data, J. Geophys. Res., 95, 20267–20285, 1990.
1155

OSD10, 1127–1167, 2013
From satellitealtimetry to Argo and
operationaloceanography
P. Y. Le Traon
Title Page
Abstract Introduction
Conclusions References
Tables Figures
J I
J I
Back Close
Full Screen / Esc
Printer-friendly Version
Interactive Discussion
Discussion
Paper
|D
iscussionP
aper|
Discussion
Paper
|D
iscussionP
aper|
Le Traon, P. Y., Gaspar, P., Bouyssel, F., and Makhmaraa, H.: Using Topex/Poseidon data toenhance ERS-1 data, J. Atmos. Ocean. Tech., 12, 161–170, 1995a.
Le Traon, P. Y., Gaspar, P., Ogor, F., and Dorandeu, J.: Satellites work in tandem to improveaccuracy of data, EOS, T. Am. Geophys. Un., 76, 385–389, 1995b.
Le Traon, P. Y., Nadal, F., and Ducet, N.: An improved mapping method of multisatellite altimeter5
data, J. Atmos. Ocean. Tech., 15, 522–533, 1998.Le Traon, P. Y., Dibarboure, G., and Ducet, N.: Use of a high-resolution model to analyze the
mapping capabilities of multiple-altimeter missions, J. Atmos. Ocean. Tech., 18, 1277–1288,2001a.
Le Traon, P. Y., Rienecker, M., Smith, N., Bahurel, P., Bell, M., Hurlburt, H., and Dandin, P.:10
Operational oceanography and prediction – a GODAE perspective, in: Observing the Oceansin the 21st Century, edited by: Koblinsky,C. J. and Smith, N. R., available at: http://archimer.ifremer.fr/doc/00090/20096/, 2001b.
Le Traon, P. Y., Klein, P., Hua, B. L., and Dibarboure, G.: Do altimeter data agree with interioror surface quasi-geostrophic theory?, J. Phys. Oceanogr., 38, 1137–1142, 2008.15
Maximenko, N. A. and Niiler, P. P.: Mean surface circulation of the global ocean inferred fromsatellite altimeter and drifter data, in: 15 years of Progress in Radar Altimetry, ESA Publica-tion SP-614, 2006.
Maximenko, N. A., Bang, B., and Sasaki, H.: Observational evidence of alternating zonal jets inthe World Ocean, Geophys. Res. Lett., 32, L12607, doi:10.1029/2005GL022728, 2005.20
Maximenko, N. A., Melnichenko, O. V., Niiler, P. P., and Sasaki, H.: Stationary mesoscale jet-likefeatures in the ocean, Geophys. Res. Lett., 35, L08603, doi:10.1029/2008GL033267, 2008.
Mitchum, G. T.: Monitoring the stability of satellite altimeters with tide gauges, J. Atmos. Ocean.Tech., 15, 721–730, 1998.
Morrow, R. and Le Traon, P. Y.: Recent advances in observing mesoscale ocean dynamics with25
satellite altimetry, Adv. Space Res., 50, 1062–1076, 2012.Morrow, R. A., Church, J. A., Coleman, R., Chelton, D. B., and White, N.: Eddy momentum
flux and its contribution to the Southern Ocean momentum balance, Naturem 357, 482–484,1992.
Morrow, R., Birol, F., Griffin, D., and Sudre, J.: Divergent pathways of anticyclonic and cyclonic30
eddies, Geophys. Res. Lett., 31, L24311, doi:10.1029/2004GL020974, 2004.
1156
OSD10, 1127–1167, 2013
From satellitealtimetry to Argo and
operationaloceanography
P. Y. Le Traon
Title Page
Abstract Introduction
Conclusions References
Tables Figures
J I
J I
Back Close
Full Screen / Esc
Printer-friendly Version
Interactive Discussion
Discussion
Paper
|D
iscussionP
aper|
Discussion
Paper
|D
iscussionP
aper|
Oke, P. R., Balmaseda, M. A., Benkiran, M., Cummings, J. A., Fujii, Y., Guinehut, S., Larni-col, G., Le Traon, P. Y., Martin, M. J., and Dombrowsky, E.: Observing system evaluationsusing GODAE systems, Oceanography, 22, 144–153, 2009.
Pascual, A., Faugere, Y., Larnicol, G., and Le Traon, P. Y.: Improved description of the oceanmesoscale variability by combining four satellite altimeters, Geophys. Res. Lett., 33, L02611,5
doi:10.1029/2005GL024633, 2006.Pascual, A., Pujol, M. I., Larnicol, G., Le Traon, P. Y., and Rio, M. H.: Mesoscale mapping ca-
pabilities of multi-satellite Altimeter missions: first results with real data in the MediterraneanSea, J. Marine Syst., 65, 190–21, 2007.
Pascual, A., Boone, C., Larnicol, G., and Le Traon, P. Y.: On the quality of real-time altimeter10
gridded fields: comparison with in situ data, J. Atmos. Ocean. Tech., 26, 556–569, 2009.Penduff, T., Juza, M., Brodeau, L., Smith, G. C., Barnier, B., Molines, J.-M., Treguier, A.-M., and
Madec, G.: Impact of global ocean model resolution on sea-level variability with emphasison interannual time scales, Ocean Sci., 6, 269–284, doi:10.5194/os-6-269-2010, 2010.
Picaut, J. and Busalacchi, A. J.: Tropical ocean variability, in: Satellite Altimetry and Earth Sci-15
ences, a Handbook of Techniques and Applications, edited by: Fu, L.-L. and Cazenave, A.,Academic Press, 217–236, 2001.
Qiu, B. and Chen, S.: Seasonal modulations in the eddy field of the South Pacific Ocean, J.Phys. Oceanogr., 34, 1515–1527, 2004.
Qiu, B. and Chen, S.: Eddy-mean flow interaction in the decadally-modulating Kuroshio Exten-20
sion system, Deep-Sea Res. Pt. II, 57, 1098–1110, 2010.Qiu, B., Kelly, K. A., and Joyce, T. M.: Mean flow and variability in the Kuroshio Extension from
GEOSAT altimetry data, J. Geophys. Res., 96, 18491–18507, 1991.Richman, J. G., Arbic, B. K., Shriver, J. F., Metzger, E. J., and Wallcraft, A. J.: Inferring dynamics
from the wavenumber spectra of an eddying global ocean model with embedded tides, J.25
Geophys. Res., 117, C12012, doi:10.1029/2012JC008364, 2012.Rio, M. H., Guinehut, S., and Larnicol, G.: New CNES-CLS09 global mean dynamic topography
computed from the combination of GRACE data, altimetry, and in situ measurements, J.Geophys. Res., 116, C07018, doi:10.1029/2010JC006505, 2011.
Roemmich, D. Boebel, O., Desaubies, Y., Freeland, H., King, B., Le Traon, P. Y., Molinari, R.,30
Owens, W. B., Riser, S., Send, U., Takeuchi, K., and Wijffels, W.: Argo, the global array ofprofiling floats, in: OceanObs99: International Conference on the Ocean Observing Systemfor Climate, 18–22 October 1999, Saint-Raphael, France, 1999.
1157

OSD10, 1127–1167, 2013
From satellitealtimetry to Argo and
operationaloceanography
P. Y. Le Traon
Title Page
Abstract Introduction
Conclusions References
Tables Figures
J I
J I
Back Close
Full Screen / Esc
Printer-friendly Version
Interactive Discussion
Discussion
Paper
|D
iscussionP
aper|
Discussion
Paper
|D
iscussionP
aper|
Roemmich, D., Gilson, J., Davis, R., Sutton, P., Wijffels, S., and Riser, S.: Decadal spinup of theSouth Pacific subtropical gyre, J. Phys. Oceanogr., 37, 162–173, 2007.
Roemmich, D., Belbeoch, M., Belchi, P. J. V., Freeland, H., Gould, W. J., Grant, F., Ig-naszewski, M., King, B., Klein, B., Mork, K. A., Owens, W. B., Pouliquen, S., Ravichan-dran, M., Riser, S., Sterl, A., Suga, T., Suk, M.-S., Sutton, P., Thierry, V., Le Traon, P.-Y.,5
Wijffels, S., and Xu, J.: Argo: the challenge of continuing 10 years of progress, Oceanogra-phy, 22, 46–55, 2009.
Smith, N. and Lefebvre, M.: The Global Ocean Data Assimilation Experiment (GODAE), in:Monitoring the Oceans in the 2000s: an Integrated Approach, International Symposium, Biar-ritz, 15–17 October, 1997.10
Stammer, D. and Boning, C. W.: Mesoscale variability in the Atlantic ocean from GEOSATaltimetry and Woce high resolution numerical modelling, J. Phys. Oceanogr. 22, 732–752,1992.
Stammer, D., Tokmakian, R., Semtner, A., and Wunsch, C.: How well does a 1/4◦ global oceancirculation model simulate large scale oceanic observations, J. Geophys. Res., 101, 25779–15
25811, 1996.Tai, C. K.: The Resolving power of a single exact-repeat Altimetric satellite or a coordinated
constellation of satellites, J. Atmos. Ocean. Techn., 21, 810–818, 2004.Tai, C. K.: Aliasing of sea level sampled by a single exact-repeat Altimetric satellite or a co-
ordinated constellation of satellites: analytic aliasing formulas, J. Atmos. Ocean. Tech., 23,20
252–267, 2006.Tai, C.-T. and White, W. B.: Eddy variability in the Kuroshio extension as revealed by Geosat
altimetry, energy propagation away from the jet, Reynolds stress, and seasonal cycle, J.Phys. Oceanogr., 20, 1761–1777, 1990.
Thompson, E. and Demirov, K. R.: Skewness of sea level variability of the world’s oceans, J.25
Geophys. Res., 111, C05005, doi:10.1029/2004JC002839, 2006.Trenberth, K. E.: The ocean is warming, isn’t it?, Nature, 465, 304–304, 2010.Vage, K., Pickart, R. S., Thierry, V., Reverdin, G., Lee, C. M., Petrie, B., Agnew, T. A., Wong, A.,
and Ribergaard, M. H.: Surprising return of deep convection to the subpolar North AtlanticOcean in winter 2007–2008, Nat. Geosci., 2, 67–72, 2009.30
von Schuckmann, K. and Le Traon, P.-Y.: How well can we derive Global Ocean Indicators fromArgo data?, Ocean Sci., 7, 783–791, doi:10.5194/os-7-783-2011, 2011.
1158

OSD10, 1127–1167, 2013
From satellitealtimetry to Argo and
operationaloceanography
P. Y. Le Traon
Title Page
Abstract Introduction
Conclusions References
Tables Figures
J I
J I
Back Close
Full Screen / Esc
Printer-friendly Version
Interactive Discussion
Discussion
Paper
|D
iscussionP
aper|
Discussion
Paper
|D
iscussionP
aper|
von Schuckmann, K., Gaillard, F., and Le Traon, P. Y.: Global hydrographic variability patternsduring 2003–2008, J. Geophys. Res., 114, doi:10.1029/2008JC005237, 2009.
Wilkin, J. L. and Morrow, R. A.: Eddy kinetic energy and momentum flux in the Southern Ocean:comparison of a global eddy-resolving model with altimeter, drifter, and current-meter data, J.Geophys. Res., 99, 7903–7916, 1994.5
Wunsch, C.: Sampling characteristics of satellite orbits, J. Atmos. Ocean. Tech., 6, 891–907,1989.
Wunsch, C.: Global problems and global observations, in: Ocean Circulation and Climate, Ob-serving and Modelling the Global Ocean, edited by: Siedler, G., Church, J., and Gould, J.,Academic, San Diego, 47–80, 2001.10
Xu, Y. and Fu, L. L.: The effects of altimeter instrument noise on the estimation of the wavenum-ber spectrum of sea surface height, J. Phys. Oceanogr., 42, 2229–2233, 2012.
Zlotnicki, V., Fu, L.-L., and Patzert, W.: Seasonal variability in a global sea level observed withGEOSAT altimetry, J. Geophys. Res., 94, 17959–17969, 1989.
15
1159

OSD10, 1127–1167, 2013
From satellitealtimetry to Argo and
operationaloceanography
P. Y. Le Traon
Title Page
Abstract Introduction
Conclusions References
Tables Figures
J I
J I
Back Close
Full Screen / Esc
Printer-friendly Version
Interactive Discussion
Discussion
Paper
|D
iscussionP
aper|
Discussion
Paper
|D
iscussionP
aper|
33
1
2
3
4
5
6
Figure 1 7
8
9
Figure 2 10
11
Fig. 1. Past, present and future altimeter missions (Courtesy G. Dibarboure).
1160
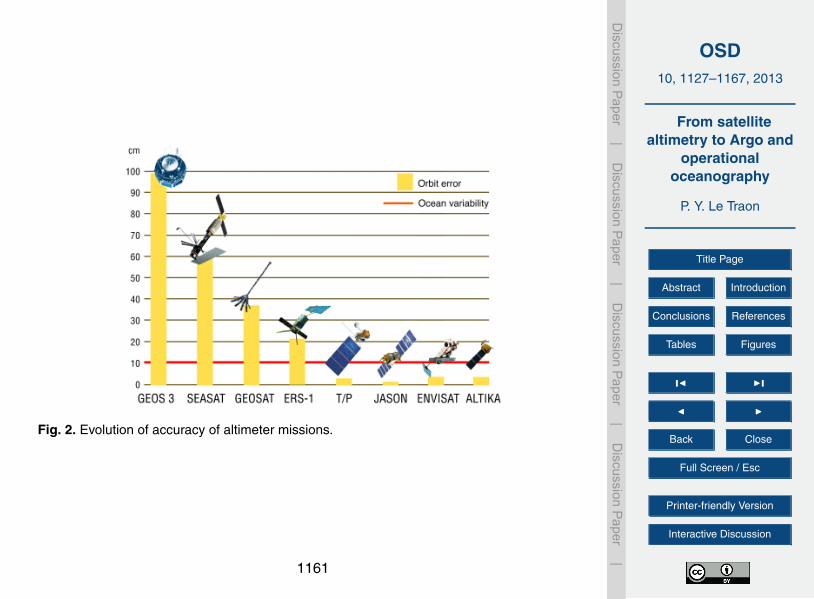
OSD10, 1127–1167, 2013
From satellitealtimetry to Argo and
operationaloceanography
P. Y. Le Traon
Title Page
Abstract Introduction
Conclusions References
Tables Figures
J I
J I
Back Close
Full Screen / Esc
Printer-friendly Version
Interactive Discussion
Discussion
Paper
|D
iscussionP
aper|
Discussion
Paper
|D
iscussionP
aper|
33
1
2
3
4
5
6
Figure 1 7
8
9
Figure 2 10
11
Fig. 2. Evolution of accuracy of altimeter missions.
1161

OSD10, 1127–1167, 2013
From satellitealtimetry to Argo and
operationaloceanography
P. Y. Le Traon
Title Page
Abstract Introduction
Conclusions References
Tables Figures
J I
J I
Back Close
Full Screen / Esc
Printer-friendly Version
Interactive Discussion
Discussion
Paper
|D
iscussionP
aper|
Discussion
Paper
|D
iscussionP
aper|
34
1
Figure 3 2
3
4
Figure 4 5
6
Fig. 3. Mean sea level variations over the 1992–2012 time period. The rise in mean sealevel has been estimated as 3.17 mmyr−1. Analysing the uncertainty of each altimetry cor-rection made for calculating the GMSL, as well as a comparison with tide gauges gives anerror in the GMSL slope of approximately 0.6 mmyr−1 with a 90 % confidence interval (CreditsCLS/CNES/LEGOS).
1162

OSD10, 1127–1167, 2013
From satellitealtimetry to Argo and
operationaloceanography
P. Y. Le Traon
Title Page
Abstract Introduction
Conclusions References
Tables Figures
J I
J I
Back Close
Full Screen / Esc
Printer-friendly Version
Interactive Discussion
Discussion
Paper
|D
iscussionP
aper|
Discussion
Paper
|D
iscussionP
aper|
34
1
Figure 3 2
3
4
Figure 4 5
6
Fig. 4. Regional variations of mean sea level variations over the 1992–2012 time period (inmm yr−1). This map is obtained using multi-mission SSALTO/DUACS gridded fields, which en-able the local slopes to be estimated with a high resolution (Credits CLS/CNES/LEGOS).
1163

OSD10, 1127–1167, 2013
From satellitealtimetry to Argo and
operationaloceanography
P. Y. Le Traon
Title Page
Abstract Introduction
Conclusions References
Tables Figures
J I
J I
Back Close
Full Screen / Esc
Printer-friendly Version
Interactive Discussion
Discussion
Paper
|D
iscussionP
aper|
Discussion
Paper
|D
iscussionP
aper|
35
1
2
3
4
5
6
7
8
9
10
11
12
13
14
15
16
17
18
19
20
21
22
23
Figure 5 24
25
ERS adjusted onto T/P
ERS
T/P
Fig. 5. ERS orbit error reduction using TOPEX/Poseidon as a reference. The impact of thecorrection is shown on a map of Sea Level Anomaly derived from ERS observations at a givenday without (upper figure) and with (middle figure) the correction. This can be compared tothe map derived from TOPEX/Poseidon observations (bottom figure) (from Le Traon and Ogor,1998).
1164

OSD10, 1127–1167, 2013
From satellitealtimetry to Argo and
operationaloceanography
P. Y. Le Traon
Title Page
Abstract Introduction
Conclusions References
Tables Figures
J I
J I
Back Close
Full Screen / Esc
Printer-friendly Version
Interactive Discussion
Discussion
Paper
|D
iscussionP
aper|
Discussion
Paper
|D
iscussionP
aper|
36
1
2
3
4
5
6
7
8
9
10
11
12
13
14
15
16
17
18
19
20
21
22
Figure 6 23
24
Fig. 6. Map of sea level anomaly derived from ERS-1 (right), T/P (middle) and T/P+ERS-1(left) with a conventional mapping technique (upper panel) and a mapping technique that takesinto account long wavelength (correlated) errors (middle panel). Differences between maps areshown in the lower panel (from Le Traon et al., 1998).
1165

OSD10, 1127–1167, 2013
From satellitealtimetry to Argo and
operationaloceanography
P. Y. Le Traon
Title Page
Abstract Introduction
Conclusions References
Tables Figures
J I
J I
Back Close
Full Screen / Esc
Printer-friendly Version
Interactive Discussion
Discussion
Paper
|D
iscussionP
aper|
Discussion
Paper
|D
iscussionP
aper|
37
1
Figure 7 2
3
4
5
Argo observations Synthetic T : from alti and SST
Combined T (Argo, alti, SST) Argo alone
6
7
Figure 8 8
Fig. 7. Global ocean heat content and mean steric sea level variations derived from Argo data(2005–2010) (from von Schuckmann and Le Traon, 2011).
1166

OSD10, 1127–1167, 2013
From satellitealtimetry to Argo and
operationaloceanography
P. Y. Le Traon
Title Page
Abstract Introduction
Conclusions References
Tables Figures
J I
J I
Back Close
Full Screen / Esc
Printer-friendly Version
Interactive Discussion
Discussion
Paper
|D
iscussionP
aper|
Discussion
Paper
|D
iscussionP
aper|
37
1
Figure 7 2
3
4
5
Argo observations Synthetic T : from alti and SST
Combined T (Argo, alti, SST) Argo alone
6
7
Figure 8 8
Fig. 8. Temperature field at 200 m at a given day derived from SST and altimeter observations(upper right), Argo observations alone (lower right) and combined Argo, altimeter and SSTobservations (lower left). Argo observations are shown on the upper left panel (from Guinehutet al., 2012).
1167


![PARFAIT: GNSS-R coastal altimetry - arXiv · 2003 Workshop on Oceanography with GNSS Reflections 3 lapse.This is the essential measurement for altimetry [26]. In order to collect](https://img.dokumen.tips/doc/110x75/5b5238ad7f8b9a056a8d14ad/parfait-gnss-r-coastal-altimetry-arxiv-2003-workshop-on-oceanography-with.jpg)